Association between Urinary Levels of Aflatoxin and Consumption of Food Linked to Maize or Cow Milk or Dairy Products


 , , , , and
Abstract
:1. Introduction
2. Materials and Methods
2.1. Setting
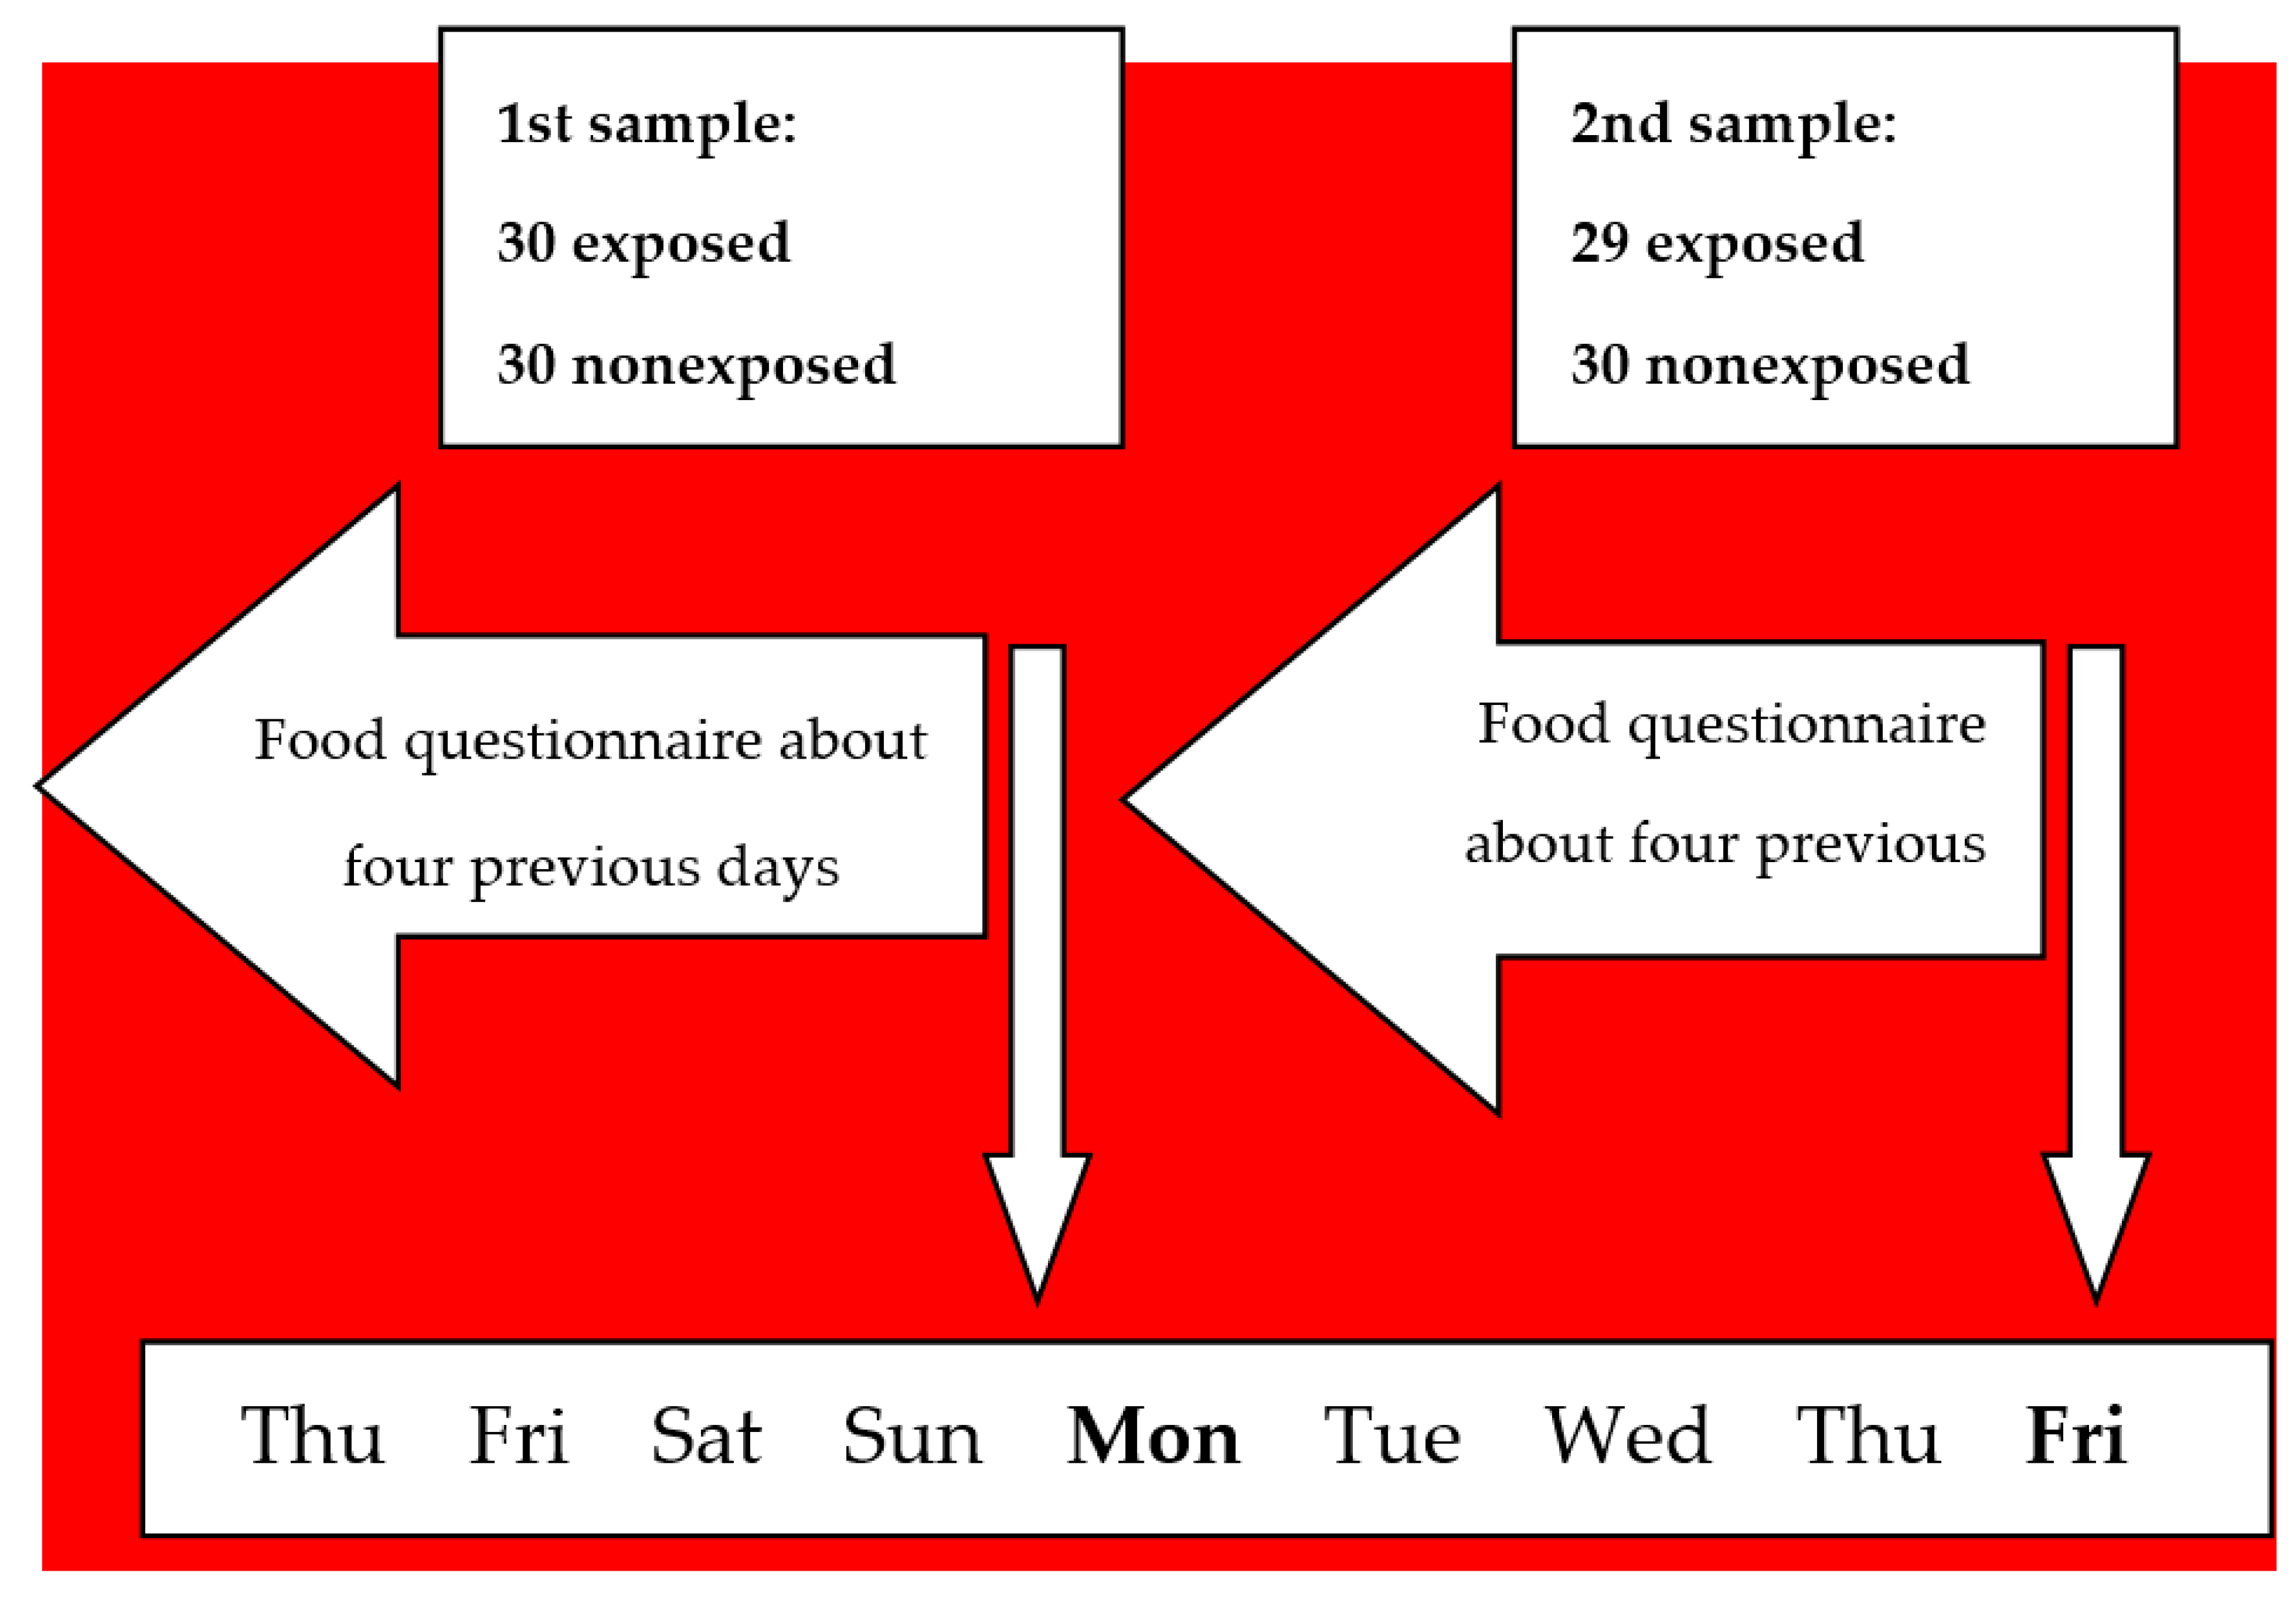
2.2. Study Design
2.3. Urine and Blood Samples Collection and Analysis
2.4. Food Questionnaire
2.5. Data Analysis
3. Results
4. Discussion
5. Conclusions
Supplementary Materials
Author Contributions
Funding
Acknowledgments
Conflicts of Interest
References
- Alshannaq, A.; Yu, J.H. Occurrence, Toxicity, and Analysis of Major Mycotoxins in Food. Int. J. Environ. Res. Public Health 2017, 14, 632. [Google Scholar] [CrossRef] [PubMed] [Green Version]
- International Agency for Research on Cancer. Chemical Agents and Related Occupations; IARC Press: Lyon, France, 2012; pp. 225–248. [Google Scholar]
- International Agency for Research on Cancer. Chemical agents and related occupations. In Some Traditional Herbal Medicines, some Mycotoxins, Naphthalene and Styrene; Monograph 100f, 225-248; World Health Organization: Lyon, France, 2010. [Google Scholar]
- Hsieh, D.P.H.A.W.; Wong, J.J. The Toxicology of Aflatoxins, 1st ed.; Elsevier: New York, NY, USA, 1993; pp. 73–88. [Google Scholar]
- Stubblefield, R.D.; Pier, A.C.; Richard, J.L.; Shotwell, O.L. Fate of aflatoxins in tissues, fluids, and excrements from cows dosed orally with aflatoxin B1. Am. J. Vet. Res. 1983, 44, 1750–1752. [Google Scholar] [PubMed]
- COMMISSION REGULATION (EC). Setting Maximum Levels for Certain Contaminants in Foodstuffs. 2006. Available online: http://eur-lex.europa.eu/legalcontent/EN/TXT/PDF/?uri=CELEX:02006R1881-20140701&from=EN (accessed on 11 December 2019).
- Groopman, J.D.; Hall, A.J.; Whittle, H.; Hudson, G.J.; Wogan, G.N.; Montesano, R.; Wild, C.P. Molecular dosimetry of aflatoxin-N7-guanine in human urine obtained in The Gambia, West Africa. Cancer Epidemiol. Biomarkers Prev. 1992, 1, 221–227. [Google Scholar]
- Jager, A.V.; Tonin, V.F.G.; Baptista, G.Z.; Souto, P.C.M.C.; Oliveira, C.A.F. Assessment of aflatoxin exposure using serum and urinary biomarkers in São Paulo, Brazil: A pilot study. Int. J. Hyg. Environ. Health 2016, 219, 294–300. [Google Scholar] [CrossRef] [PubMed]
- Leong, Y.H.; Latiff, A.A.; Ahmad, N.I.; Rosma, A. Exposure measurement of aflatoxins and aflatoxin metabolites in human body fluids. A short review. Mycotoxin Res. 2012, 28, 79–87. [Google Scholar] [CrossRef]
- Mykkänen, H.; Zhu, H.; Salminen, E.; Juvonen, R.O.; Ling, W.; Ma, J.; Polychronaki, N.; Kemiläinen, H.; Mykkänen, O.; Salminen, S.; et al. Fecal and urinary excretion of aflatoxin B1 metabolites (AFQ1, AFM1 and AFB-N7-guanine) in young Chinese males. Int. J. Cancer 2005, 115, 879–884. [Google Scholar] [CrossRef]
- Benkerroum, N. Chronic and Acute Toxicities of Aflatoxins: Mechanisms of Action. Int. J. Environ. Res. Public Health 2020, 17, 423. [Google Scholar] [CrossRef] [Green Version]
- Battilani, P.; Toscano, P.; Van der Fels-Klerx, H.J.; Moretti, A.; Camardo Leggieri, M.; Brera, C.; Rortais, A.; Goumperis, T.; Robinson, T. Aflatoxin B1 contamination in maize in Europe increases due to climate change. Sci. Rep. 2016, 6, 24328. [Google Scholar] [CrossRef] [Green Version]
- Fusi, A.; Scalvenzi, A.A.; Bolzoni, L.B.G. DOSSIER/QUALITÀ DEL LATTE L’aflatossina M1 nel latte. Aflatossina/2: La Fase di Allerta non Può Dirsi Conclusa. s.l.: Edagricole. 2013. Available online: http://www.izsler.it/izs_bs/allegati/415/aflatossineIZ_2013_09.pdf (accessed on 26 August 2014).
- Ferri, F.; Brera, C.; De Santis, B.; Fedrizzi, G.; Bacci, T.; Bedogni, L.; Capanni, S.; Collini, G.; Crespi, E.; Debegnach, F.; et al. Survey on Urinary Levels of Aflatoxins in Professionally Exposed Workers. Toxins 2017, 9, 117. [Google Scholar] [CrossRef] [Green Version]
- Gerding, J.; Cramer, B.; Humpf, H. Determination of mycotoxin exposure in Germany using an LC-MS/MS multibiomarker approach. Mycotoxin Res. 2014, 58, 2358–2368. [Google Scholar] [CrossRef]
- Heyndrickx, E.; Sioen, I.; Huybrechts, B.; Callebaut, A.; De Henauw, S.; De Saeger, S. Human biomonitoring of multiple mycotoxins in the Belgian population: Results of the BIOMYCO study. Environ. Int. 2015, 84, 82–89. [Google Scholar] [CrossRef] [PubMed]
- Solfrizzo, M.; Gambacorta, L.; Visconti, A. Assessment of multi-mycotoxin exposure in southern Italy by urinary multi-biomarker determination. Toxins 2014, 6, 523–538. [Google Scholar] [CrossRef] [PubMed]
- Brewer, J.; Thrasher, J.; Straus, D.; Madison, R.; Hooper, D.; Brewer, J.H.; Thrasher, J.D.; Straus, D.C.; Madison, R.A.; Hooper, D. Detection of Mycotoxins in Patients with Chronic Fatigue Syndrome. Toxins 2013, 5, 605–617. [Google Scholar] [CrossRef] [PubMed] [Green Version]
- Hooper, D.; Bolton, V.; Guilford, F.; Straus, D. Mycotoxin Detection in Human Samples from Patients Exposed to Environmental Molds. Int. J. Mol. Sci. 2009, 10, 1465–1475. [Google Scholar] [CrossRef] [PubMed]
- Jager, A.V.; Tonin, F.G.; Souto, P.C.M.C.; Privatti, R.T.; Oliveira, C.A. Determination of urinary biomarkers for assessment of short-term human exposure to aflatoxins in São Paulo, Brazil. Toxins 2014, 6, 1996–2007. [Google Scholar] [CrossRef] [Green Version]
- Johnson, N.M.; Qian, G.; Xu, L.; Tietze, D.; Marroquin-Cardona, A.; Robinson, A.; Rodriguez, M.; Kaufman, L.; Cunningham, K.; Wittmer, J.; et al. Aflatoxin and PAH exposure biomarkers in a U.S. population with a high incidence of hepatocellular carcinoma. Sci. Total Environ. 2010, 408, 6027–6031. [Google Scholar] [CrossRef] [Green Version]
- De Cássia Romero, A.; Ferreira, T.R.; dos Santos Dias, C.T.; Calori-Domingues, M.A.; da Gloria, E.M. Occurrence of AFM1 in urine samples of a Brazilian population and association with food consumption. Food Control 2010, 21, 554–558. [Google Scholar] [CrossRef]
- Ali, N.; Blaszkewicz, M.; Hossain, K.; Degen, G.H. Determination of aflatoxin M1in urine samples indicates frequent dietary exposure to aflatoxin B1 in the Bangladeshi population. Int. J. Hyg. Environ. Health 2017, 220, 271–281. [Google Scholar] [CrossRef]
- Ali, N.; Hossain, K.; Blaszkewicz, M.; Rahman, M.; Mohanto, N.C.; Alim, A.; Degen, G.H. Occurrence of aflatoxin M1in urines from rural and urban adult cohorts in Bangladesh. Arch. Toxicol. 2016, 90, 1749–1755. [Google Scholar] [CrossRef]
- Gerding, J.; Ali, N.; Schwartzbord, J.; Cramer, B.; Brown, D.L.; Degen, G.H.; Humpf, H.U. A comparative study of the human urinary mycotoxin excretion patterns in Bangladesh, Germany, and Haiti using a rapid and sensitive LC-MS/MS approach. Mycotoxin Res. 2015, 31, 127–136. [Google Scholar] [CrossRef]
- Kouadio, J.H.; Lattanzio, V.M.T.; Ouattara, D.; Kouakou, B.; Visconti, A. Assessment of Mycotoxin Exposure in Côte d’ivoire (Ivory Coast) Through Multi-Biomarker Analysis and Possible Correlation with Food Consumption Patterns. Toxicol. Int. 2014, 21, 248–257. [Google Scholar] [CrossRef] [PubMed] [Green Version]
- Lei, Y.; Fang, L.; Akash, M.S.H.; Rehman, K.; Liu, Z.; Shi, W.; Chen, S. Estimation of urinary concentration of aflatoxin M1 in Chinese pregnant women. J. Food Sci. 2013, 78, 1835–1838. [Google Scholar] [CrossRef] [PubMed]
- Smith, L.E.; Mbuya, M.N.N.; Prendergast, A.J.; Turner, P.C.; Ruboko, S.; Humphrey, J.H.; Nelson, J.R.; Chigumira, A.; Kembo, G.; Stoltzfus, R.J. Determinants of recent aflatoxin exposure among pregnant women in rural Zimbabwe. Mol. Nutr. Food Res. 2017, 61, 1601049. [Google Scholar] [CrossRef] [PubMed]
- Wu, H.C.; Wang, Q.; Yang, H.I.; Ahsan, H.; Tsai, W.Y.; Wang, L.Y.; Chen, S.Y.; Chen, C.J.; Santella, R.M. Aflatoxin B1 exposure, hepatitis B virus infection, and hepatocellular carcinoma in Taiwan. Cancer Epidemiol. Prev. Biomarkers 2009, 18, 846–853. [Google Scholar] [CrossRef] [PubMed] [Green Version]
- Coulombe, R.A., Jr.; Sharma, R.P. Clearance and excretion of intratracheally and orally administered aflatoxin B1 in the rat. Food Chem. Toxicol. 1985, 23, 827–830. [Google Scholar] [CrossRef]
- Jolly, P.; Jiang, Y.; Ellis, W.; Awuah, R.; Nnedu, O.; Phillips, T.; Wang, J.S.; Afriyie-Gyawu, E.; Tang, L.; Person, S.; et al. Determinants of aflatoxin levels in Ghanaians: Sociodemographic factors, knowledge of aflatoxin and food handling and consumption practices. Int. J. Hyg. Environ. Health 2006, 209, 345–358. [Google Scholar] [CrossRef] [PubMed]
- Mohd Redzwan, S.; Rosita, J.; Mohd Sokhini, A.M.; Nurul Aqilah, A.R. Association between aflatoxin M1 excreted in human urine samples with the consumption of milk and dairy products. Bull. Environ. Contam. Toxicol. 2012, 89, 1115–1119. [Google Scholar] [CrossRef] [PubMed]


| Foods | Consumers | Non-Consumers | |||||||
|---|---|---|---|---|---|---|---|---|---|
| n | n (%) of Samples Positive | Mean (ng/mL) | Min–Max (ng/mL) | n | n (%) of Samples Positive | Mean (ng/mL) | Min–Max (ng/mL) | p-Value # | |
| Corn flour-based products | |||||||||
| Biscuits *** | 3 | 2 (66.7) | 0.014 | 0.013–0.014 | 115 | 85 (73.9) | 0.043 | 0.002–0.399 | - |
| Cakes *** | 1 | 0 (-) | - | - | 117 | 87 (74.4) | 0.042 | 0.002–0.399 | - |
| Corn cereals *** | 6 | 3 (50.0) | 0.022 | 0.006–0.047 | 112 | 82 (73.2) | 0.043 | 0.002–0.399 | 0.214 |
| Popcorn *** | 3 | 1 (33.3) | 0.01 | 0.01–0.01 | 115 | 86 (74.8) | 0.043 | 0.002–0.399 | - |
| Polenta (cooked or fried) *** | 9 | 7 (77.8) | 0.047 | 0.008–0.088 | 109 | 80 (73.4) | 0.034 | 0.002–0.399 | 0.387 |
| Other *** | 4 | 2 (50.0) | 0.025 | 0.007–0.043 | 114 | 85 (74.6) | 0.043 | 0.002–0.399 | - |
| Any corn flour-based products *** | 21 | 13 (61.9) | 0.026 | 0.006–0.088 | 97 | 74 (76.3) | 0.045 | 0.002–0.399 | 0.299 |
| Fresh milk | |||||||||
| Milk distributed by a coin machine *** (^) | 1 | 0 (-) | - | - | 117 | 87 (74.4) | 0.042 | 0.002–0.399 | - |
| Fresh milk from a supermarket ** (^^) | 24 | 19 (79.2) | 0.032 | 0.002–0.161 | 94 | 68 (72.3) | 0.045 | 0.004–0.399 | 0.528 |
| Fresh cheese ** | 65 | 53 (81.5) | 0.037 | 0.002–0.399 | 53 | 34 (64.2) | 0.050 | 0.003–0.180 | 0.606 |
| Aged cheese ** | 92 | 64 (69.6) | 0.048 | 0.002–0.399 | 26 | 23 (88.5) | 0.025 | 0.003–0.110 | 0.553 |
| Fish | |||||||||
| Fish * | 57 | 46 (80.7) | 0.042 | 0.002–0.399 | 61 | 41 (67.2) | 0.0425 | 0.004–0.259 | 0.409 |
| Shellfish * | 26 | 20 (76.9) | 0.025 | 0.003–0.113 | 92 | 67 (72.8) | 0.0474 | 0.002–0.399 | 0.829 |
| Fresh fruit | |||||||||
| Bananas * | 59 | 45 (76.3) | 0.032 | 0.002–0.161 | 59 | 42 (71.2) | 0.053 | 0.003–0.399 | 0.585 |
| Pears * | 37 | 30 (81.1) | 0.039 | 0.004–0.161 | 81 | 57 (70.4) | 0.044 | 0.002–0.399 | 0.361 |
| Apples * | 84 | 62 (73.8) | 0.040 | 0.002–0.18 | 34 | 25 (73.5) | 0.048 | 0.003–0.399 | 0.619 |
| Kiwis * | 31 | 23 (74.2) | 0.023 | 0.003–0.157 | 87 | 64 (73.6) | 0.049 | 0.002–0.399 | 0.179 |
| Citrus fruits * | 82 | 59 (72.0) | 0.038 | 0.003–0.399 | 36 | 28 (77.8) | 0.052 | 0.002–0.259 | 0.096 |
| Other * | 24 | 18 (75.0) | 0.025 | 0.004–0.116 | 94 | 69 (73.4) | 0.047 | 0.002–0.399 | 0.352 |
| Meat | |||||||||
| Liver (pork/bovine) *** | 0 | - | - | - | 118 | 87 (73.7) | 0.042 | 0.002–0.399 | - |
| Beef * | 97 | 74 (76.3) | 0.044 | 0.003–0.399 | 21 | 13 (61.9) | 0.031 | 0.002–0.110 | 0.127 |
| Chicken * | 80 | 55 (68.8) | 0.047 | 0.003–0.399 | 38 | 32 (84.2) | 0.034 | 0.002–0.259 | 0.771 |
| Cereals or cereal-based products | |||||||||
| Bread ** | 105 | 75 (71.4) | 0.044 | 0.002–0.399 | 13 | 12 (92.3) | 0.032 | 0.003–0.157 | 0.504 |
| Pasta ** | 112 | 83 (74.1) | 0.042 | 0.002–0.399 | 6 | 4 (66.7) | 0.051 | 0.005–0.157 | 0.643 |
| Grain soups ** | 14 | 10 (71.4) | 0.032 | 0.003–0.113 | 104 | 77 (74.0) | 0.044 | 0.002–0.399 | 0.671 |
| Muesli ** | 9 | 5 (55.6) | 0.009 | 0.007–0.016 | 109 | 82 (75.2) | 0.044 | 0.002–0.399 | 0.058 |
| Other cereals ** | 61 | 43 (70.5) | 0.034 | 0.003–0.161 | 57 | 44 (77.2) | 0.050 | 0.002–0.399 | 0.509 |
| Biscuits and rusks ** | 83 | 61 (73.5) | 0.046 | 0.002–0.399 | 35 | 26 (74.3) | 0.033 | 0.003–0.113 | 0.842 |
| Snack cakes ** | 50 | 41 (82.0) | 0.048 | 0.003–0.399 | 68 | 46 (67.6) | 0.038 | 0.002–0.259 | 0.103 |
| Cakes ** | 5 | 4 (80.0) | 0.019 | 0.006–0.047 | 113 | 83 (73.5) | 0.043 | 0.002–0.399 | 0.850 |
| Other cereals (pieces) ** | 17 | 14 (82.4) | 0.048 | 0.007–0.259 | 101 | 73 (72.3) | 0.041 | 0.002–0.399 | 0.339 |
| Rice-based or rice-flour based products | |||||||||
| Rice ** | 48 | 34 (70.8) | 0.041 | 0.004–0.259 | 70 | 53 (75.7) | 0.043 | 0.002–0.399 | 0.625 |
| Rice pasta ** | 0 | - | - | - | 118 | 87 (73.7) | 0.042 | 0.002–0.399 | - |
| Other ** | 0 | - | - | - | 118 | 87 (73.7) | 0.042 | 0.002–0.399 | - |
| Biscuits ** | 3 | 1 (33.3) | 0.015 | 0.015–0.015 | 115 | 86 (74.8) | 0.043 | 0.002–0.399 | - |
| Cakes ** | 7 | 2 (28.6) | 0.015 | 0.013–0.017 | 111 | 85 (76.6) | 0.043 | 0.002–0.399 | 0.027 |
| Puffed rice ** | 7 | 5 (71.4) | 0.041 | 0.005–0.116 | 111 | 82 (73.9) | 0.042 | 0.002–0.399 | 0.950 |
| Other ** | 2 | 2 (100.0) | 0.124 | 0.087–0.161 | 116 | 85 (73.3) | 0.040 | 0.002–0.399 | - |
| Spices | |||||||||
| Pepper *** | 25 | 18 (72.0) | 0.043 | 0.003–0.259 | 93 | 69 (74.2) | 0.042 | 0.002–0.399 | 0.325 |
| Ginger *** | 3 | 2 (66.7) | 0.048 | 0.007–0.088 | 115 | 85 (73.9) | 0.042 | 0.002–0.399 | - |
| Nutmeg *** | 1 | 1 (100.0) | 0.008 | 0.008–0.008 | 117 | 45 (38.5) | 0.036 | 0.002–0.259 | - |
| Chili pepper *** | 46 | 31 (67.4) | 0.040 | 0.003–0.259 | 72 | 56 (77.8) | 0.044 | 0.002–0.399 | 0.172 |
| Other *** | 4 | 4 (100.0) | 0.083 | 0.004–0.259 | 114 | 83 (72.8) | 0.040 | 0.002–0.399 | - |
| Nuts | |||||||||
| Peanuts *** | 21 | 17 (81.0) | 0.036 | 0.003–0.116 | 97 | 70 (72.2) | 0.044 | 0.002–0.399 | 0.420 |
| Pistachios *** | 8 | 5 (62.5) | 0.034 | 0.006–0.116 | 110 | 82 (74.5) | 0.043 | 0.002–0.399 | 0.585 |
| Nuts *** | 15 | 12 (80.0) | 0.0358 | 0.003–0.113 | 103 | 75 (72.8) | 0.0433 | 0.002–0.399 | 0.654 |
| Almonds *** | 11 | 8 (72.7) | 0.029 | 0.004–0.096 | 107 | 79 (73.8) | 0.044 | 0.002–0.399 | 0.463 |
| Other *** | 6 | 4 (66.7) | 0.029 | 0.006–0.096 | 112 | 83 (74.1) | 0.043 | 0.002–0.399 | 0.422 |
| Dried fruit | |||||||||
| Dried figs *** | 0 | - | - | - | 118 | 87 (73.7) | 0.042 | 0.002–0.399 | - |
| Dried prunes *** | 3 | 2 (66.7) | 0.012 | 0.009–0.014 | 115 | 85 (73.9) | 0.043 | 0.002–0.399 | - |
| Dried apricots *** | 1 | 1 (100.0) | 0.007 | 0.007–0.007 | 117 | 86 (73.5) | 0.0427 | 0.002–0.399 | - |
| Dates *** | 3 | 1 (33.3) | 0.008 | 0.008–0.008 | 115 | 86 (74.8) | 0.043 | 0.002–0.399 | - |
| Other *** | 2 | 1 (50.0) | 0.007 | 0.007–0.007 | 116 | 86 (74.1) | 0.043 | 0.002–0.399 | - |
| Foods | Never | Time since Last Consumption (h) | Association between Urine AFM1 Levels and Food Consumption Time | Association between Urine AFM1 Levels and Combination of Food Quantity and Time | ||||||
|---|---|---|---|---|---|---|---|---|---|---|
| 0–24 | 024–48 | 0≥48 | Coefficient | 95% CI | Coefficient | 95% CI | ||||
| Corn flour-based products | ||||||||||
| Corn cereals *** | 112 | 5 | 1 | 0 | −0.021 | −0.037 | −0.005 | −0.066 | −0.112 | −0.021 |
| Polenta (cooked or fried) *** | 109 | 2 | 2 | 4 | −0.006 | −0.033 | 0.021 | −0.018 | −0.113 | 0.077 |
| Any corn flour-based products *** | 97 | 12 | 4 | 5 | −0.020 | −0.036 | −0.005 | −0.036 | −0.067 | −0.006 |
| Fresh milk | ||||||||||
| Fresh milk from a supermarket ** (^) | 94 | 23 | 1 | 0 | −0.007 | −0.028 | 0.014 | −0.022 | −0.079 | 0.036 |
| Fresh cheese ** | 53 | 35 | 18 | 12 | 0.004 | −0.026 | 0.033 | 0.009 | −0.074 | 0.093 |
| Aged cheese ** | 26 | 66 | 15 | 11 | 0.008 | −0.010 | 0.026 | 0.015 | −0.034 | 0.065 |
| Fish | ||||||||||
| Fish * | 61 | 22 | 21 | 14 | −0.003 | −0.024 | 0.018 | 0.011 | −0.043 | 0.064 |
| Shellfish * | 92 | 8 | 10 | 8 | −0.016 | −0.044 | 0.012 | −0.059 | −0.130 | 0.013 |
| Fresh fruit | ||||||||||
| Bananas * | 59 | 45 | 8 | 6 | −0.012 | −0.033 | 0.010 | −0.046 | −0.133 | 0.040 |
| Pears * | 81 | 28 | 7 | 2 | −0.004 | −0.024 | 0.015 | −0.013 | −0.082 | 0.056 |
| Apples * | 34 | 63 | 12 | 9 | −0.015 | −0.043 | 0.013 | −0.043 | −0.117 | 0.030 |
| Kiwis * | 87 | 24 | 2 | 5 | −0.020 | −0.039 | −0.002 | −0.074 | −0.133 | −0.015 |
| Citrus fruits * | 36 | 66 | 9 | 7 | −0.010 | −0.032 | 0.012 | −0.026 | −0.085 | 0.032 |
| Other * | 94 | 18 | 4 | 2 | −0.015 | −0.036 | 0.005 | −0.037 | −0.073 | −0.002 |
| Meat | ||||||||||
| Beef * | 21 | 46 | 33 | 18 | 0.034 | 0.007 | 0.061 | 0.021 | −0.010 | 0.053 |
| Chicken * | 38 | 31 | 16 | 33 | 0.002 | −0.023 | 0.026 | −0.013 | −0.070 | 0.044 |
| Cereals or cereal-based products | ||||||||||
| Bread ** | 13 | 93 | 9 | 3 | −0.002 | −0.031 | 0.027 | 0.004 | −0.056 | 0.064 |
| Pasta ** | 6 | 87 | 19 | 6 | −0.025 | −0.065 | 0.014 | −0.005 | −0.070 | 0.059 |
| Grain soups ** | 104 | 3 | 4 | 7 | −0.014 | −0.052 | 0.024 | −0.053 | −0.174 | 0.067 |
| Muesli ** | 109 | 7 | 1 | 1 | −0.030 | −0.043 | −0.017 | −0.121 | −0.171 | −0.070 |
| Other cereals ** | 57 | 27 | 22 | 12 | −0.016 | −0.041 | 0.008 | −0.027 | −0.074 | 0.020 |
| Biscuits and rusks ** | 35 | 66 | 9 | 8 | 0.015 | −0.004 | 0.033 | 0.018 | −0.024 | 0.059 |
| Snack cakes ** | 68 | 34 | 8 | 8 | 0.021 | −0.007 | 0.049 | 0.083 | −0.028 | 0.194 |
| Cakes ** | 113 | 3 | 1 | 1 | −0.017 | −0.042 | 0.009 | −0.051 | −0.106 | 0.005 |
| Other cereals (pieces) ** | 101 | 11 | 2 | 4 | −0.002 | −0.031 | 0.026 | 0.017 | −0.064 | 0.098 |
| Rice-based or rice flour-based products | ||||||||||
| Rice ** | 70 | 11 | 12 | 25 | 0.009 | −0.032 | 0.050 | −0.003 | −0.093 | 0.087 |
| Cakes ** | 111 | 5 | 0 | 2 | −0.029 | −0.043 | −0.016 | −0.081 | −0.137 | −0.026 |
| Puffed rice cereal ** | 111 | 4 | 1 | 2 | −0.009 | −0.041 | 0.023 | −0.039 | −0.119 | 0.040 |
| Total | 62 | 21 | 12 | 23 | −0.007 | −0.038 | 0.025 | −0.032 | −0.098 | 0.033 |
| Spices | ||||||||||
| Pepper *** | 93 | 16 | 3 | 6 | −0.006 | −0.039 | 0.027 | −0.014 | −0.109 | 0.080 |
| Chili pepper *** | 72 | 26 | 9 | 11 | 0.002 | −0.024 | 0.027 | 0.021 | −0.084 | 0.127 |
| Nuts | ||||||||||
| Peanuts *** | 97 | 12 | 5 | 4 | −0.005 | −0.028 | 0.018 | −0.027 | −0.103 | 0.050 |
| Pistachios *** | 110 | 6 | 2 | 0 | −0.008 | −0.042 | 0.025 | −0.030 | −0.123 | 0.063 |
| Nuts *** | 103 | 7 | 4 | 4 | −0.006 | −0.034 | 0.023 | −0.022 | −0.136 | 0.092 |
| Almonds *** | 107 | 6 | 2 | 3 | −0.013 | −0.042 | 0.015 | −0.054 | −0.168 | 0.060 |
| Other *** | 112 | 3 | 0 | 3 | −0.005 | −0.038 | 0.029 | −0.019 | −0.153 | 0.115 |
© 2020 by the authors. Licensee MDPI, Basel, Switzerland. This article is an open access article distributed under the terms and conditions of the Creative Commons Attribution (CC BY) license (http://creativecommons.org/licenses/by/4.0/).
Share and Cite
Ferri, F.; Brera, C.; De Santis, B.; Collini, G.; Crespi, E.; Debegnach, F.; Gargano, A.; Gattei, D.; Magnani, I.; Mancuso, P.; et al. Association between Urinary Levels of Aflatoxin and Consumption of Food Linked to Maize or Cow Milk or Dairy Products. Int. J. Environ. Res. Public Health 2020, 17, 2510. https://0-doi-org.brum.beds.ac.uk/10.3390/ijerph17072510
Ferri F, Brera C, De Santis B, Collini G, Crespi E, Debegnach F, Gargano A, Gattei D, Magnani I, Mancuso P, et al. Association between Urinary Levels of Aflatoxin and Consumption of Food Linked to Maize or Cow Milk or Dairy Products. International Journal of Environmental Research and Public Health. 2020; 17(7):2510. https://0-doi-org.brum.beds.ac.uk/10.3390/ijerph17072510
Chicago/Turabian StyleFerri, Fulvio, Carlo Brera, Barbara De Santis, Giorgia Collini, Enrica Crespi, Francesca Debegnach, Angelo Gargano, Daniela Gattei, Ines Magnani, Pamela Mancuso, and et al. 2020. "Association between Urinary Levels of Aflatoxin and Consumption of Food Linked to Maize or Cow Milk or Dairy Products" International Journal of Environmental Research and Public Health 17, no. 7: 2510. https://0-doi-org.brum.beds.ac.uk/10.3390/ijerph17072510