Placement of Outdoor Exercise Equipment and Physical Activity: A Quasi-Experimental Study in Two Parks in Southern California


Abstract
:1. Introduction
2. Materials and Methods
2.1. Setting
2.1.1. Edison Park
2.1.2. Garden Grove Park
2.2. System for Observing Play and Recreation in Communities (SOPARC)
2.3. Institutional Review Board
2.4. Data Collection
2.5. Data Analysis
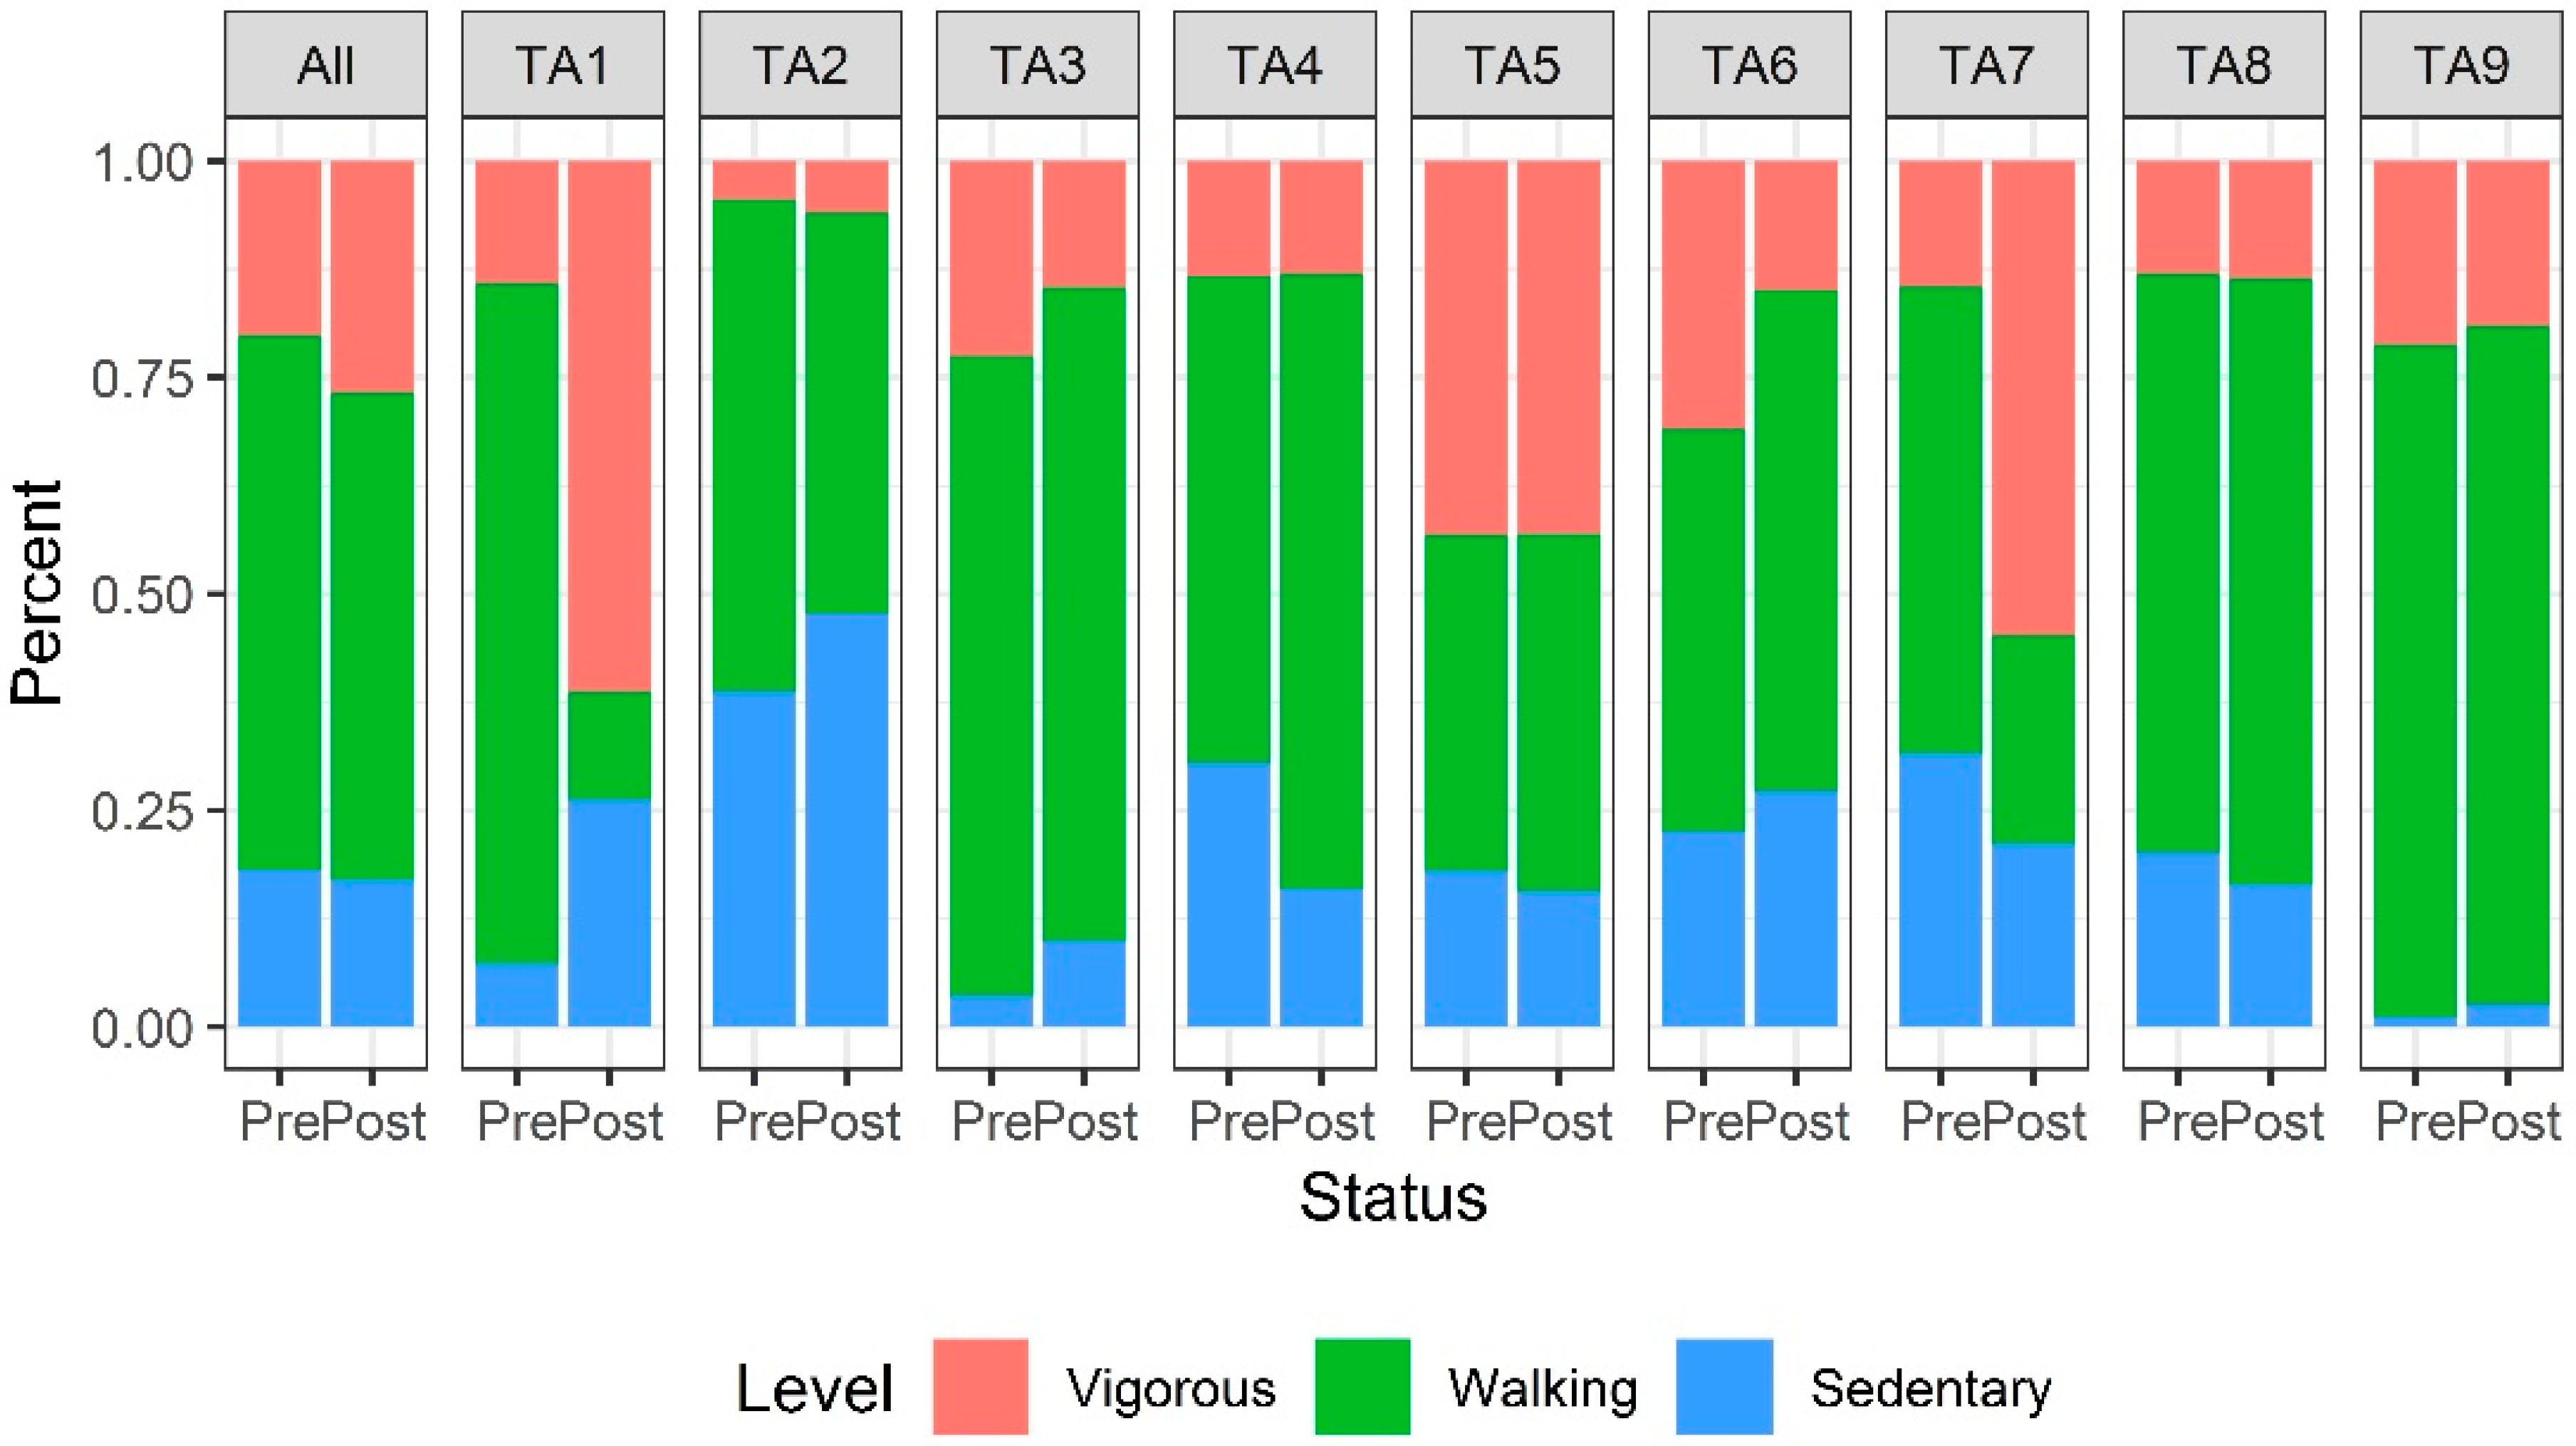
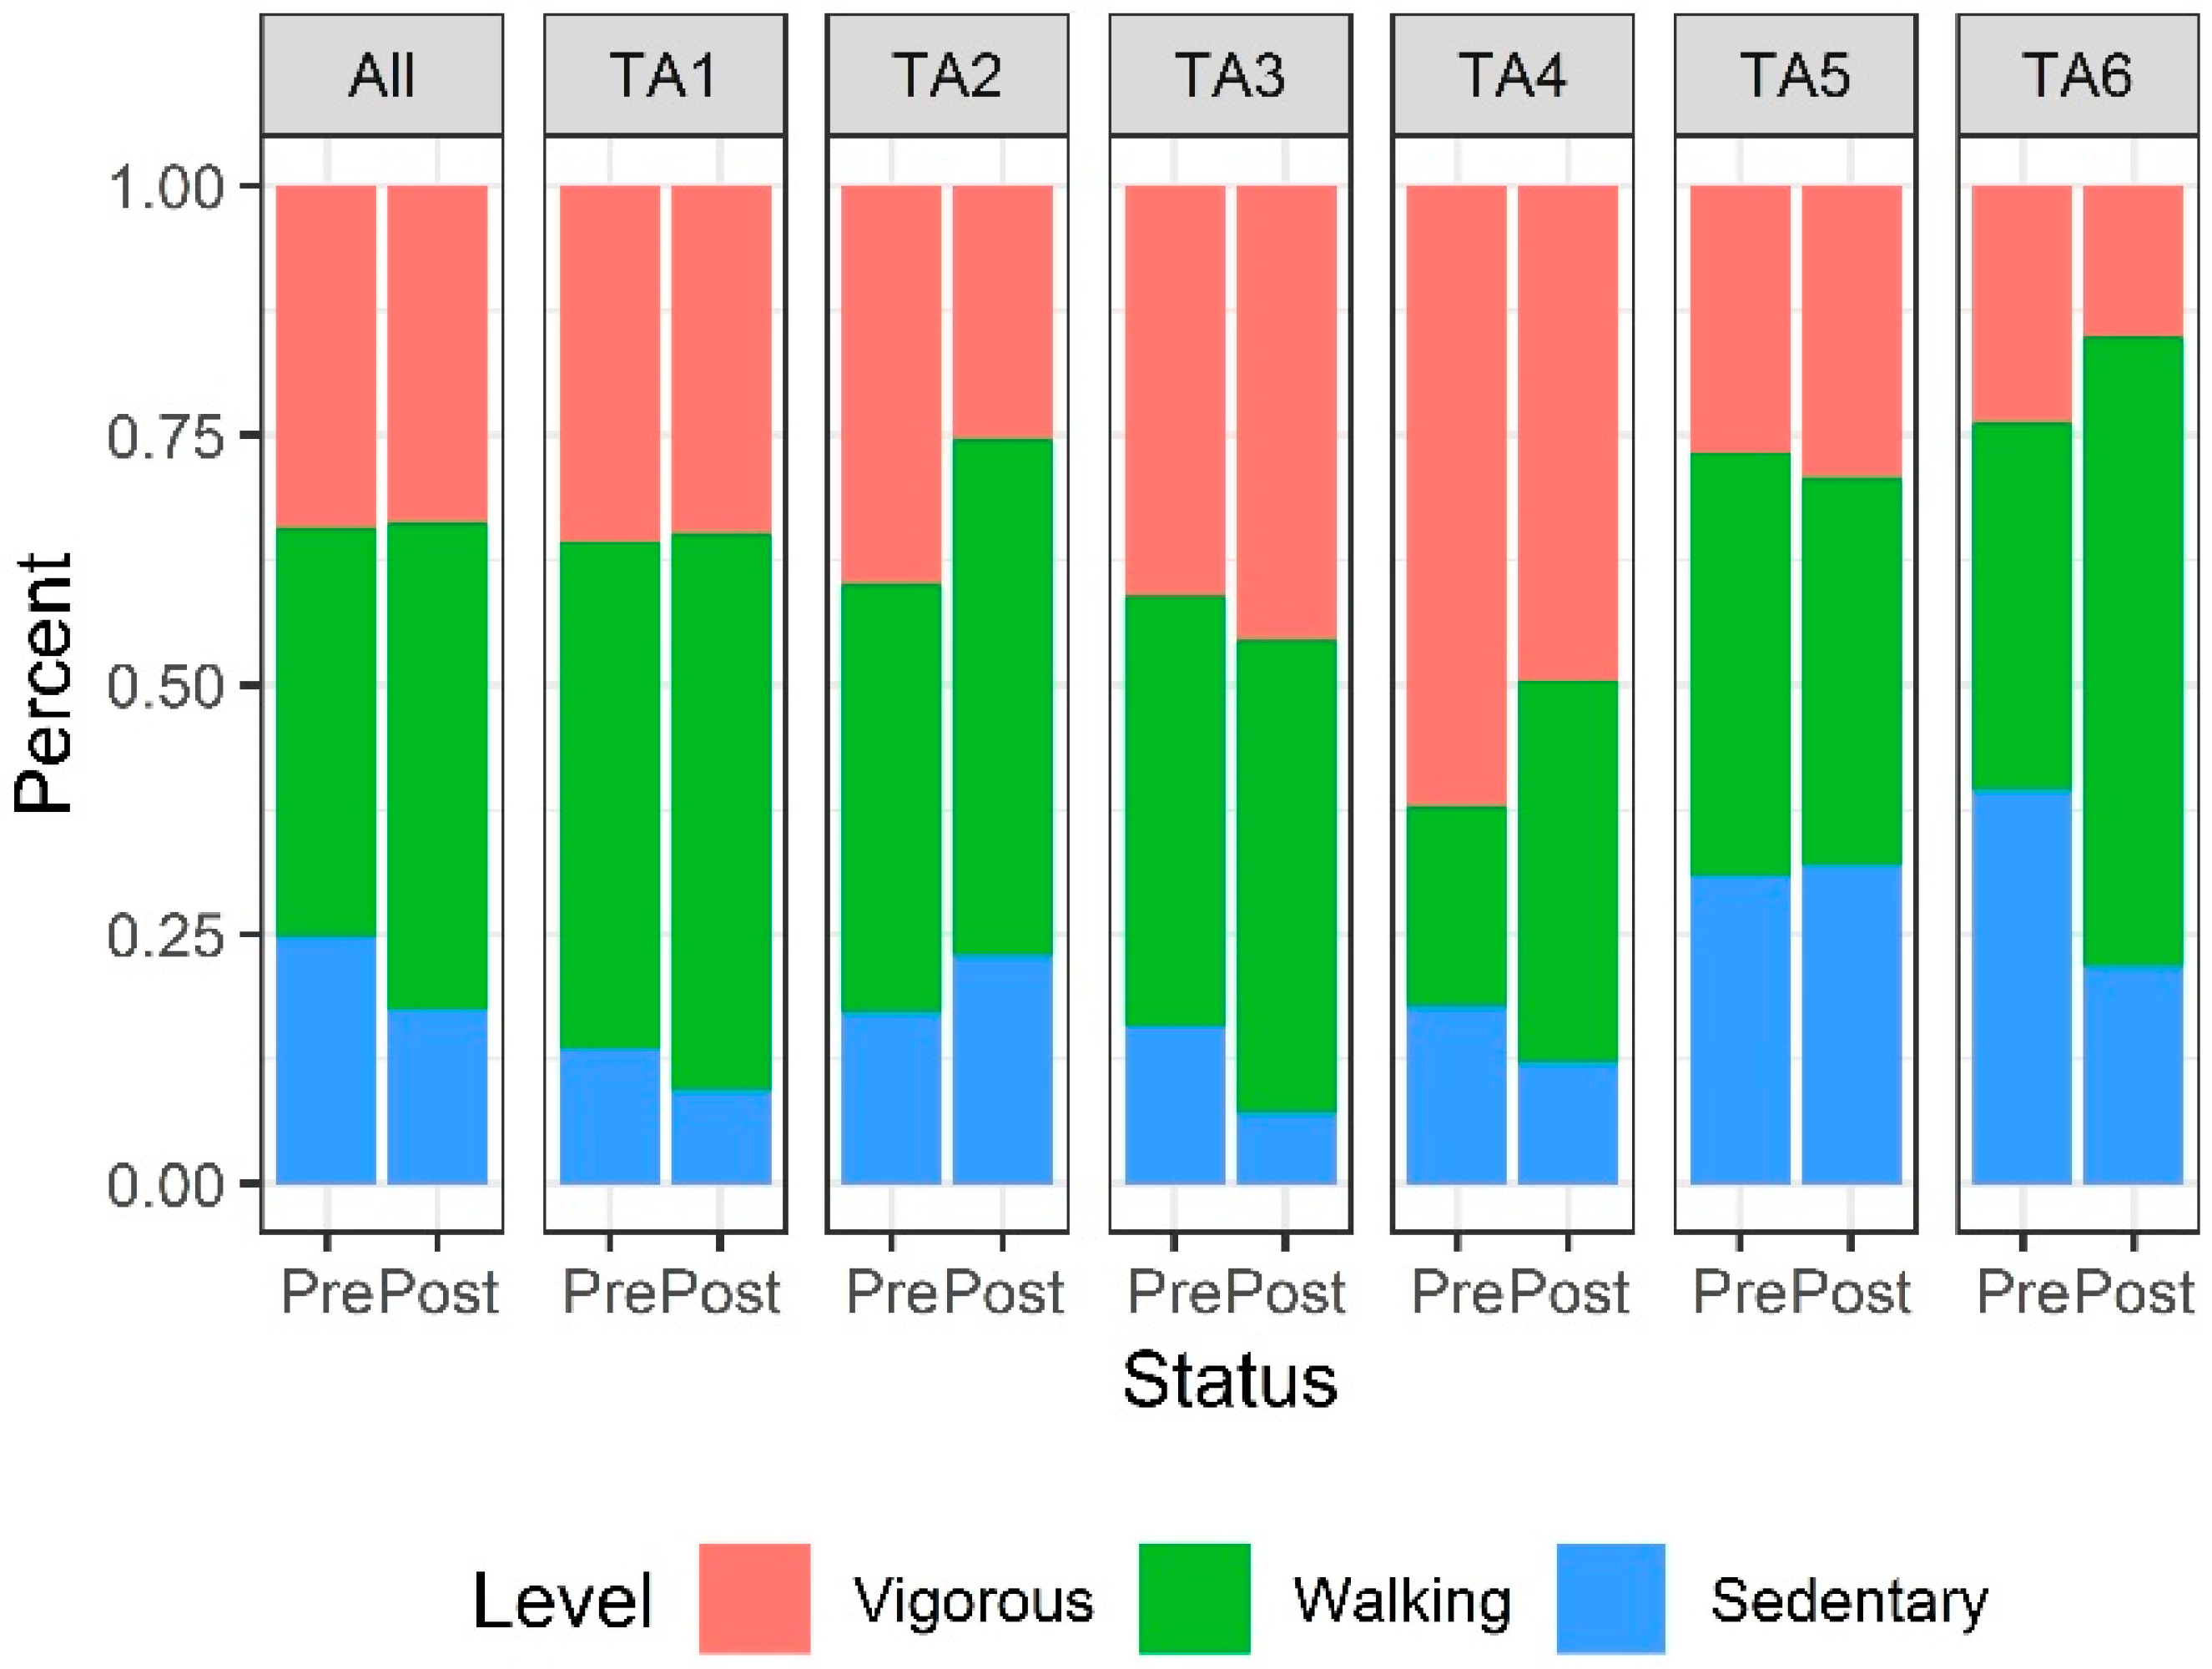
3. Results
3.1. Descriptive Characteristics of Park Users in Edison Park and Garden Grove Park
3.2. Physical Activity Levels of Park Users Pre and Post-intervention in Edison and Garden Grove Parks
4. Discussion
5. Conclusions
Author Contributions
Funding
Acknowledgments
Conflicts of Interest
References
- Audrey, S.; Batista-Ferrer, H. Healthy urban environments for children and young people: A systematic review of intervention studies. Health Place 2015, 36, 97–117. [Google Scholar] [CrossRef] [PubMed] [Green Version]
- Kärmeniemi, M.; Lankila, T.; Ikäheimo, T.; Koivumaa-Honkanen, H.; Korpelainen, R. The built environment as a determinant of physical activity: A systematic review of longitudinal studies and natural experiments. Ann. Behav. Med. 2018, 52, 239–251. [Google Scholar] [CrossRef] [PubMed] [Green Version]
- Smith, M.; Hosking, J.; Woodward, A.; Witten, K.; MacMillan, A.; Field, A.; Baas, P.; Mackie, H. Systematic literature review of built environment effects on physical activity and active transport—An update and new findings on health equity. Int. J. Behav. Nutr. Phys. Act. 2017, 14, 158. [Google Scholar] [CrossRef] [PubMed]
- Zhang, R.; Wulff, H.; Duan, Y.; Wagner, P. Associations between the physical environment and park-based physical activity: A systematic review. J. Sport Health Sci. 2019, 8, 412–421. [Google Scholar] [CrossRef]
- Cohen, D.A.; Golinelli, D.; Williamson, S.; Sehgal, A.; Marsh, T.; McKenzie, T.L. Effects of park improvements on park use and physical activity: Policy and programming implications. Am. J. Prev. Med. 2009, 37, 475–480. [Google Scholar] [CrossRef] [Green Version]
- Cohen, D.A.; Marsh, T.; Williamson, S.; Golinelli, D.; McKenzie, T.L. Impact and cost-effectiveness of family fitness zones: A natural experiment in urban public parks. Health Place 2009, 18, 39–45. [Google Scholar] [CrossRef] [Green Version]
- Edwards, N.; Hooper, P.; Knuiman, M.; Foster, S.; Giles-Corti, B. Associations between park features and adolescent park use for physical activity. Int. J. Behav. Nutr. Phys. Act. 2015, 12, 21. [Google Scholar] [CrossRef] [Green Version]
- Evenson, K.R.; Jones, S.A.; Holliday, K.M.; Cohen, D.A.; McKenzie, T.L. Park characteristics, use, and physical activity: A review of studies using SOPARC (System for Observing Play and Recreation in Communities). Prev. Med. 2016, 86, 153–166. [Google Scholar] [CrossRef] [Green Version]
- Cohen, D.A.; Hunter, G.; Williamson, S.; Dubowitz, T. Are food deserts also play deserts? J. Urban Health 2016, 93, 235–243. [Google Scholar] [CrossRef] [Green Version]
- Wilson, K.S.; Kato, B.; Garcia, E. Promoting physical activity in parks: Kinesiology students serving the community. Calif. J. Health Promot. 2018, 16, 22–31. [Google Scholar] [CrossRef] [Green Version]
- Jansson, A.K.; Lubans, D.; Smith, J.; Duncan, M.J.; Haslam, R.; Plotnikoff, R.C. A systematic review of outdoor gym use: Current evidence and future directions. J. Sci. Med. Sport 2019, 22, 1335–1343. [Google Scholar] [CrossRef]
- Sami, M.; Smith, M.; Ogunseitan, O. Changes in physical activity after installation of a fitness zone in a community park. Prev. Chronic Dis. 2018, 15, 101. [Google Scholar] [CrossRef]
- Hunter, R.F.; Christian, H.; Veitch, J.; Astell-Burt, T.; Hipp, J.A.; Schipperijn, J. The impact of interventions to promote physical activity in urban green space: A systematic review and recommendations for future research. Soc. Sci. Med. 2015, 124, 246–256. [Google Scholar] [CrossRef] [Green Version]
- Chow, H.-W.; Wu, D.-R. Outdoor Fitness Equipment Usage Behaviors in Natural Settings. Int. J. Environ. Res. Public Health 2019, 16, 391. [Google Scholar] [CrossRef] [Green Version]
- Evenson, K.R.; Williamson, S.; Han, B.; McKenzie, T.L.; Cohen, D.A. United States’ neighborhood park use and physical activity over two years: The national study of neighborhood parks. Prev. Med. 2019, 123, 117–122. [Google Scholar] [CrossRef] [PubMed]
- Orange County Healthier Together. Orange County Health Improvement Plan 2017–19; Health Improvement Partnership: Santa Ana, CA, USA, 2017. [Google Scholar]
- Energi products. Fitness & Wellness; Playworld: Lewisburg, PA, USA, 2016. [Google Scholar]
- McKenzie, T.L. Systematic Observation: SOPLAY/SOPARC Introduction, Practice, and Assessment; San Diego State University: San Diego, CA, USA, 2005. [Google Scholar]
- McKenzie, T.L.; Cohen, D. SOPARC (System for Observing Play and Recreation in Communities): Description and Procedures Manual; San Diego State University: San Diego, CA, USA, 2006. [Google Scholar]
- McKenzie, T.L.; Cohen, D.A.; Sehgal, A.; Williamson, S.; Golinelli, D. System for Observing Play and Recreation in Communities (SOPARC): Reliability and feasibility measures. J. Phys. Act. Health 2006, 3, S208–S222. [Google Scholar] [CrossRef]
- Centers for Disease Control and Prevention. A Data Users Guide to the BRFSS Physical Activity Questions: How to Assess the 2008 Physical Activity Guidelines for Americans; National Center for Chronic Disease Prevention and Health Promotion: Division of Nutrition, Physical Activity, and Obesity: Atlanta, GA, USA, 2011. [Google Scholar]
- Van Dyck, D.; Sallis, J.F.; Cardon, G.; Deforche, B.; Adams, M.A.; Geremia, C.; De Bourdeaudhuij, I. Associations of neighborhood characteristics with active park use: An observational study in two cities in the USA and Belgium. Int. J. Health Geogr. 2013, 12, 26. [Google Scholar] [CrossRef] [Green Version]
- Lee, I.M.; Shiroma, E.J.; Lobelo, F.; Puska, P.; Blair, S.N.; Katzmarzyk, P.T.; Lancet Physical Activity Series Working Group. Effect of physical inactivity on major non-communicable diseases worldwide: An analysis of burden of disease and life expectancy. Lancet 2012, 380, 219–229. [Google Scholar] [CrossRef] [Green Version]
- Ding, D.; Lawson, K.D.; Kolbe-Alexander, T.L.; Finkelstein, E.A.; Katzmarzyk, P.T.; Van Mechelen, W.; Pratt, M.; Lancet Physical Activity Series 2 Executive Committee. The economic burden of physical inactivity: A global analysis of major non-communicable diseases. Lancet 2016, 388, 1311–1324. [Google Scholar] [CrossRef]
- Hollis, N.D.; Zhang, Q.C.; Cyrus, A.C.; Courtney-Long, E.; Watson, K.; Carroll, D.D. Physical activity types among US adults with mobility disability, Behavioral Risk Factor Surveillance System, 2017. Disabil. Health J. 2020. [Google Scholar] [CrossRef]
- Liu, Z.; Kemperman, A.; Timmermans, H. Social-ecological correlates of older adults’ outdoor activity patterns. J. Transp. Health 2020, 16, 100840. [Google Scholar] [CrossRef]
- Cohen, D.A.; Han, B.; Williamson, S.; Nagel, C.; McKenzie, T.L.; Evenson, K.R.; Harnik, P. Playground features and physical activity in US neighborhood parks. Prev. Med. 2020, 131, 105945. [Google Scholar] [CrossRef]
- Zhang, C.; Li, R.; Xia, Y.; Yuan, Y.; Dinçer, H.; Yüksel, S. Analysis of Environmental Activities for Developing Public Health Investments and Policies: A Comparative Study with Structure Equation and Interval Type 2 Fuzzy Hybrid Models. Int. J. Environ. Res. Public Health 2020, 17, 1977. [Google Scholar] [CrossRef] [Green Version]
- Richardson, A.S.; Ghosh-Dastidar, M.; Collins, R.L.; Hunter, G.P.; Troxel, W.M.; Colabianchi, N.; Cohen, D.A.; Dubowitz, T. Improved street walkability, incivilities, and esthetics are associated with greater park use in two low-income neighborhoods. J. Urban Health 2020, 97, 204–212. [Google Scholar] [CrossRef]
- Duck, A.A.; Robinson, J.C.; Stewart, M.W. Adults’ and children’s perceptions of barriers and facilitators of school-aged children’s physical activity in an inner-city urban area. J. Spec. Pediatr. Nurs. 2020, 25, e12278. [Google Scholar] [CrossRef]
- Hooper, P.; Foster, S.; Edwards, N.; Turrell, G.; Burton, N.; Giles-Corti, B.; Brown, W.J. Positive HABITATS for physical activity: Examining use of parks and its contribution to physical activity levels in mid- to older-aged adults. Health Place 2020, 63, 102308. [Google Scholar] [CrossRef]
- Cohen, D.A.; Leuschner, K.J. How Can Neighborhood Parks Be Used to Increase Physical Activity; RAND Corporation: Santa Monica, CA, USA, 2018. [Google Scholar]
- Cohen, D.A.; Marsh, T.; Williamson, S.; Derose, P.T.; Martinez, H.; Setodji, C.; McKenzie, T.L. Parks and physical activity: Why are some parks used more than others? Prev. Med. 2010, 50, S9–S12. [Google Scholar] [CrossRef] [Green Version]
- Cohen, D.A.; Han, B.; Isacoff, J.; Shulaker, B.; Williamson, S.; Marsh, T.; McKenzie, T.L.; Weir, M.; Bhatia, R. Impact of park renovations on park use and park-based physical activity. J. Phys. Act. Health 2015, 12, 289–295. [Google Scholar] [CrossRef]
- Marquet, O.; Hipp, J.A.; Alberico, C.; Huang, J.H.; Fry, D.; Mazak, E.; Floyd, M.F. Use of SOPARC to assess physical activity in parks: Do race/ethnicity, contextual conditions, and settings of the target area, affect reliability? BMC Public Health 2019, 19, 1730. [Google Scholar] [CrossRef] [Green Version]
- Trinh-Shevrin, C.; Nadkarni, S.; Park, R.; Islam, N.; Kwon, S.C. Defining an integrative approach for health promotion and disease prevention: A population health equity framework. J. Health Care Poor Underserved 2015, 26, 146–163. [Google Scholar] [CrossRef]


| Characteristic | Garden Grove Park Target Area 1 a | Garden Grove Park Overall | Edison Park Overall | |||
|---|---|---|---|---|---|---|
| Pre | Post | Pre | Post | Pre | Post | |
| Total no. of person-periods | 436 | 419 | 6336 | 5319 | 5628 | 3238 |
| Sex | ||||||
| % Male | 64.9 | 49.6 | 66.4 | 64.8 | 60.5 | 68.7 |
| % Female | 35.1 | 50.4 | 33.6 | 35.2 | 39.5 | 31.3 |
| χ2 (p Value) | 19.75 (<0.001) | 3.24 (0.072) | 59.07 (<0.001) | |||
| Age group | ||||||
| % Child | 3.9 | 19.3 | 9.8 | 10.2 | 31.6 | 20.2 |
| % Teen | 14.0 | 7.6 | 18.3 | 24.8 | 14.1 | 16.9 |
| % Adult | 64.0 | 32.2 | 59.9 | 45.5 | 42.8 | 53.7 |
| % Senior | 17.2 | 40.8 | 12.1 | 19.5 | 6.9 | 9.2 |
| χ2 (p Value) | 140.29 (<0.001) | 273.76 (<0.001) | 247.43 (<0.001) | |||
| Race/ethnicity | ||||||
| % White | 19.5 | 3.6 | 15.1 | 11.7 | 3.2 | 5.1 |
| % Hispanic | 32.3 | 32.9 | 27.2 | 25.9 | 89.9 | 88.8 |
| % Black | 1.8 | 0.0 | 1.9 | 1.4 | 0.6 | 0.2 |
| % Other | 46.3 | 63.5 | 55.8 | 61.0 | 6.3 | 5.9 |
| χ2 (p Value) | 65.47 (<0.001) | 44.75 (<0.001) | 27.64 (<0.001) | |||
| Area | No. Observations Pre | Post | Activity Level Odds Ratio (95% Confidence Interval) | p Value |
|---|---|---|---|
| Edison Park | |||
| Overall | 5628 | 3238 | 1.19 (1.09 to 1.31) | <0.001 |
| TA1 | 839 | 374 | 2.30 (1.74 to 3.04) | <0.001 |
| TA2 | 1153 | 720 | 0.74 (0.60 to 0.90) | 0.003 |
| TA3 | 621 | 549 | 1.83 (1.41 to 2.36) | <0.001 |
| TA4 | 409 | 670 | 0.91 (0.69 to 1.21) | 0.53 |
| TA5 | 1322 | 411 | 1.22 (0.97 to 1.53) | 0.083 |
| TA6 | 1284 | 514 | 1.32 (1.08 to 1.61) | 0.007 |
| Garden Grove Park | |||
| Overall | 6336 | 5319 | 1.23 (1.14 to 1.32) | <0.001 |
| TA1 (fitness zone) | 436 | 419 | 5.29 (3.76 to 7.44) | <0.001 |
| TA2 | 446 | 333 | 0.75 (0.55 to 1.04) | 0.083 |
| TA3 | 609 | 431 | 0.56 (0.41 to 0.77) | <0.001 |
| TA4 | 865 | 636 | 1.40 (1.12 to 1.74) | 0.003 |
| TA5 | 749 | 631 | 1.34 (1.07 to 1.67) | 0.011 |
| TA6 | 571 | 469 | 0.72 (0.55 to 0.94) | 0.016 |
| TA7 | 549 | 655 | 3.61 (2.84 to 4.59) | <0.001 |
| TA8 | 1045 | 567 | 0.96 (0.76 to 1.22) | 0.75 |
| TA9 | 1066 | 1178 | 0.77 (0.63 to 0.95) | 0.016 |
| Area | No. Observations Pre | Post | Estimated Difference Pre- to Post-Intervention (95% Confidence Interval) | p Value |
|---|---|---|---|
| Edison Park | |||
| Overall | 288 | 288 | 0.13 (−0.03 to 0.29) | 0.10 |
| TA1 | 48 | 48 | 0.23 (−0.15 to 0.62) | 0.23 |
| TA2 | 48 | 48 | −0.31 (−0.62 to 0.01) | 0.056 |
| TA3 | 48 | 48 | 0.16 (−0.22 to 0.54) | 0.39 |
| TA4 | 48 | 48 | 0.28 (−0.20 to 0.75) | 0.25 |
| TA5 | 48 | 48 | 0.21 (−0.10 to 0.51) | 0.19 |
| TA6 | 48 | 48 | 0.26 (−0.11 to 0.64) | 0.16 |
| Garden Grove Park | |||
| Overall | 432 | 432 | 0.08 (−0.02 to 0.19) | 0.13 |
| TA1 (fitness zone) | 48 | 48 | 0.85 (0.54 to 1.16) | <0.001 |
| TA2 | 48 | 48 | −0.35 (−0.61 to –0.09) | 0.009 |
| TA3 | 48 | 48 | −0.32 (−0.57 to –0.07) | 0.011 |
| TA4 | 48 | 48 | 0.04 (−0.16 to 0.24) | 0.69 |
| TA5 | 48 | 48 | 0.12 (−0.22 to 0.45) | 0.49 |
| TA6 | 48 | 48 | −0.37 (−0.67 to –0.08) | 0.014 |
| TA7 | 48 | 48 | 0.68 (0.32 to 1.04) | <0.001 |
| TA8 | 48 | 48 | −0.06 (−0.31 to 0.18) | 0.62 |
| TA9 | 48 | 48 | 0.07 (−0.18 to 0.33) | 0.58 |
© 2020 by the authors. Licensee MDPI, Basel, Switzerland. This article is an open access article distributed under the terms and conditions of the Creative Commons Attribution (CC BY) license (http://creativecommons.org/licenses/by/4.0/).
Share and Cite
Sami, M.; Smith, M.; Ogunseitan, O.A. Placement of Outdoor Exercise Equipment and Physical Activity: A Quasi-Experimental Study in Two Parks in Southern California. Int. J. Environ. Res. Public Health 2020, 17, 2605. https://0-doi-org.brum.beds.ac.uk/10.3390/ijerph17072605
Sami M, Smith M, Ogunseitan OA. Placement of Outdoor Exercise Equipment and Physical Activity: A Quasi-Experimental Study in Two Parks in Southern California. International Journal of Environmental Research and Public Health. 2020; 17(7):2605. https://0-doi-org.brum.beds.ac.uk/10.3390/ijerph17072605
Chicago/Turabian StyleSami, Mojgan, Megan Smith, and Oladele A. Ogunseitan. 2020. "Placement of Outdoor Exercise Equipment and Physical Activity: A Quasi-Experimental Study in Two Parks in Southern California" International Journal of Environmental Research and Public Health 17, no. 7: 2605. https://0-doi-org.brum.beds.ac.uk/10.3390/ijerph17072605