Distribution and Behaviour of Some Trace Elements as a Function of Apple Varieties in Northeastern Romania


Abstract
:1. Introduction
2. Materials and Methods
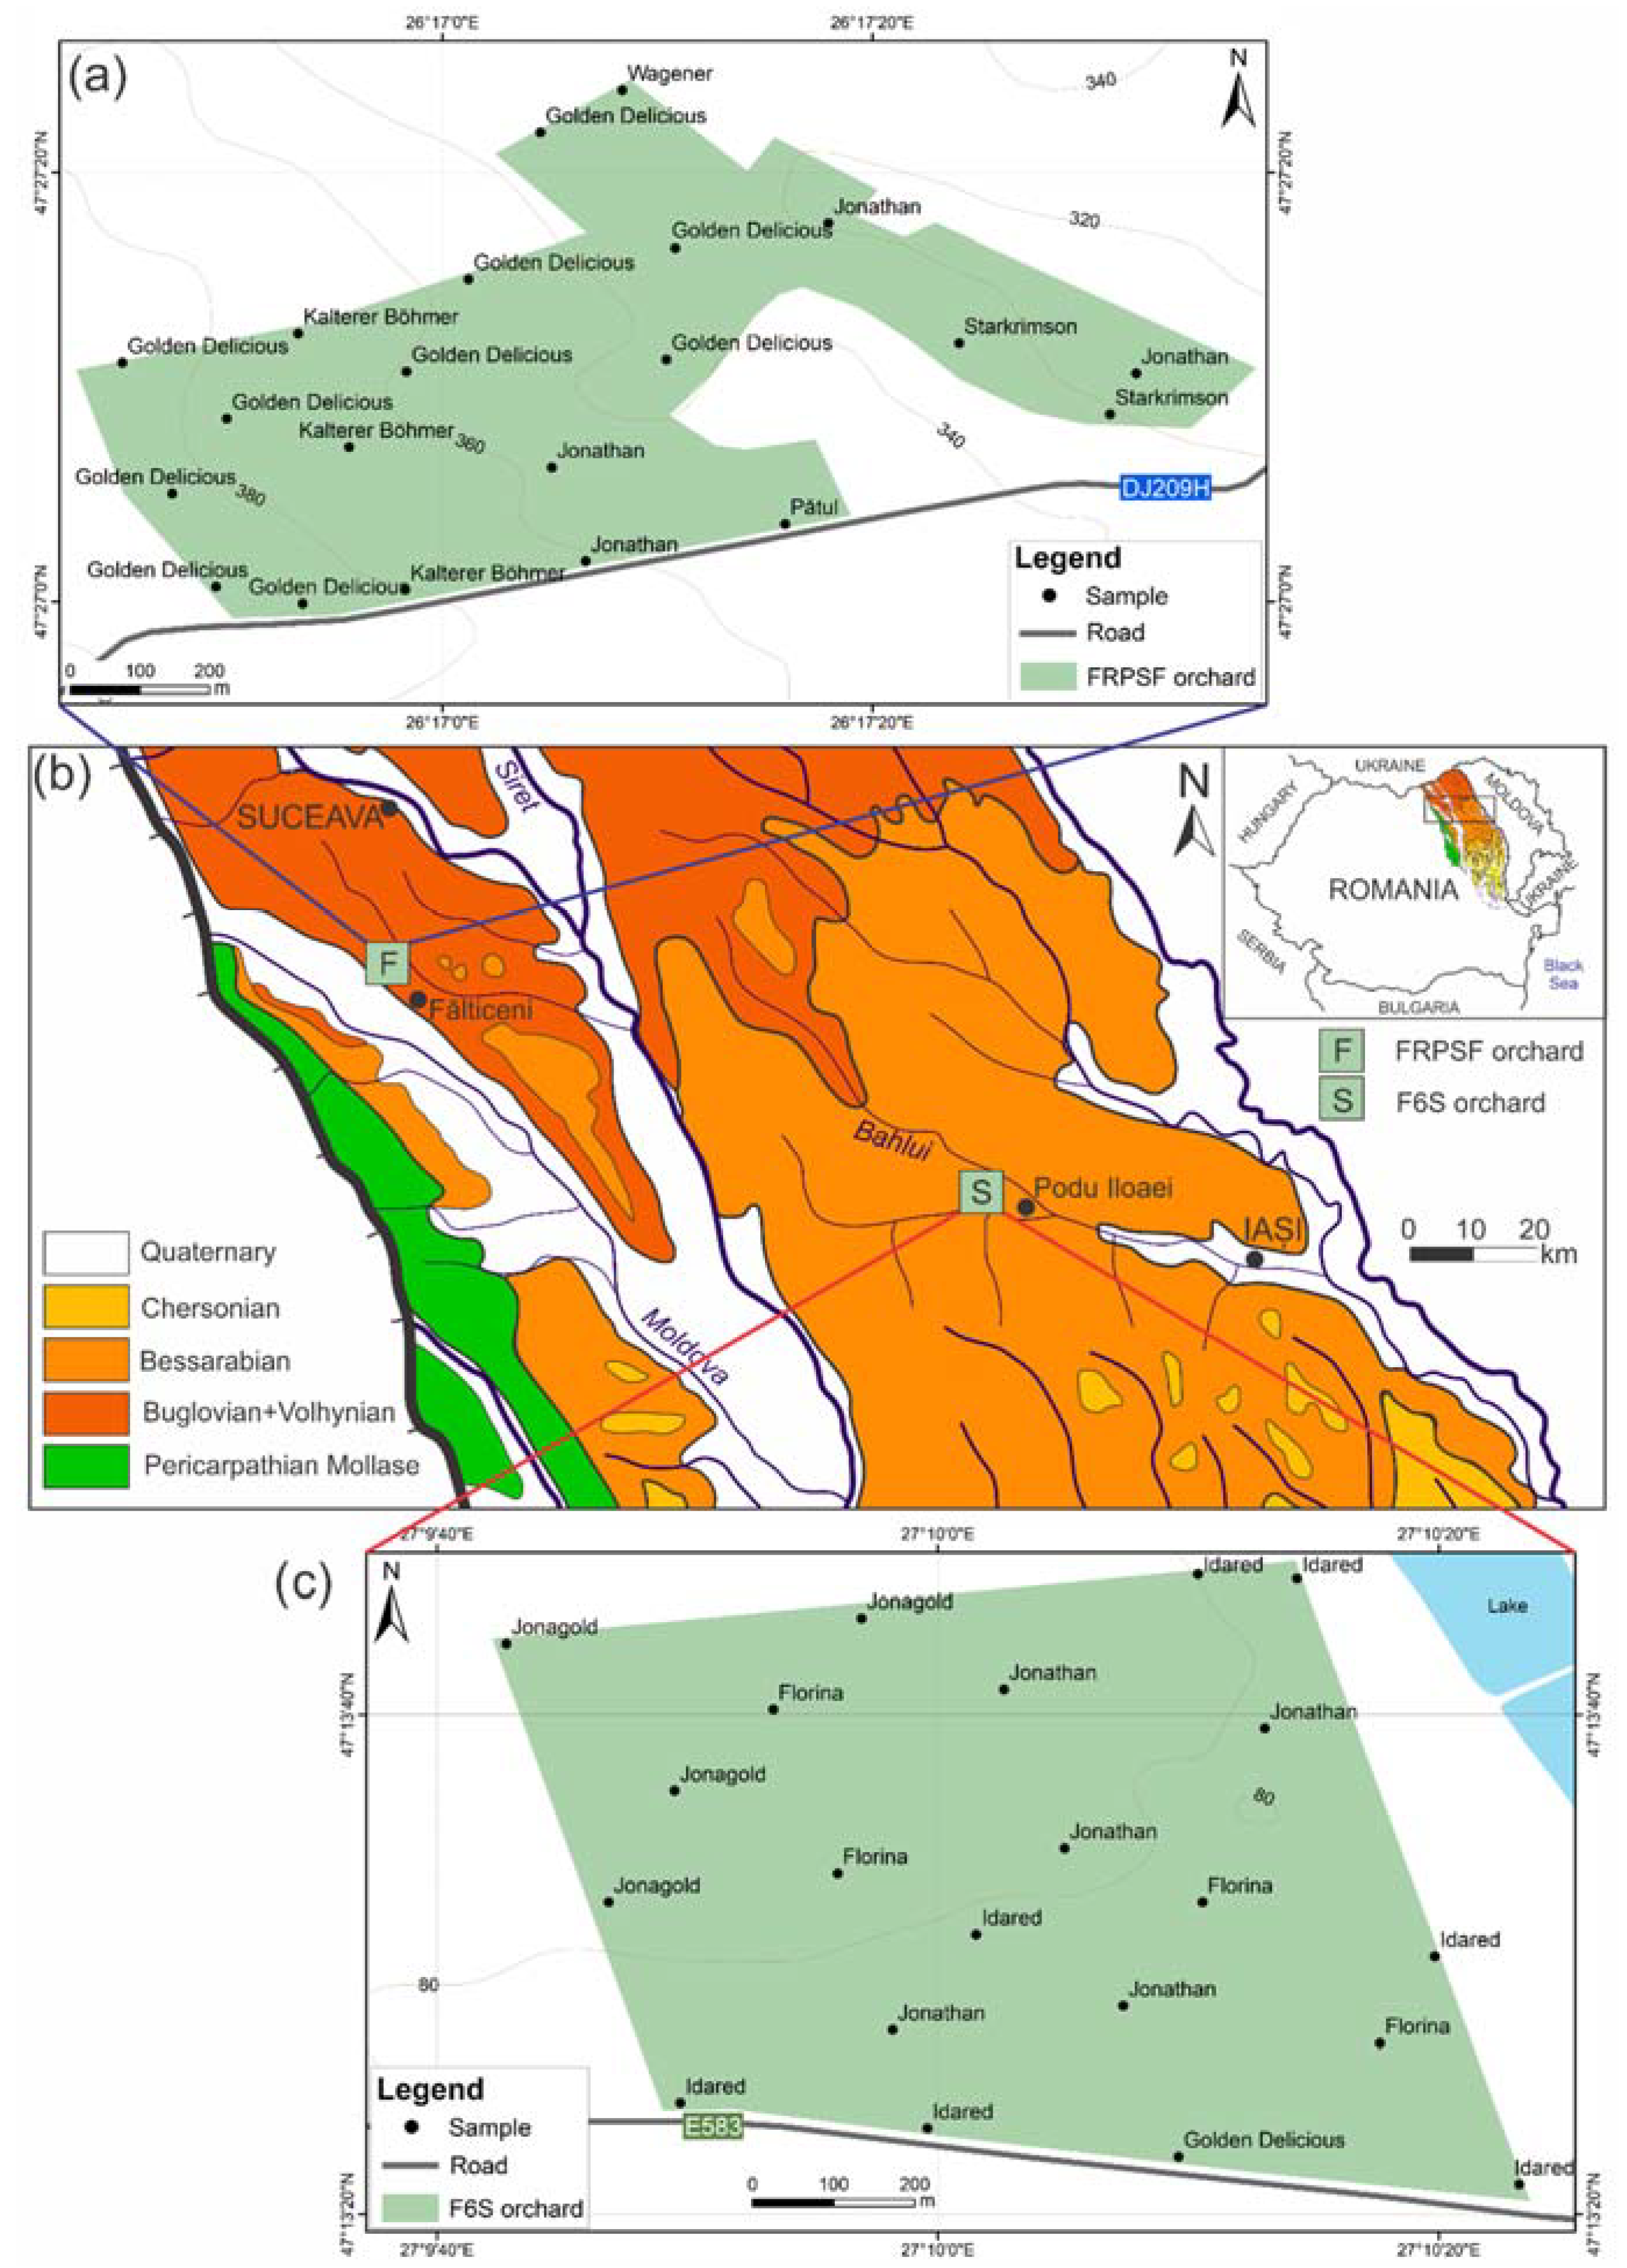
2.1. Study Area
2.2. Samples and Sample Preparation
2.3. Analytical Methods
3. Results and Discussion
3.1. Water Content
3.2. Trace Elements Content
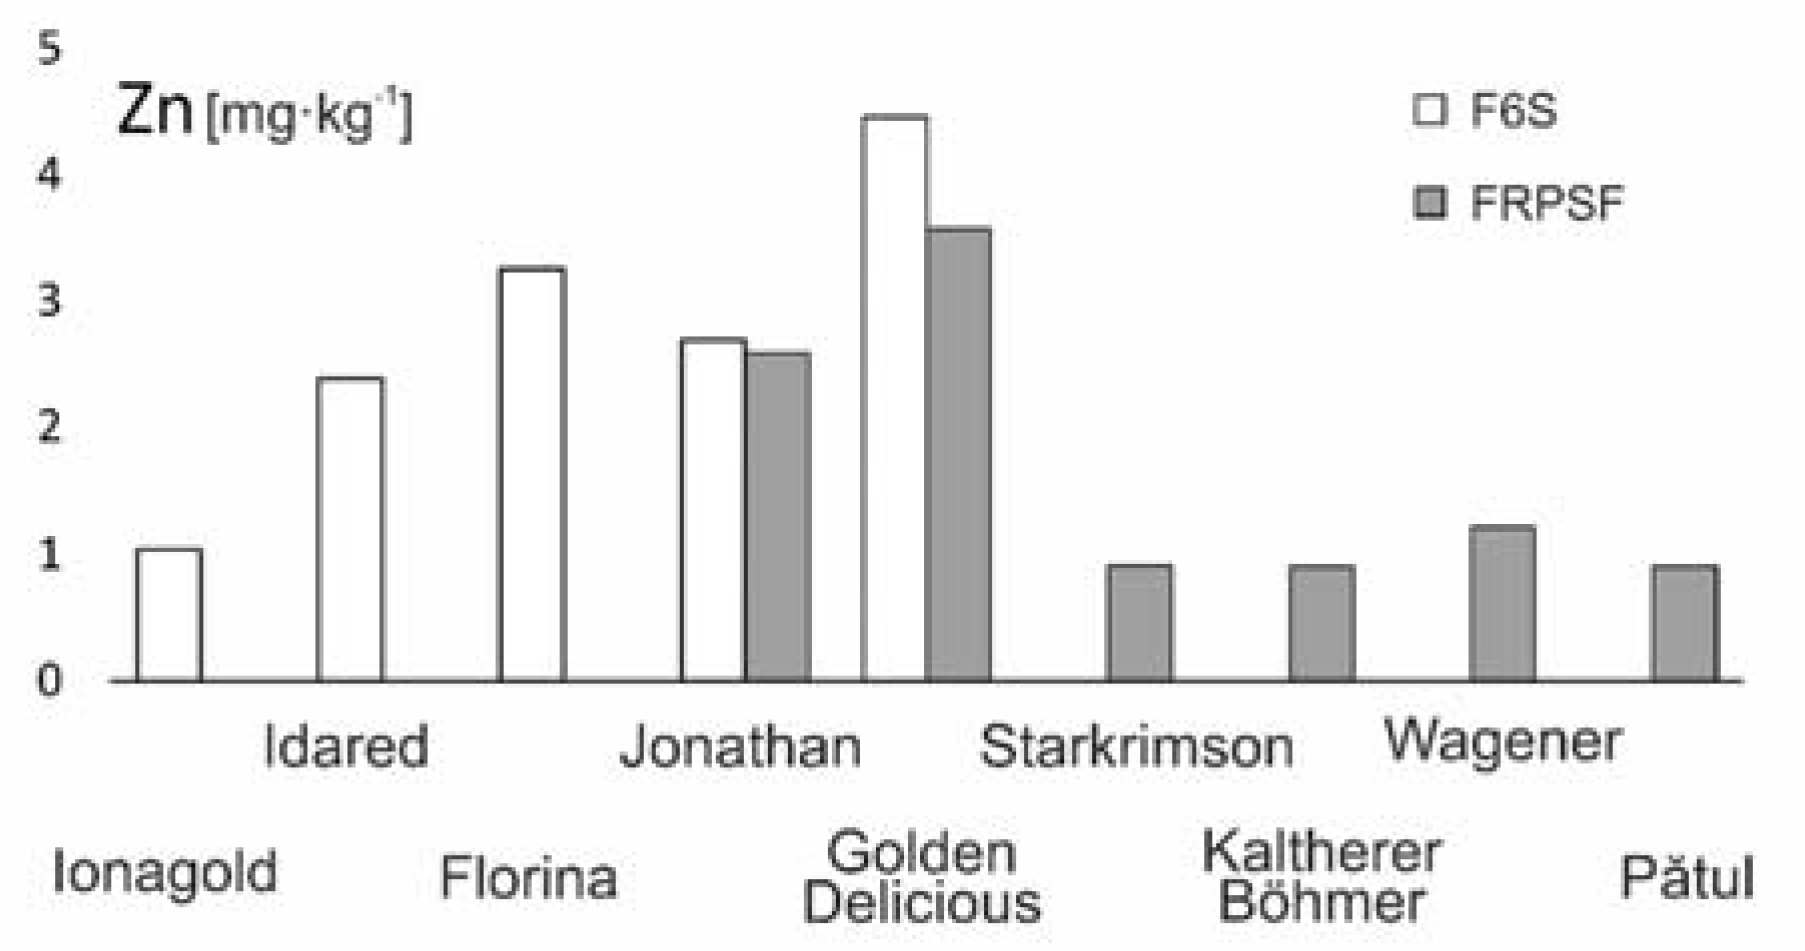
3.2.1. Zinc (Zn)
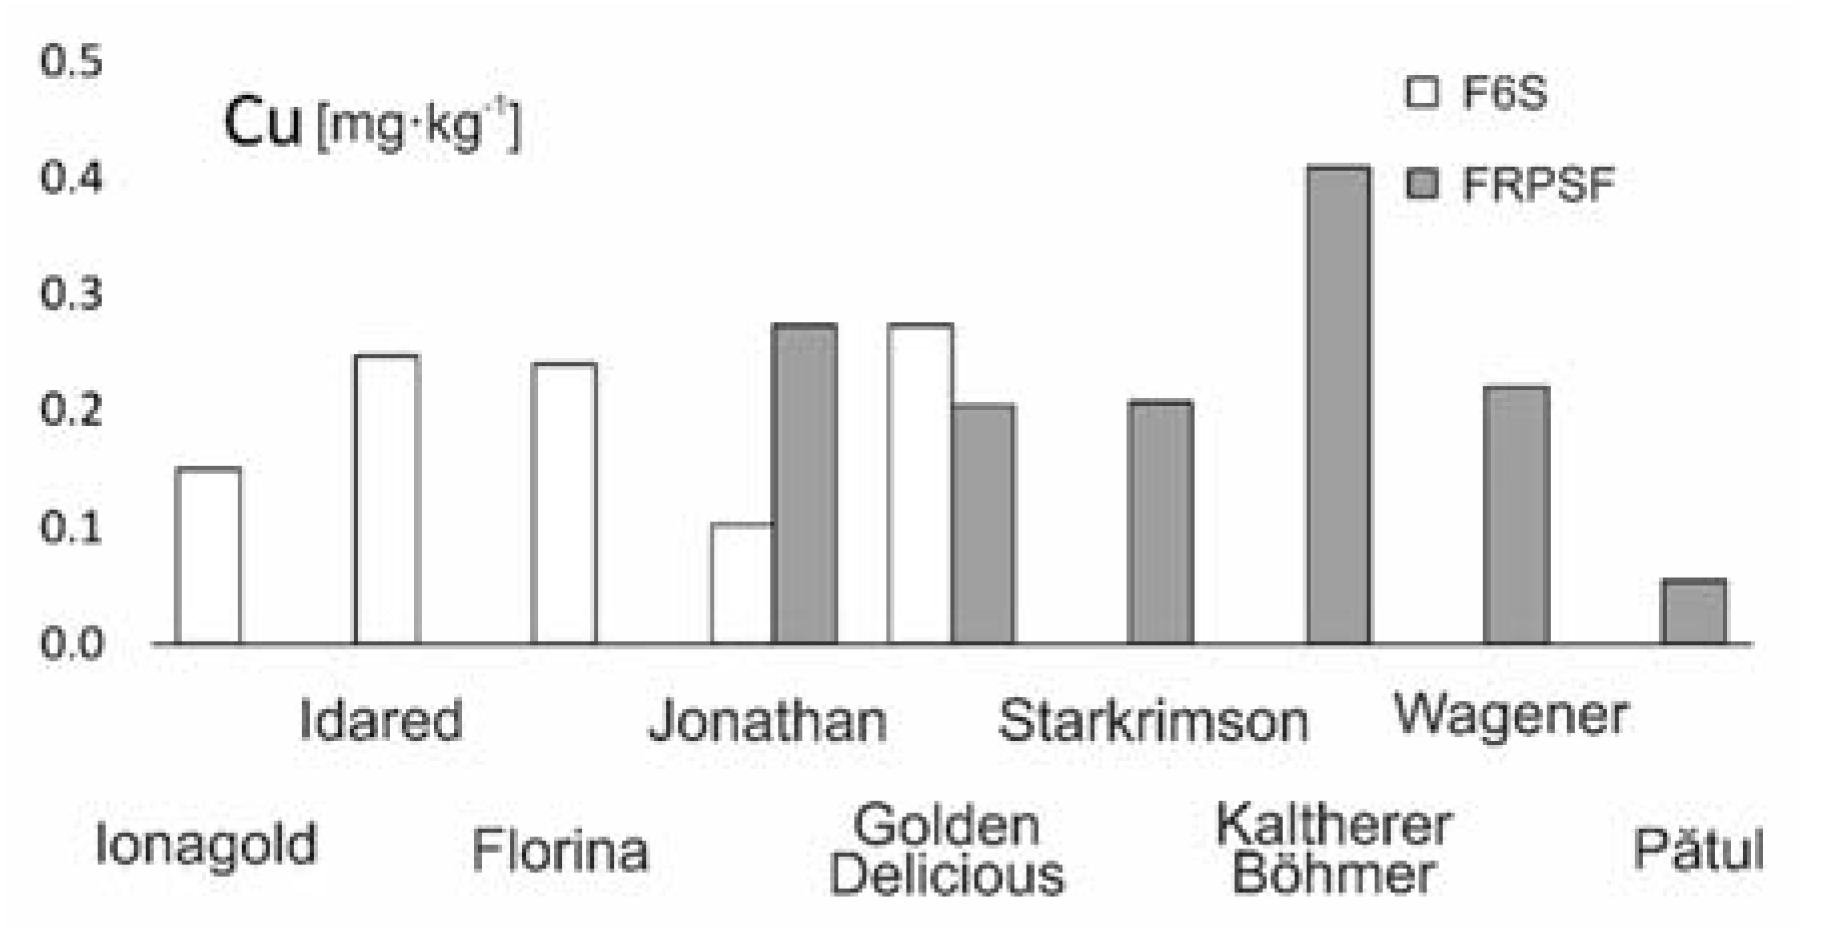
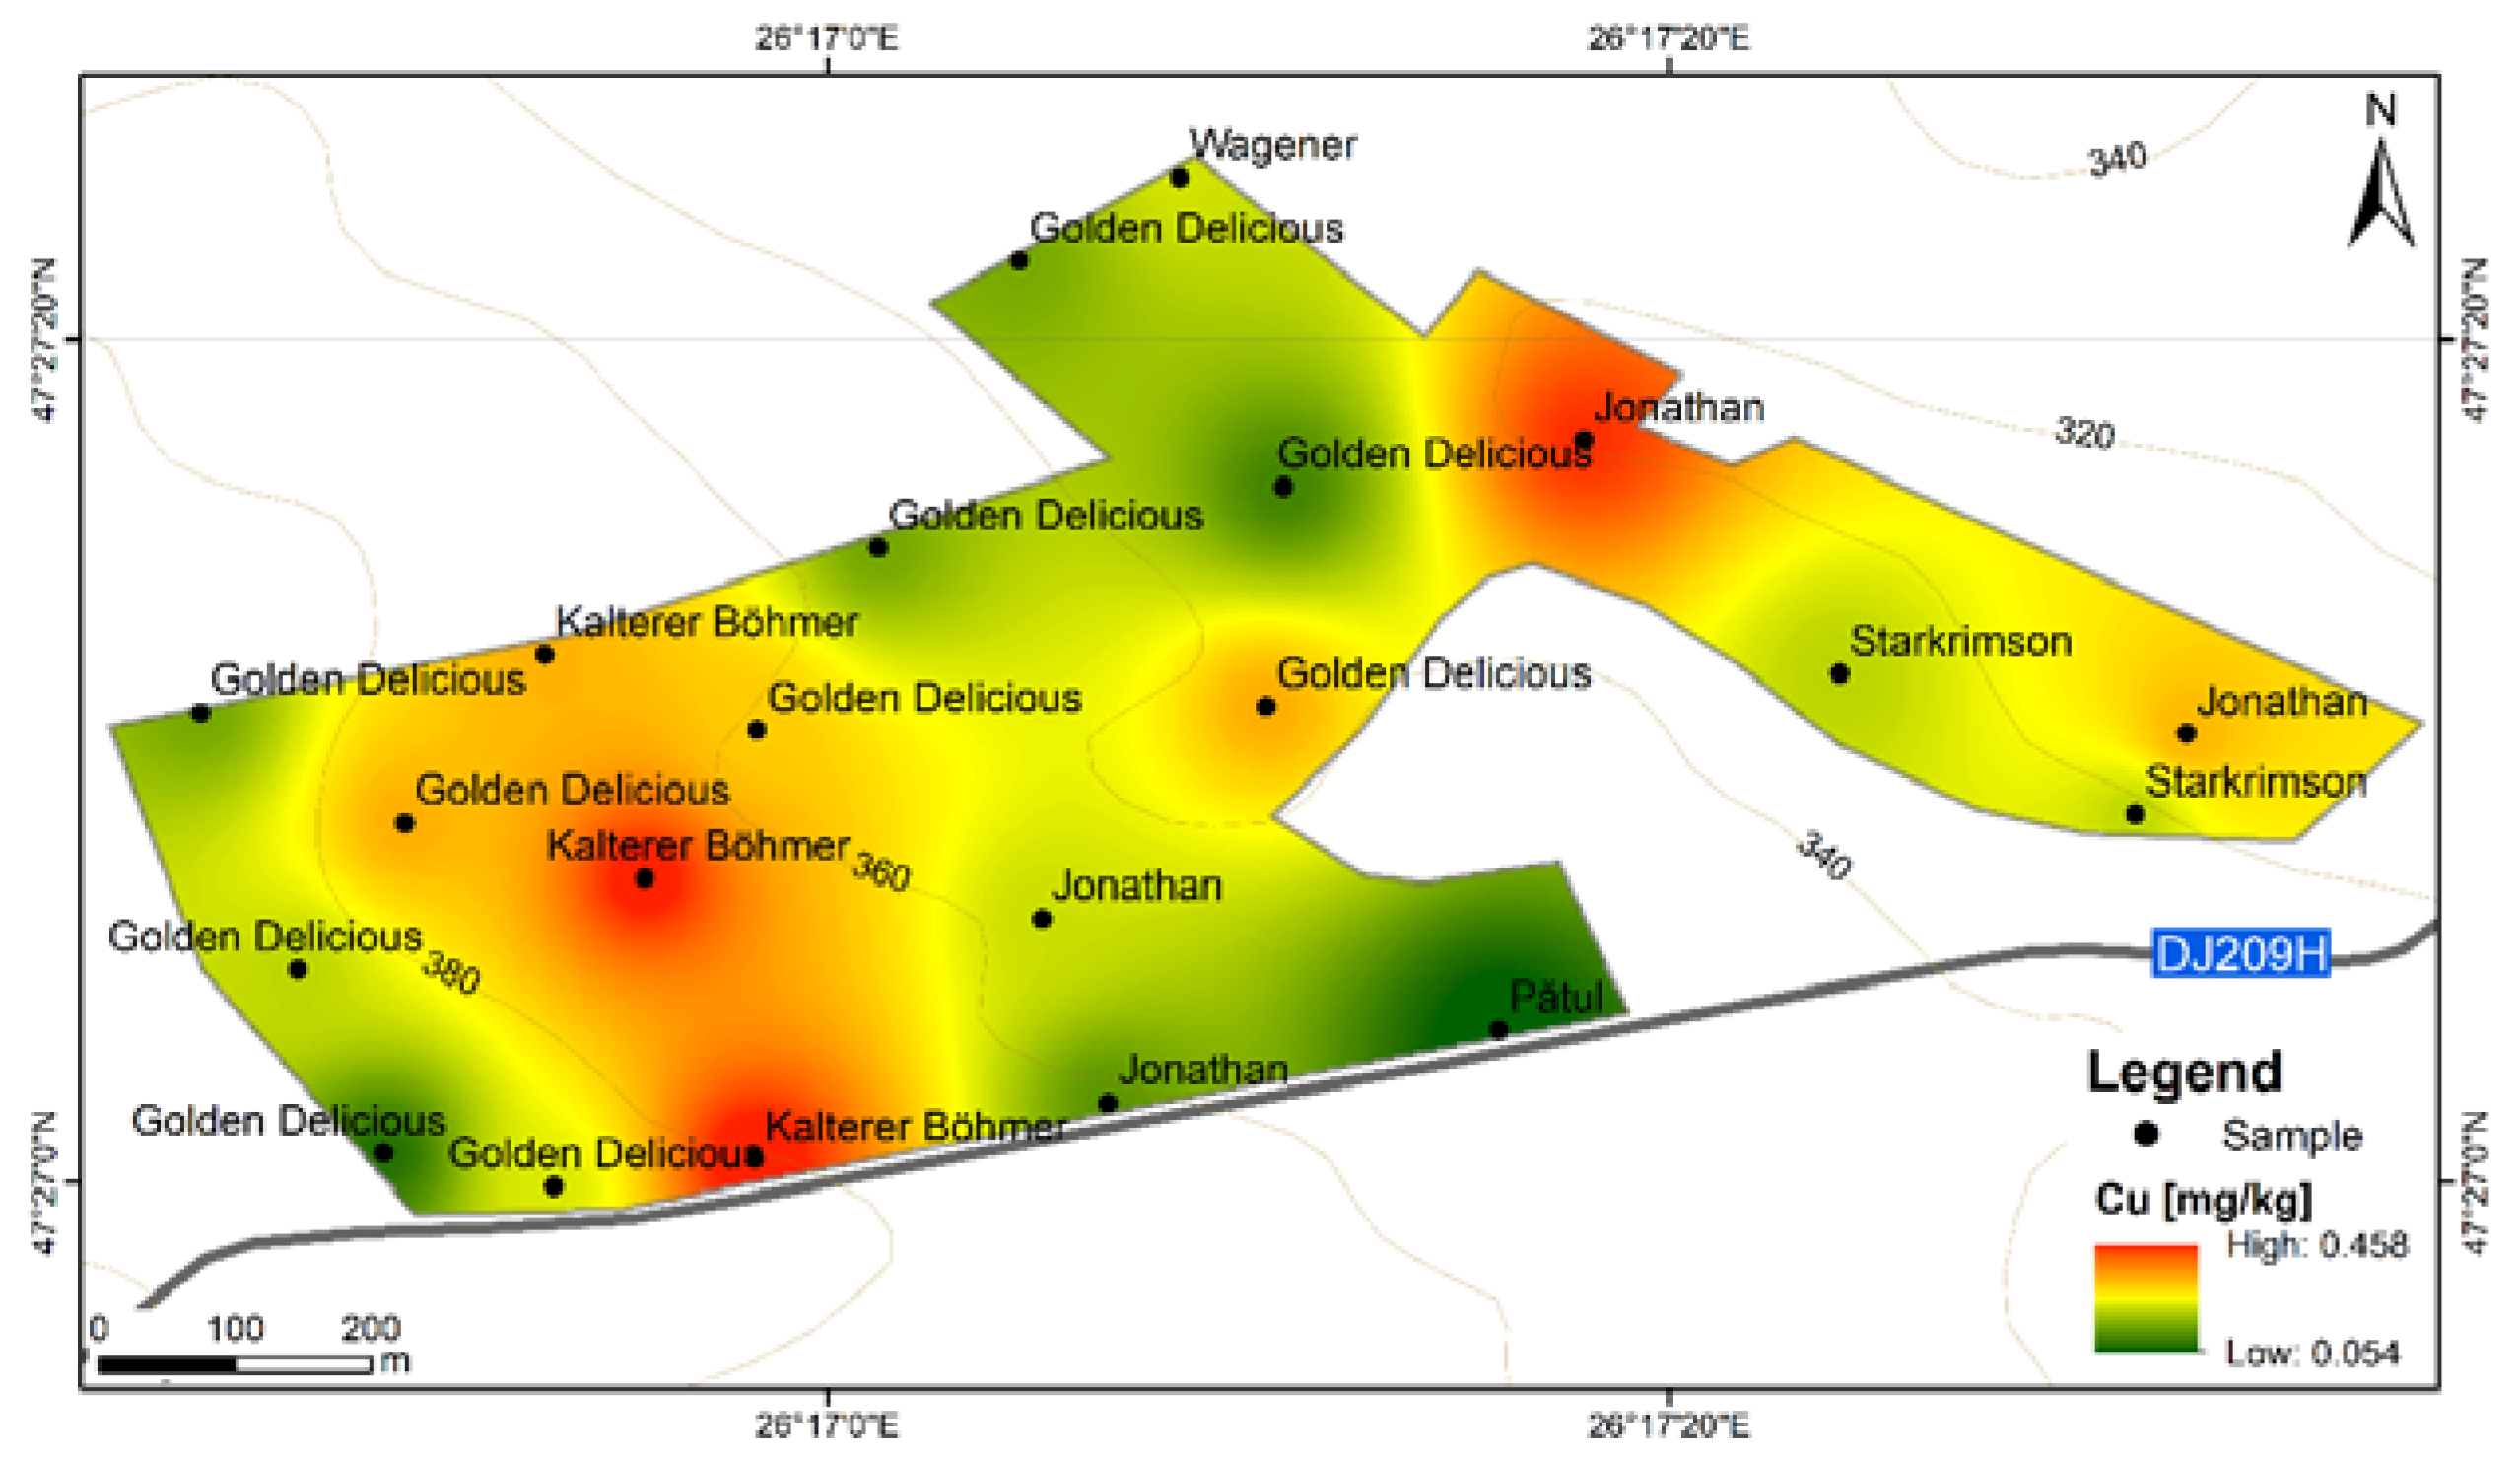
3.2.2. Copper (Cu)
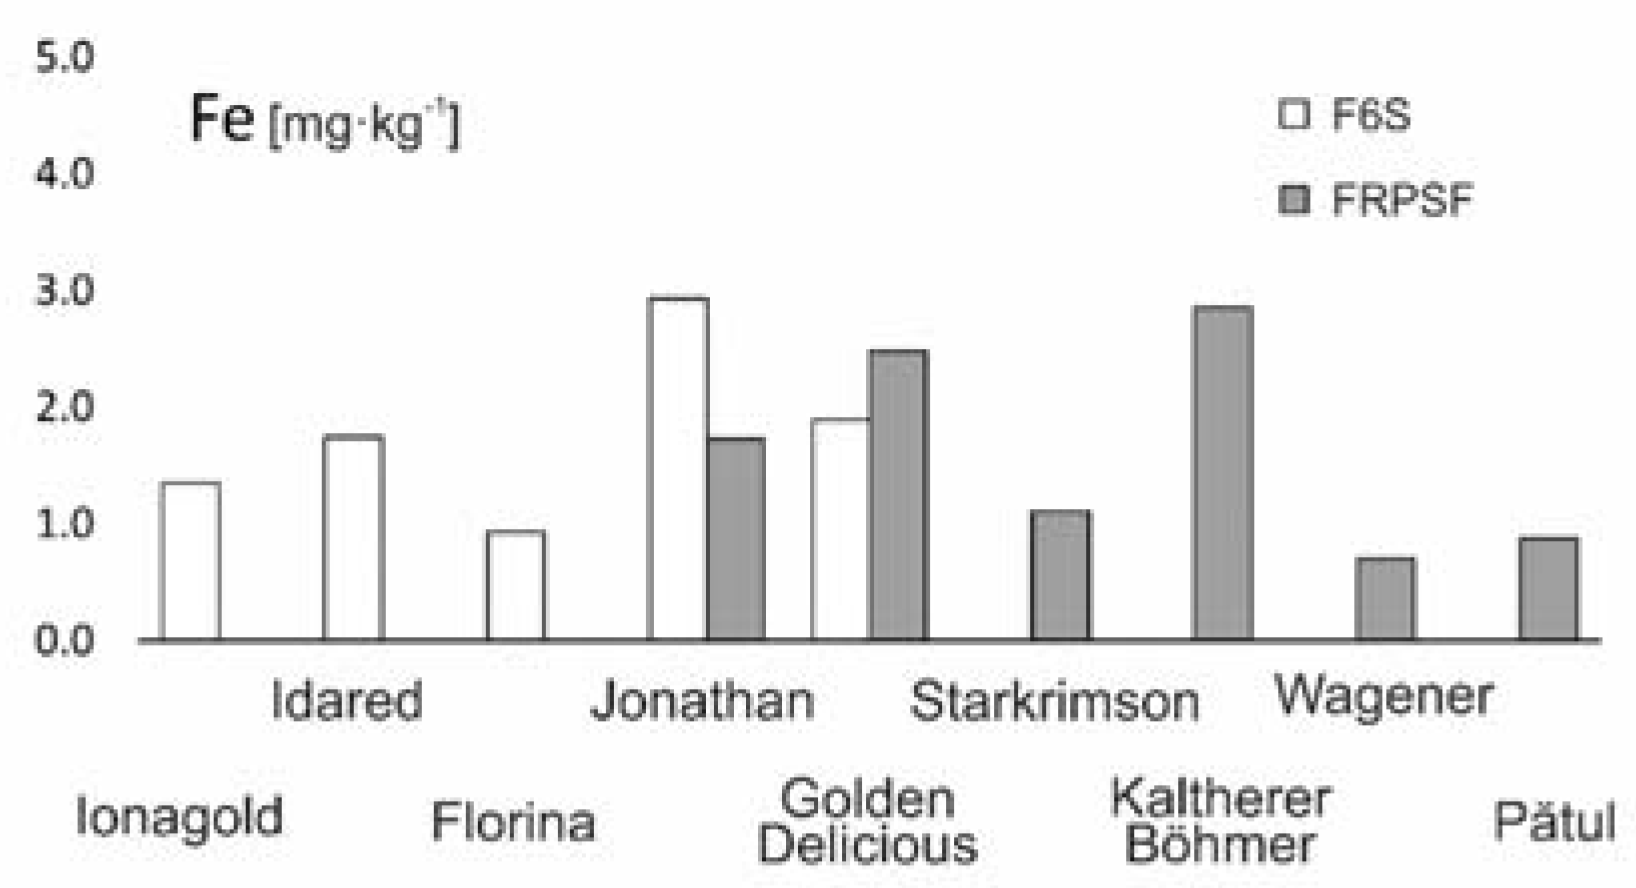
3.2.3. Iron (Fe)
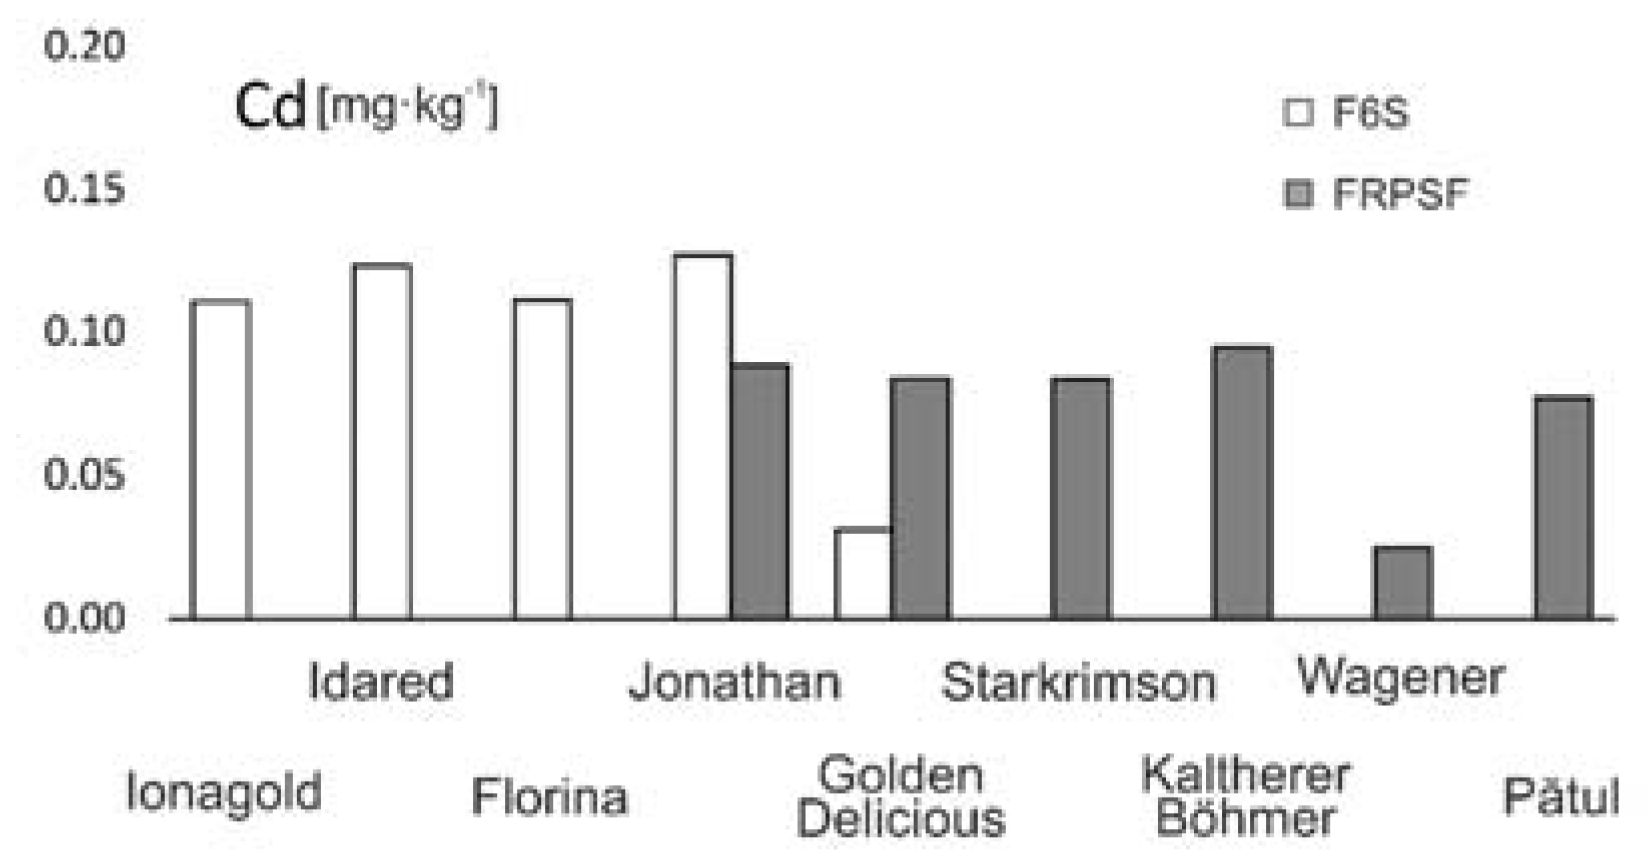
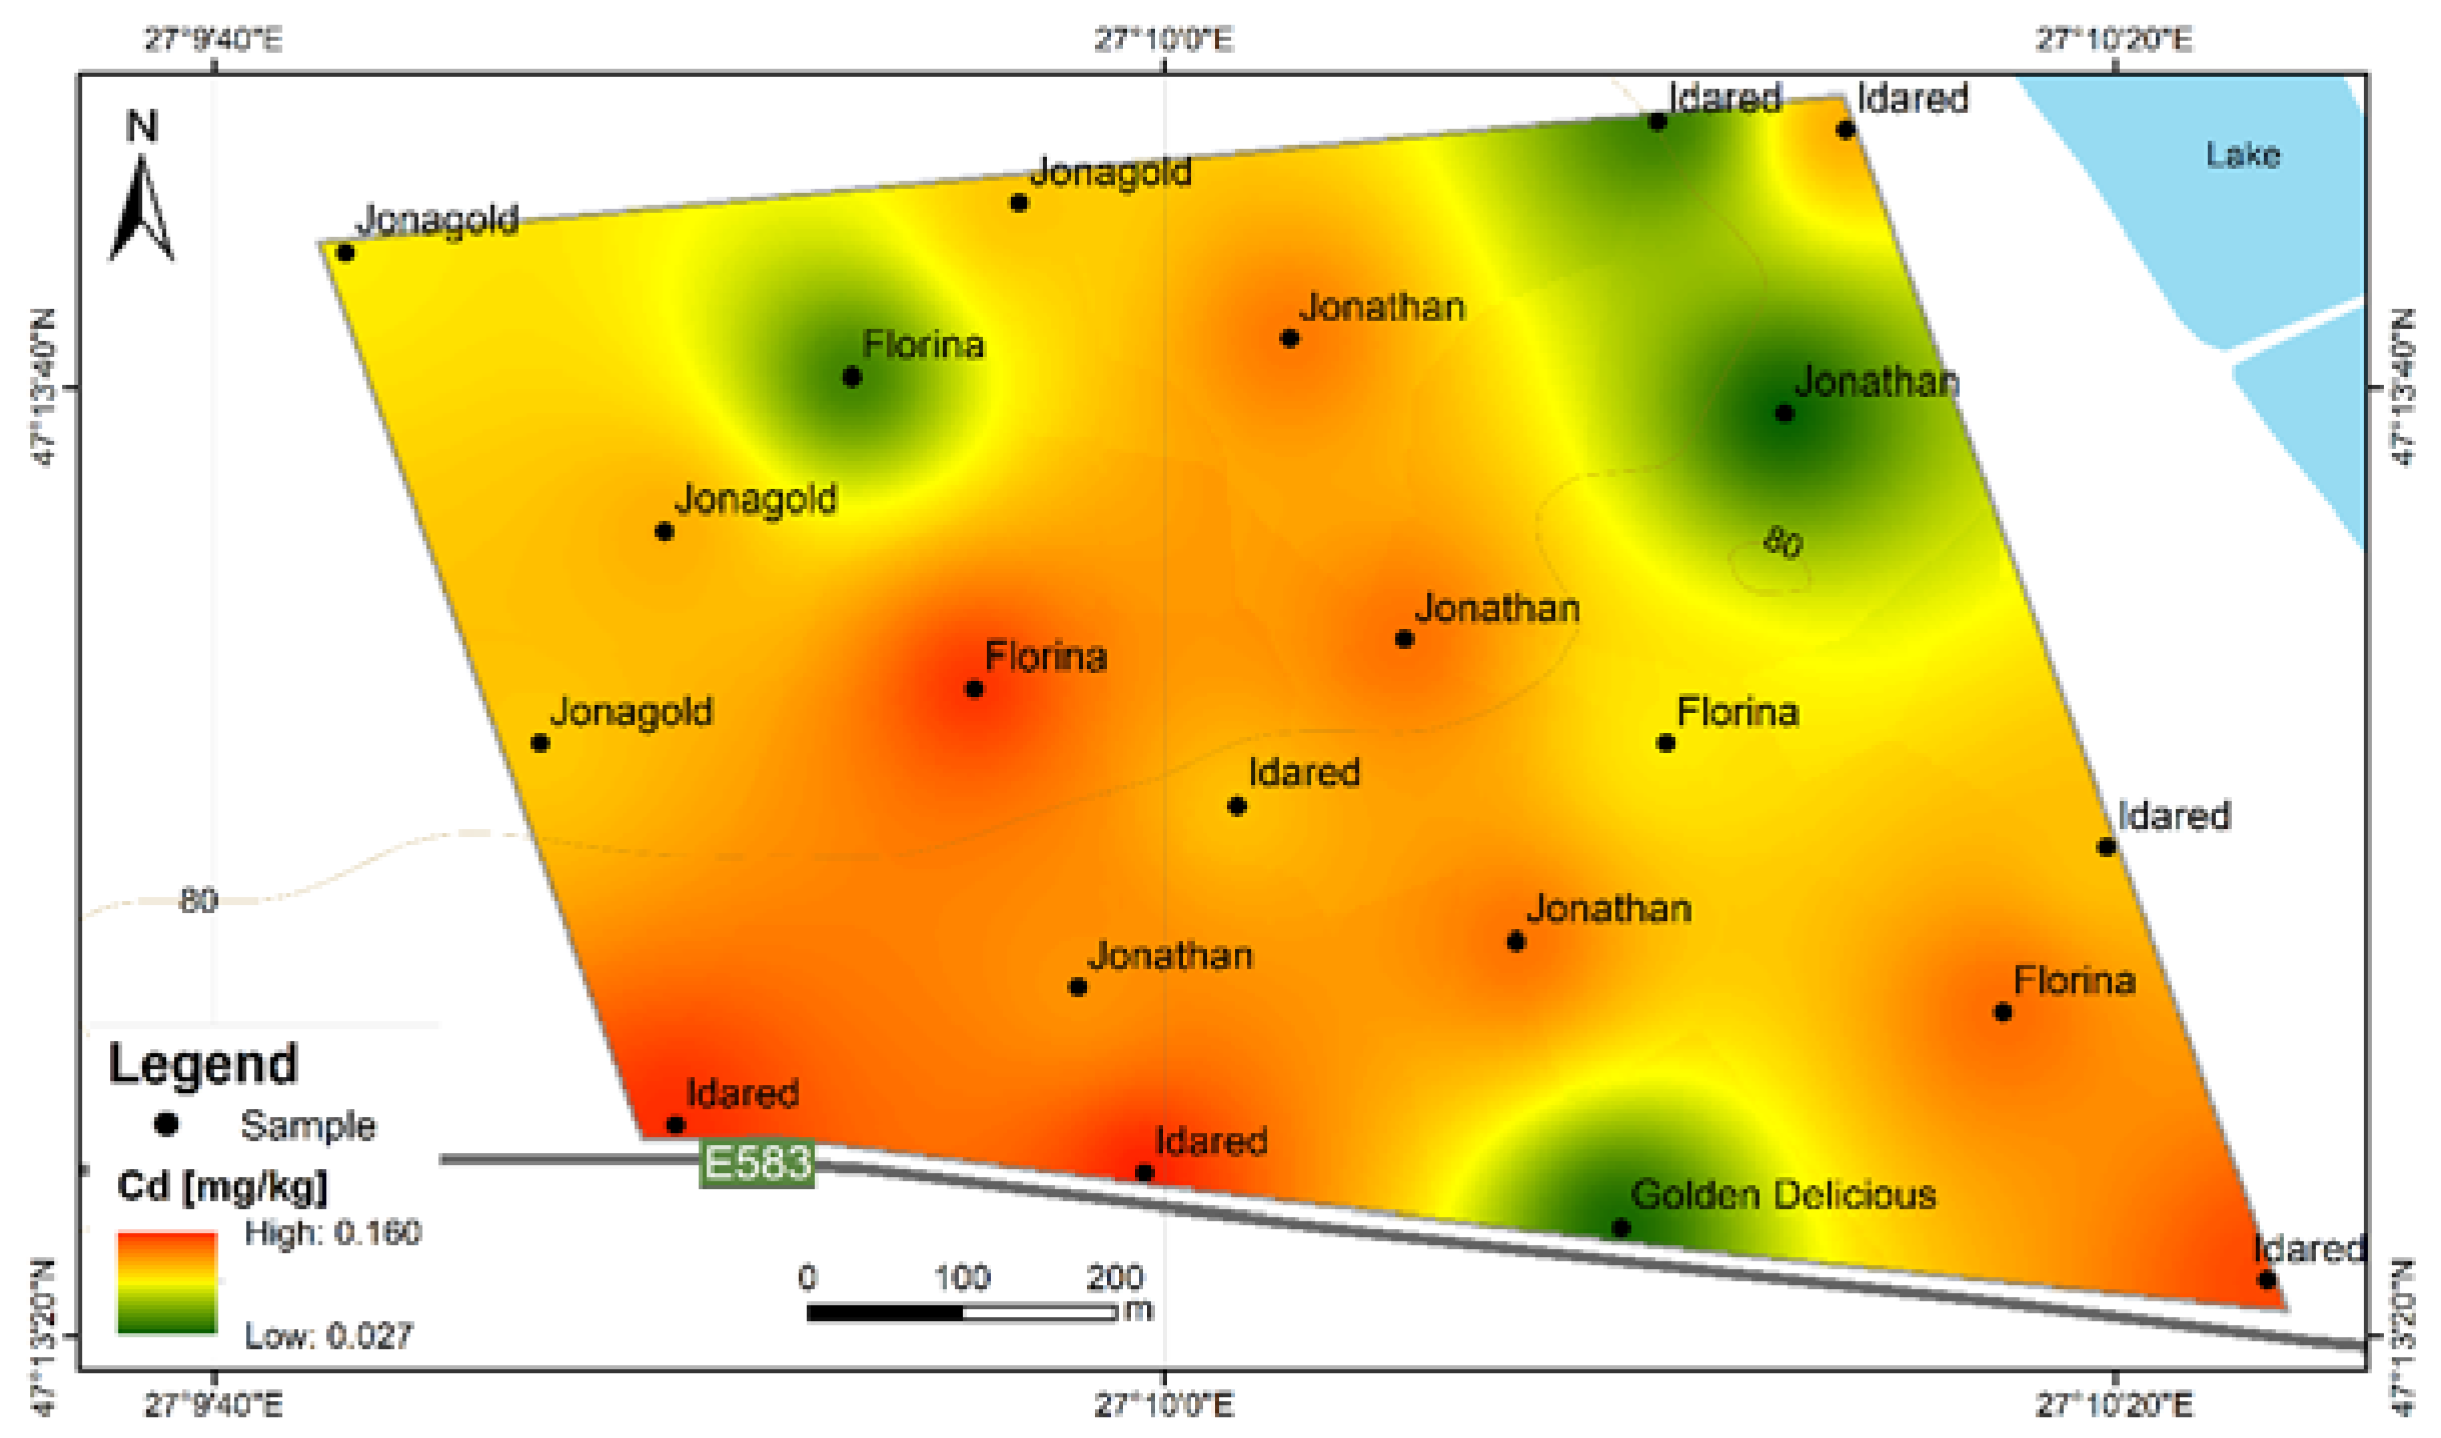
3.2.4. Cadmium (Cd)
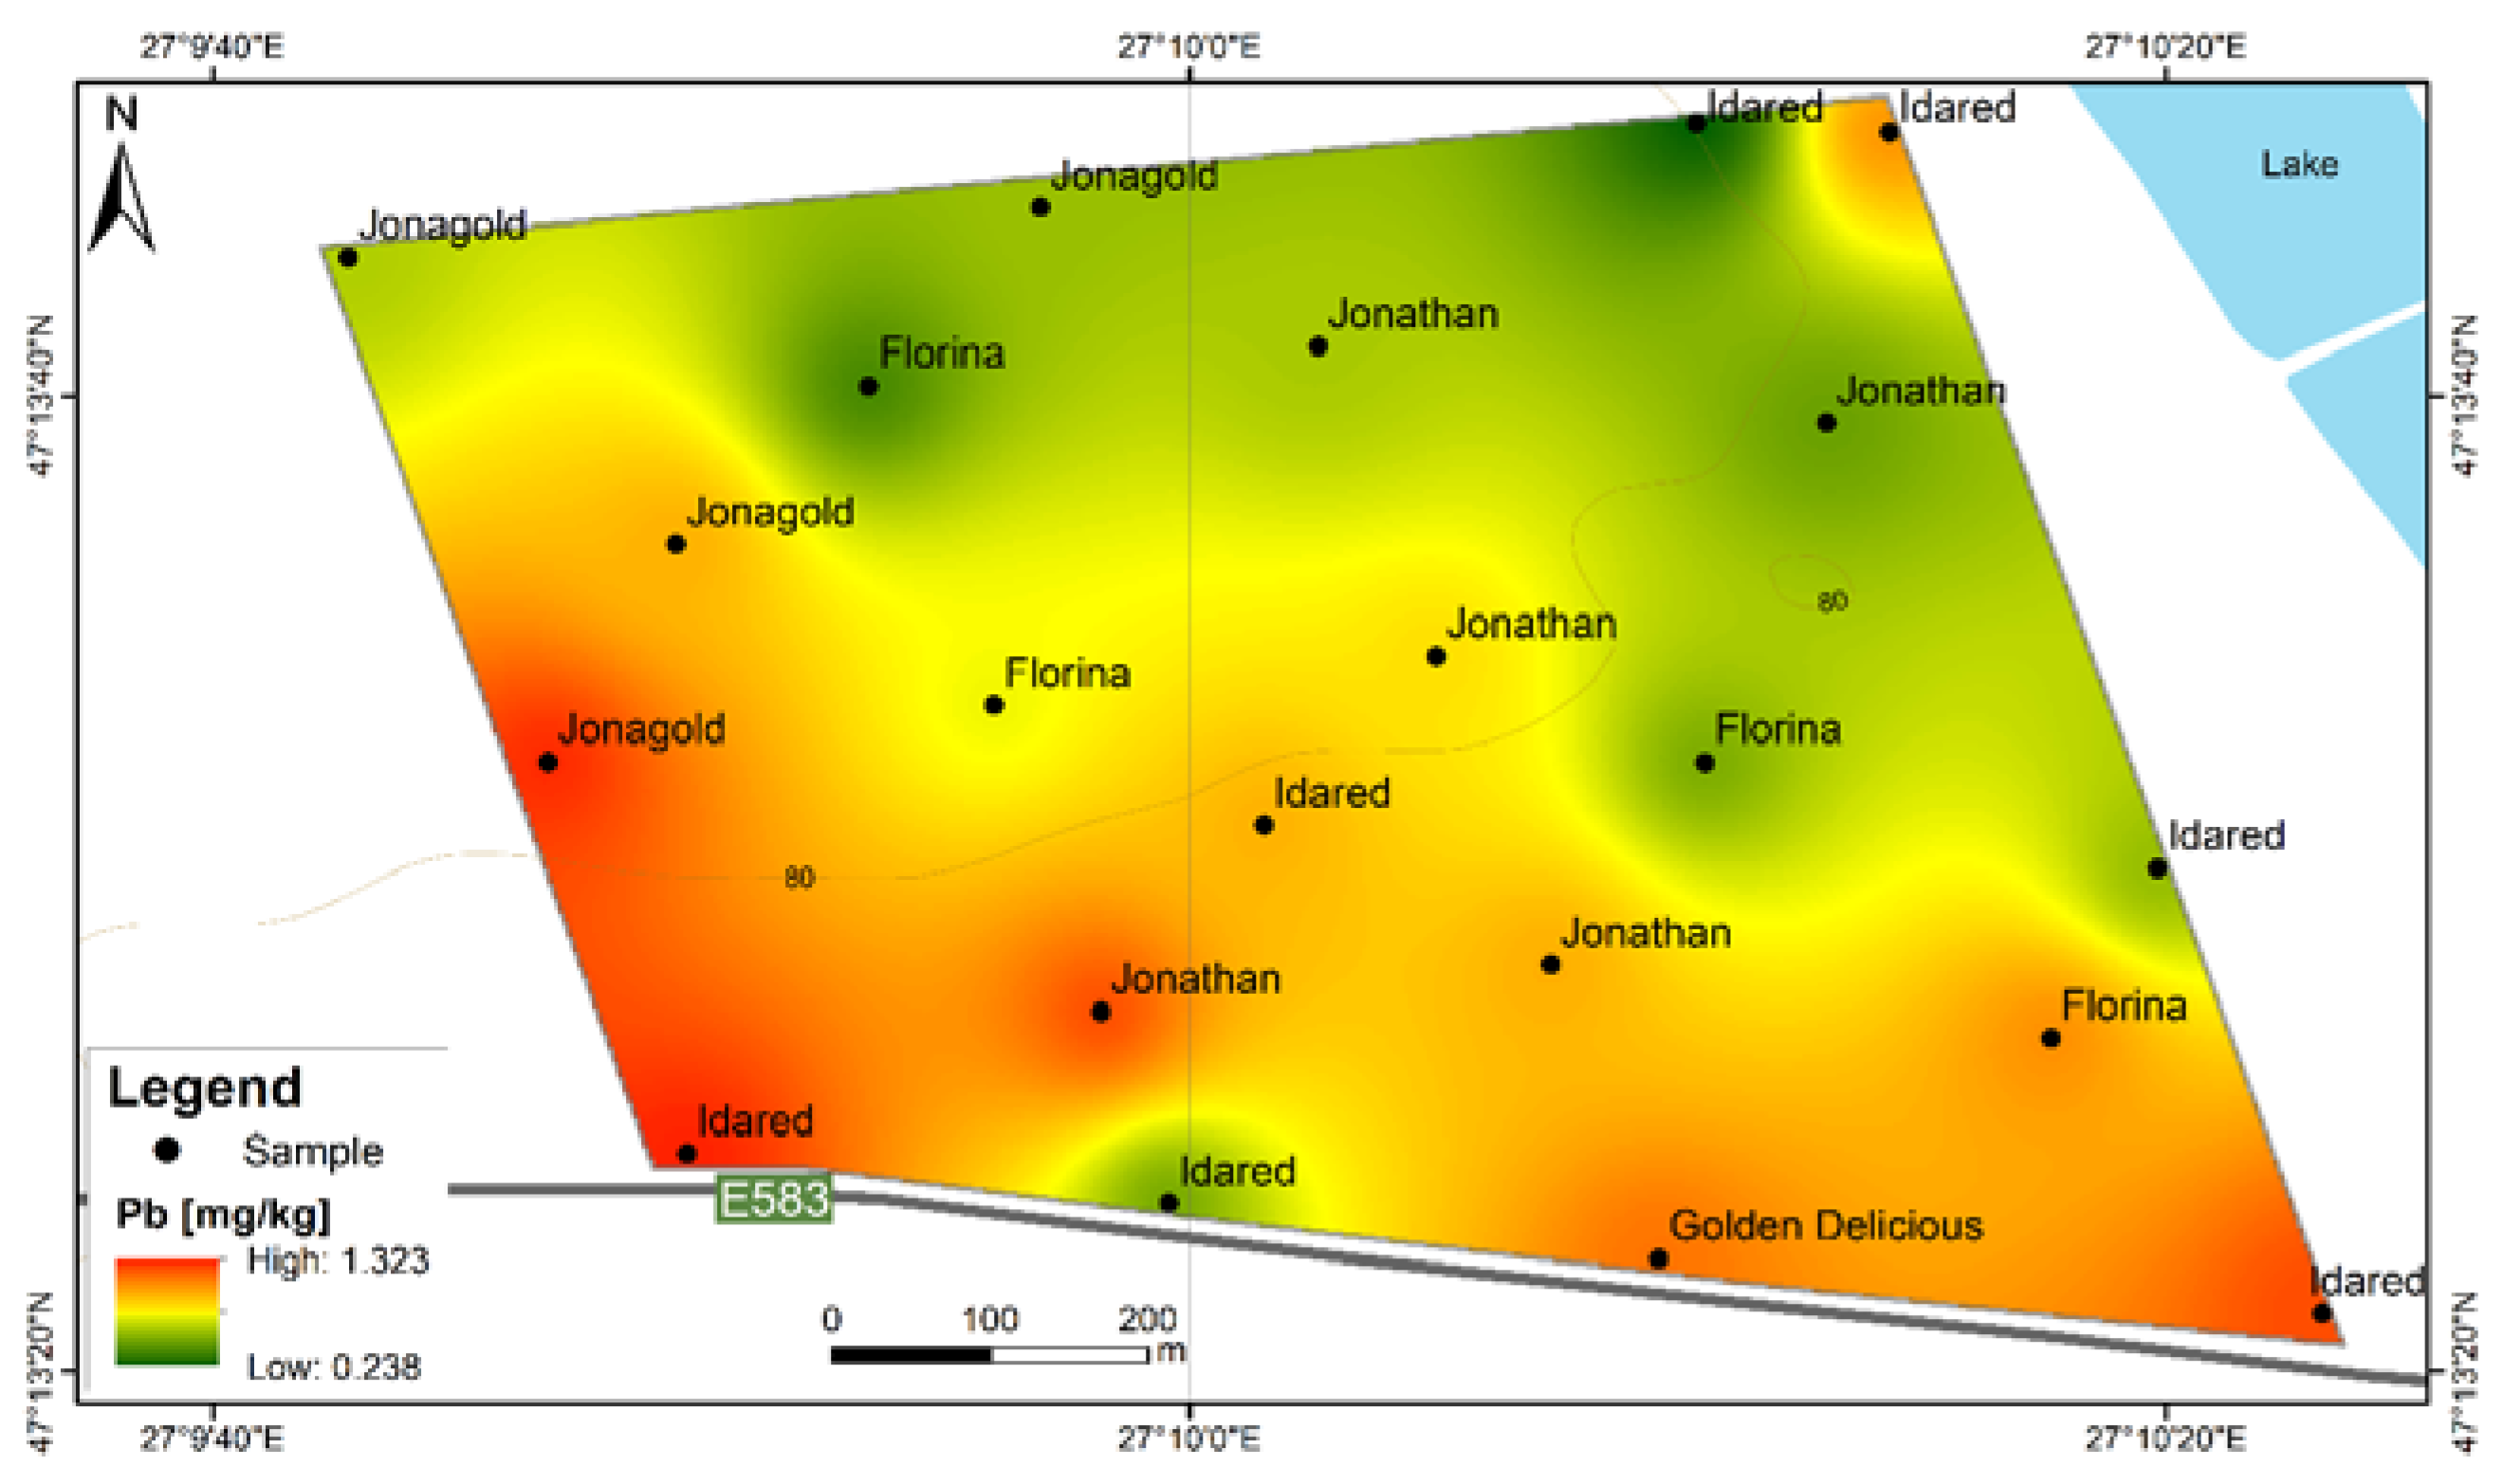
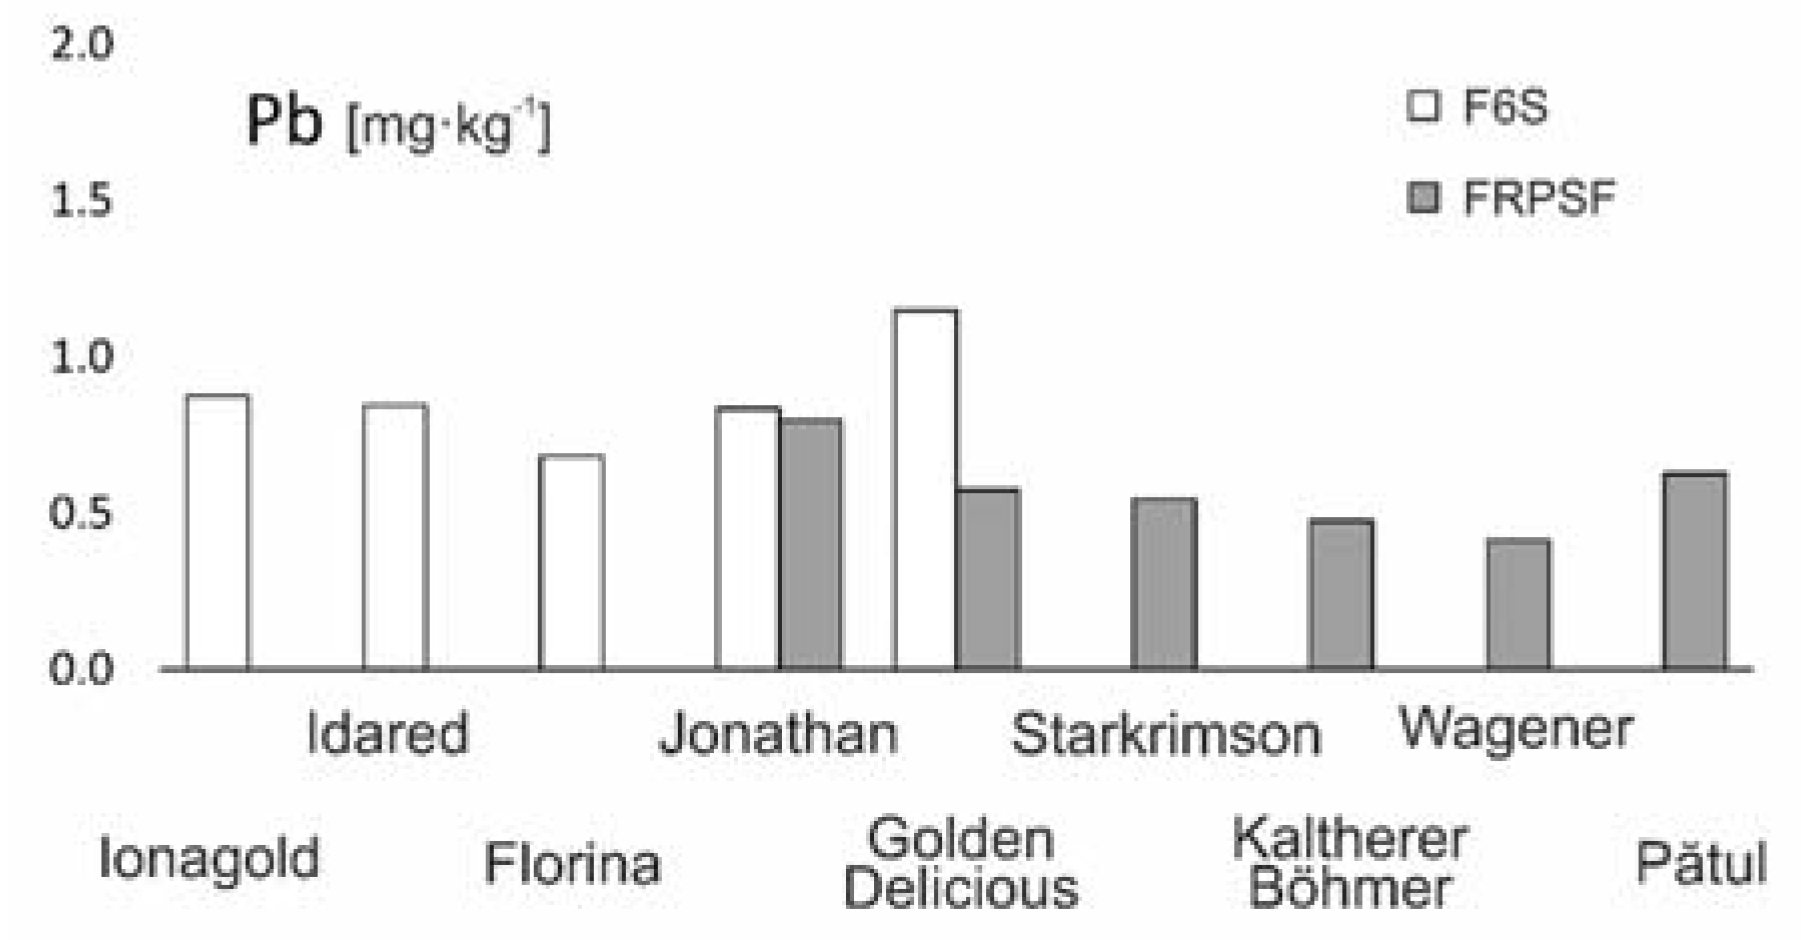
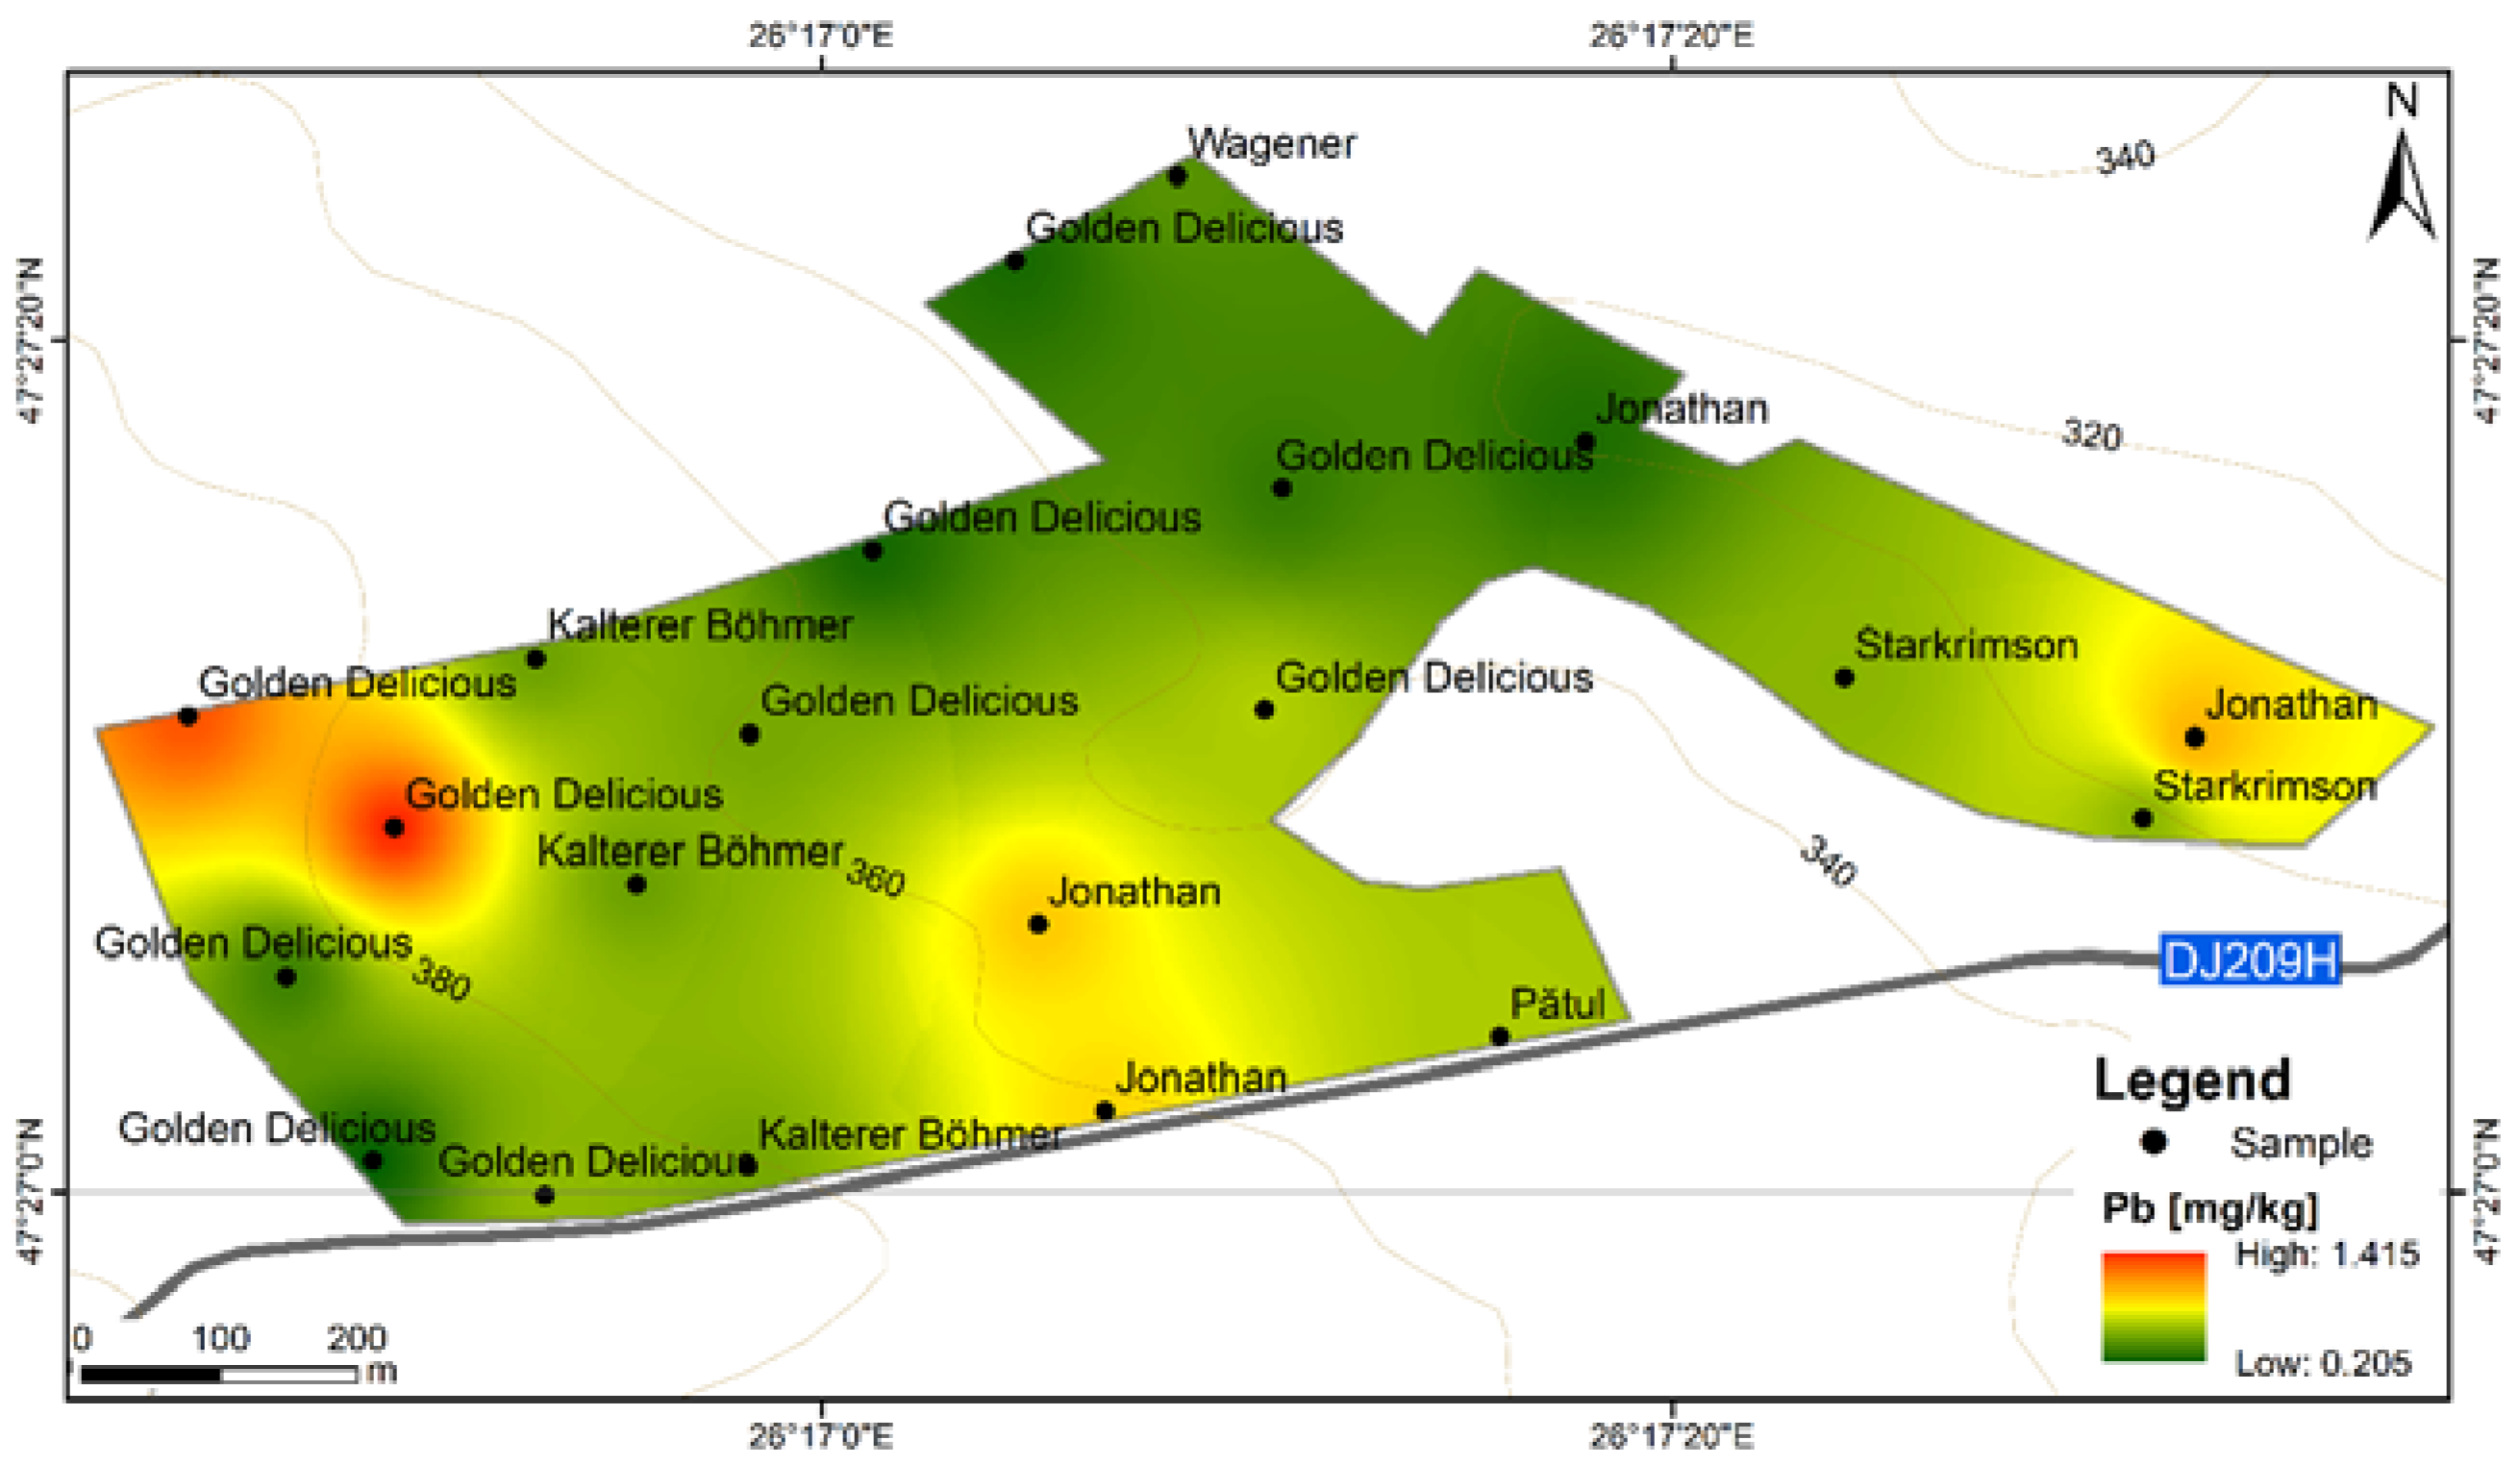
3.2.5. Lead (Pb)
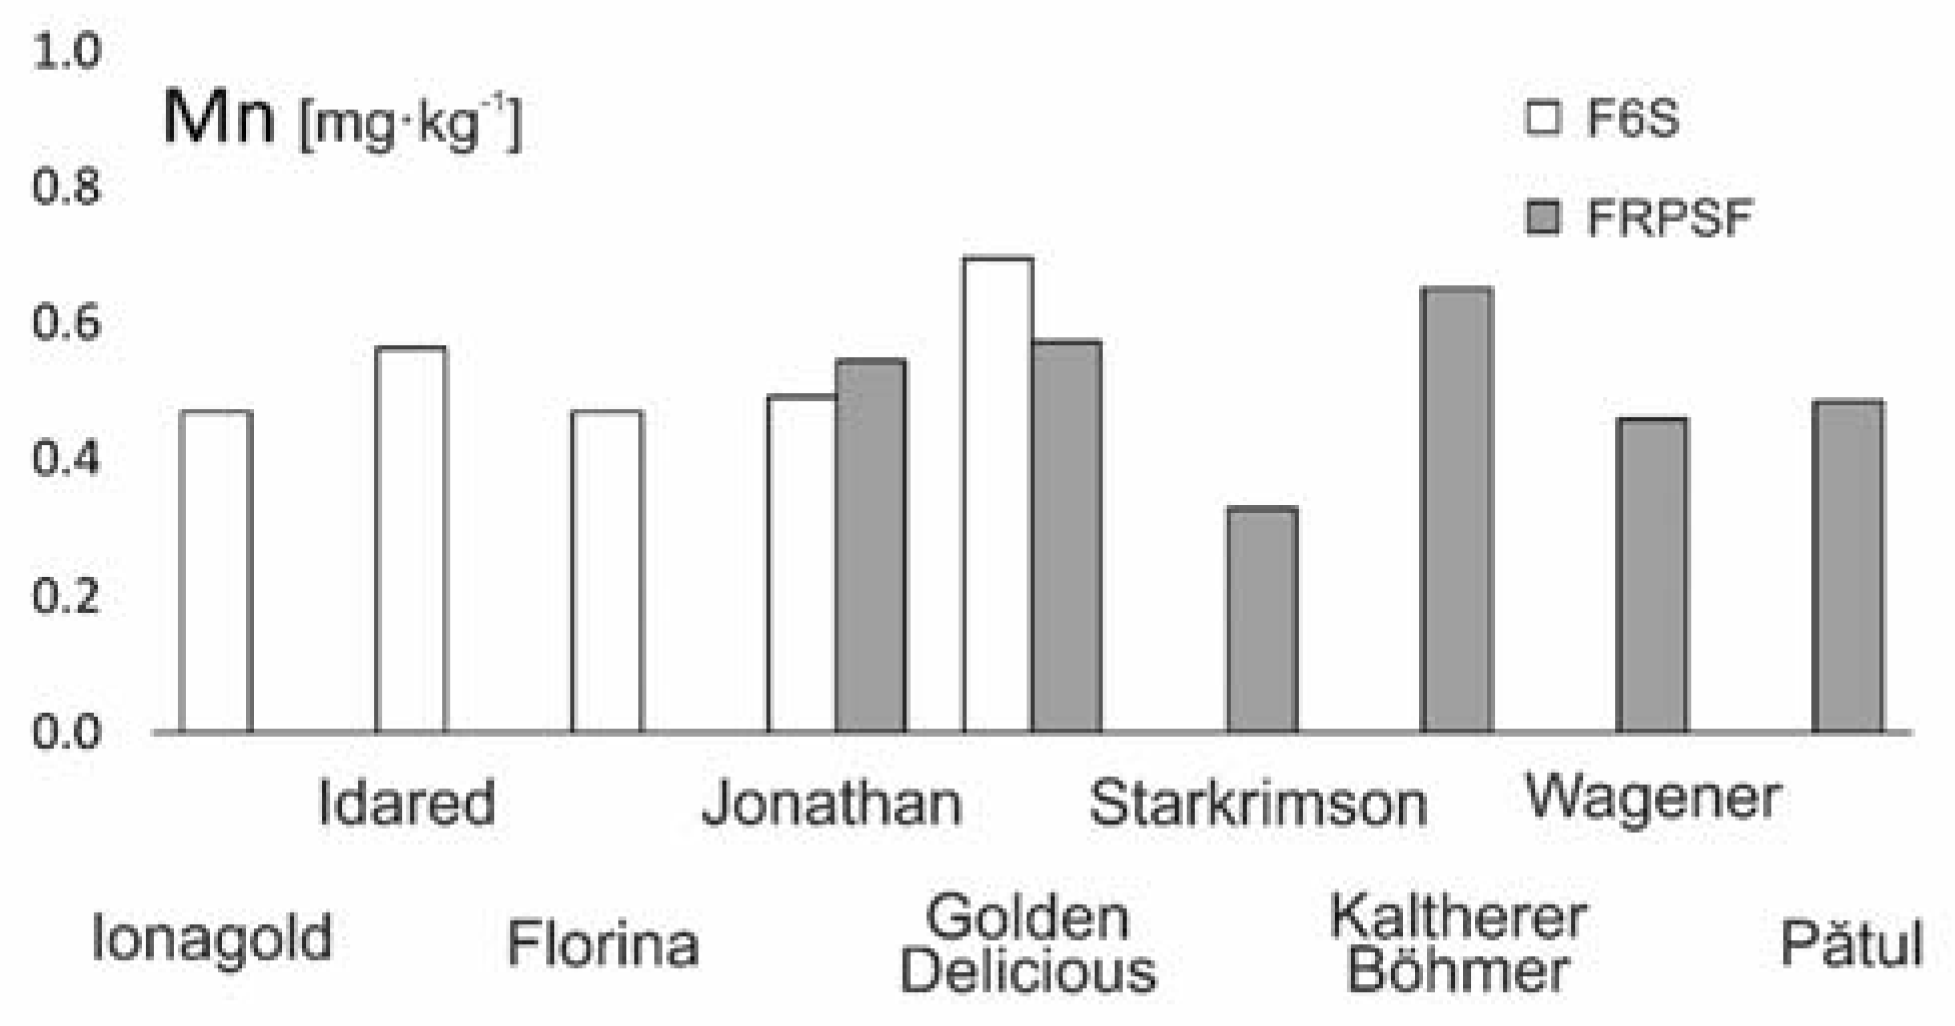
3.2.6. Manganese (Mn)
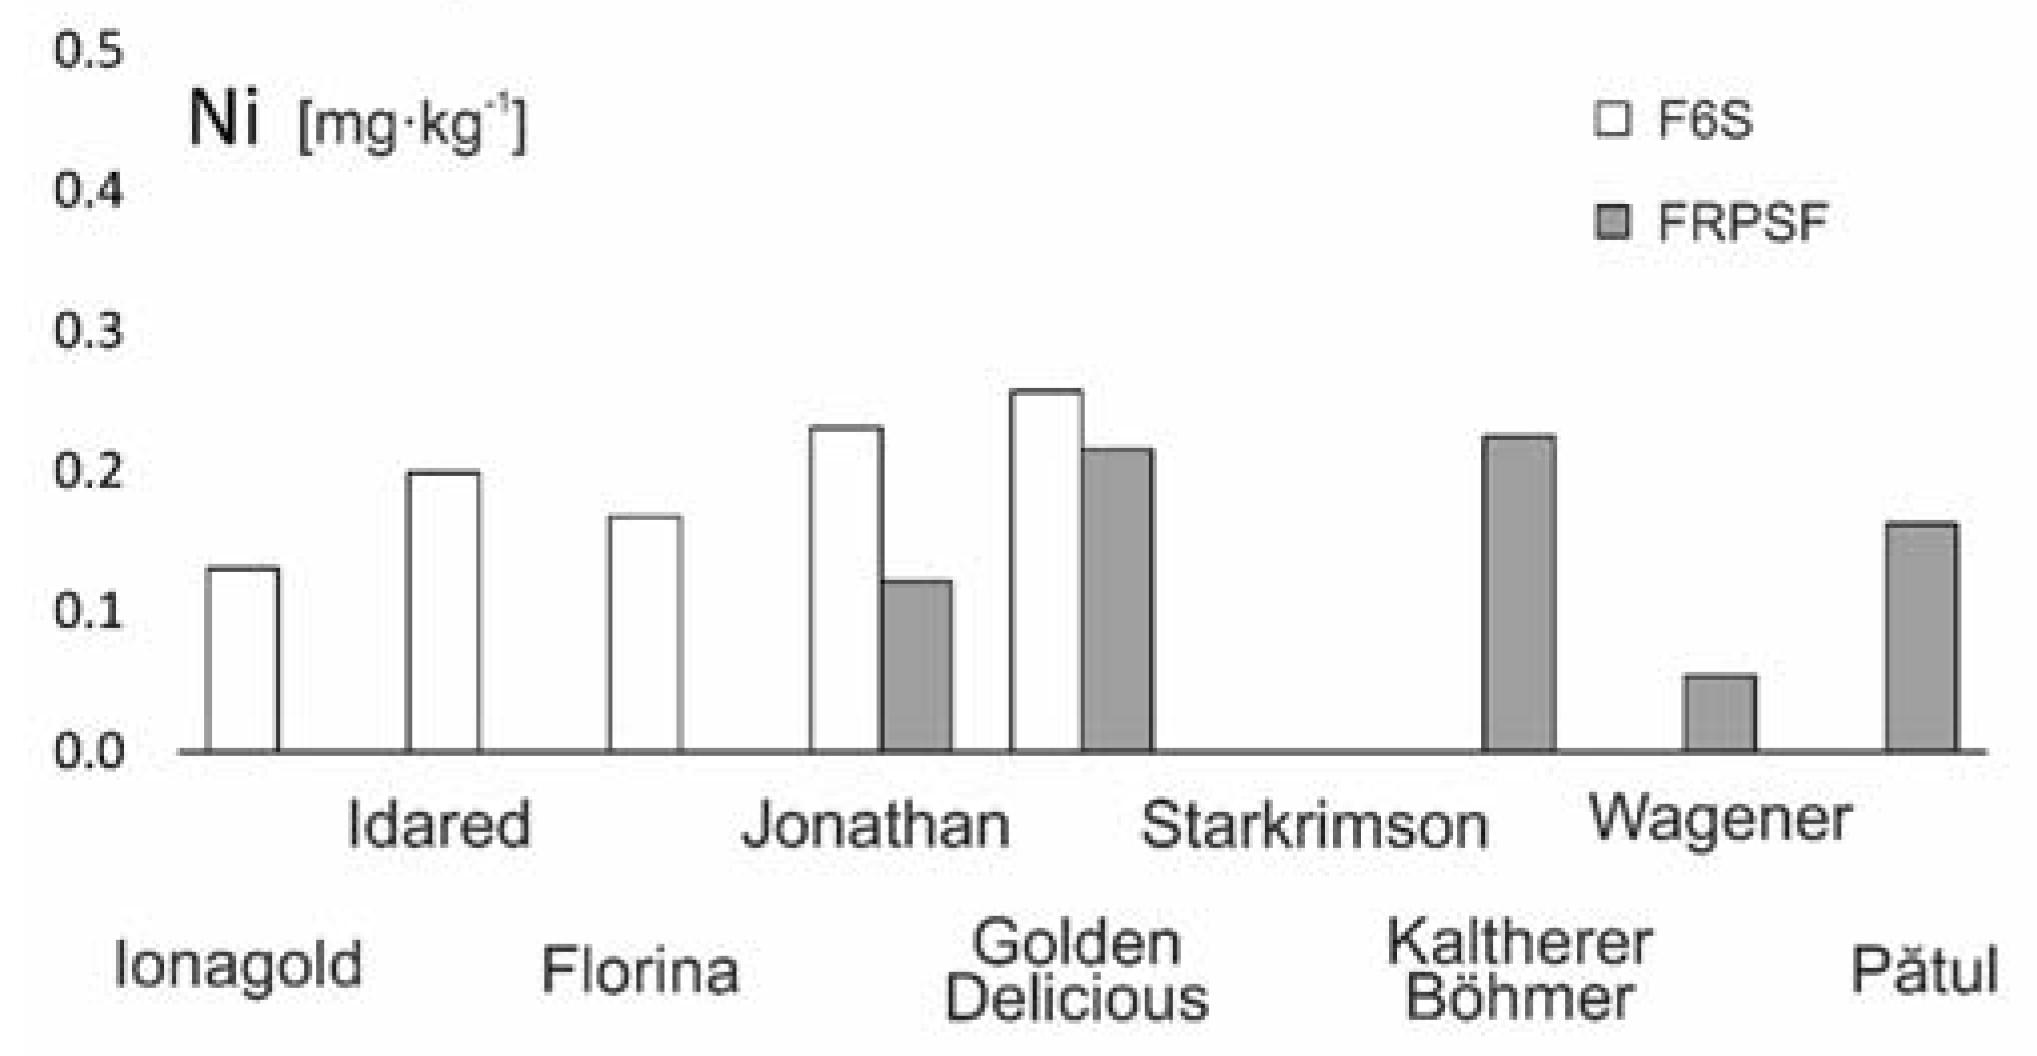
3.2.7. Nickel (Ni)
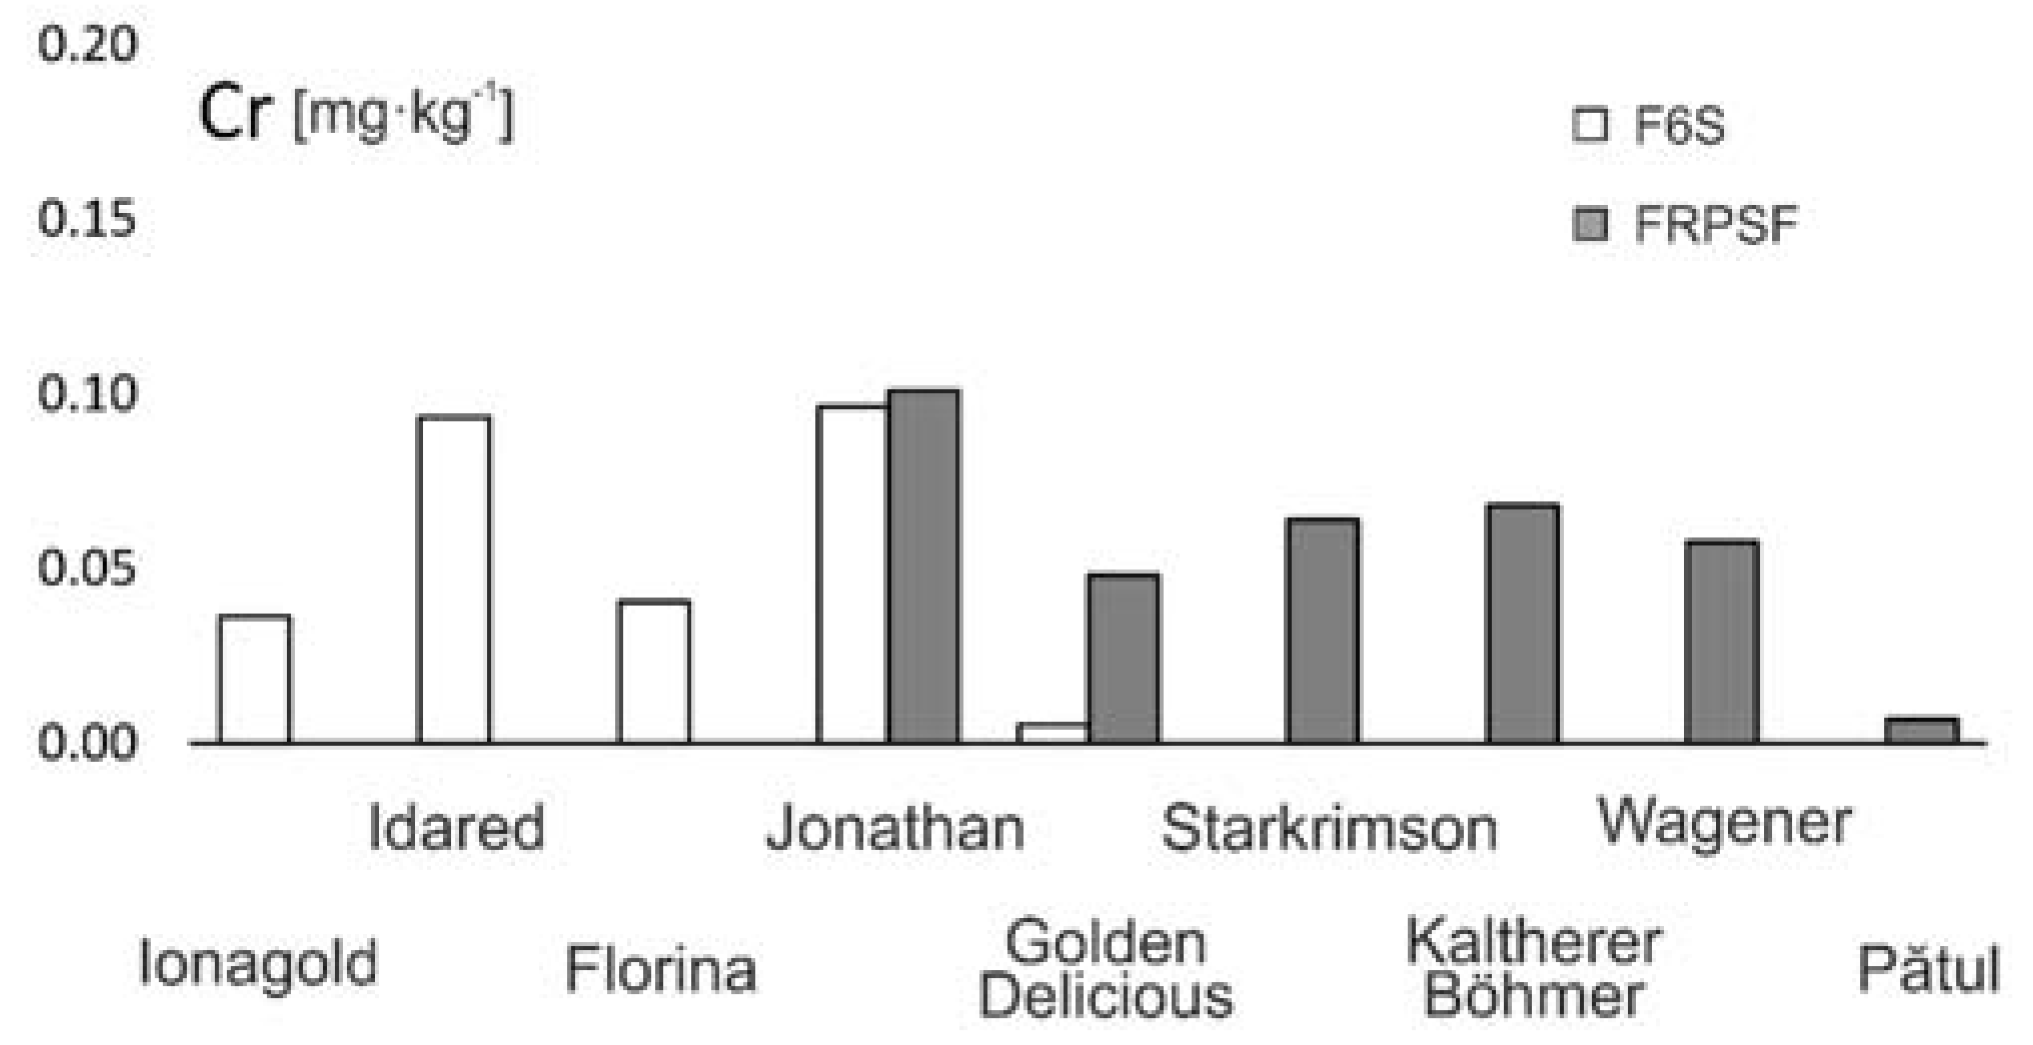
3.2.8. Chromium (Cr)
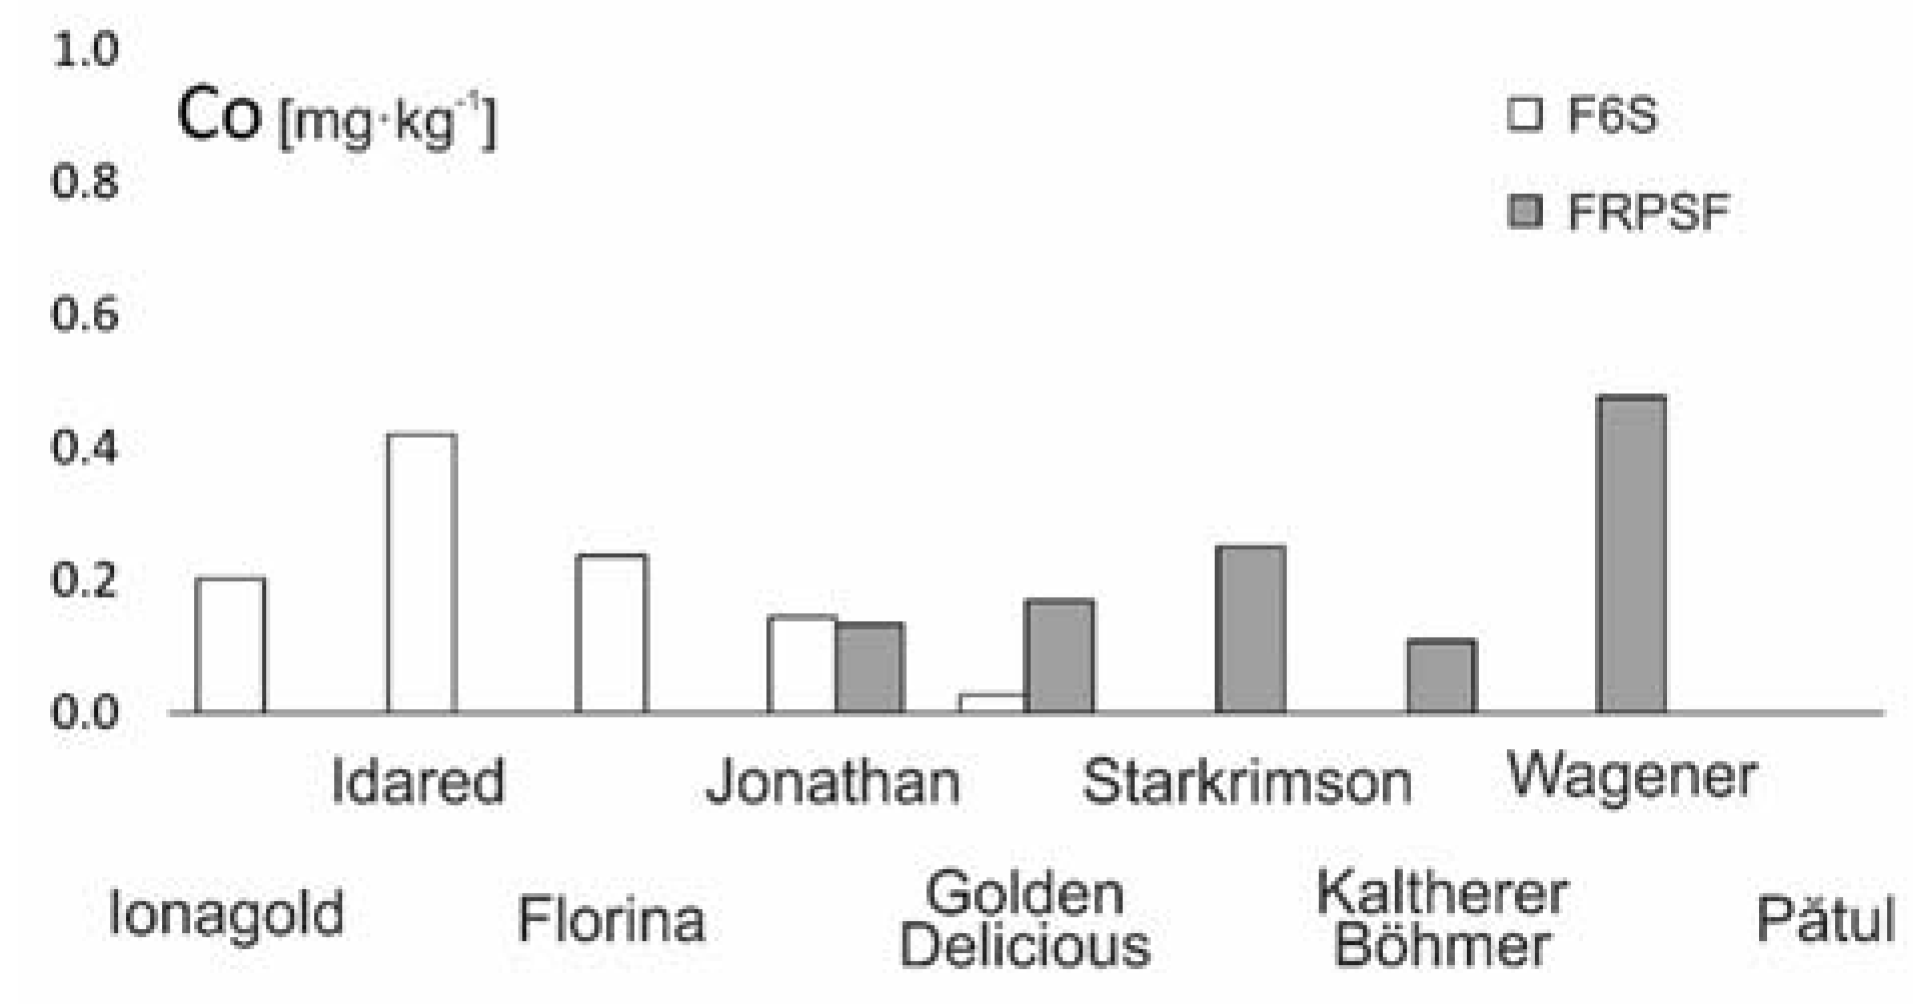
3.2.9. Cobalt (Co)
4. Conclusions
Author Contributions
Funding
Conflicts of Interest
References
- Volk, G.M.; Richards, C.M.; Henk, A.D.; Reilley, A.A.; Reeves, P.A.; Forsline, P.L.; Aldwinckle, H.S. Capturing the Diversity of Wild Malus orientalis from Georgia, Armenia, Russia, and Turkey. J. Am. Soc. Hortic. Sci. 2009, 134, 453–459. [Google Scholar] [CrossRef] [Green Version]
- Food and Agriculture Organization of the United Nations (FAO). Available online: http://www.fao.org/faostat/en/#data/QC (accessed on 14 February 2019).
- Bressy, F.C.; Brito, G.B.; Barbosa, I.S.; Teixeira, L.S.G.; Korn, M.G.A. Determination of trace element concentrations in tomato samples at different stages of maturation by ICP OES and ICP-MS following microwave-assisted digestion. Microchem. J. 2013, 109, 145–149. [Google Scholar] [CrossRef]
- Selinus, O.; Finkelman, R.B.; Centeno, J.A. Principles of Medical Geology. In Encyclopedia of Environmental Health; Nriagu, J.O., Ed.; Elsevier: Amsterdam, The Netherlands, 2011; pp. 669–676. [Google Scholar] [CrossRef]
- Skordas, K.; Papastergios, G.; Filippidis, A. Major and trace element contents in apples from a cultivated area of central Greece. Environ. Monit. Assess. 2013, 185, 8465–8471. [Google Scholar] [CrossRef]
- Gulab, H.; Mahmood, M.; Ali, S.; Jan, F.A. Assessment of heavy metals in various parts of plants, soil and air of some selected areas of district Charsadda, Pakistan. Carpathian J. Earth Environ. Sci. 2015, 10, 219–224. [Google Scholar]
- U.S. Department of Agriculture (USDA). Agricultural Research Service. Food Data Central. Nutrition Tables. Available online: https://fdc.nal.usda.gov (accessed on 28 March 2020).
- Azuma, A.K.; Tomioka, R.; Takenaka, C. Evaluation of microelement contents in Clethra barbinervis as food for human and animals in contrasting geological areas. Environ. Geochem. Health 2016, 38, 437–448. [Google Scholar] [CrossRef]
- Tošić, S.; Alagić, S.; Dimitrijević, M.; Pavlović, A.; Nujkić, M. Plant parts of the apple tree (Malus spp.) as possible indicators of heavy metal pollution. Ambio 2016, 45, 501–512. [Google Scholar] [CrossRef] [Green Version]
- Kabata-Pendias, A. Trace Elements in Soils and Plants, 4th ed.; CRC Press: Boca Raton, FL, USA, 2010; 548p. [Google Scholar] [CrossRef]
- Zhang, F.; Yan, X.; Zeng, C.; Zhang, M.; Shrestha, S.; Devkota, L.P.; Yao, T. Influence of Traffic Activity on Heavy Metal Concentrations of Roadside Farmland Soil in Mountainous Areas. Int. J. Environ. Res. Public Health 2012, 9, 1715–1731. [Google Scholar] [CrossRef] [PubMed] [Green Version]
- Campeanu, G.; Neata, G.; Darjanschi, G. Chemical composition of the fruits of several apple cultivars growth as biological crop. Not. Bot. Horti Agrobot. Cluj-Napoca 2009, 37, 161–164. [Google Scholar]
- Todea, D.; Cadar, O.; Simedru, D.; Roman, C.; Tanaselia, C.; Suatean, I.; Naghiu, A. Determination of major-to-trace minerals and polyphenols in different apple cultivars. Not. Bot. Horti Agrobot. Cluj-Napoca 2014, 42, 523–529. [Google Scholar] [CrossRef] [Green Version]
- Uruioc, S.; Albulescu, M.; Popovici, H. Heavy metals content from different varieties of apples from Banat area and from importation. Anals West Univ. Timis. Ser. Chem. 2008, 17, 45–50. [Google Scholar]
- Prundeanu, I.M.; Chelariu, C.; Balaban, S.I.; Iancu, O.G. Soil mineralogy in two apple-orchards, Fălticeni and Sârca (Moldavian Platform). Analele Stiintifice Univ. Al I Cuza Iasi Ser. Geol. 2016, 62, 5–18. [Google Scholar]
- Prundeanu, I.M.; Iancu, O.G.; Buzgar, N.; Balaban, S.I. Trace elements and the anthropic influence on their distribution in soils from apple orchards, Falticeni and Sarca fruit-growing areas (Romania). Carpathian J. Earth Environ. Sci. 2013, 8, 123–132. [Google Scholar]
- European Apple & Pear Crop Forecast. World Apple and Pear Association (WAPA), 2018. Available online: http://members.swissfruit.ch/system/files/2018-08/001.%20European-Apple-Pear-Crop-Forecast-FINAL_0.pdf (accessed on 11 May 2019).
- Ionesi, L. The Geology of Platform Units and North-Dobrogea Orogeny; Tehnică: Bucureşti, Romania, 1994; pp. 20–55. 279p. (In Romanian) [Google Scholar]
- Bizjak Bat, K.; Eler, K.; Mazej, D.; Mozetič Vodopivec, B.; Mulič, I.; Kump, P.; Ogrinc, N. Isotopic and elemental characterisation of Slovenian apple juice according to geographical origin: Preliminary results. Food Chem. 2016, 203, 86–94. [Google Scholar] [CrossRef]
- Fernández-Jalao, I.; Sánchez-Moreno, C.; De Ancos, B. Effect of high-pressure processing on flavonoids, hydroxycinnamic acids, dihydrochalcones and antioxidant activity of apple ‘Golden Delicious’ from different geographical origin. Innov. Food Sci. Emerg. Technol. 2019, 51, 20–31. [Google Scholar] [CrossRef]
- Grembecka, M.; Szefer, P. Comparative assessment of essential and heavy metals in fruits from different geographical origins. Environ. Monit. Assess. 2013, 185, 9139–9160. [Google Scholar] [CrossRef] [Green Version]
- Order 293/2001. The Official Gazette of Romania. Regulations about the conditions of security and quality for fresh vegetables and fruits intended for human consumption. (In Romanian)
- Order 103/2003. The Official Gazette of Romania. Regulations about the conditions of security and quality for fresh vegetables and fruits intended for human consumption. (In Romanian)
- Kabata-Pendias, A.; Szteke, B. Trace Elements in Abiotic and Biotic Environments, 1st ed.; CRC Press: Boca Raton, FL, USA, 2015; 468p. [Google Scholar] [CrossRef]
- Salminen, R.; Batista, M.J.; Bidovec, M.D.; Demetriades, A.; De Vivo, B.; De Vos, W.; Duris, M.; Gilucis, A.; Gregorauskiene, V.; Halamic, J.; et al. Part 1—Background information, methodology and maps. In Geochemical Atlas of Europe; De Vos, W., Tarvainen, T., Eds.; Geological Survey of Finland: Espoo, Finland, 2005; 524p. [Google Scholar]
- European Food Safety Authority (EFSA). Scientific Committee on Food. Tolerable Upper Intake Levels for Vitamins and Minerals. 2006. Available online: http://www.efsa.europa.eu/sites/default/files/efsa_rep/blobserver_assets/ndatolerableuil.pdf (accessed on 28 March 2020).
- Campeanu, G.; Neaţa, G.; Darjananschi, G.; Stan, R. Tree and fruit characteristics of various apple genotypes obtained through mutagenesis. Not. Bot. Horti Agrobot. Cluj-Napoca 2010, 38, 248–251. [Google Scholar]
- Bednarek, W.; Tkaczyk, P.; Dresler, S. Contents of heavy metals as a criterion for apple quality assessment and soil properties. Pol. J. Soil Sci. 2007, 40, 47–56. [Google Scholar]
- Zachwieja, Z.; Piotrowicz, J.; Folta, M.; Barton, H.; Gorinstein, S.; Zemser, M.; Traktenberg, S. Distribution of Trace Elements and Minerals in Pulp and Peel of Apples and of Persimmons. In Trace Elements in Man and Animals 10; Roussel, A.M., Anderson, R.A., Favrier, A.E., Eds.; Springer: Boston, MA, USA, 2002; pp. 242–243. [Google Scholar] [CrossRef]
- Alagić, S.; Tošić, S.B.; Dimitrijević, M.D.; Petrović, J.V.; Medić, D.V. Chemometric evaluation of trace metals in Prunus persica L. Batech and Malus domestica from Minićevo (Serbia). Food Chem. 2017, 217, 568–575. [Google Scholar] [CrossRef]
- Winther, M.; Slentø, E. Heavy Metal Emissions for Danish Road Transport; NERI Technical Report No. 780; Aarhus Universitet: Roskilde, Denmark, 2010. [Google Scholar]
- Li, W.; Zhang, M.; Shu, H. Distribution and Fractionation of Copper in Soils of Apple Orchards State-of-Art in China: Research Progress Copper in Soils of Apple Orchards. Environ. Sci. Pollut. Res. 2005, 12, 168–172. [Google Scholar] [CrossRef]
- Jackson, J.E. Biology of Apples and Pears; Cambridge University Press: Cambridge, UK, 2005; 504p. [Google Scholar] [CrossRef]
- Juranović Cindrić, I.; Krizman, I.; Zeiner, M.; Kampić, Š.; Medunić, G.; Stingeder, G. ICP-AES determination of minor- and major elements in apples after microwave assisted digestion. Food Chem. 2012, 135, 2675–2680. [Google Scholar] [CrossRef]
- Roussos, P.A.; Gasparatos, D. Apple tree growth and overall fruit quality under organic and conventional orchard management. Sci. Hortic. 2009, 123, 247–252. [Google Scholar] [CrossRef]
- Elbagermi, M.A.; Edwards, H.G.M.; Alajtal, A.I. Monitoring of Heavy Metal Content in Fruits and Vegetables Collected from Production and Market Sites in the Misurata Area of Libya. ISRN Anal. Chem. 2012, 1–5. [Google Scholar] [CrossRef] [Green Version]
- Waheed, S.; Siddique, N.; Rahman, A.; Zaidi, J.H.; Ahmad, S. INAA for dietary assessment of essential and other trace elements in fourteen fruits harvested and consumed in Pakistan. J. Radioanal. Nucl. Chem. 2004, 260, 523–531. [Google Scholar] [CrossRef]
- Feliciano, R.P.; Antunes, C.; Ramos, A.; Serra, A.T.; Figueira, M.E.; Duarte, C.M.M.; De Carvalho, A.; Bronze, M.R. Characterization of traditional and exotic apple varieties from Portugal. Part 1—Nutritional, phytochemical and sensory evaluation. J. Funct. Foods 2010, 2, 35–45. [Google Scholar] [CrossRef]
- Živković, J.; Šavikin, K.; Zdunić, G.; Doječinović, B.; Menković, N. Phenolic and mineral profile of Balkan indigenous apple and pear cultivars. J. Serb. Chem. Soc. 2016, 81, 607–621. [Google Scholar] [CrossRef]
- Altundag, H.; Tuzen, M. Comparison of dry, wet and microwave digestion methods for the multi element determination in some dried fruit samples by ICP-OES. Food Chem. Toxicol. 2011, 49, 2800–2807. [Google Scholar] [CrossRef]
- Soylak, M.; Cihan, Z.; Yilmaz, E. Heavy metal contents of organically produced, harvested, and dried fruit samples from Kayseri, Turkey. Environ. Monit. Assess. 2013, 185, 2577–2583. [Google Scholar] [CrossRef]
- Michenaud-Rague, A.; Robinson, S.; Landsberger, S. Trace elements in 11 fruits widely-consumed in the USA as determined by neutron activation analysis. J. Radioanal. Nucl. Chem. 2012, 291, 237–240. [Google Scholar] [CrossRef]
- Mitre, I.; Mitre, V.; Ardelean, M.; Sestras, R.; Sestras, A. Evaluation of old apple cultivars grown in Central Transylvania, Romania. Not. Bot. Horti Agrobot. Cluj-Napoca 2009, 37, 235–237. [Google Scholar] [CrossRef]
- Chen, W.; Krage, N.; Wu, L.; Pan, G.; Khosrivafard, M.; Chang, A.C. Arsenic, Cadmium, and Lead in California Cropland Soils: Role of Phosphate and Micronutrient Fertilizers. J. Environ. Qual. 2008, 37, 689–695. [Google Scholar] [CrossRef]
- Magdas, D.A.; Dehelean, A.; Puscas, R. Isotopic and elemental determination in some romanian apple fruit juices. Sci. World J. 2012, 2012, 878242. [Google Scholar] [CrossRef] [PubMed] [Green Version]


| Orchard | Apple Variety | No. of Samples | H2O Content | Zn | Cu | Fe | Mn | Ni | Cr | Co | Pb | Cd |
| % | mg·kg−1 | |||||||||||
| Fălticeni (FRPSF) | Golden Delicious | 10 | 85.881 | 3.570 | 0.204 | 2.476 | 0.573 | 0.215 | 0.048 | 0.168 | 0.576 | 0.081 |
| Jonathan | 4 | 86.095 | 2.587 | 0.273 | 1.725 | 0.545 | 0.122 | 0.101 | 0.133 | 0.797 | 0.088 | |
| Kaltherer Böhmer | 3 | 85.821 | 0.910 | 0.409 | 2.856 | 0.651 | 0.225 | 0.068 | 0.109 | 0.477 | 0.094 | |
| Pătul | 1 | 85.651 | 0.909 | 0.055 | 0.873 | 0.485 | 0.163 | 0.007 | - | 0.626 | 0.077 | |
| Starkrimson | 2 | 86.758 | 0.914 | 0.207 | 1.104 | 0.328 | - | 0.064 | 0.250 | 0.544 | 0.083 | |
| Wagener | 1 | 86.282 | 1.223 | 0.220 | 0.700 | 0.459 | 0.054 | 0.058 | 0.476 | 0.413 | 0.025 | |
| Sârca (F6S) | Golden Delicious | 1 | 82.136 | 4.458 | 0.273 | 1.895 | 0.695 | 0.257 | 0.005 | 0.027 | 1.149 | 0.031 |
| Florina | 4 | 83.265 | 3.255 | 0.239 | 0.927 | 0.470 | 0.168 | 0.041 | 0.237 | 0.683 | 0.111 | |
| Idared | 7 | 83.359 | 2.380 | 0.247 | 1.745 | 0.563 | 0.199 | 0.093 | 0.420 | 0.846 | 0.123 | |
| Jonagold | 4 | 84.136 | 1.046 | 0.149 | 1.349 | 0.469 | 0.131 | 0.036 | 0.202 | 0.875 | 0.111 | |
| Jonathan | 5 | 81.237 | 2.690 | 0.103 | 2.926 | 0.490 | 0.231 | 0.096 | 0.144 | 0.834 | 0.127 | |
| * MAL | 5 | 5 | 0.5 | 0.05 | ||||||||
| Element | Zn | Cu | Fe | Mn | Ni | Cr | Co | Pb | Cd |
| Zn | 1.00 | ||||||||
| Cu | −0.16 | 1.00 | |||||||
| Fe | −0.16 | 0.33 | 1.00 | FRPSF | |||||
| Mn | −0.01 | 0.22 | 0.24 | 1.00 | |||||
| Ni | −0.09 | 0.08 | 0.49 | 0.17 | 1.00 | ||||
| Cr | 0.19 | 0.33 | 0.01 | −0.06 | −0.09 | 1.00 | |||
| Co | −0.24 | −0.43 | −0.22 | −0.34 | 0.02 | 0.09 | 1.00 | ||
| Pb | −0.30 | 0.05 | 0.16 | −0.10 | −0.06 | 0.37 | −0.10 | 1.00 | |
| Cd | −0.01 | 0.29 | 0.02 | −0.15 | 0.01 | 0.00 | −0.48 | 0.22 | 1.00 |
| Element | Zn | Cu | Fe | Mn | Ni | Cr | Co | Pb | Cd |
| Zn | 1.00 | ||||||||
| Cu | 0.17 | 1.00 | |||||||
| Fe | 0.22 | 0.14 | 1.00 | F6S | |||||
| Mn | −0.04 | 0.26 | −0.16 | 1.00 | |||||
| Ni | 0.17 | 0.03 | 0.26 | −0.09 | 1.00 | ||||
| Cr | −0.03 | −0.25 | 0.03 | −0.29 | 0.43 | 1.00 | |||
| Co | 0.28 | 0.29 | 0.42 | −0.28 | 0.13 | 0.02 | 1.00 | ||
| Pb | 0.09 | 0.39 | 0.30 | 0.15 | 0.30 | 0.35 | 0.04 | 1.00 | |
| Cd | −0.27 | 0.43 | 0.00 | −0.05 | 0.01 | 0.05 | 0.35 | 0.39 | 1.00 |
| Country | Reference | Zn (mg·kg−1) | Cu (mg·kg−1) | Fe (mg·kg−1) | Mn (mg·kg−1) | Ni (mg·kg−1) | Cr (mg·kg−1) | Co (mg·kg−1) | Pb (mg·kg−1) | Cd (mg·kg−1) |
|---|---|---|---|---|---|---|---|---|---|---|
| Croatia | [33] * | 0.873–5.8 | 0.04–1.7 | |||||||
| Greece | [5] * | 1.1–10.3 | 0.87–5.37 | 10–150 | 2.0–9.0 | 0.05–0.7 | 1.5–2.6 | 0.01–0.1 | 0.01–0.46 | 0.01–6.85 |
| [34] * | 9.9–10.8 | 12.3–13.6 | 17.63–19.96 | 3.1–4 | ||||||
| Libya | [35] * | 2.34 ± 0.13 | 1.5 ± 0.1 | 1 ± 0.145 | 0.437 ± 0.062 | 0.2 ± 0.06 | 0.06 ± 0.03 | |||
| Pakistan | [36] * | 35.7 ± 2.3 | 172 ± 11 | 6.5 ± 0.26 | 0.052 ± 0.005 | |||||
| Poland | [27] ** | 0.453 | 0.319 | 0.182 | 0.031 | 0.0057 | ||||
| [28] ** | 0.181 | 0.24 | 0.307 | 0.0072 | 0.002 | |||||
| Portugal | [37] ** | 0.2705 | 0.6661 | 1.5 | 0.3539 | 0.0557 | 0.0143 | |||
| Romania | [25] ** | 2.1–4.3 | ||||||||
| [14] ** | 0.25–0.8 | 0.48–0.54 | 0.08–0.21 | ≤0.04 | ||||||
| [13] * | 1.93 ± 0.62 | 3.57 ± 1.05 | 3.68 ± 0.96 | 1.81 ± 0.58 | <0.1 | <0.01 | <0.01 | |||
| Serbia | [29] * | 2.04 ± 0.005 | 4.21 ± 0.03 | 0.74 ± 0.025 | 0.63 ± 0.125 | 0.115 ± 0 | ||||
| [9] * | 2.0 ± 0.4–12.00 ± 0.02 | 5.12 ± 0.01–34.0 ± 0.2 | 0.64 ± 0.03–3.69 ± 0.06 | 0.84 ± 0.07–2.44 ± 0.06 | 0.135 ± 0.005–0.225 ± 0 | |||||
| [38] * | 0.39–2.24 | 0.76–2.73 | 1.9–11.41 | 0.81–3.22 | 0.02–0.89 | ≤0.57 | ≤0.01 | ≤0.29 | ||
| Turkey | [39] * | 3.55 ± 0.34–4.06 ± 0.28 | 0.43 ± 0.06–1.13 ± 0.07 | 19.47 ± 2.67–21.25 ± 2.14 | 0.56 ± 0.04–0.91 ± 0.07 | 1.44 ± 0.19–2.43 ± 0.09 | 0.98 ± 0.21–1.36 ± 0.10 | 0.51 ± 0.08–0.78 ± 0.14 | 0.54 ± 0.18–0.67 ± 0.06 | 0.26 ± 0.05–0.54 ± 0.09 |
| [40] * | 71.7 ± 1.8 | 5.2 ± 0.1 | 55.0 ± 0.1 | 38.6 ± 0.4 | ||||||
| U.S.A. | [41] * | 1.4 | 5.5 | 9.3 | 4.3 | <0.20 | 0.43 | 0.16 | ||
| Worldwide (synthesis) | [10] * | 1.2 | 1.1 | 6 | 1.3 | 0.06 | 0.008 | 0.0003–0.0012 | 0.05–0.2 | 0.05 |
| [10] ** | 0.03 | 0.03 | 0.6–0.9 | 0.01–0.2 | 0.003–0.08 | 0.013 | 0.083–0.16 | 0.001 | 0.003–0.03 | |
| This study | ** | 0.909–4.458 | 0.055–0.409 | 0.700–2.926 | 0.328–0.695 | 0.054–0.257 | 0.005–0.101 | 0.027–0.476 | 0.413–1.149 | 0.025–0.127 |
| * | 6.338–25.287 | 0.383–2.883 | 5.100–20.144 | 2.473–4.590 | 0.395–1.585 | 0.030–0.726 | 0.150–3.470 | 3.013–6.432 | 0.174–0.739 |
© 2020 by the authors. Licensee MDPI, Basel, Switzerland. This article is an open access article distributed under the terms and conditions of the Creative Commons Attribution (CC BY) license (http://creativecommons.org/licenses/by/4.0/).
Share and Cite
Prundeanu, I.-M.; Chelariu, C.; Balaban, S.-I.; Iancu, O.-G. Distribution and Behaviour of Some Trace Elements as a Function of Apple Varieties in Northeastern Romania. Int. J. Environ. Res. Public Health 2020, 17, 2607. https://0-doi-org.brum.beds.ac.uk/10.3390/ijerph17072607
Prundeanu I-M, Chelariu C, Balaban S-I, Iancu O-G. Distribution and Behaviour of Some Trace Elements as a Function of Apple Varieties in Northeastern Romania. International Journal of Environmental Research and Public Health. 2020; 17(7):2607. https://0-doi-org.brum.beds.ac.uk/10.3390/ijerph17072607
Chicago/Turabian StylePrundeanu, Ionuţ-Mihai, Ciprian Chelariu, Sorin-Ionuț Balaban, and Ovidiu-Gabriel Iancu. 2020. "Distribution and Behaviour of Some Trace Elements as a Function of Apple Varieties in Northeastern Romania" International Journal of Environmental Research and Public Health 17, no. 7: 2607. https://0-doi-org.brum.beds.ac.uk/10.3390/ijerph17072607