Development and Evaluation of the Psychometric Properties of a Brief Wisdom Development Scale


Abstract
:1. Introduction
2. Materials and Methods
2.1. Participants
2.2. Measurement
2.3. Procedure
3. Results
3.1. Development of a Brief Wisdom Development Scale
3.2. Internal Consistency
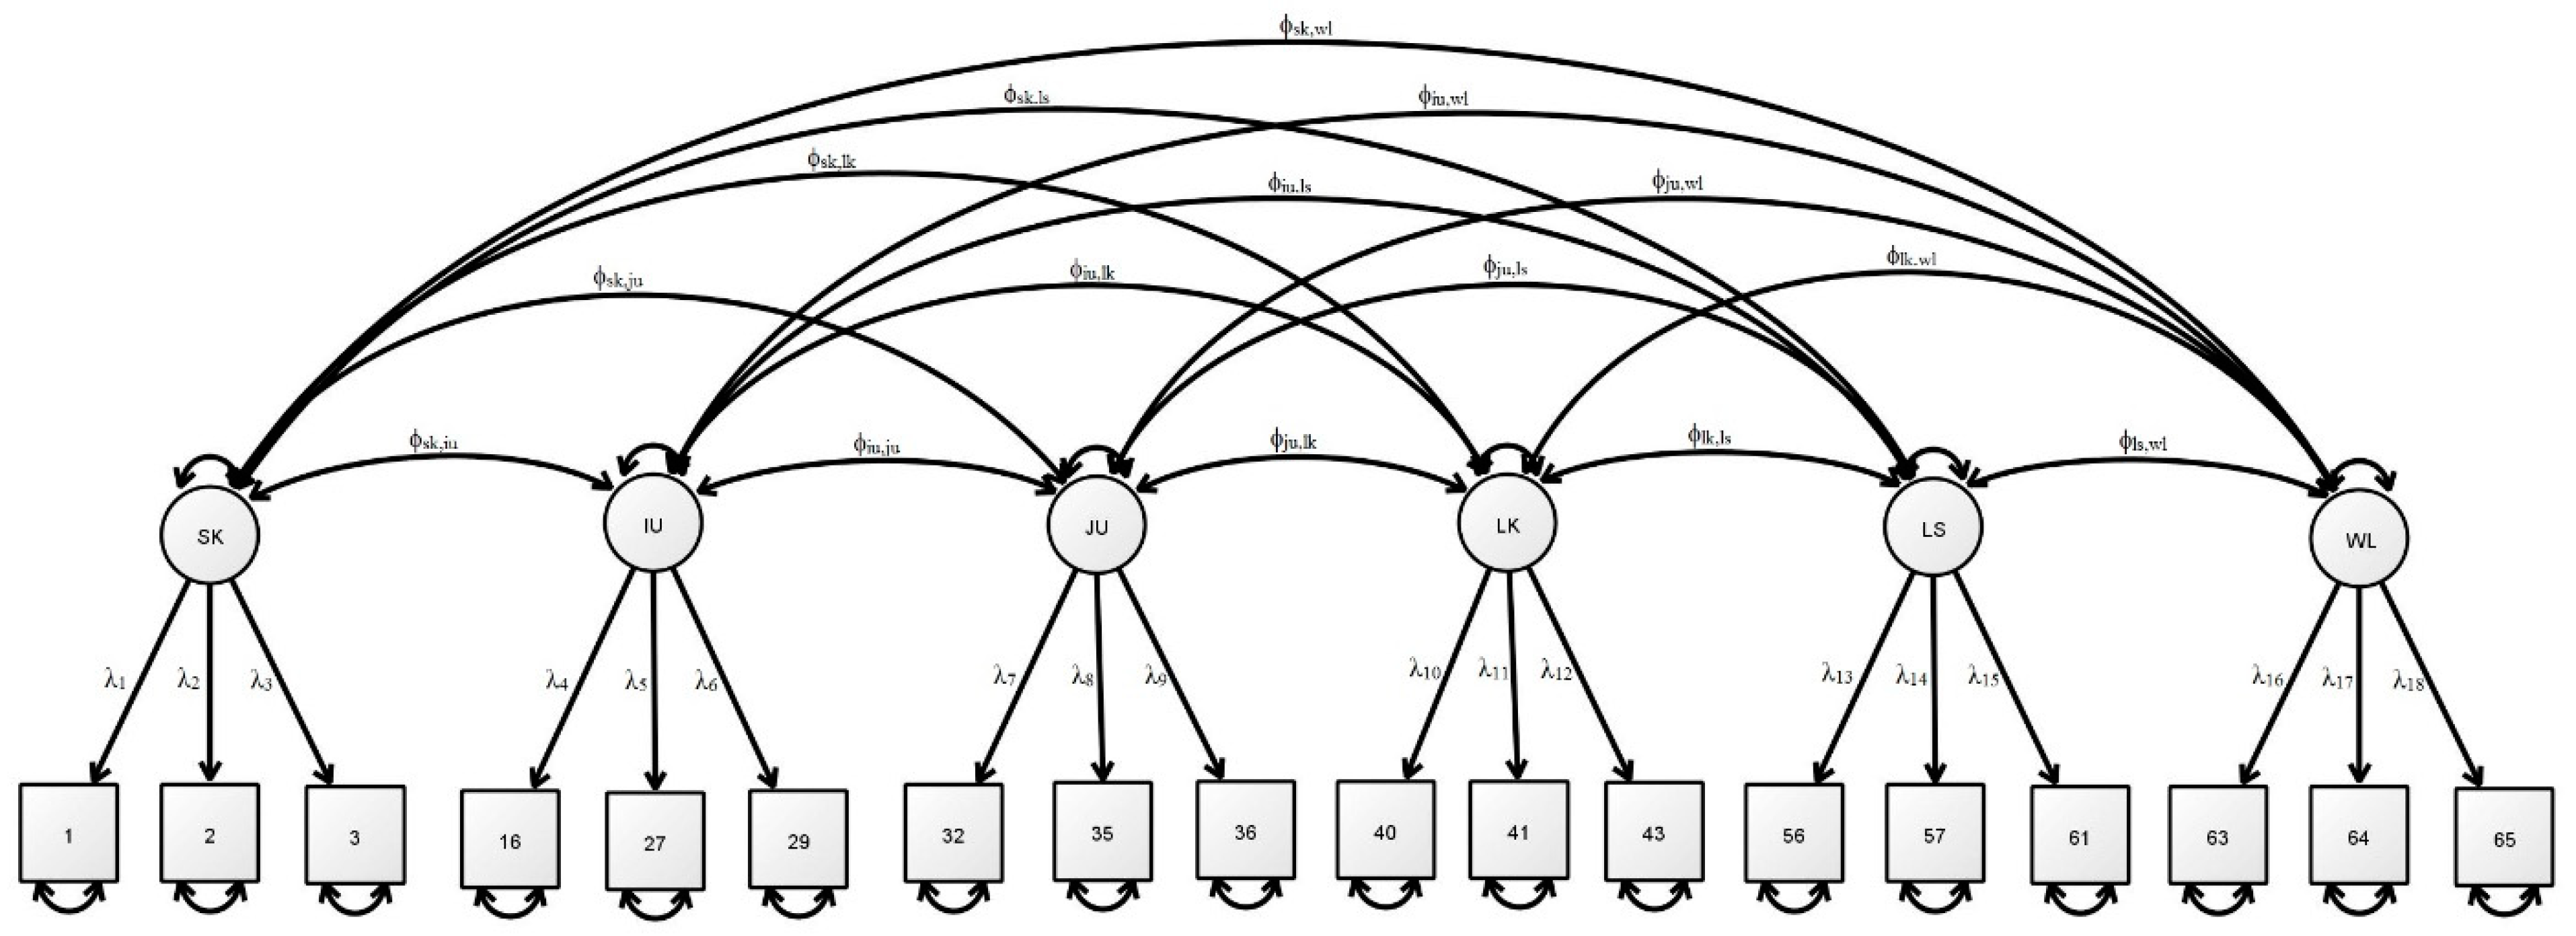
3.3. Factorial Validity
3.4. Concurrent Validity
4. Discussion
5. Conclusions
Author Contributions
Funding
Conflicts of Interest
References
- Bangen, K.J.; Meeks, T.W.; Jeste, D.V. Defining and Assessing Wisdom: A Review of the Literature. Am. J. Geriatr. Psychiatr. 2013, 21, 1254–1266. [Google Scholar] [CrossRef] [Green Version]
- Seligman, M.E.P.; Csikszentmihalyi, M. Positive psychology—An introduction. Am. Psychol. 2000, 55, 5–14. [Google Scholar] [CrossRef] [PubMed]
- Brown, S.C.; Greene, J.A. The wisdom development scale: Translating the conceptual to the concrete. J. Coll. Stud. Dev. 2006, 47, 1–19. [Google Scholar] [CrossRef]
- Brown, S.C. Learning across the campus: How college facilitates the development of wisdom. J. Coll. Stud. Dev. 2004, 45, 134–148. [Google Scholar] [CrossRef]
- Greene, J.A.; Brown, S.C. The wisdom development scale: Further validity investigations. Int. J. Aging Hum. Dev. 2009, 68, 289–320. [Google Scholar] [CrossRef] [PubMed]
- Wink, P.; Helson, R. Practical and transcendent wisdom: Their nature and some longitudinal findings. J. Adult Dev. 1997, 4, 1–15. [Google Scholar] [CrossRef]
- Ardelt, M. Empirical assessment of a three-dimensional wisdom scale. Res. Aging 2003, 25, 275–324. [Google Scholar] [CrossRef]
- Webster, J.D. An exploratory analysis of a self-assessed wisdom scale. J. Adult Dev. 2003, 10, 13–22. [Google Scholar] [CrossRef]
- Webster, J.D. Measuring the Character Strength of Wisdom. Int. J. Aging Hum. Dev. 2007, 65, 163–183. [Google Scholar] [CrossRef]
- Snyder, C.R.; Lopez, S.J.; Pedrotti, J.T. Positive Psychology: The Scientific and Practical Explorations of Human Strengths, 3rd ed.; SAGE: Thousand Oaks, CA, USA, 2015. [Google Scholar]
- Parco-Tropicales, M.; de Guzman, A.B. A structural equation model (SEM) of the impact of transformational, visionary, charismatic and ethical leadership styles on the development of wise leadership among Filipino private secondary school principals. Asia Pac. Educ. Rev. 2014, 15, 547–559. [Google Scholar] [CrossRef]
- Urrutia, A.; de Espanes, G.M.; Ferrari, C.; Borgna, G.; Alderete, A.M.; Villar, F. Development and validation of the Brief Scale of Self-assessed Wisdom (EBAS) in Argentinian older adults. Univ. Psychol. 2016, 15, 11. [Google Scholar]
- Glück, J. Measuring Wisdom: Existing Approaches, Continuing Challenges, and New Developments. J. Gerontol. Ser. B Psychol. Sci. Soc. Sci. 2018, 73, 1393–1403. [Google Scholar]
- Glück, J.; König, S.; Naschenweng, K.; Redzanowski, U.; Dorner-Hörig, L.; Strasser, I.; Wiedermann, W. How to measure wisdom: Content, reliability, and validity of five measures. Front. Psychol. 2013, 4, 405. [Google Scholar] [CrossRef] [PubMed] [Green Version]
- Snaith, R.P.; Hamilton, M.; Morley, S.; Humayan, A.; Hargreaves, D.; Trigwell, P. A scale for the assessment of hedonic tone—The snaith-hamilton pleasure scale. Br. J. Psychiatry 1995, 167, 99–103. [Google Scholar] [CrossRef] [PubMed]
- Adewuya, A.O.; Ola, B.A.; O Afolabi, O. Validity of the patient health questionnaire (PHQ-9) as a screening tool for depression amongst Nigerian university students. J. Affect. Disord. 2006, 96, 89–93. [Google Scholar] [CrossRef] [PubMed]
- Taylor, M.; Bates, G.; Webster, J.D. Comparing the psychometric properties of two measures of wisdom: Predicting forgiveness and psychological well-being with the Self-Assessed Wisdom Scale (SAWS) and the Three-Dimensional Wisdom Scale (3D-WS). Exp. Aging Res. 2011, 37, 129–141. [Google Scholar] [CrossRef] [PubMed]
- Webster, J.D.; Taylor, M.; Bates, G. Conceptualizing and measuring wisdom: A reply to Ardelt reply. Exp. Aging Res. 2011, 37, 256–259. [Google Scholar] [CrossRef]
- Ardelt, M. The measurement of wisdom: A commentary on Taylor, Bates, and Webster’s comparison of the SAWS and 3D-WS. Exp. Aging Res. 2011, 37, 241–255. [Google Scholar] [CrossRef]
- Webster, J.D. Self-Report Wisdom Measures: Strengths, Limitations, and Future Directions. In The Cambridge Handbook of Wisdom; Glück, J., Sternberg, R.J., Eds.; Cambridge University Press: Cambridge, UK, 2019; pp. 297–320. [Google Scholar]
- Fung, S.-F.; Chow, E.O.-W.; Cheung, C.-K. Development and validation of a brief self-assessed wisdom scale. BMC Geriatr. 2020, 20, 1–8. [Google Scholar] [CrossRef] [Green Version]
- Thomas, M.L.; Bangen, K.J.; Ardelt, M.; Jeste, D.V. Development of a 12-Item Abbreviated Three-Dimensional Wisdom Scale (3D-WS-12): Item Selection and Psychometric Properties. Assessment 2017, 24, 71–82. [Google Scholar] [CrossRef]
- Cheung, C.-K.; Chow, E.O.-W. Contribution of Wisdom to Well-Being in Chinese Older Adults. Appl. Res. Qual. Life 2019. [Google Scholar] [CrossRef]
- Li, H.Q.; Wang, F.Y. A three-dimensional model of the wise personality: A free classification approach. Soc. Behav. Pers. 2017, 45, 1879–1888. [Google Scholar] [CrossRef]
- Dunlap, W.P.; Cortina, J.M.; Vaslow, J.B.; Burke, M.J. Meta-analysis of experiments with matched groups or repeated measures designs. Psychol. Methods 1996, 1, 170–177. [Google Scholar] [CrossRef]
- Ellis, M.V. Repeated Measures Designs. Counsel. Psychol. 1999, 27, 552–578. [Google Scholar] [CrossRef]
- Obrien, R.G.; Kaiser, M.K. Manova method for analyzing repeated measures designs—An extensive primer. Psychol. Bull. 1985, 97, 316–333. [Google Scholar] [CrossRef]
- Goodcase, E.T.; Love, H.A. From Despair to Integrity: Using Narrative Therapy for Older Individuals in Erikson’s Last Stage of Identity Development. Clin. Soc. Work J. 2017, 45, 354–363. [Google Scholar] [CrossRef]
- Freedman, J. Narrative Therapy: The Social Construction of Preferred Realities; W.W. Norton & Company: New York, NY, USA, 1996. [Google Scholar]
- Kogan, S.M.; Gale, J.E. Decentering therapy: Textual analysis of a narrative therapy session. Fam. Process 1997, 36, 101–126. [Google Scholar] [CrossRef]
- Brown, C. Narrative Therapy: Making Meaning, Making Lives; SAGE Publications, Inc.: Thousand Oaks, CA, USA, 2007. [Google Scholar]
- Muruthi, B.; McCoy, M.; Chou, J.; Farnham, A. Sexual Scripts and Narrative Therapy with Older Couples. Am. J. Fam. Ther. 2018, 46, 81–95. [Google Scholar] [CrossRef]
- Cha, E.S.; Kim, K.H.; Erlen, J.A. Translation of scales in cross-cultural research: Issues and techniques. J. Adv. Nurs. 2007, 58, 386–395. [Google Scholar] [CrossRef]
- Brislin, R.W. Back-Translation for Cross-Cultural Research. J. Cross-Cult. Psychol. 1970, 1, 185–216. [Google Scholar] [CrossRef]
- Schroeders, U.; Wilhelm, O.; Olaru, G. Meta-Heuristics in Short Scale Construction: Ant Colony Optimization and Genetic Algorithm. PLoS ONE 2016, 11, e0167110. [Google Scholar] [CrossRef]
- Loewenthal, K.M. An Introduction to Psychological Tests and Scales, 2nd ed.; Psychology Press: Philadelphia, PA, USA, 2001. [Google Scholar]
- Smith, G.T.; McCarthy, D.M.; Anderson, K.G. On the sins of short-form development. Psychol. Assess. 2000, 12, 102–111. [Google Scholar] [CrossRef] [PubMed]
- Svedholm-Hakkinen, A.M.; Lindeman, M. Actively open-minded thinking: Development of a shortened scale and disentangling attitudes towards knowledge and people. Think Reason. 2018, 24, 21–40. [Google Scholar] [CrossRef]
- Fung, S.-F.; Fung, A.L.C. Development and evaluation of the psychometric properties of a brief parenting scale (PS-7) for the parents of adolescents. PLoS ONE 2020, 15, e0228287. [Google Scholar] [CrossRef] [PubMed]
- Hair, J.F. Multivariate Data Analysis, 7th ed.; Prentice Hall: Upper Saddle River, NJ, USA, 2010. [Google Scholar]
- Fung, S.-F. Revisiting the dimensionality of the Brief Sensation Seeking Scale in Mainland China. Soc. Behav. Pers. 2020, 48, 12. [Google Scholar] [CrossRef]
- Fung, S.-F. Validity of the Brief Resilience Scale and Brief Resilient Coping Scale in a Chinese Sample. Int. J. Environ. Res. Public Health 2020, 17, 1265. [Google Scholar] [CrossRef] [Green Version]
- McDonald, R.P. Test Theory: A Unified Treatment; L. Erlbaum Associates: London, UK, 1999. [Google Scholar]
- Zinbarg, R.E.; Revelle, W.; Yovel, I.; Li, W. Cronbach’s alpha, Revelle’s beta, and McDonald’s (omega H): Their relations with each other and two alternative conceptualizations of reliability. Psychometrika 2005, 70, 123–133. [Google Scholar] [CrossRef]
- Revelle, W.; Zinbarg, R.E. Coefficients Alpha, Beta, Omega, and the glb: Comments on Sijtsma. Psychometrika 2009, 74, 145–154. [Google Scholar] [CrossRef]
- Gignac, G.E.; Kretzschmar, A. Evaluating dimensional distinctness with correlated-factor models: Limitations and suggestions. Intelligence 2017, 62, 138–147. [Google Scholar] [CrossRef]
- Li, C.-H. Confirmatory factor analysis with ordinal data: Comparing robust maximum likelihood and diagonally weighted least squares. Behav. Res. Methods 2016, 48, 936–949. [Google Scholar] [CrossRef] [Green Version]
- Jöreskog, K.G. A general approach to confirmatory maximum likelihood factor analysis. Psychometrika 1969, 34, 183–202. [Google Scholar] [CrossRef]
- DiStefano, C.; Morgan, G.B. A Comparison of Diagonal Weighted Least Squares Robust Estimation Techniques for Ordinal Data. Struct. Eq. Model. 2014, 21, 425–438. [Google Scholar] [CrossRef]
- Brown, T.A. Confirmatory Factor Analysis for Applied Research, 2nd ed.; Guilford Publications: New York, NY, USA, 2014. [Google Scholar]
- Hu, L.T.; Bentler, P.M. Cutoff criteria for fit indexes in covariance structure analysis: Conventional criteria versus new alternatives. Struct. Eq. Model. 1999, 6, 1–55. [Google Scholar] [CrossRef]
- Schreiber, J.B.; Nora, A.; Stage, F.K.; Barlow, E.A.; King, J. Reporting Structural Equation Modeling and Confirmatory Factor Analysis Results: A Review. J. Educ. Res. 2006, 99, 323–338. [Google Scholar] [CrossRef]
- Kline, R.B. Principles and Practice of Structural Equation Modeling, 2nd ed.; Guilford Press: New York, NY, USA, 2005. [Google Scholar]
- Bentler, P.M.; Bonett, D.G. Significance tests and goodness of fit in the analysis of covariance structures. Psychol. Bull. 1980, 88, 588–606. [Google Scholar] [CrossRef]
- Byrne, B.M. Structural Equation Modeling with LISREL, PRELIS, and SIMPLIS: Basic Concepts, Applications, and Programming; Mahwah, N.J., Ed.; L. Erlbaum Associates: London, UK, 1998. [Google Scholar]
- Satorra, A.; Bentler, P.M. A scaled difference chi-square test statistic for moment structure analysis. Psychometrika 2001, 66, 507–514. [Google Scholar] [CrossRef] [Green Version]
- Fokkema, M.; Greiff, S. How Performing PCA and CFA on the Same Data Equals Trouble Overfitting in the Assessment of Internal Structure and Some Editorial Thoughts on It. Eur. J. Psychol. Assess. 2017, 33, 399–402. [Google Scholar] [CrossRef]
- Babyak, M.A. What you see may not be what you get: A brief, nontechnical introduction to overfitting in regression-type models. Psychosom. Med. 2004, 66, 411–421. [Google Scholar]
- Cronbach, L.J. Coefficient alpha and the internal structure of tests. Psychometrika 1951, 16, 297–334. [Google Scholar] [CrossRef] [Green Version]
- Tabachnick, B.G. Using Multivariate Statistics, 6th ed.; Pearson Education: Boston, MA, USA, 2013. [Google Scholar]
- Fung, S.-F.; Kong, C.Y.W.; Huang, Q. Evaluating the Dimensionality and Psychometric Properties of the Brief Self-Control Scale Amongst Chinese University Students. Front. Psychol. 2020, 10, 2903. [Google Scholar] [CrossRef] [Green Version]
- Etezadi, S.; Pushkar, D. Why are wise people happier? An explanatory model of wisdom and emotional well-being in older adults. J. Happiness Stud. 2013, 14, 929–950. [Google Scholar] [CrossRef]
- Day, J.M. Religion, Spirituality, and Positive Psychology in Adulthood: A Developmental View. J. Adult Dev. 2010, 17, 215–229. [Google Scholar] [CrossRef]
- Ardelt, M. Disentangling the Relations Between Wisdom and Different Types of Well-Being in Old Age: Findings from a Short-Term Longitudinal Study. J. Happiness Stud. 2016, 17, 1963–1984. [Google Scholar] [CrossRef]
- Clark, P.G. Quality-of-life, values, and teamwork in geriatric care—Do we communicate what we mean. Gerontologist 1995, 35, 402–411. [Google Scholar] [CrossRef] [PubMed]
- Hultsch, D.F.; MacDonald, S.W.S.; Hunter, M.A.; Maitland, S.B.; Dixon, R.A. Sampling and generalisability in developmental research: Comparison of random and convenience samples of older adults. Int. J. Behav. Dev. 2002, 26, 345–359. [Google Scholar] [CrossRef]
- Wu, Y.; Zuo, B.; Wen, F.F.; Yan, L. Rosenberg Self-Esteem Scale: Method Effects, Factorial Structure and Scale Invariance Across Migrant Child and Urban Child Populations in China. J. Pers. Assess. 2017, 99, 83–93. [Google Scholar] [CrossRef] [PubMed]
- Rosenberg, M.; Schooler, C.; Schoenbach, C. Self-Esteem and Adolescent Problems: Modeling Reciprocal Effects. Am. Sociol. Rev. 1989, 54, 1004–1018. [Google Scholar] [CrossRef]
- IWG. Personal Wellbeing Inde, 5th ed.; Australia Center on Quality of Life, Deakin University: Melbourne, Australia, 2013. [Google Scholar]
- Khalaila, R. Depression statuses and related predictors in later life: A 10-year follow-up study in Israel. Eur. J. Ageing 2016, 13, 311–321. [Google Scholar] [CrossRef] [Green Version]
- Blazer, D.G.; Hybels, C.F. Origins of depression in later life. Psychol. Med. 2005, 35, 1241–1252. [Google Scholar] [CrossRef]
- He, J.; Zhong, X.; Yao, S. Factor structure of the Geriatric Depression Scale and measurement invariance across gender among Chinese elders. J. Affect. Disord. 2018, 238, 136–141. [Google Scholar] [CrossRef]
- Dow, B.; Lin, X.; Pachana, N.A.; Bryant, C.; LoGiudice, D.; Goh, A.M.Y.; Haralambous, B. Reliability, concurrent validity, and cultural adaptation of the Geriatric Depression Scale and the Geriatric Anxiety Inventory for detecting depression and anxiety symptoms among older Chinese immigrants: An Australian study. Int. Psychogeriatr. 2017, 30, 735–748. [Google Scholar] [CrossRef] [PubMed]
- Yesavage, J.A.; Brink, T.L.; Rose, T.L.; Lum, O.; Huang, V.; Adey, M.; Leirer, V.O. Development and validation of a geriatric depression screening scale—A preliminary-report. J. Psychiatr. Res. 1983, 17, 37–49. [Google Scholar] [CrossRef]
- Yesavage, J.A.; Sheikh, J.I. Geriatric Depression Scale (GDS): Recent Evidence and Development of a Shorter Version. Clin. Gerontol. 1986, 5, 165–173. [Google Scholar] [CrossRef]
- Rosseel, Y. lavaan: An R Package for Structural Equation Modeling. J. Stat. Softw. 2012, 48, 36. [Google Scholar] [CrossRef] [Green Version]
- Marsh, H.W.; Hau, K.-T.; Balla, J.R.; Grayson, D. Is More Ever Too Much? The Number of Indicators per Factor in Confirmatory Factor Analysis. Multivar. Behav. Res. 1998, 33, 181–220. [Google Scholar] [CrossRef]
- Velicer, W.F.; Fava, J.L. Effects of variable and subject sampling on factor pattern recovery. Psychol. Methods 1998, 3, 231–251. [Google Scholar] [CrossRef]
- Rhemtulla, M.; Brosseau-Liard, P.E.; Savalei, V. When Can Categorical Variables Be Treated as Continuous? A Comparison of Robust Continuous and Categorical SEM Estimation Methods Under Suboptimal Conditions. Psychol. Methods 2012, 17, 354–373. [Google Scholar] [CrossRef] [Green Version]
- Flora, D.B.; Curran, P.J. An empirical evaluation of alternative methods of estimation for confirmatory factor analysis with ordinal data. Psychol. Methods 2004, 9, 466–491. [Google Scholar] [CrossRef] [Green Version]
- Harbichova, I.; Komarc, M.; Scheier, L.M. Intrinsic motivation in sport measured by the sport motivation scale in czech university students. Cesk. Psychol. 2019, 63, 510–525. [Google Scholar]
- Putnick, D.L.; Bornstein, M.H. Measurement invariance conventions and reporting: The state of the art and future directions for psychological research. Dev. Rev. 2016, 41, 71–90. [Google Scholar] [CrossRef] [Green Version]


| Variable | Respondents |
|---|---|
| Age mean (SD) | 72.55 (8.47) |
| Gender n (%) | |
| Male | 40 (26.1%) |
| Female | 113 (73.9%) |
| Education level n (%) | |
| No formal education | 24 (15.7%) |
| Primary education | 48 (31.4%) |
| Secondary education | 45 (29.4%) |
| Tertiary education | 30 (19.6%) |
| Missing | 6 (3.9%) |
| Marital status n (%) | |
| Single | 13 (8.5%) |
| Married | 63 (41.2%) |
| Divorced/separated | 15 (9.8%) |
| Widowed | 61 (39.9%) |
| Other | 1 (0.7%) |
| Item | x | SD | sk | ku | rit | αiid |
|---|---|---|---|---|---|---|
| 1. I am well aware of all of my weaknesses | 5.11 | 1.64 | −0.93 | 0.40 | 0.50 | 0.93 |
| 2. I am well aware of all of my values | 4.84 | 1.64 | −0.77 | 0.08 | 0.68 | 0.93 |
| 3. I am well aware of all of my interests | 4.65 | 1.75 | −0.75 | −0.24 | 0.67 | 0.93 |
| 16. I learn from others | 5.84 | 1.30 | −1.44 | 2.53 | 0.65 | 0.93 |
| 27. I have general confidence in what I know | 5.46 | 1.42 | −1.09 | 0.95 | 0.64 | 0.93 |
| 29. I present well-supported arguments | 4.58 | 1.84 | −0.65 | −0.50 | 0.57 | 0.93 |
| 32. I am aware of different ways of life, philosophies, and cultures | 4.54 | 1.92 | −0.57 | −0.70 | 0.72 | 0.92 |
| 35. I integrate and apply what I have learned from one part of my life to another | 5.11 | 1.68 | −1.07 | 0.58 | 0.76 | 0.92 |
| 36. I understand how my background has shaped my perspective on things | 5.16 | 1.60 | −1.13 | 0.81 | 0.64 | 0.93 |
| 40. I see the interconnectedness between people and the natural world | 4.55 | 1.87 | −0.61 | −0.67 | 0.65 | 0.93 |
| 41. I see the interconnectedness between knowledge and ideas | 4.57 | 1.82 | −0.67 | −0.47 | 0.70 | 0.93 |
| 43. I recognize that there are cycles in life | 5.07 | 1.79 | −0.90 | 0.02 | 0.57 | 0.93 |
| 56. I have a sense of purpose in my life | 4.54 | 1.86 | −0.62 | −0.55 | 0.65 | 0.93 |
| 57. I make sound decisions | 5.18 | 1.52 | −1.04 | 0.88 | 0.67 | 0.93 |
| 61. I attend to the important matters in my life | 5.59 | 1.46 | −1.23 | 1.46 | 0.59 | 0.93 |
| 63. I learn from my experiences | 5.68 | 1.29 | −1.19 | 1.60 | 0.70 | 0.93 |
| 64. I enjoy learning for the sake of learning | 5.52 | 1.56 | −1.28 | 1.29 | 0.49 | 0.93 |
| 65. I am open to change | 5.34 | 1.58 | −1.12 | 0.92 | 0.54 | 0.93 |
| Scale | α | Scale | α |
|---|---|---|---|
| WDS | 0.95 | BWDS | 0.93 |
| Self-knowledge (SK) | 0.75 | Self-knowledge (SK) | 0.77 |
| Emotional management (EM) | 0.60 | ||
| Altruism (AL) | 0.55 | Interpersonal understanding (IU) | 0.70 |
| Inspirational engagement (IE) | 0.79 | ||
| Judgement (JU) | 0.84 | Judgement (JU) | 0.82 |
| Life knowledge (LK) | 0.84 | Life knowledge (LK) | 0.82 |
| Life skills (LS) | 0.88 | Life skills (LS) | 0.74 |
| Willingness to learn (WL) | 0.85 | Willingness to learn (WL) | 0.86 |
| Study | ||||||
|---|---|---|---|---|---|---|
| Factor/Question Number | 2 | 3 | 4 | Combo 1 | Combo 2 | |
| Self-knowledge (SK) | ||||||
| 1 | λ1 | 0.65 | 0.65 | 0.69 | 0.68 | 0.67 |
| 2 | λ2 | 0.83 | 0.85 | 0.85 | 0.89 | 0.84 |
| 3 | λ3 | 0.82 | 0.82 | 0.85 | 0.78 | 0.84 |
| Interpersonal understanding (IU) | ||||||
| 16 | λ4 | 0.79 | 0.79 | 0.78 | 0.77 | 0.65 |
| 27 | λ5 | 0.74 | 0.79 | 0.81 | 0.79 | 0.82 |
| 29 | λ6 | 0.68 | 0.68 | 0.65 | 0.79 | 0.64 |
| Judgment (JU) | ||||||
| 32 | λ7 | 0.80 | 0.77 | 0.79 | 0.84 | 0.83 |
| 35 | λ8 | 0.84 | 0.85 | 0.85 | 0.86 | 0.84 |
| 36 | λ9 | 0.76 | 0.75 | 0.72 | 0.74 | 0.71 |
| Life knowledge (LK) | ||||||
| 40 | λ10 | 0.86 | 0.86 | 0.87 | 0.89 | 0.86 |
| 41 | λ11 | 0.89 | 0.88 | 0.89 | 0.91 | 0.91 |
| 43 | λ12 | 0.75 | 0.76 | 0.77 | 0.81 | 0.74 |
| Life skills (LS) | ||||||
| 56 | λ13 | 0.76 | 0.74 | 0.76 | 0.79 | 0.73 |
| 57 | λ14 | 0.80 | 0.80 | 0.74 | 0.85 | 0.87 |
| 61 | λ15 | 0.77 | 0.76 | 0.72 | 0.75 | 0.84 |
| Willingness to learn (WL) | ||||||
| 63 | λ16 | 0.97 | 0.97 | 0.96 | 0.90 | 0.90 |
| 64 | λ17 | 0.76 | 0.77 | 0.75 | 0.86 | 0.85 |
| 65 | λ18 | 0.76 | 0.81 | 0.81 | 0.84 | 0.82 |
| Latent factor covariance | ||||||
| SK–IU | φsk,iu | 0.81 | 0.82 | 0.82 | 0.85 | 0.81 |
| SK–JU | φsk,ju | 0.83 | 0.85 | 0.84 | 0.78 | 0.76 |
| SK–LK | φsk,lk | 0.79 | 0.77 | 0.75 | 0.75 | 0.70 |
| SK–LS | φsk,ls | 0.76 | 0.78 | 0.79 | 0.82 | 0.70 |
| SK–WL | φsk,wl | 0.66 | 0.67 | 0.67 | 0.73 | 0.64 |
| IU–JU | φiu,ju | 0.96 | 0.95 | 0.95 | 0.94 | 0.97 |
| IU–LK | φiu,lk | 0.73 | 0.69 | 0.62 | 0.81 | 0.81 |
| IU–LS | φiu,ls | 0.94 | 0.93 | 0.92 | 0.95 | 0.96 |
| IU–WL | φiu,wl | 0.85 | 0.83 | 0.89 | 0.90 | 0.92 |
| JU–LK | φju,lk | 0.84 | 0.85 | 0.79 | 0.94 | 0.88 |
| JU–LS | φju,ls | 0.85 | 0.85 | 0.81 | 0.91 | 0.88 |
| JU–WL | φju,wl | 0.75 | 0.75 | 0.75 | 0.81 | 0.85 |
| LK–LS | φlk,ls | 0.76 | 0.73 | 0.71 | 0.87 | 0.75 |
| LK–WL | φlk,wl | 0.52 | 0.49 | 0.48 | 0.71 | 00.69 |
| LS–WL | φls,wl | 0.77 | 0.77 | 0.77 | 0.85 | 0.84 |
| Model fit | ||||||
| n | 136 | 136 | 98 | 260 | 263 | |
| RMSEA | 0.07 | 0.08 | 0.09 | 0.07 | 0.08 | |
| RMSEA 90% confidence interval | 0.05–0.09 | 0.07–0.09 | 0.07–0.11 | 0.06–0.08 | 0.07–0.09 | |
| SRMR | 0.06 | 0.06 | 0.07 | 0.05 | 0.05 | |
| χ2 (df = 120) | 194.540 | 231.227 | 211.623 | 285.375 | 316.482 | |
| χ2/df | 1.62 | 1.93 | 1.76 | 2.38 | 2.64 | |
| CFI | 0.99 | 0.99 | 0.99 | 0.99 | 0.99 | |
| TLI | 0.99 | 0.99 | 0.99 | 0.99 | 0.99 | |
| Scale | (1) | (2) | (3) | (4) | (5) | (6) | (7) | (8) | (9) | (10) | (11) | (12) | (13) | (14) | (15) | (16) |
|---|---|---|---|---|---|---|---|---|---|---|---|---|---|---|---|---|
| 1. BWDS: total score | - | |||||||||||||||
| 2. BWDS: SK | 0.80 | - | ||||||||||||||
| 3. BWDS: IU | 0.84 | 0.60 | - | |||||||||||||
| 4. BWDS: JU | 0.86 | 0.60 | 0.66 | - | ||||||||||||
| 5. BWDS: LK | 0.80 | 0.63 | 0.53 | 0.68 | - | |||||||||||
| 6. BWDS: LS | 0.84 | 0.57 | 0.72 | 0.66 | 0.60 | - | ||||||||||
| 7. BWDS: WL | 0.74 | 0.50 | 0.64 | 0.58 | 0.38 | 0.56 | - | |||||||||
| 8. WDS: total score | 0.95 | 0.73 | 0.83 | 0.79 | 0.75 | 0.81 | 0.70 | - | ||||||||
| 9. WDS: SK | 0.80 | 0.94 | 0.60 | 0.64 | 0.60 | 0.59 | 0.50 | 0.74 | - | |||||||
| 10. WDS: EM | 0.60 | 0.51 | 0.60 | 0.50 | 0.45 | 0.45 | 0.46 | 0.69 | 0.52 | - | ||||||
| 11. WDS: AL | 0.47 | 0.28 | 0.52 | 0.34 | 0.31 | 0.44 | 0.42 | 0.64 | 0.33 | 0.37 | - | |||||
| 12. WDS: IE | 0.74 | 0.54 | 0.83 | 0.60 | 0.49 | 0.65 | 0.55 | 0.86 | 0.56 | 0.67 | 0.61 | - | ||||
| 13. WDS: JU | 0.90 | 0.64 | 0.70 | 0.90 | 0.79 | 0.73 | 0.59 | 0.89 | 0.67 | 0.50 | 0.46 | 0.66 | - | |||
| 14. WDS: LK | 0.79 | 0.64 | 0.55 | 0.68 | 0.88 | 0.60 | 0.46 | 0.81 | 0.61 | 0.47 | 0.38 | 0.55 | 0.80 | - | ||
| 15. WDS: LS | 0.85 | 0.63 | 0.76 | 0.66 | 0.59 | 0.91 | 0.62 | 0.87 | 0.61 | 0.53 | 0.45 | 0.73 | 0.75 | 0.60 | - | |
| 16. WDS: WL | 0.69 | 0.45 | 0.65 | 0.53 | 0.34 | 0.51 | 0.96 | 0.69 | 0.46 | 0.46 | 0.49 | 0.57 | 0.55 | 0.41 | 0.58 | - |
| Scale | PWI | RSE | SAWS | GDS |
|---|---|---|---|---|
| 1. BWDS: total score | 0.43 | 0.45 | 0.75 | −0.43 |
| 2. BWDS: SK | 0.26 | 0.39 | 0.57 | −0.26 |
| 3. BWDS: IU | 0.46 | 0.49 | 0.63 | −0.44 |
| 4. BWDS: JU | 0.35 | 0.36 | 0.67 | −0.39 |
| 5. BWDS: LK | 0.32 | 0.36 | 0.66 | −0.32 |
| 6. BWDS: LS | 0.40 | 0.33 | 0.60 | −0.36 |
| 7. BWDS: WL | 0.31 | 0.28 | 0.51 | −0.35 |
| 8. WDS: total score | 0.46 | 0.47 | 0.76 | −0.44 |
| 9. WDS: SK | 0.33 | 0.40 | 0.59 | −0.27 |
| 10. WDS: EM | 0.53 | 0.47 | 0.51 | −0.51 |
| 11. WDS: AL | 0.26 | 0.24 | 0.33 | −0.25 |
| 12. WDS: IE | 0.56 | 0.56 | 0.60 | −0.47 |
| 13. WDS: JU | 0.35 | 0.37 | 0.75 | −0.38 |
| 14. WDS: LK | 0.26 | 0.31 | 0.72 | −0.26 |
| 15. WDS: LS | 0.39 | 0.38 | 0.64 | −0.36 |
| 16. WDS: WL | 0.31 | 0.26 | 0.48 | −0.35 |
© 2020 by the authors. Licensee MDPI, Basel, Switzerland. This article is an open access article distributed under the terms and conditions of the Creative Commons Attribution (CC BY) license (http://creativecommons.org/licenses/by/4.0/).
Share and Cite
Fung, S.-f.; Chow, E.O.-w.; Cheung, C.-k. Development and Evaluation of the Psychometric Properties of a Brief Wisdom Development Scale. Int. J. Environ. Res. Public Health 2020, 17, 2717. https://0-doi-org.brum.beds.ac.uk/10.3390/ijerph17082717
Fung S-f, Chow EO-w, Cheung C-k. Development and Evaluation of the Psychometric Properties of a Brief Wisdom Development Scale. International Journal of Environmental Research and Public Health. 2020; 17(8):2717. https://0-doi-org.brum.beds.ac.uk/10.3390/ijerph17082717
Chicago/Turabian StyleFung, Sai-fu, Esther Oi-wah Chow, and Chau-kiu Cheung. 2020. "Development and Evaluation of the Psychometric Properties of a Brief Wisdom Development Scale" International Journal of Environmental Research and Public Health 17, no. 8: 2717. https://0-doi-org.brum.beds.ac.uk/10.3390/ijerph17082717