Marathon Run-induced Changes in the Erythropoietin-Erythroferrone-Hepcidin Axis are Iron Dependent

 , , , and
Abstract
:1. Introduction
2. Materials and Methods
2.1. Experimental Approach to the Problem
2.2. Subjects
2.3. Biochemical Analysis
2.4. Analysis of the Hemochromatosis HFE Gene
2.5. Statistical Analyses
3. Results
4. Discussion
Author Contributions
Funding
Acknowledgments
Conflicts of Interest
Abbreviations
References
- Antosiewicz, J.; Kaczor, J.J.; Kasprowicz, K.; Laskowski, R.; Kujach, S.; Luszczyk, M.; Radziminski, L.; Ziemann, E. Repeated “all out” interval exercise causes an increase in serum hepcidin concentration in both trained and untrained men. Cell. Immunol. 2013, 283, 12–17. [Google Scholar] [CrossRef] [PubMed]
- Antosiewicz, J.; Ziolkowski, W.; Kaczor, J.J.; Herman-Antosiewicz, A. Tumor necrosis factor-alpha-induced reactive oxygen species formation is mediated by JNK1-dependent ferritin degradation and elevation of labile iron pool. Free. Radic. Boil. Med. 2007, 43, 265–270. [Google Scholar] [CrossRef] [PubMed]
- Balaban, E.P.; Snell, P.; Stray-Gundersen, J.; Frenkel, E.P. The effect of running on serum and red cell ferritin. A longitudinal comparison. Int. J. Sports Med. 1995, 16, 278–282. [Google Scholar] [CrossRef] [PubMed]
- Borkowska, A.; Sielicka-Dudzin, A.; Herman-Antosiewicz, A.; Halon, M.; Wozniak, M.; Antosiewicz, J. P66Shc mediated ferritin degradation--a novel mechanism of ROS formation. Free. Radic. Boil. Med. 2011, 51, 658–663. [Google Scholar] [CrossRef] [PubMed]
- Candau, R.; Busso, T.; Lacour, J.R. Effects of training on iron status in cross-country skiers. Graefe’s Arch. Clin. Exp. Ophthalmol. 1992, 64, 497–502. [Google Scholar] [CrossRef] [PubMed]
- Frise, M.C.; Cheng, H.-Y.; Nickol, A.H.; Curtis, M.K.; Pollard, K.A.; Roberts, D.J.; Ratcliffe, P.J.; Dorrington, K.L.; Robbins, P.A. Clinical iron deficiency disturbs normal human responses to hypoxia. J. Clin. Investig. 2016, 126, 2139–2150. [Google Scholar] [CrossRef]
- Ganz, T.; Nemeth, E. Iron imports. IV. Hepcidin and regulation of body iron metabolism. Am. J. Physiol. Liver Physiol. 2006, 290, G199–G203. [Google Scholar] [CrossRef] [Green Version]
- Halon-Golabek, M.; Borkowska, A.; Kaczor, J.J.; Ziolkowski, W.; Flis, D.; Knap, N.; Kasperuk, K.; Antosiewicz, J. hmSOD1 gene mutation-induced disturbance in iron metabolism is mediated by impairment of Akt signalling pathway. J. Cachex- Sarcopenia Muscle 2018, 9, 557–569. [Google Scholar] [CrossRef] [Green Version]
- Jacobs, A.; Worwood, M. Ferritin in serum. Clinical and biochemical implications. N. Engl. J. Med. 1975, 292, 951–956. [Google Scholar] [CrossRef]
- Kaczorowska-Hac, B.; Luszczyk, M.; Antosiewicz, J.; Ziolkowski, W.; Adamkiewicz-Drozynska, E.; Mysliwiec, M.; Milosz, E.; Kaczor, J.J. HFE Gene Mutations and Iron Status in 100 Healthy Polish Children. J. Pediatr. Hematol. 2017, 39, e240–e243. [Google Scholar] [CrossRef] [Green Version]
- Kasprowicz, K.; Ziemann, E.; Ratkowski, W.; Laskowski, R.; Kaczor, J.J.; Dadci, R.; Antosiewicz, J. Running a 100-km ultra-marathon induces an inflammatory response but does not raise the level of the plasma iron-regulatory protein hepcidin. J. Sports Med. Phys. Fit. 2013, 53, 533–537. [Google Scholar]
- Kautz, L.; Jung, G.; Valore, E.V.; Rivella, S.; Nemeth, E.; Ganz, T. Identification of erythroferrone as an erythroid regulator of iron metabolism. Nat. Genet. 2014, 46, 678–684. [Google Scholar] [CrossRef] [PubMed] [Green Version]
- Klausen, T.; Breum, L.; Fogh-Andersen, N.; Bennett, P.; Hippe, E. The effect of short and long duration exercise on serum erythropoietin concentrations. Graefe’s Arch. Clin. Exp. Ophthalmol. 1993, 67, 213–217. [Google Scholar] [CrossRef] [PubMed]
- Kortas, J.; Kuchta, A.; Prusik, K.; Prusik, K.; Ziemann, E.; Labudda, S.; Ćwiklińska, A.; Wieczorek, E.; Jankowski, M.; Antosiewicz, J. Nordic walking training attenuation of oxidative stress in association with a drop in body iron stores in elderly women. Biogerontology 2017, 18, 517–524. [Google Scholar] [CrossRef] [PubMed] [Green Version]
- Antosiewicz, J.; Kortas, J.; Prusik, K.; Flis, D.; Leaver, N.; Ziemann, E.; Prusik, K. Effect of Nordic Walking training on iron metabolism in elderly women. Clin. Interv. Aging 2015, 10, 1889–1896. [Google Scholar] [CrossRef] [PubMed] [Green Version]
- Lakka, T.A.; Nyyssönen, K.; Salonen, J. Higher Levels of Conditioning Leisure Time Physical Activity are Associated with Reduced Levels of Stored iron in Finnish Men. Am. J. Epidemiol. 1994, 140, 148–160. [Google Scholar] [CrossRef] [PubMed]
- Luo, Y.; Yoneda, J.; Ohmori, H.; Sasaki, T.; Kuniyasu, H. Abstract 3380: Cancer usurps skeletal muscle as an energy repository. Mol. Cell. Biol. 2014, 74, 3380. [Google Scholar]
- Nai, A.; Lidonnici, M.R.; Rausa, M.; Mandelli, G.; Pagani, A.; Silvestri, L.; Ferrari, G.; Camaschella, C. The second transferrin receptor regulates red blood cell production in mice. Blood 2015, 125, 1170–1179. [Google Scholar] [CrossRef] [Green Version]
- Nai, A.; Pellegrino, R.M.; Rausa, M.; Pagani, A.; Boero, M.; Silvestri, L.; Saglio, G.; Roetto, A.; Camaschella, C. The erythroid function of transferrin receptor 2 revealed by Tmprss6 inactivation in different models of transferrin receptor 2 knockout mice. Haematology 2014, 99, 1016–1021. [Google Scholar] [CrossRef] [Green Version]
- Nemeth, E.; Roetto, A.; Garozzo, G.; Ganz, T.; Camaschella, C. Hepcidin is decreased in TFR2 hemochromatosis. Blood 2005, 105, 1803–1806. [Google Scholar] [CrossRef] [Green Version]
- Nemeth, E.; Tuttle, M.; Powelson, J.; Vaughn, M.B.; Donovan, A.; Ward, D.M.; Ganz, T.; Kaplan, J. Hepcidin Regulates Cellular Iron Efflux by Binding to Ferroportin and Inducing Its Internalization. Science 2004, 306, 2090–2093. [Google Scholar] [CrossRef] [PubMed] [Green Version]
- Peeling, P. Exercise as a mediator of hepcidin activity in athletes. Graefe’s Arch. Clin. Exp. Ophthalmol. 2010, 110, 877–883. [Google Scholar] [CrossRef] [PubMed]
- Peeling, P.; Sim, M.; Badenhorst, C.; Dawson, B.; Govus, A.; Abbiss, C.; Swinkels, R.W.; Trinder, D. Iron Status and the Acute Post-Exercise Hepcidin Response in Athletes. PLoS ONE 2014, 9, e93002. [Google Scholar] [CrossRef]
- Roecker, L.; Meier-Buttermilch, R.; Brechtel, L.; Nemeth, E.; Ganz, T. Iron-regulatory protein hepcidin is increased in female athletes after a marathon. Graefe’s Arch. Clin. Exp. Ophthalmol. 2005, 95, 569–571. [Google Scholar] [CrossRef]
- Schwandt, H.-J.; Heyduck, B.; Gunga, H.-C. Influence of prolonged physical exercise on the erythropoietin concentration in blood. Graefe’s Arch. Clin. Exp. Ophthalmol. 1991, 63, 463–466. [Google Scholar] [CrossRef]
- Sullivan, J.L. Is stored iron safe? J. Lab. Clin. Med. 2004, 144, 280–284. [Google Scholar] [CrossRef]
- Falzacappa, M.V.V.; Spasić, M.V.; Kessler, R.; Stolte, J.; Hentze, M.W.; Muckenthaler, M.U. STAT3 mediates hepatic hepcidin expression and its inflammatory stimulation. Blood 2006, 109, 353–358. [Google Scholar] [CrossRef] [Green Version]
- Worwood, M. Haemochromatosis. Int. J. Lab. Hematol. 1998, 20, 65–75. [Google Scholar] [CrossRef]
- Zacharski, L.R.; Chow, B.K.; Howes, P.S.; Shamayeva, G.; Baron, J.A.; Dalman, R.L.; Malenka, D.J.; Ozaki, C.K.; Lavori, P.W. Decreased Cancer Risk after Iron Reduction in Patients with Peripheral Arterial Disease: Results From a Randomized Trial. J. Natl. Cancer Inst. 2008, 100, 996–1002. [Google Scholar] [CrossRef] [Green Version]
- Zaloumis, S.; Allen, K.J.; Bertalli, N.A.; Turkovic, L.; Delatycki, M.B.; Nicoll, A.J.; McLaren, C.E.; English, D.R.; Hopper, J.; Giles, G.G.; et al. Natural history of HFE simple heterozygosity for C282Y and H63D: A prospective 12-year study. J. Gastroenterol. Hepatol. 2015, 30, 719–725. [Google Scholar] [CrossRef]


| Baseline (n = 29) | |
|---|---|
| Age [years] | 39.29 ± 8.58 |
| Height [m] | 1.79 ± 0.05 |
| Body mass [kg] | 79.76 ± 7.50 |
| BMI [kg/m2] | 24.89 ± 2.13 |
| Training [h/week] | 6.39 ± 2.28 |
| Training [km/week] | 55.84 ± 19.77 |
| Pre | Post1 | Post2 | |
|---|---|---|---|
| (n = 29) | (n = 29) | (n = 29) | |
| Fe [μg/dL] | 113.57 ± 47.27 | 115.10 ± 31.67 | 114.34 ± 47.12 |
| Ferritin [ng/mL] | 84.79 ± 51.36 | 93.32 ± 61.90 | 80.22 ± 55.65 |
| Transferrin [mg/dL] | 277.21 ± 33.66 | 303.59 ± 39.75 a, p = 0.01 | 278.34 ± 29.16 b, p = 0.02 |
| TIBC [μg/dL] | 316.76 ± 41.92 | 345.38 ± 42.65 a, p = 0.03 | 302.36 ± 41.03 b, p = 0.00 |
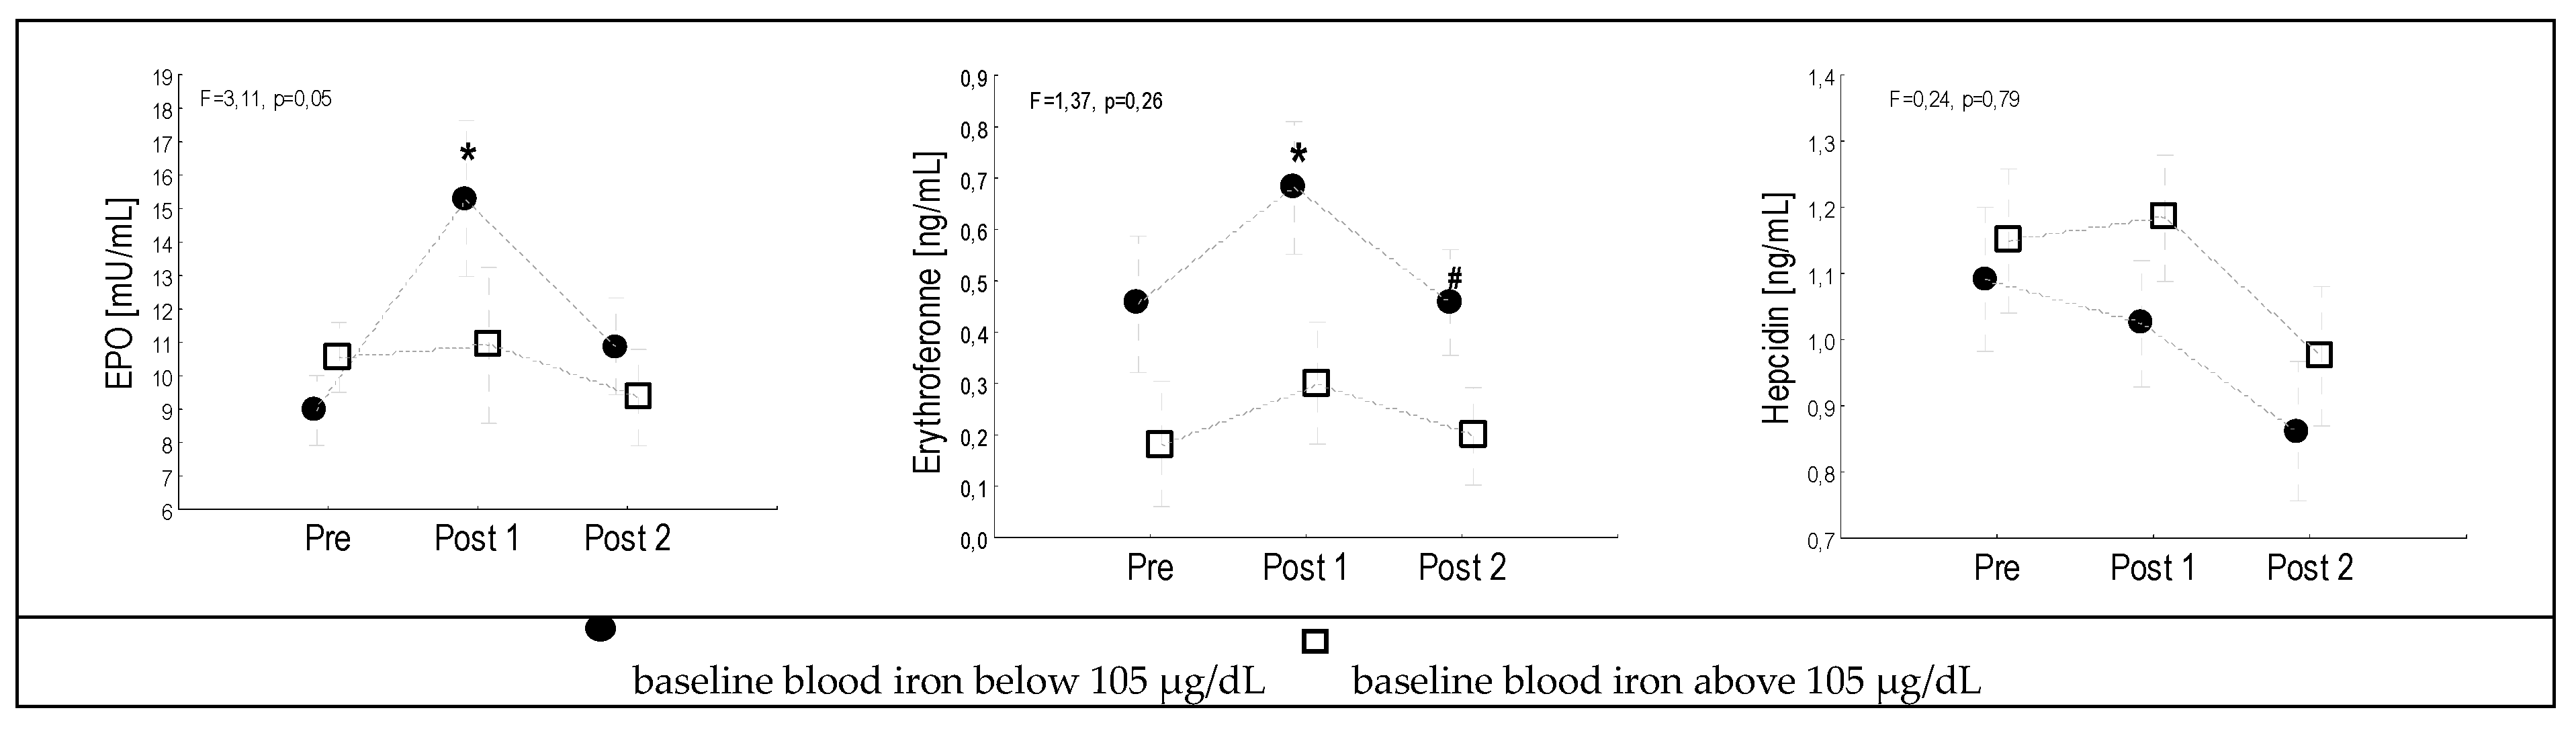
| ERFE [ng/mL] | 0.27 ± 0.43 | 0.42 ± 0.43 | 0.30 ± 0.35 |
| EPO [mU/mL] | 9.60 ± 3.61 | 13.09 ± 8.37 a, p = 0.03 | 10.27 ± 4.99 |
| Hpc [ng/mL] | 1.12 ± 0.39 | 1.09 ± 0.36 | 0.92 ± 0.38 |
| HMGB-1 [ng/mL] | 21.92 ± 3.91 | 21.17 ± 5.63 | 19.74 ± 4.06 a, p = 0.04 |
| Pentraxin3 [pg/mL] | 250.28 ± 85.93 | 403.68 ± 258.45 a, p = 0.00 | 166.70 ± 70.49 b, p = 0.00 |
| Leukocytes [G/L] | 6.03 ± 1.14 | 16.82 ± 3.59 a, p = 0.00 | 6.05 ± 1.88 b, p = 0.00 |
| Neutrophils [G/L] | 3.27 ± 0.85 | 14.12 ± 3.18 a, p = 0.00 | 3.35 ± 1.57 b, p = 0.00 |
| CK [U/L] | 158.00 ± 76.26 | 411.14 ± 173.50 a, p = 0.00 | 225.81 ± 142.49 b, p = 0.00 |
| Group | Pre | Post 1 | Post 2 | |
|---|---|---|---|---|
| Fe [μg/dL] | ∆Hpc↑ (n = 14) | 113.64 ± 54.60 | 115.64 ± 30.58 | 98.29 ± 39.78 |
| ∆Hpc↓ (n = 15) | 113.50 ± 40.73 | 114.60 ± 33.71 | 129.33 ± 49.73 | |
| Ferritin [ng/mL] | ∆Hpc↑ (n = 14) | 80.51 ± 46.16 | 88.84 ± 60.31 | 76.87 ± 59.26 |
| ∆Hpc↓ (n = 15) | 88.79 ± 57.11 | 97.49 ± 65.17 | 83.35 ± 53.96 | |
| Transferrin [mg/dL] | ∆Hpc↑ (n = 14) | 280.50 ± 40.72 | 310.21 ± 46.60 a, p = 0.00 | 279.07 ±28.49 b, p = 0.00 |
| ∆Hpc↓ (n = 15) | 274.13 ± 26.56 | 297.40 ± 32.53 a, p = 0.00 | 277.67 ± 30.74 b, p = 0.00 | |
| TIBC [μg/dL] | ∆Hpc↑ (n = 14) | 314.93 ± 47.53 | 352.07 ± 47.42 a, p = 0.00 | 304.00 ± 35.91 b, p = 0.00 |
| ∆Hpc↓ (n = 15) | 318.47 ± 37.56 | 339.13 ± 38.26 | 300.83 ± 46.53 b, p = 0.00 | |
| ERFE [ng/mL] | ∆Hpc↑ (n = 14) | 0.40 ± 0.60 | 0.45 ± 0.57 | 0.36 ± 0.48 |
| ∆Hpc↓ (n = 15) | 0.16 ± 0.13 | 0.40 ± 0.27 a, p = 0.00 | 0.24 ± 0.12 b, p = 0.00 | |
| EPO [mU/mL] | ∆Hpc↑ (n = 14) | 9.34 ± 2.85 | 14.24 ± 9.65 | 8.91 ± 2.86 b, p = 0.00 |
| ∆Hpc↓ (n = 15) | 9.85 ± 4.29 | 12.17 ± 7.42 | 11.53 ± 6.21 | |
| Hpc [ng/mL] | ∆Hpc↑ (n = 14) | 0.81 ± 0.23 † | 1.09 ± 0.37 a, p = 0.00 | 0.77 ± 0.28 b, p = 0.00 |
| ∆Hpc↓ (n = 15) | 1.41 ± 0.28 | 1.09 ± 0.35 a, p = 0.00 | 1.06 ± 0.42 a, p = 0.00 | |
| HMGB-1 [ng/mL] | ∆Hpc↑ (n = 14) | 21.57 ± 3.51 | 20.67 ± 4.35 | 18.88 ± 4.35 |
| ∆Hpc↓ (n = 15) | 22.24 ± 4.34 | 21.64 ± 6.73 | 20.55 ± 3.74 | |
| Pentraxin3 [pq/mL] | ∆Hpc↑ (n = 14) | 266.24 ± 97.66 | 351.49 ± 238.99 | 171.72 ± 67.56 |
| ∆Hpc↓ (n = 15) | 235.46 ± 73.96 | 452.1 ±274.99 a, p = 0.00 | 162.41 ± 75.17 b, p = 0.00 | |
| Leukocytes [G/L] | ∆Hpc↑ (n = 14) | 5.86 ± 1.15 | 16.42 ± 3.57 a, p = 0.00 | 6.10 ± 2.30 b, p = 0.00 |
| ∆Hpc↓ (n = 15) | 6.21 ± 1.15 | 17.22 ± 3.70 a, p = 0.00 | 6.00 ± 1.43 b, p = 0.00 | |
| Neutrophils [G/L] | ∆Hpc↑ (n = 14) | 3.14 ± 0.73 | 13.75 ± 3.02 a, p = 0.00 | 3.47 ± 2.00 b, p = 0.00 |
| ∆Hpc↓ (n = 15) | 3.41 ± 0.96 | 14.48 ± 3.40 a, p = 0.00 | 3.22 ± 1.04 b, p = 0.00 | |
| CK [U/L] | ∆Hpc↑ (n = 14) | 144.92 ± 63.51 | 445.86±193.25 a, p = 0.00 | 206.77 ±121.52 b, p = 0.00 |
| ∆Hpc↓ (n = 15) | 165.79 ± 87.34 | 376.43±150.26 a, p = 0.00 | 243.50 ±162.10 b, p = 0.00 |
© 2020 by the authors. Licensee MDPI, Basel, Switzerland. This article is an open access article distributed under the terms and conditions of the Creative Commons Attribution (CC BY) license (http://creativecommons.org/licenses/by/4.0/).
Share and Cite
Tomczyk, M.; Kortas, J.; Flis, D.; Kaczorowska-Hac, B.; Grzybkowska, A.; Borkowska, A.; Lewicka, E.; Dabrowska-Kugacka, A.; Antosiewicz, J. Marathon Run-induced Changes in the Erythropoietin-Erythroferrone-Hepcidin Axis are Iron Dependent. Int. J. Environ. Res. Public Health 2020, 17, 2781. https://0-doi-org.brum.beds.ac.uk/10.3390/ijerph17082781
Tomczyk M, Kortas J, Flis D, Kaczorowska-Hac B, Grzybkowska A, Borkowska A, Lewicka E, Dabrowska-Kugacka A, Antosiewicz J. Marathon Run-induced Changes in the Erythropoietin-Erythroferrone-Hepcidin Axis are Iron Dependent. International Journal of Environmental Research and Public Health. 2020; 17(8):2781. https://0-doi-org.brum.beds.ac.uk/10.3390/ijerph17082781
Chicago/Turabian StyleTomczyk, Maja, Jakub Kortas, Damian Flis, Barbara Kaczorowska-Hac, Agata Grzybkowska, Andzelika Borkowska, Ewa Lewicka, Alicja Dabrowska-Kugacka, and Jędrzej Antosiewicz. 2020. "Marathon Run-induced Changes in the Erythropoietin-Erythroferrone-Hepcidin Axis are Iron Dependent" International Journal of Environmental Research and Public Health 17, no. 8: 2781. https://0-doi-org.brum.beds.ac.uk/10.3390/ijerph17082781