Uncertain Multiplicative Language Decision Method Based on Group Compromise Framework for Evaluation of Mobile Medical APPs in China


Abstract
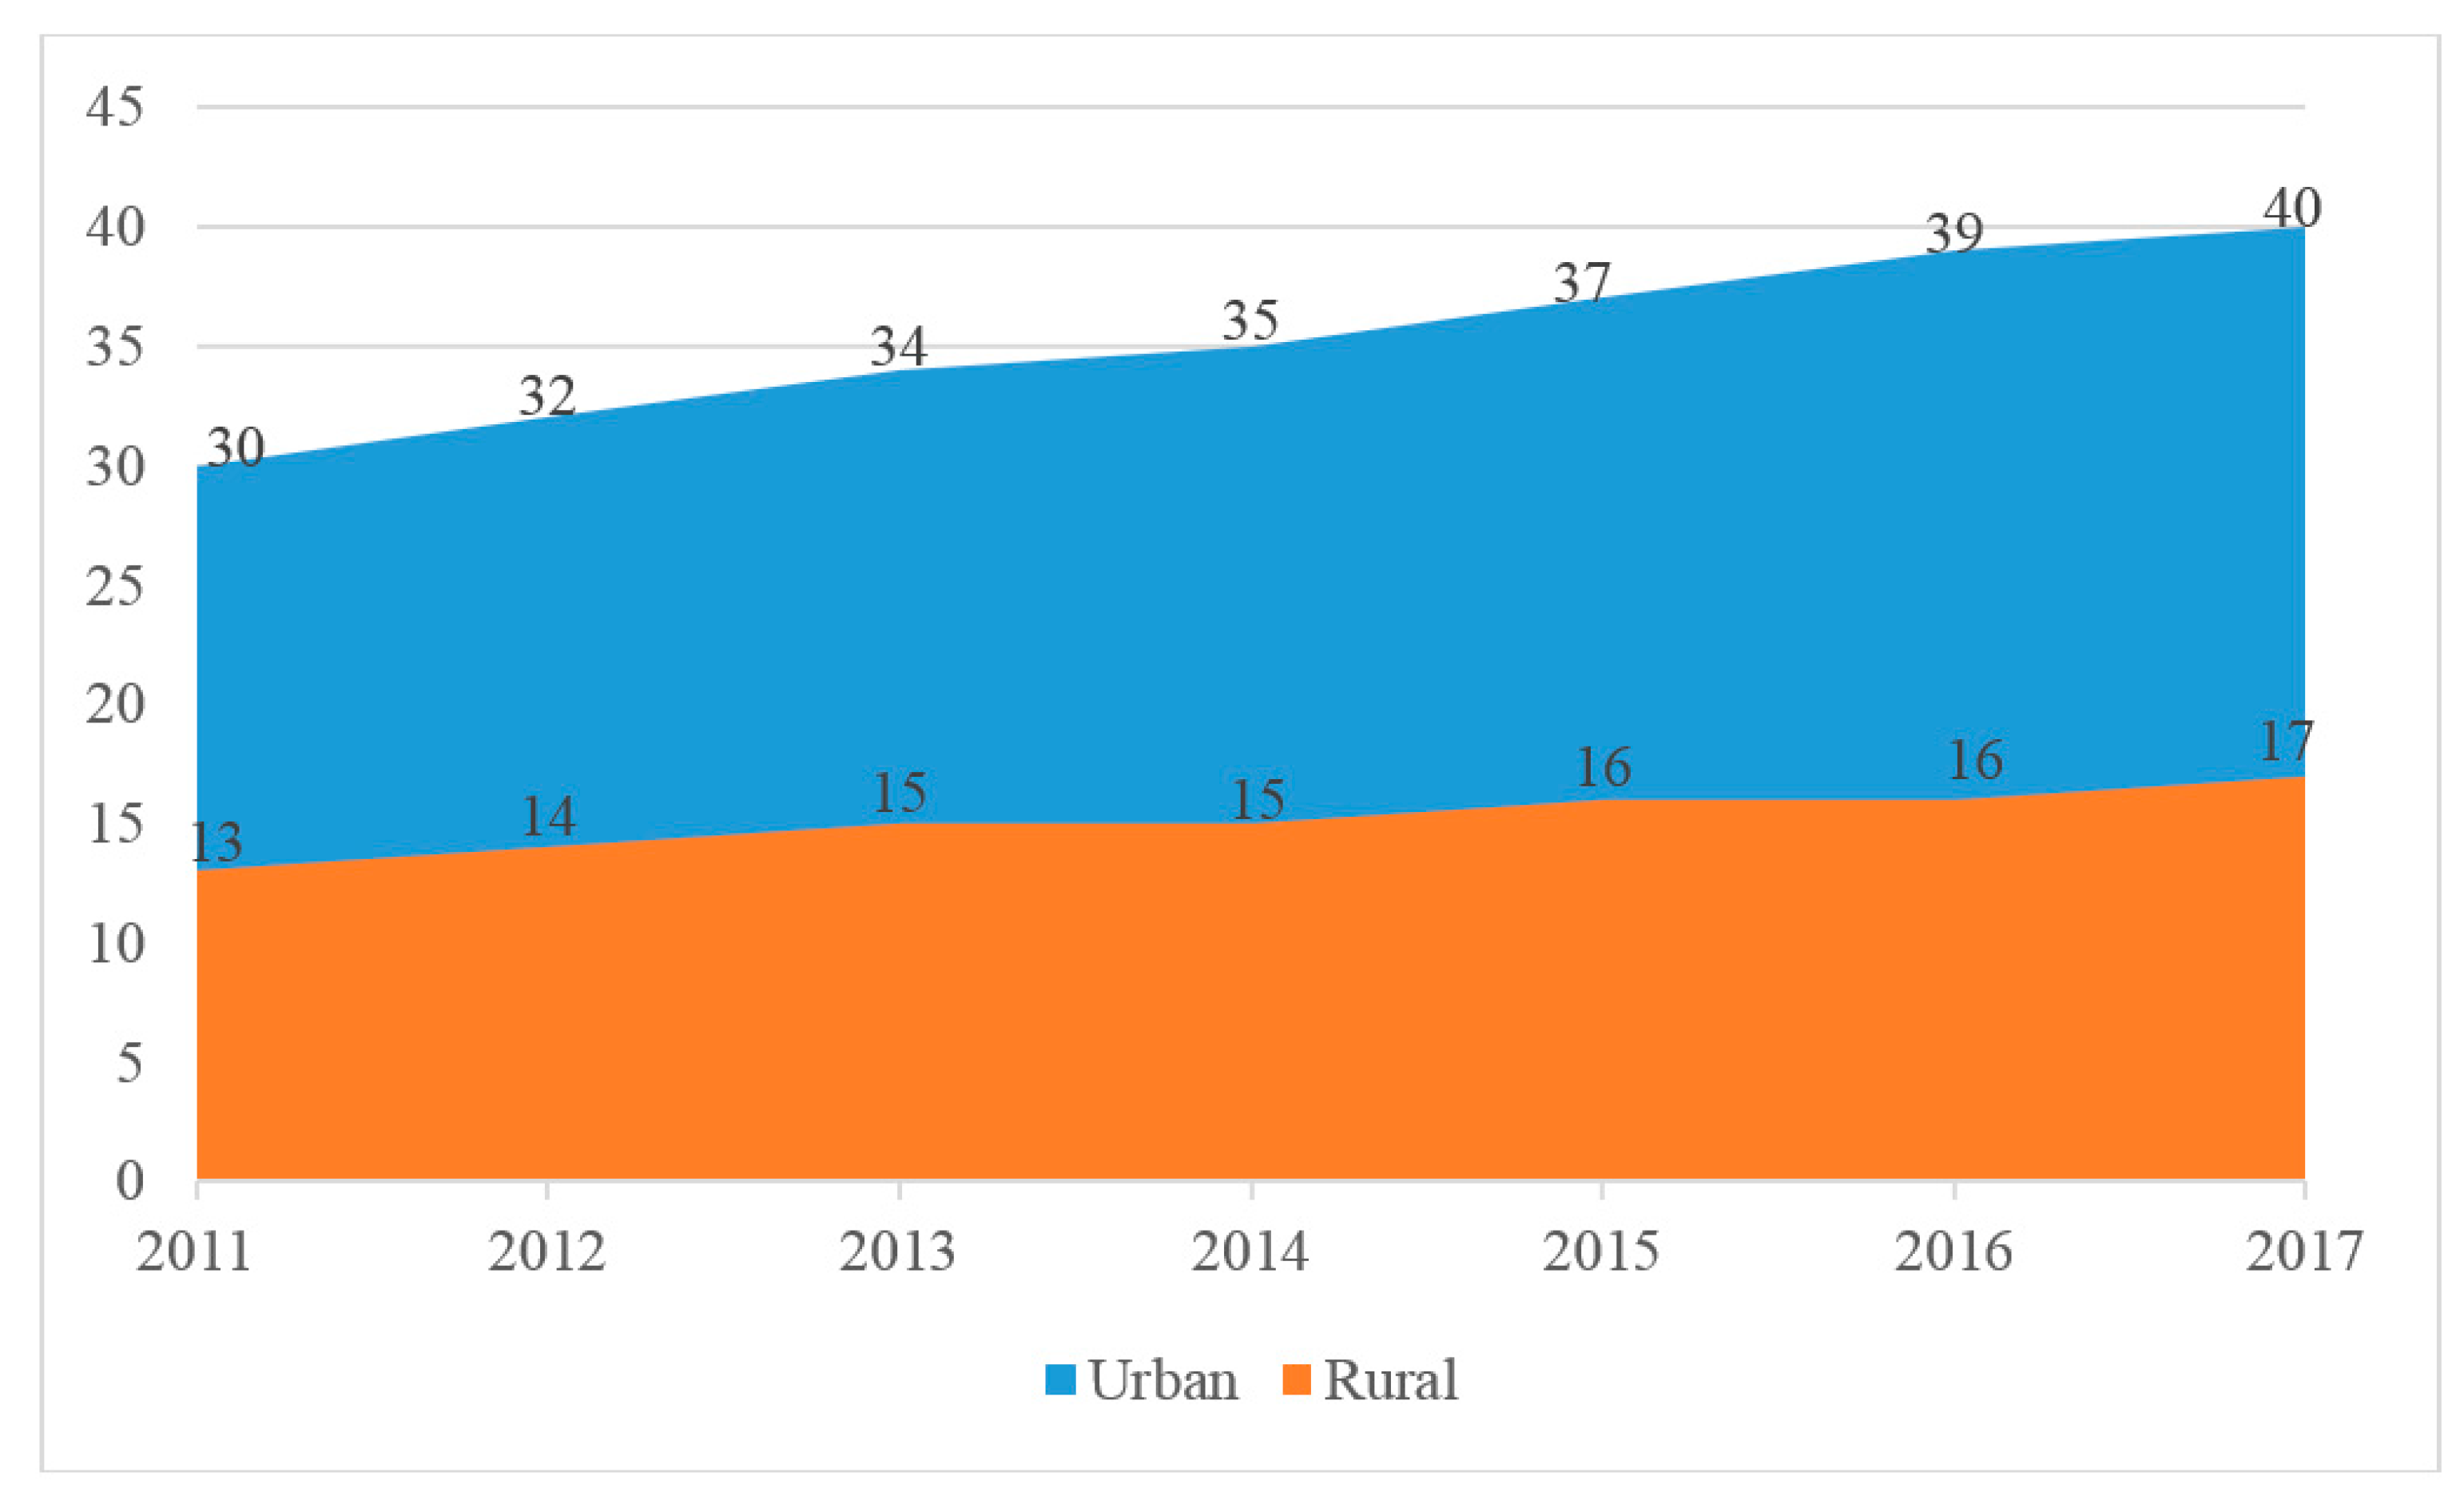
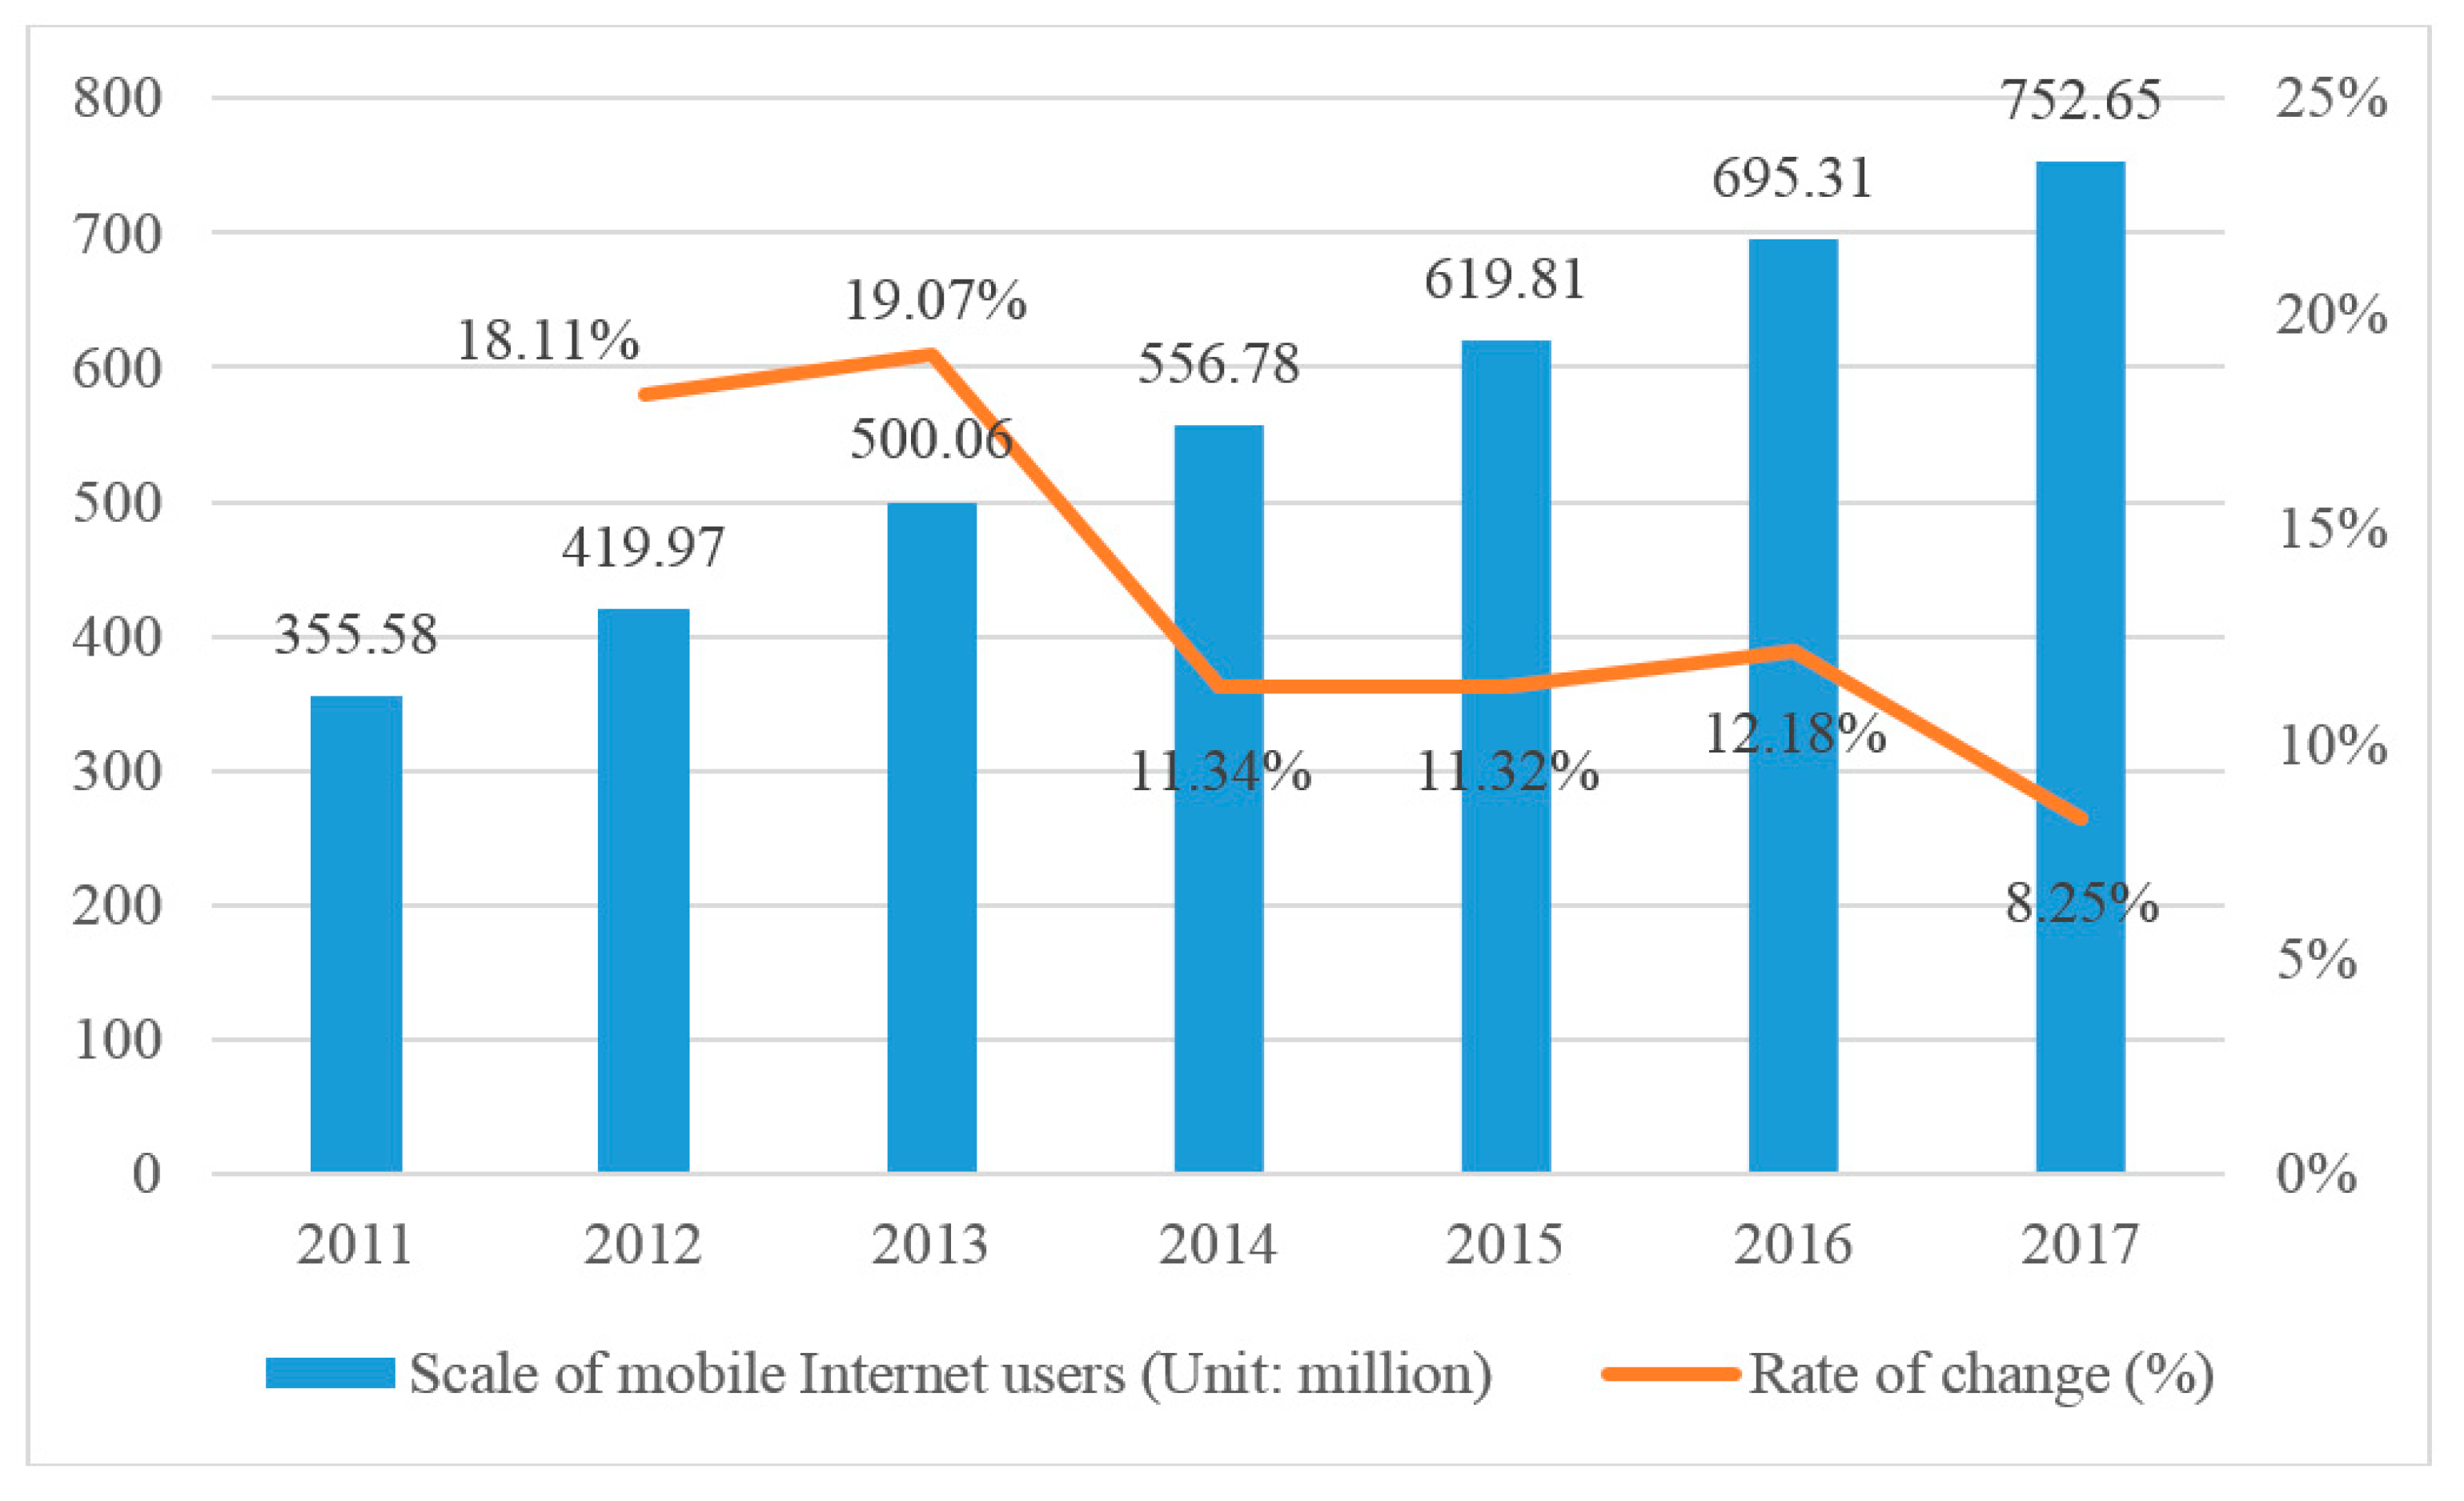
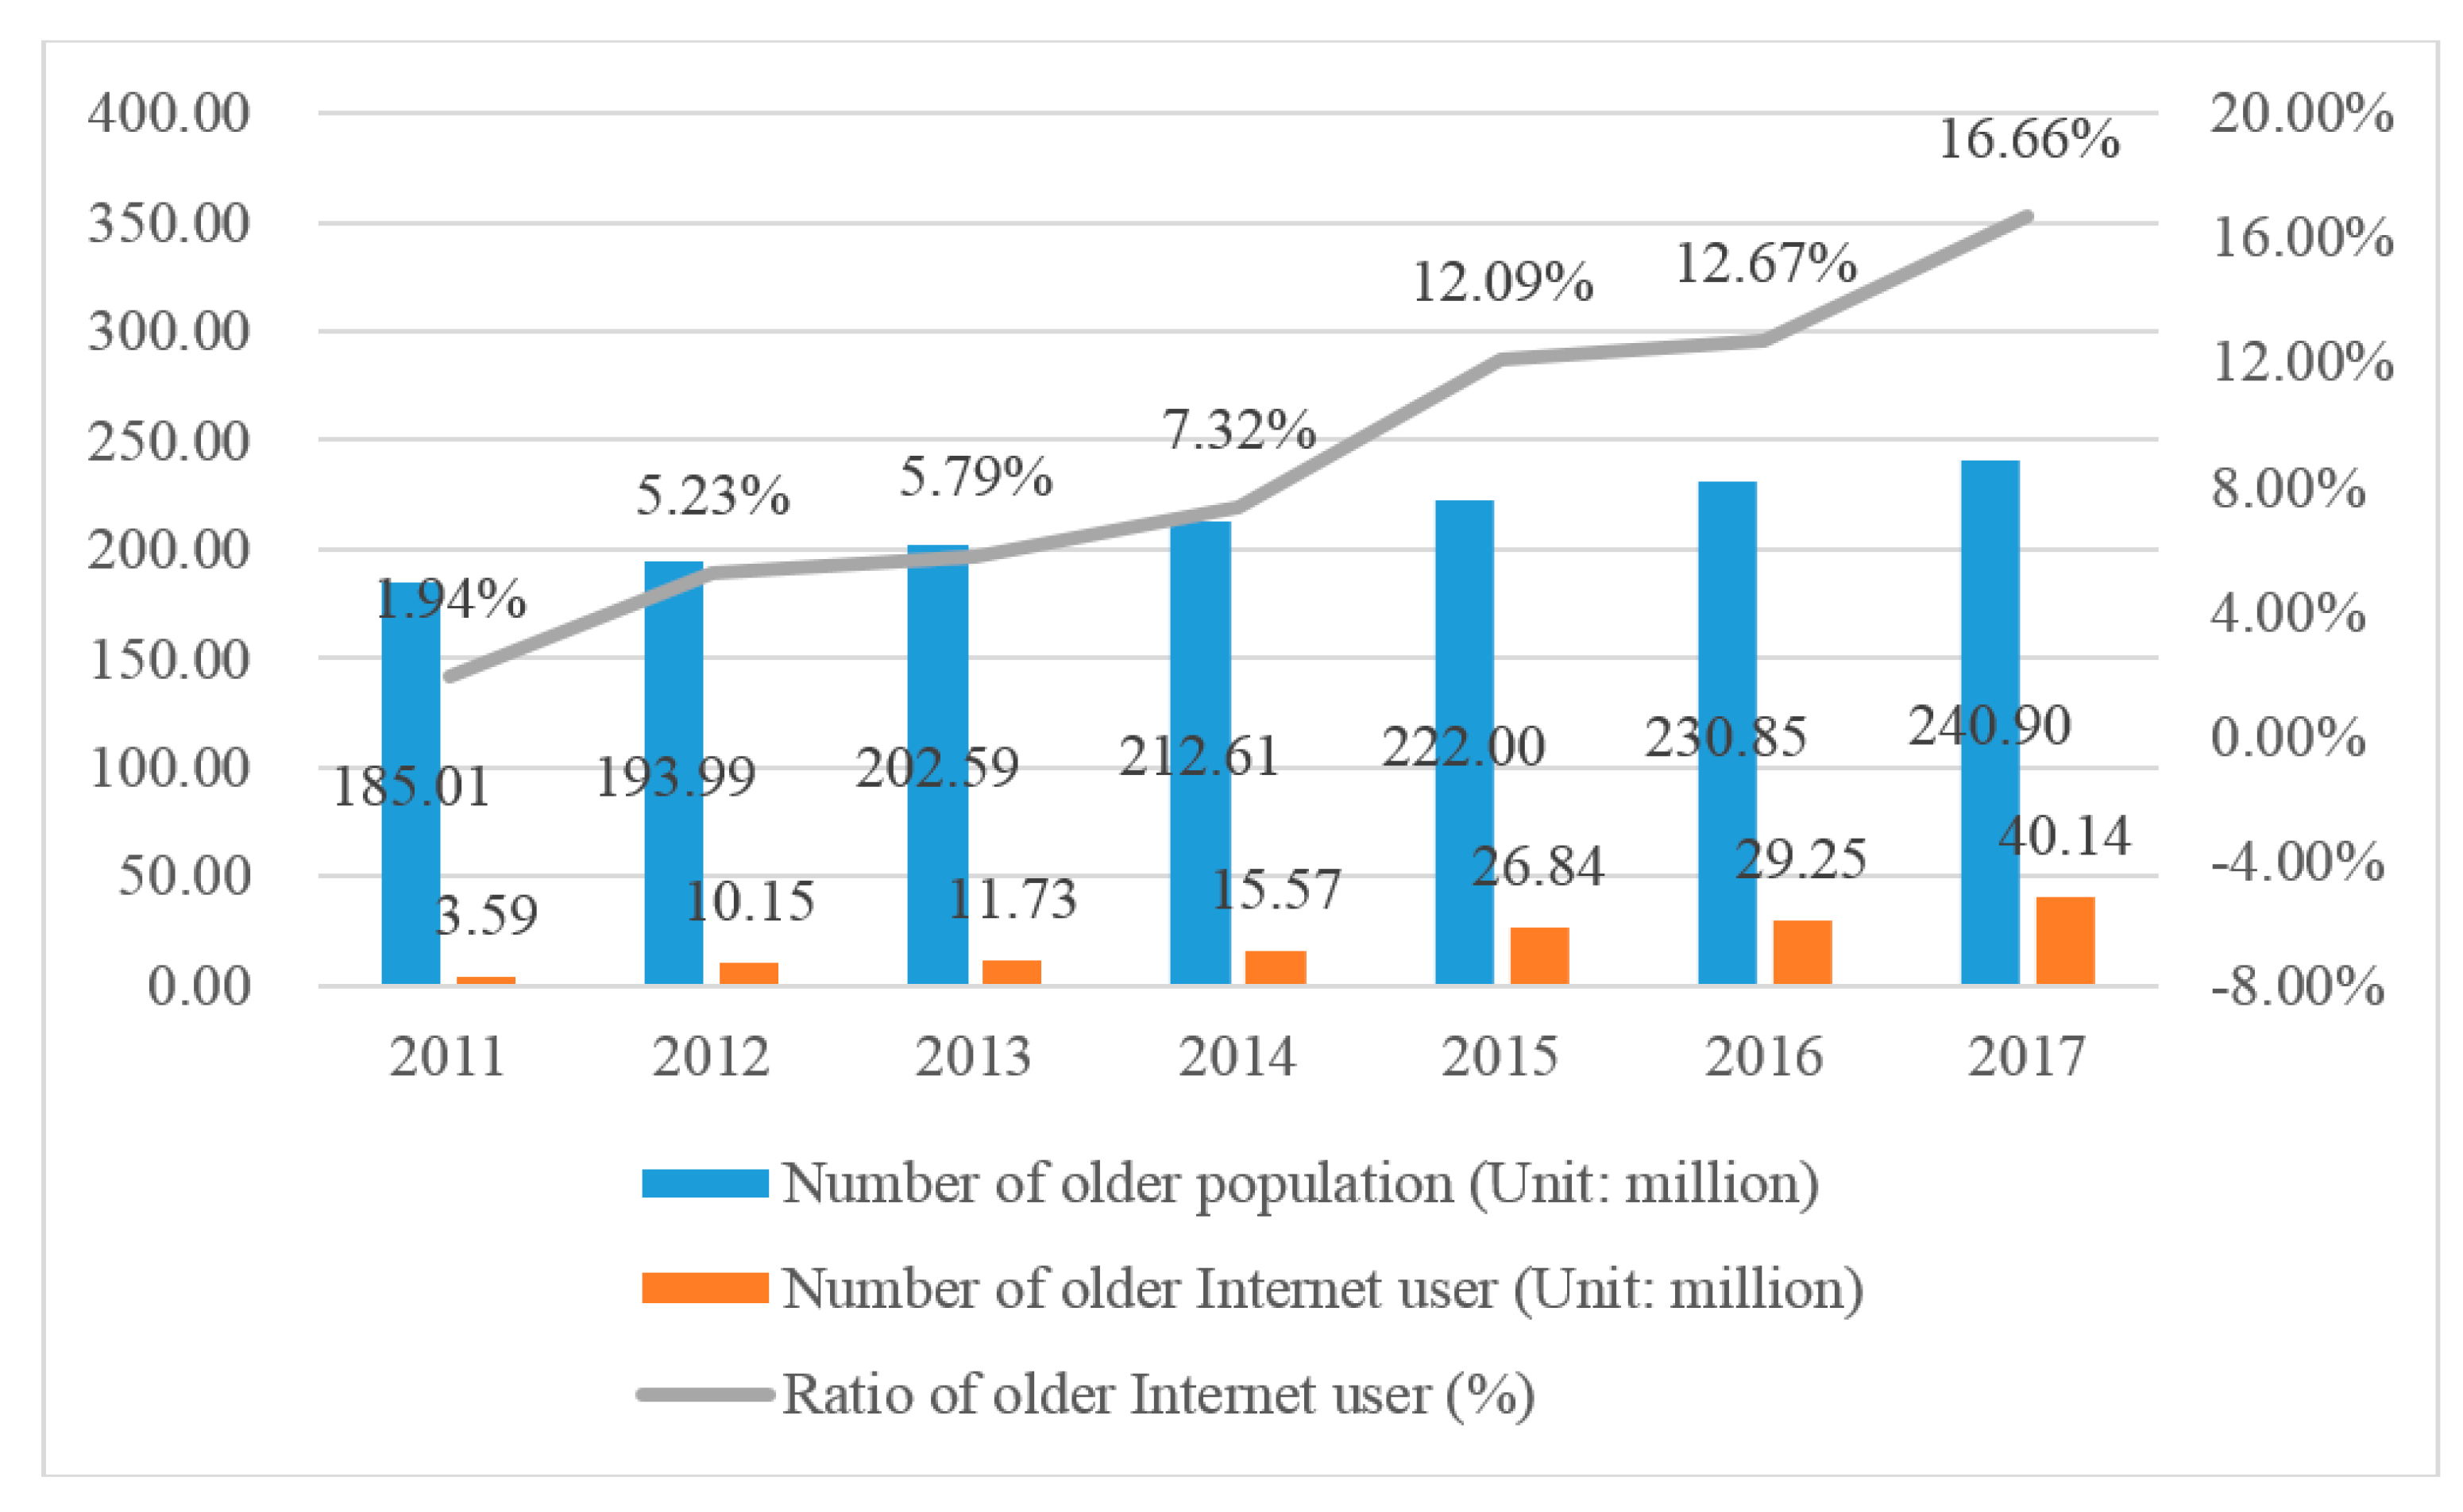
:1. Introduction
2. Related Literature
3. Mobile Medical Service for Public
3.1. Information Inquiry
3.2. Consult with Doctor
3.3. Registration and Appointment
3.4. Electronic Prescription
3.5. Other Services
4. Preliminaries
- (a)
- ;
- (b)
- .
- (a)
- ;
- (b)
- ;
- (c)
- .
- (a)
- ;
- (b)
- If and only if , then ;
- (c)
- If and only if , then ;
- (d)
- , specially ;
- (e)
- If and only if , then ; If and only if , then ;
- (f)
- If and , then .
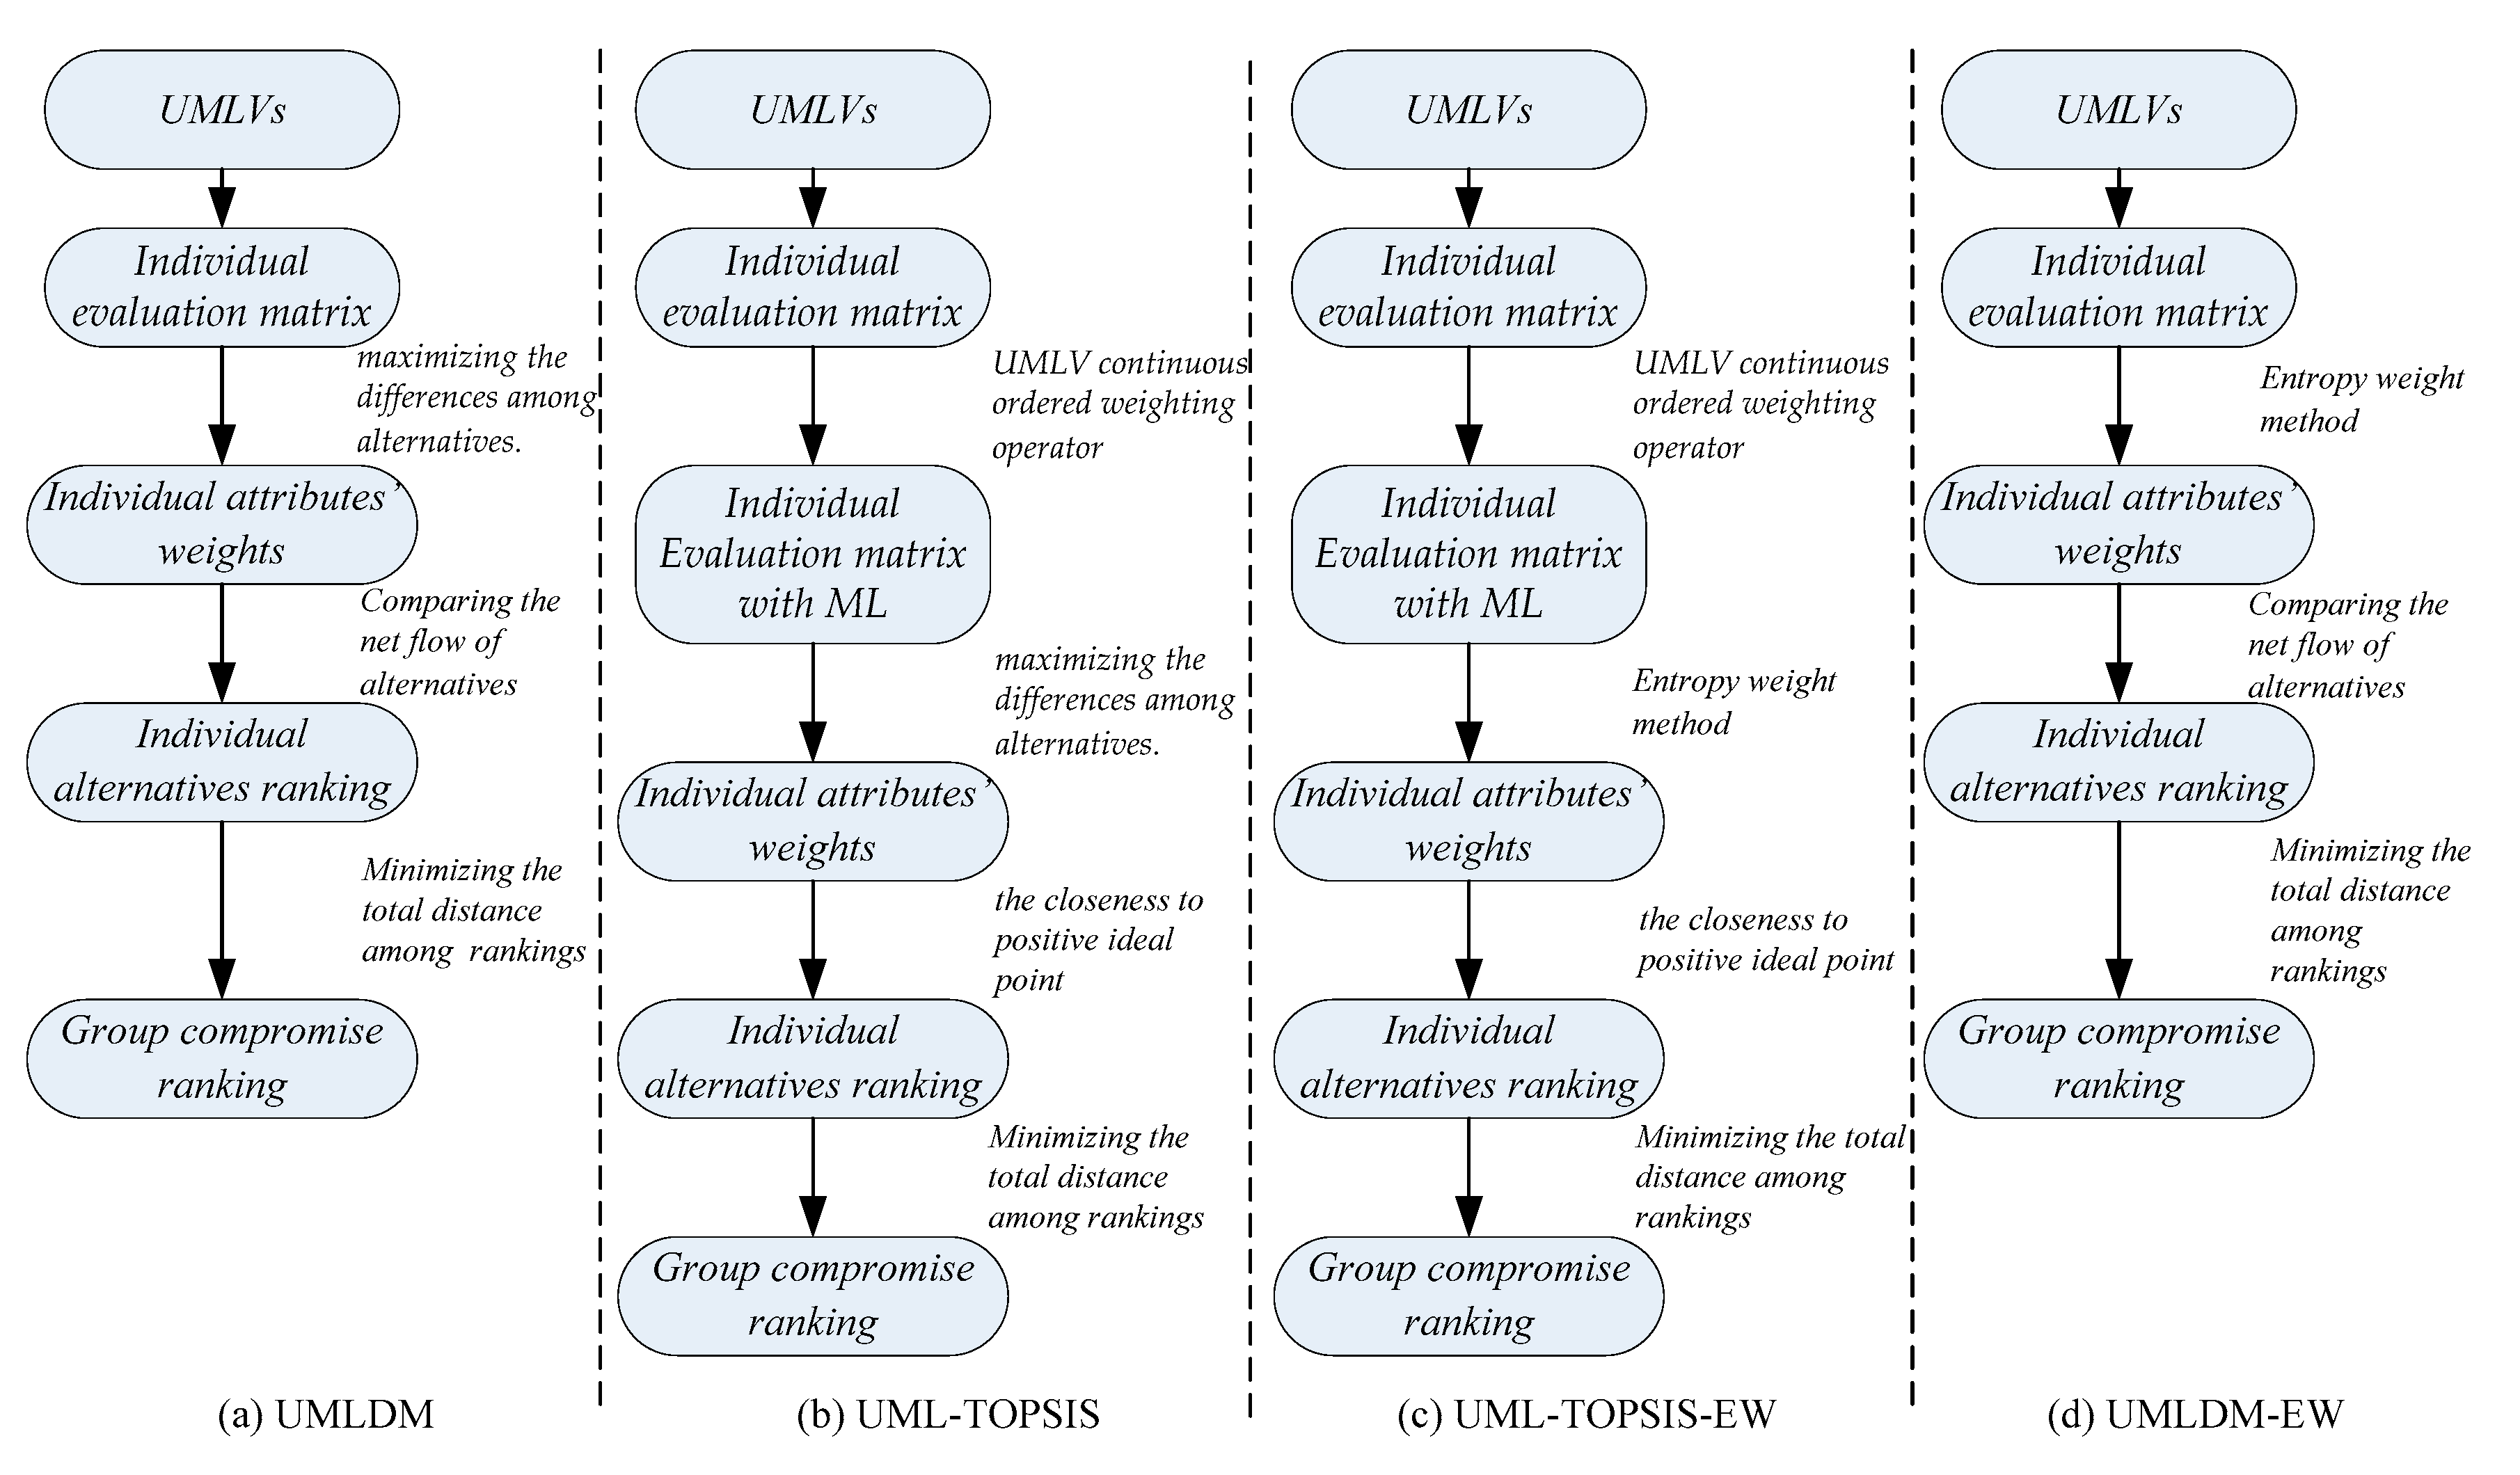
5. Uncertain Multiplicative Linguistic Decision Method
5.1. Individual Alternatives Ranking
5.1.1. Individual Decision Matrix
5.1.2. Individual Attributes’ Weights
5.1.3. Net Flow of Alternatives
- (a)
- if , is strictly superior to , noted as ;
- (b)
- if , does not differ with , noted as .
5.2. Group Compromise Ranking
5.3. UMLDM Algorithm
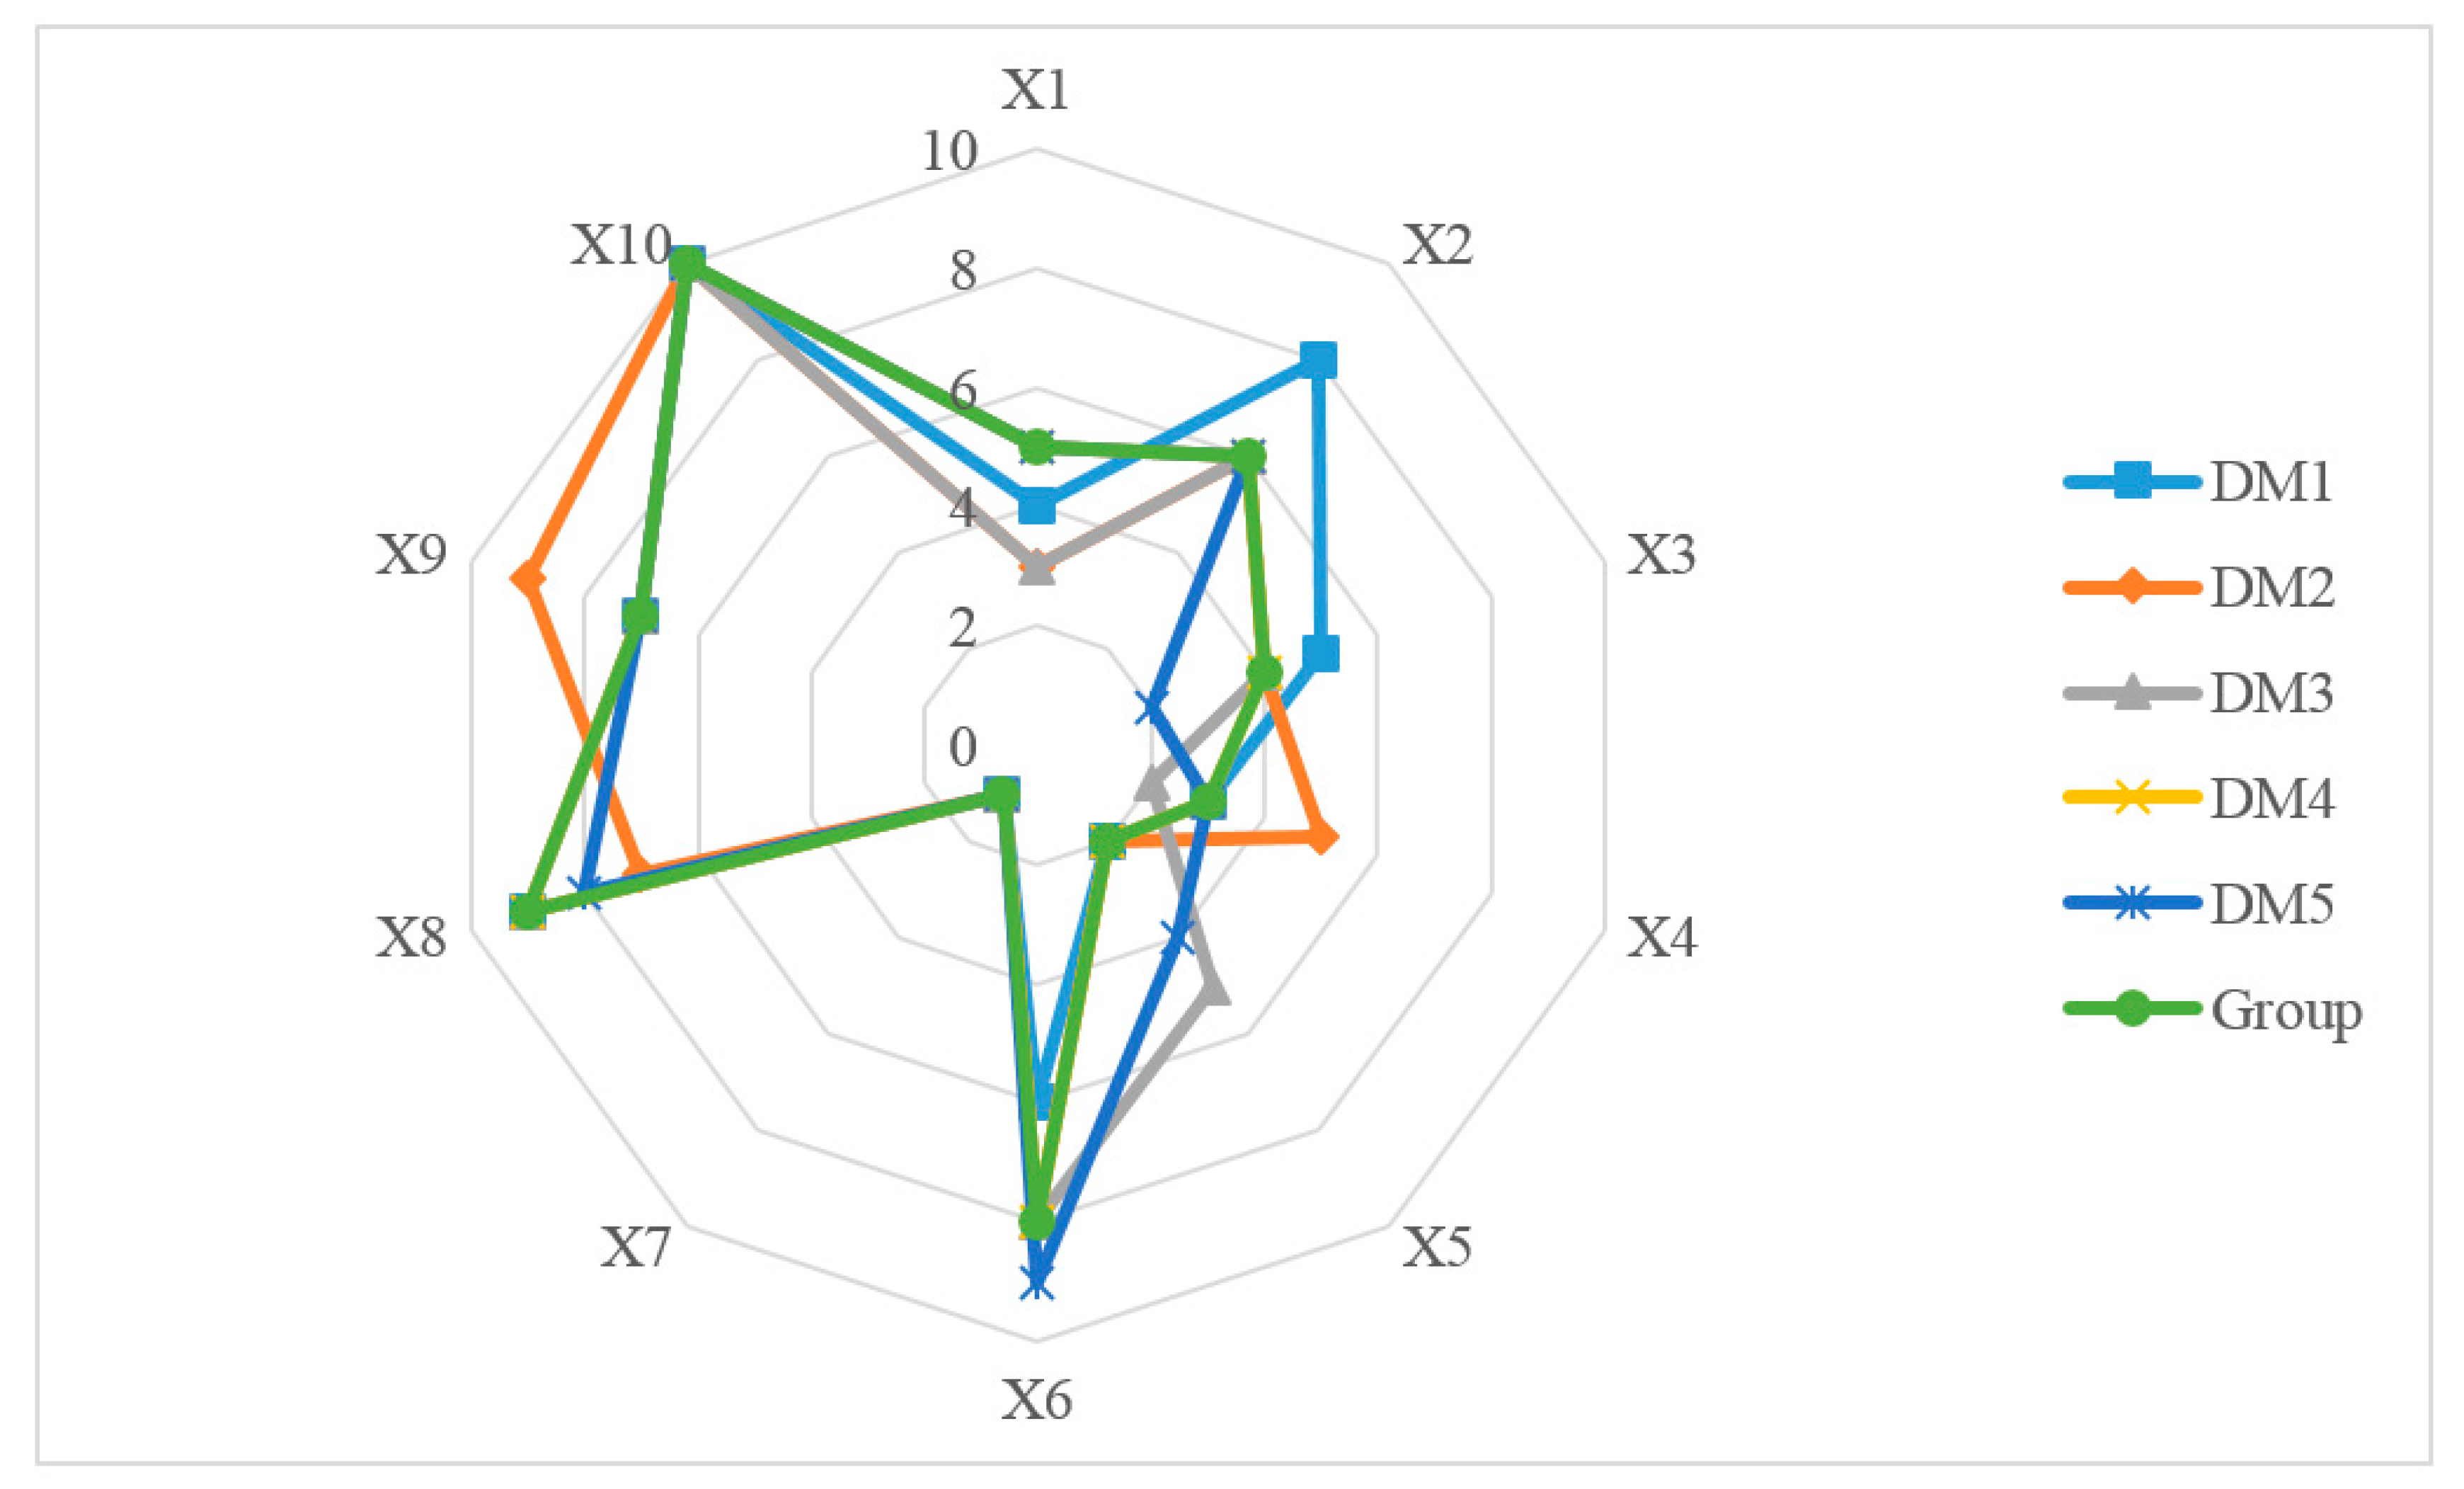
6. Empirical Analysis
6.1. The Assessment Indicator System
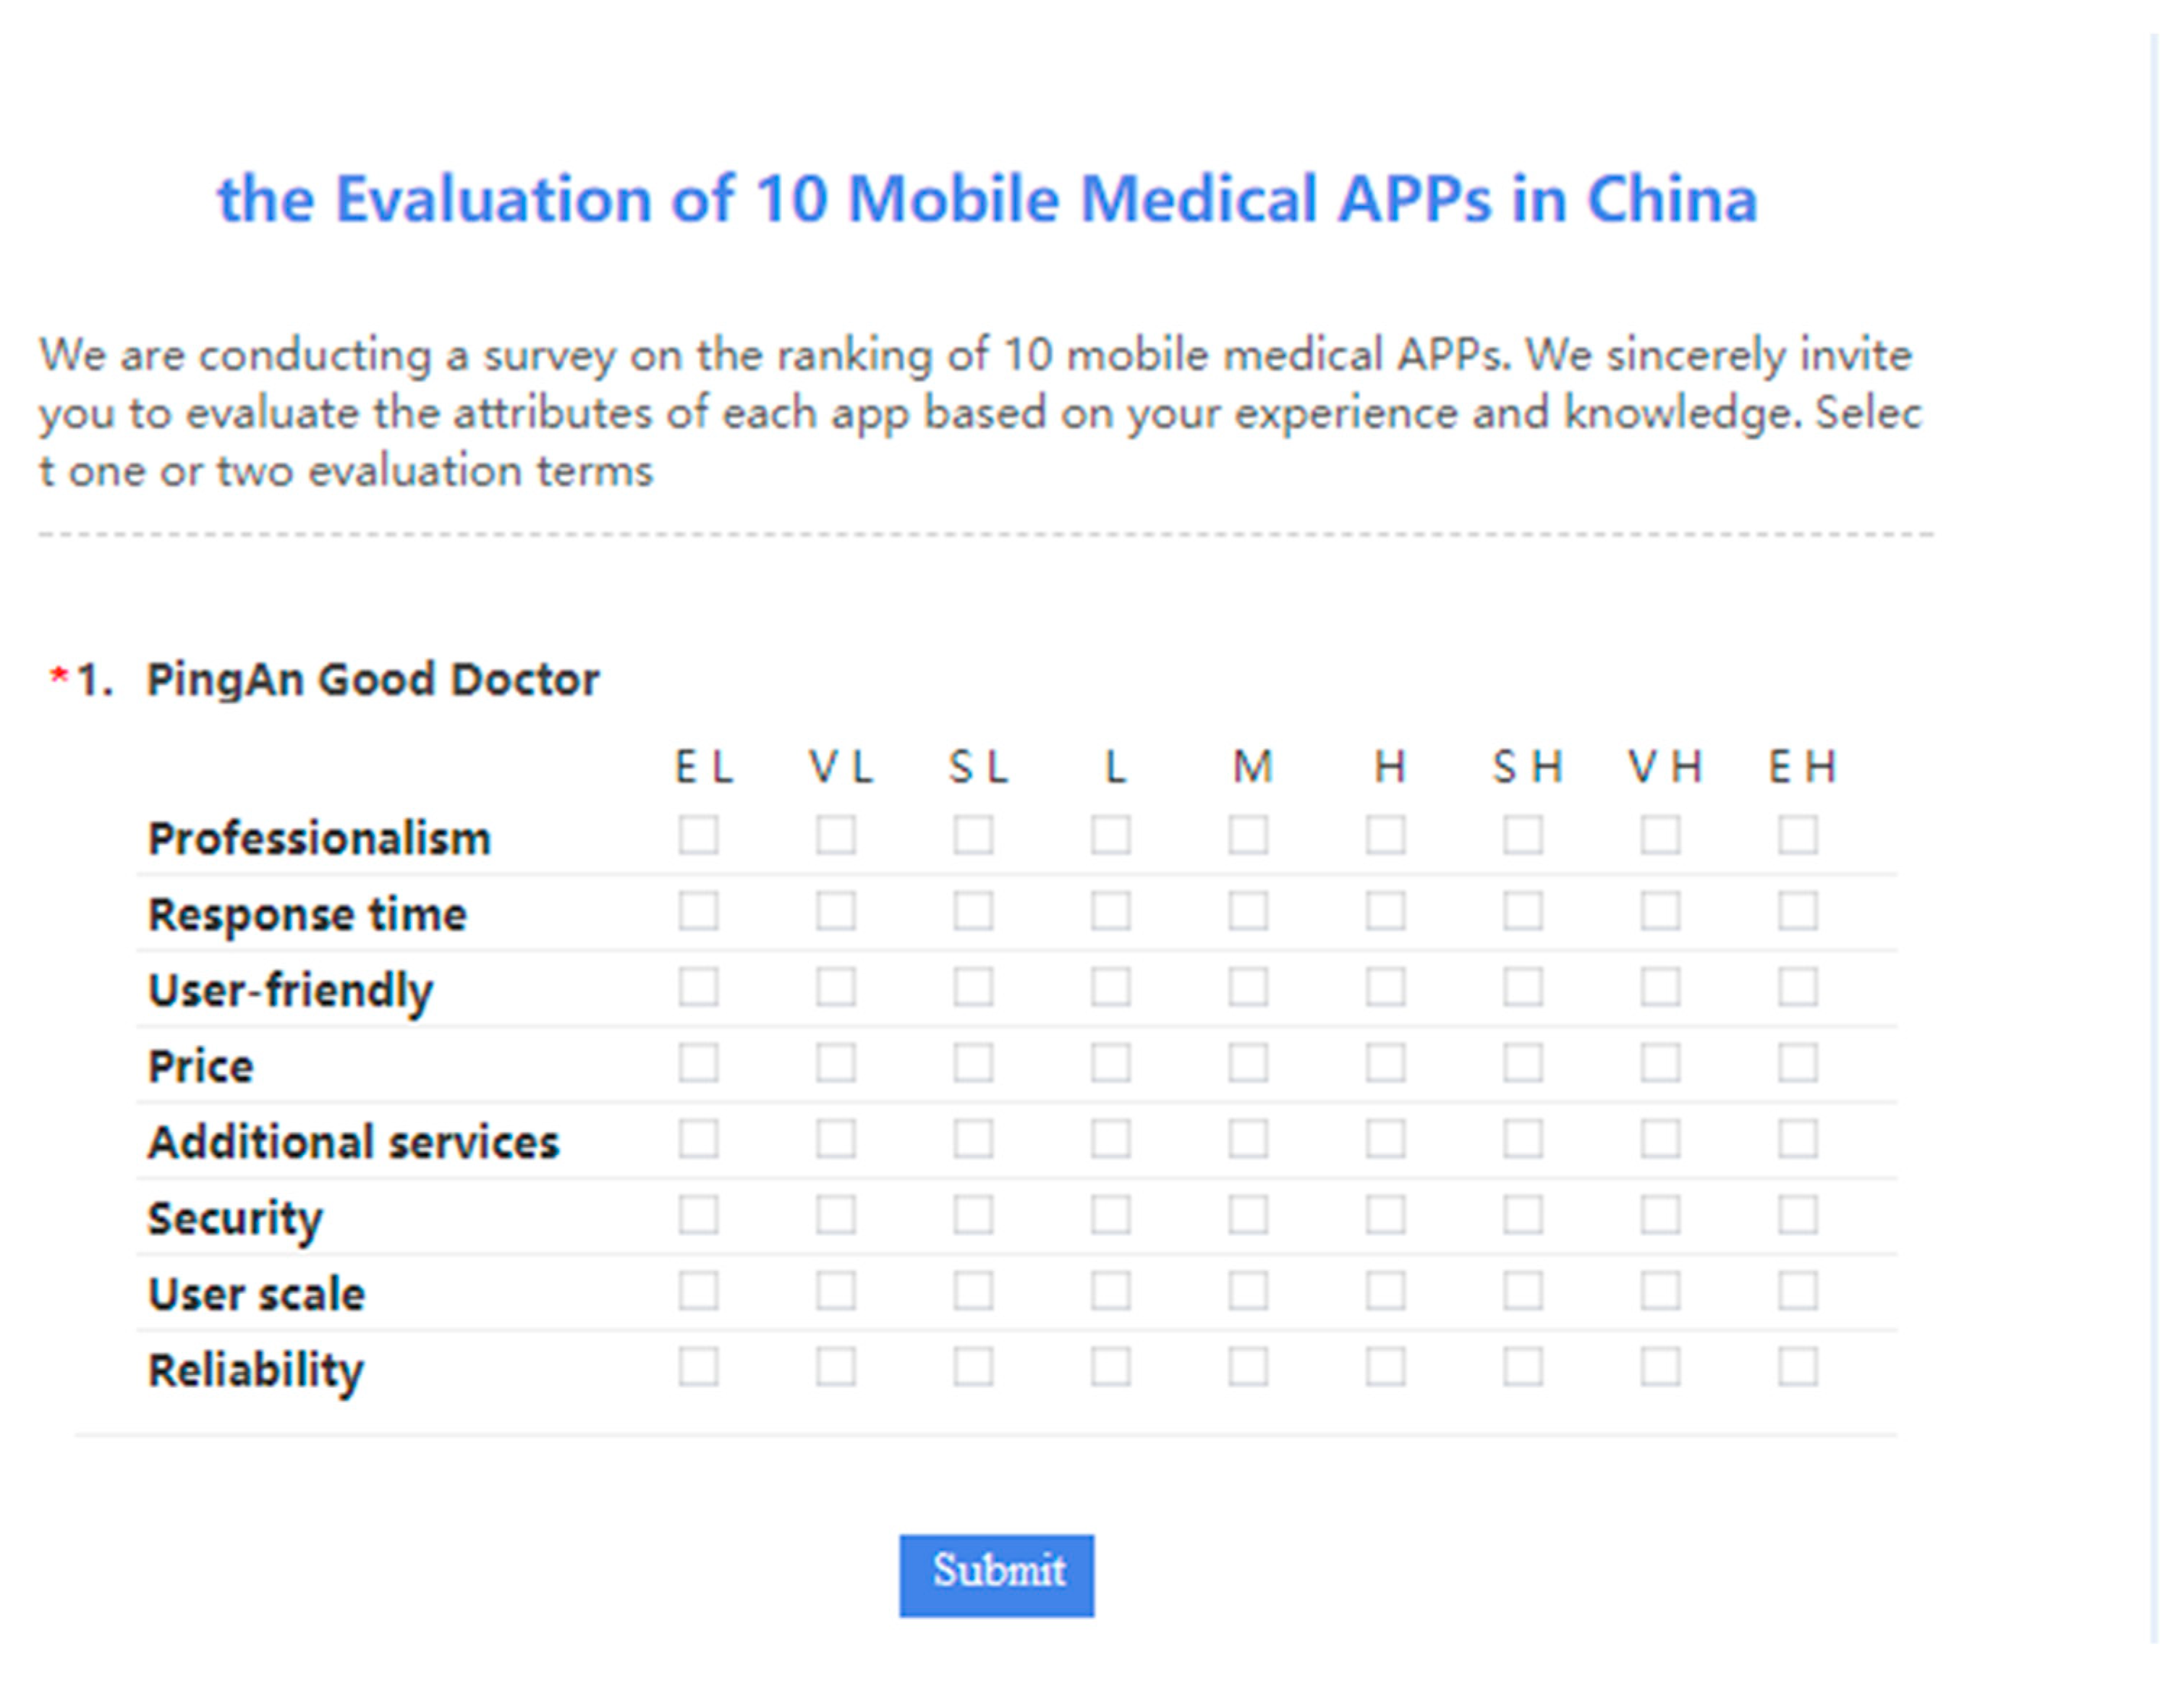
6.2. Questionnaire Design
6.3. Assessment Process
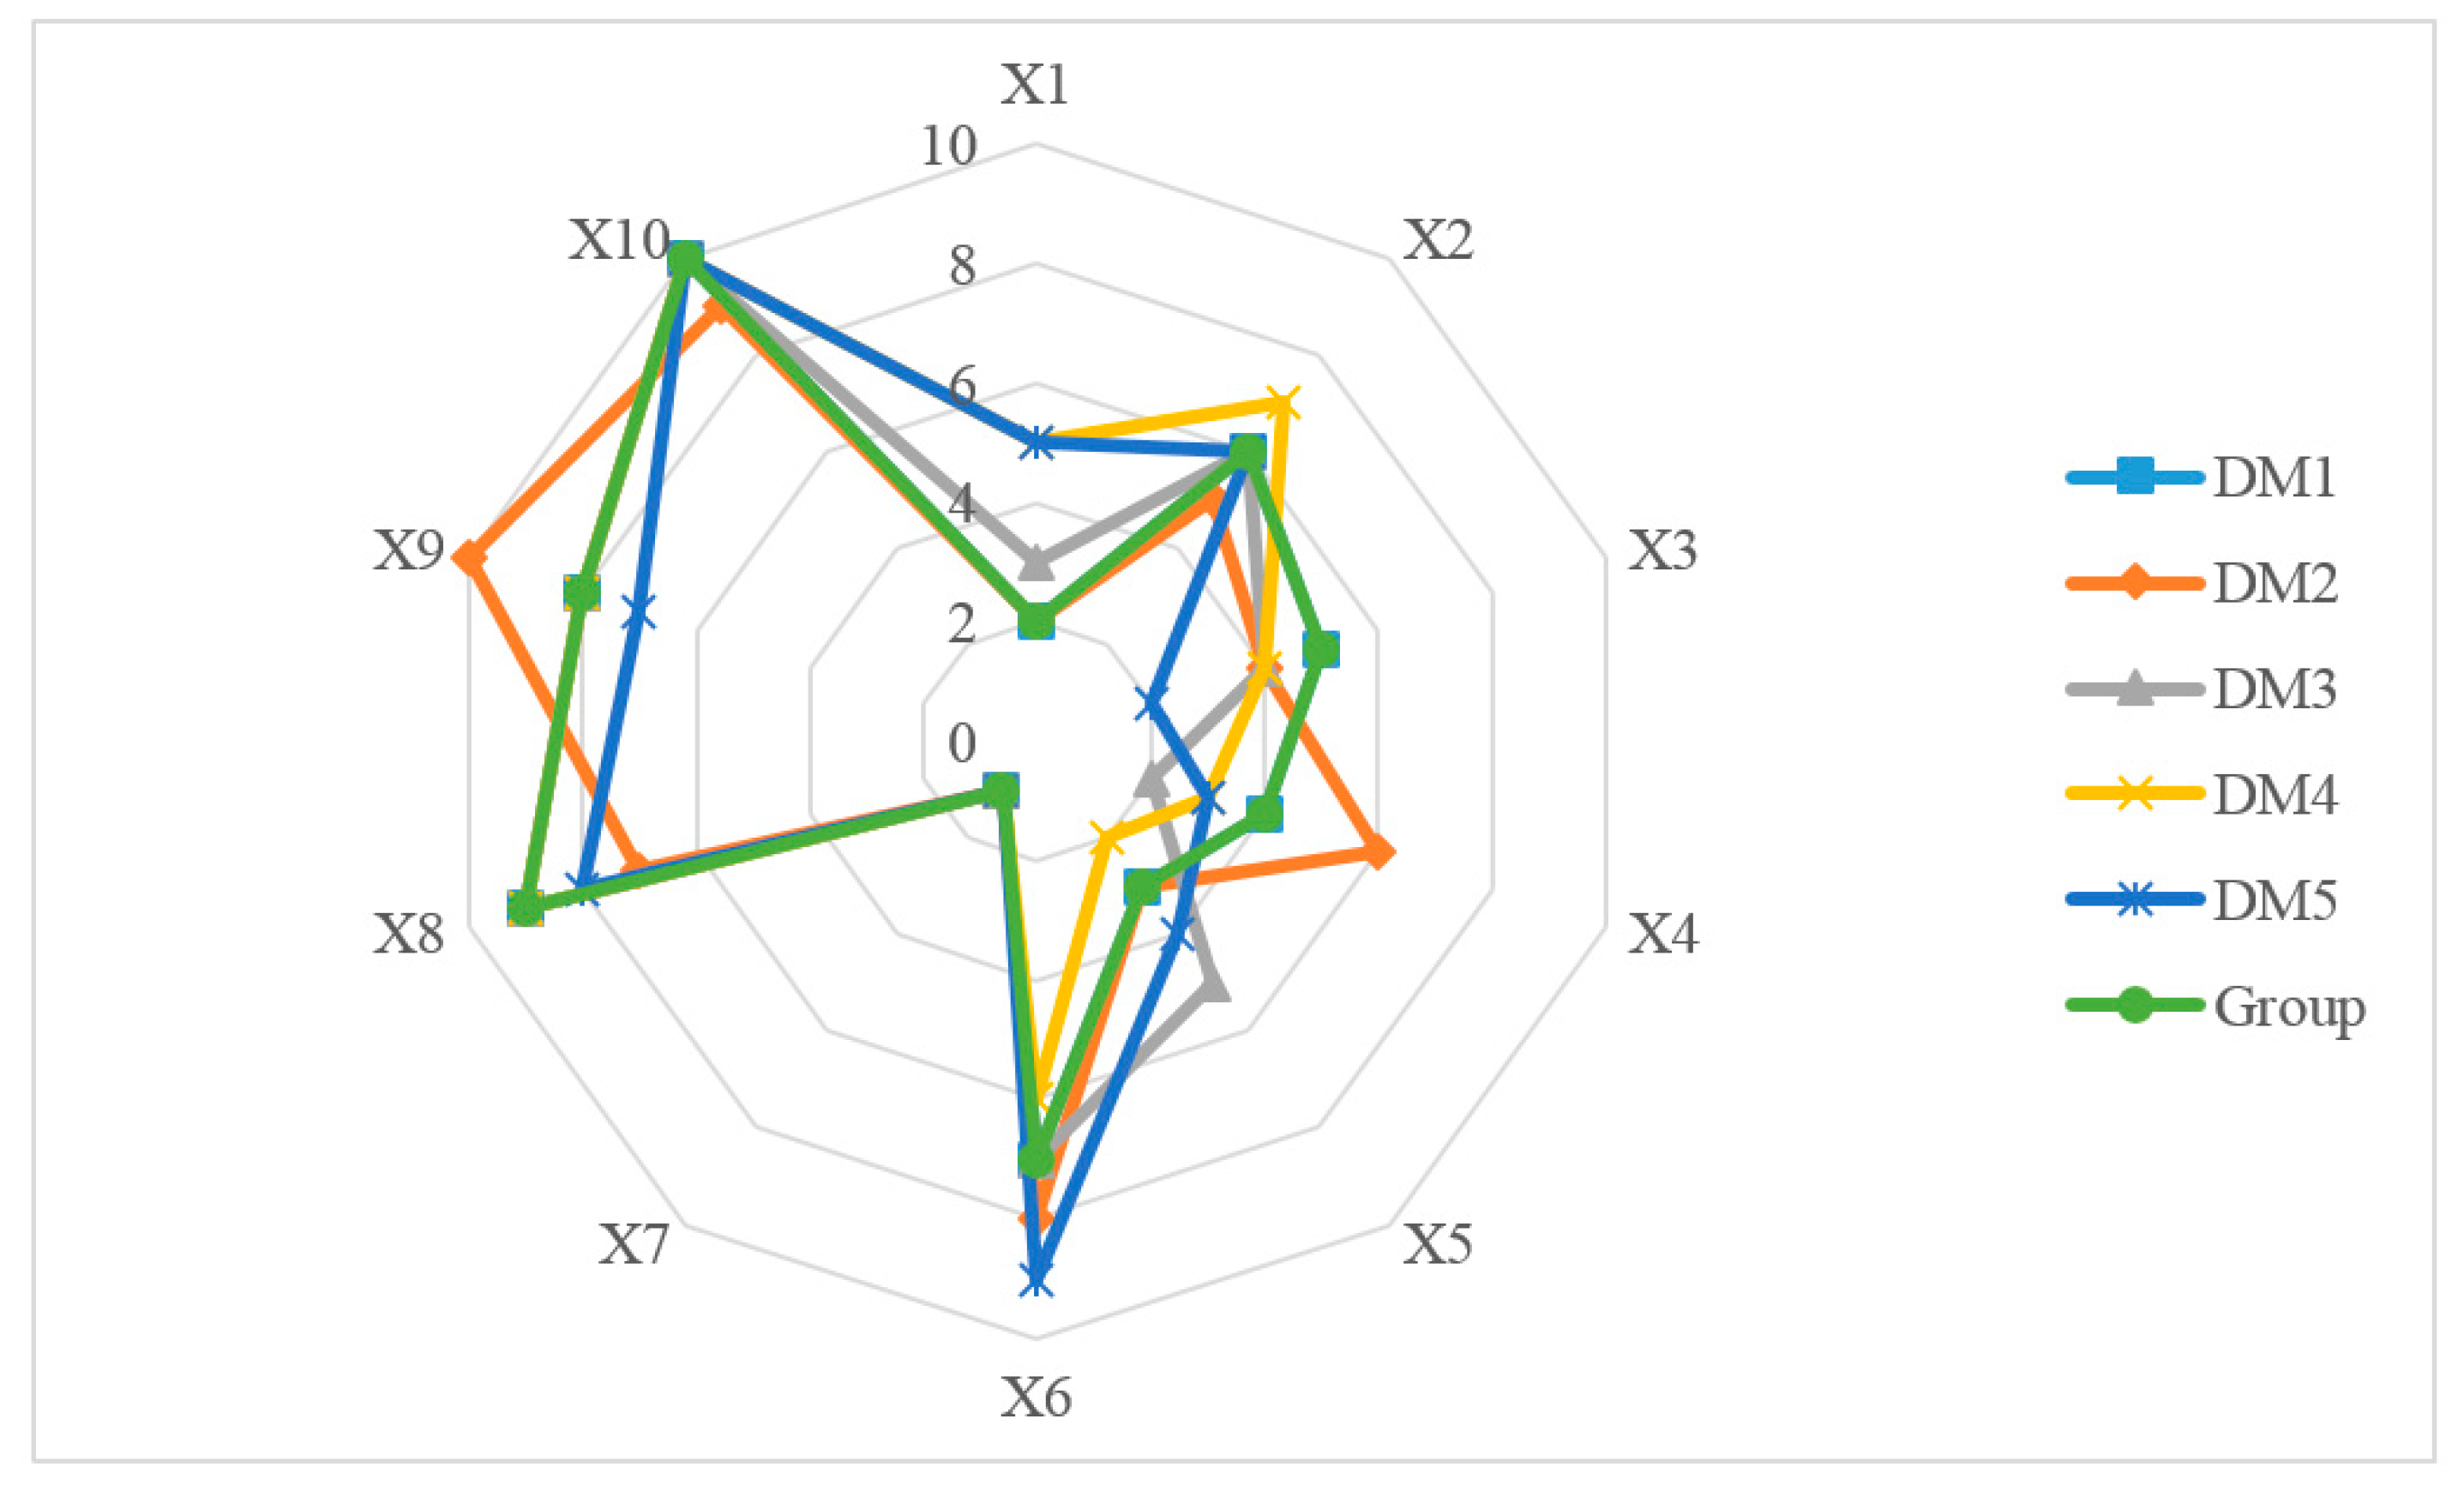
7. Comparison Analysis
7.1. UML-TOPSIS
7.1.1. Deterministic ML Evaluation Matrix
7.1.2. Individual Alternatives Ranking Based on TOPSIS
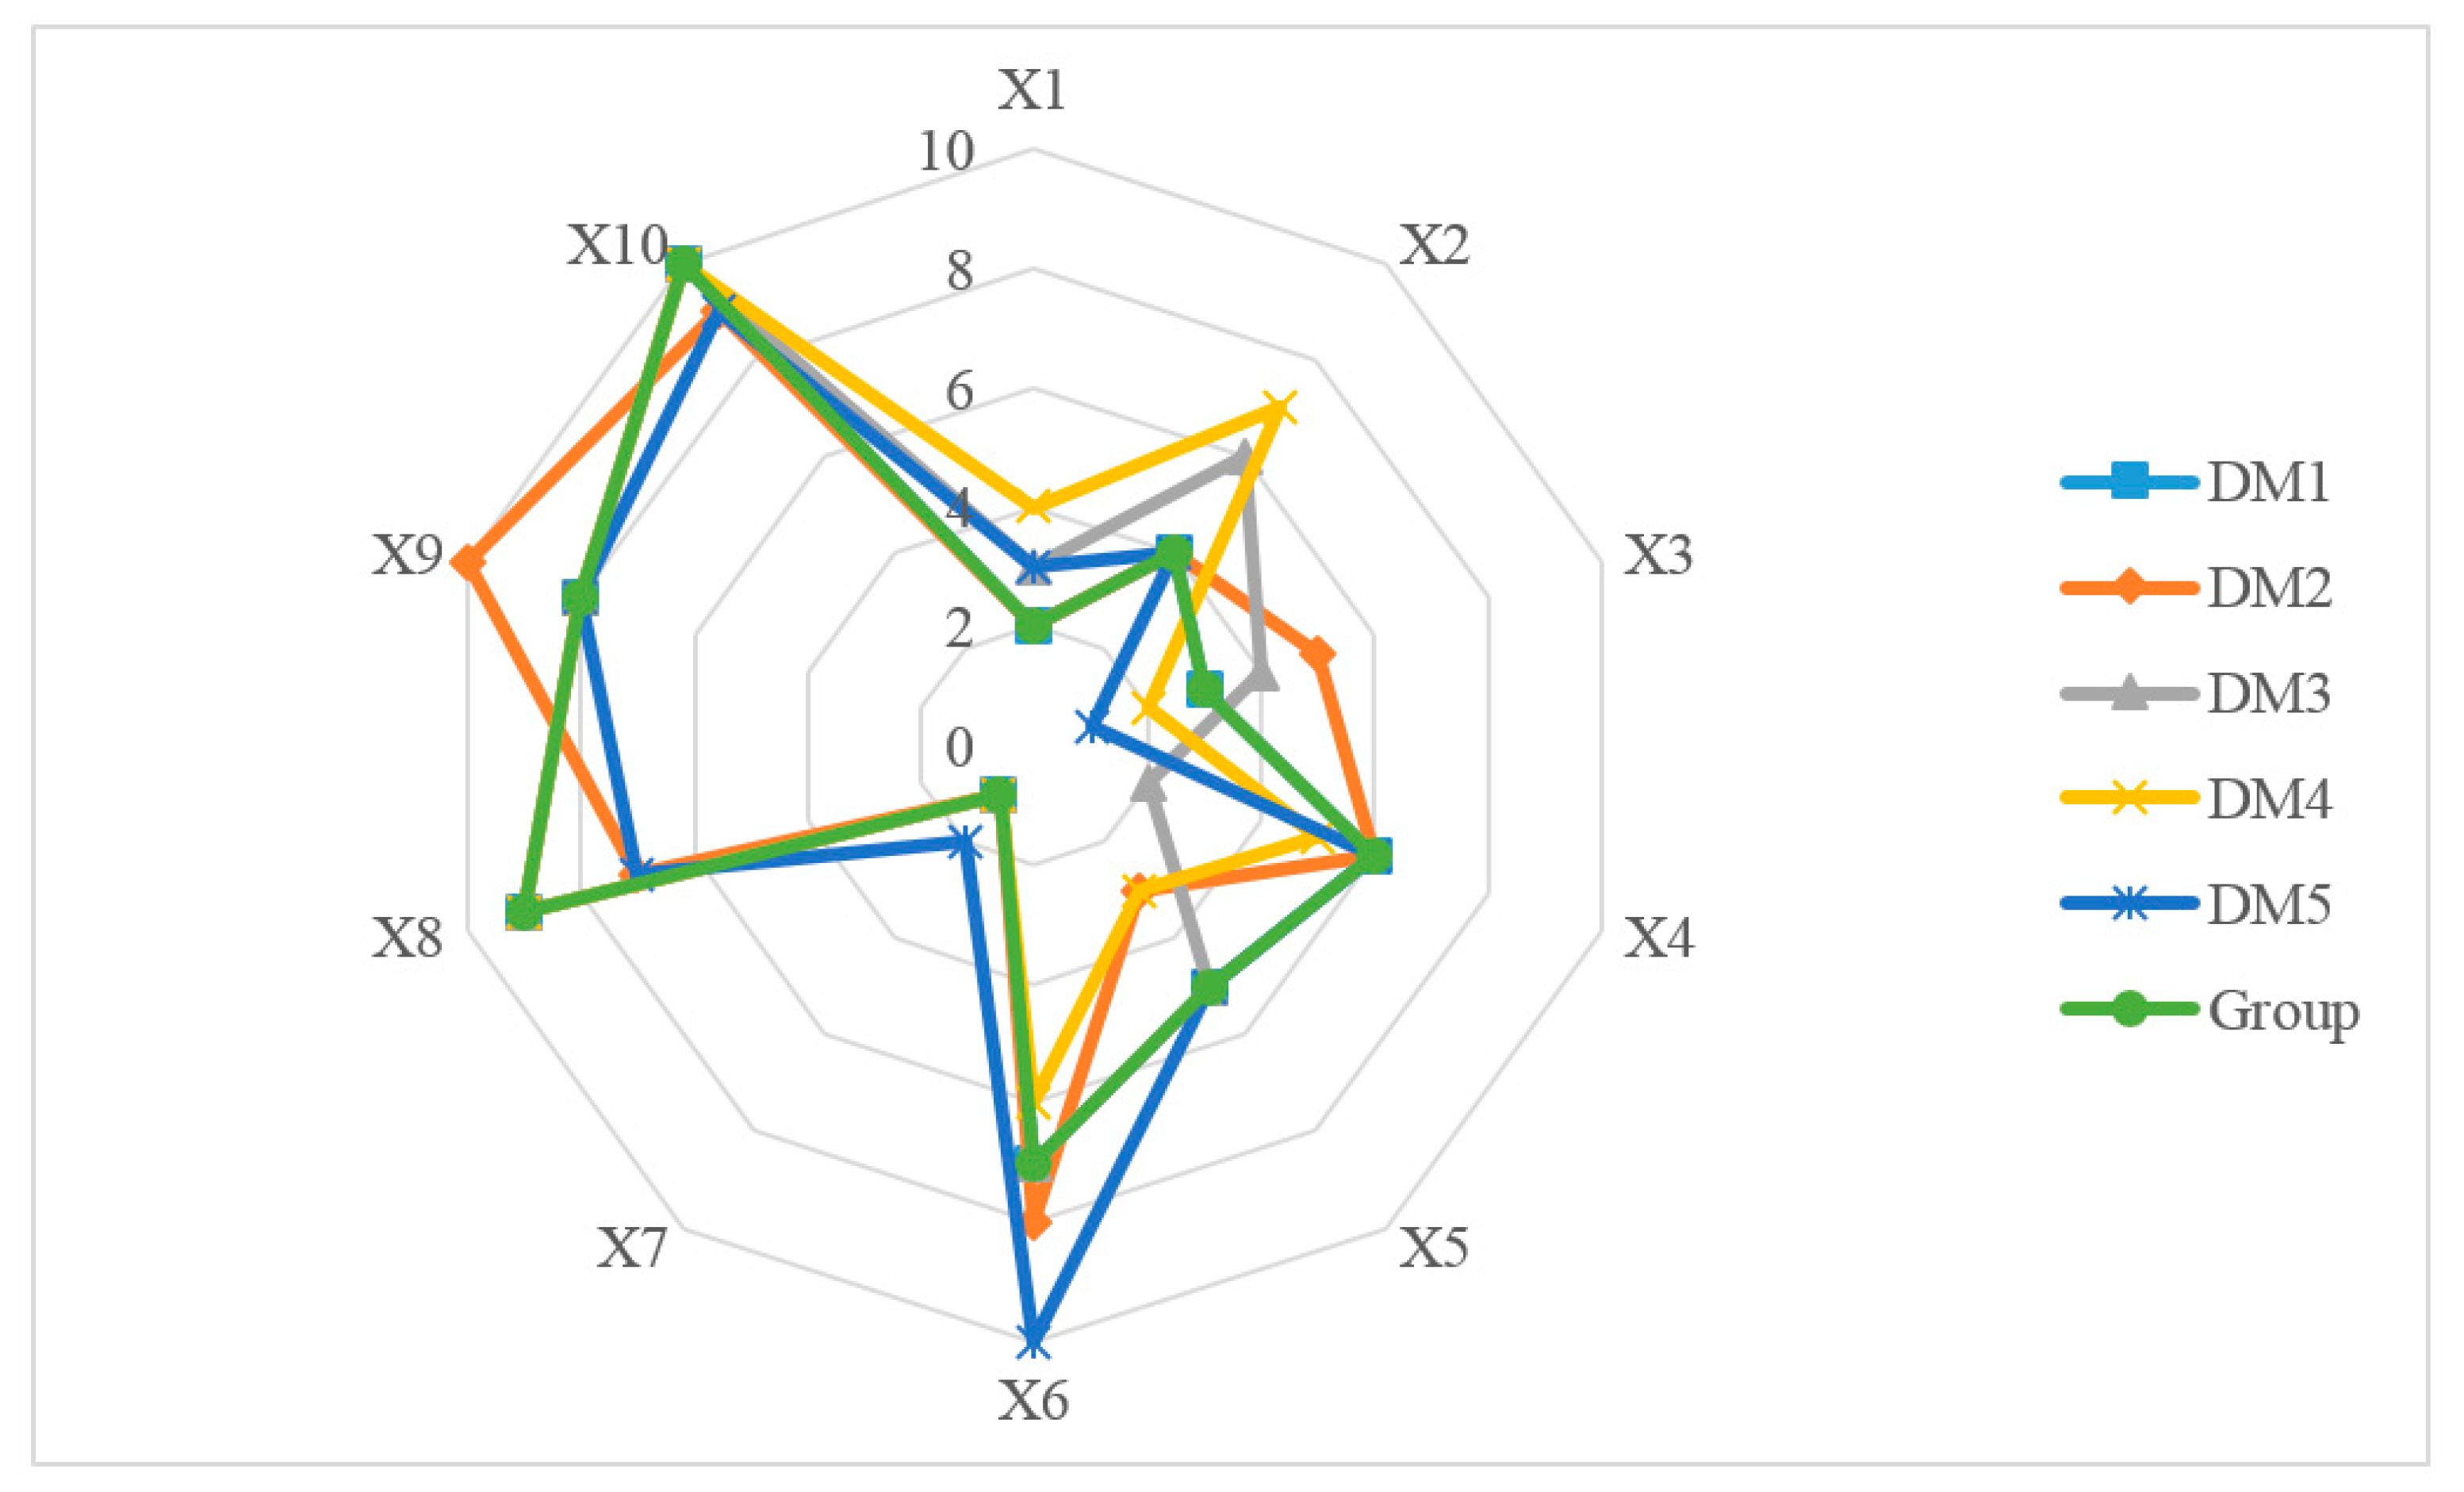
7.2. UML-TOPSIS-EW
7.2.1. Entropy Weight Method
7.2.2. The Group Ranking of Mobile Medical APPs
7.3. UMLDM-EW
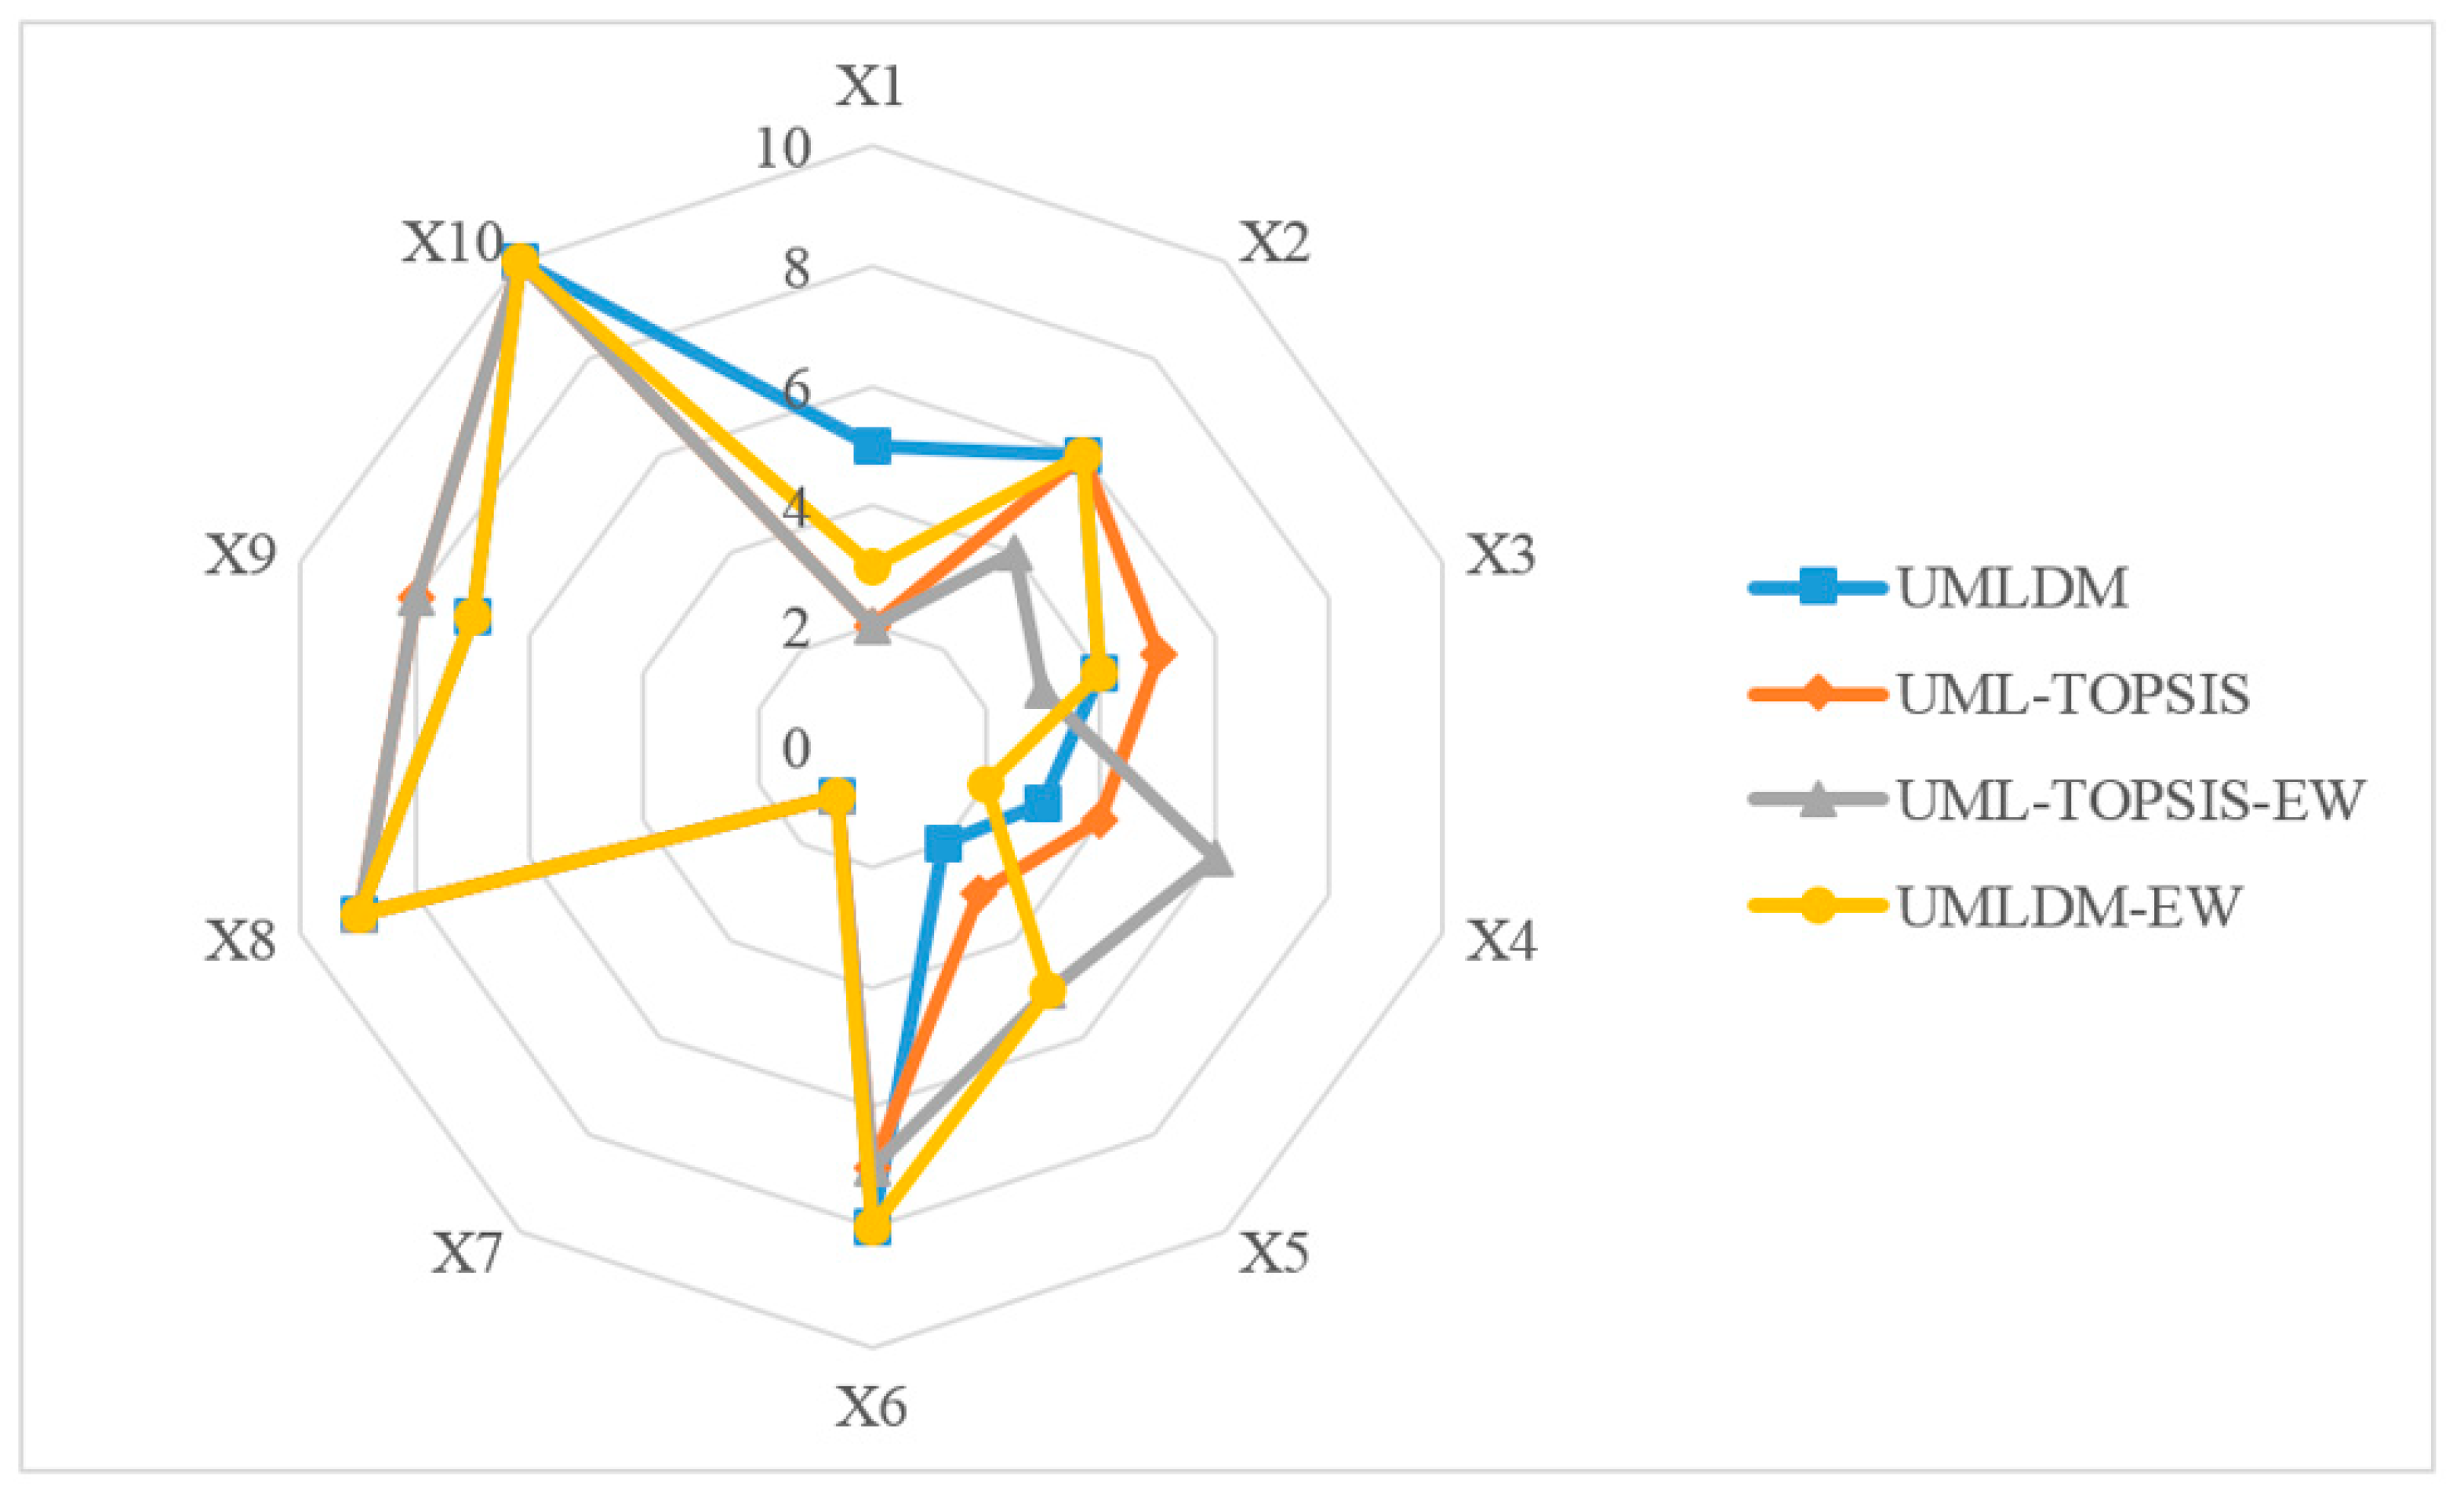
7.4. Discussion
8. Conclusions
Author Contributions
Funding
Acknowledgments
Conflicts of Interest
Appendix A

Appendix B
Appendix C
| To P | To N | CD | To P | To N | CD | To P | To N | CD | |
|---|---|---|---|---|---|---|---|---|---|
| 4.4357 | 9.9766 | −0.3652 | 3.1125 | 10.6268 | −0.4486 | 3.6712 | 10.9434 | −0.6792 | |
| 6.6128 | 7.7878 | −1.1408 | 6.5947 | 9.1814 | −1.9732 | 7.5176 | 8.6398 | −2.4828 | |
| 5.8778 | 10.8230 | −0.6857 | 6.4667 | 9.0956 | −1.9278 | 3.9912 | 11.4568 | −0.7733 | |
| 5.7000 | 11.8820 | −0.5483 | 7.0438 | 9.0031 | −2.1692 | 3.6610 | 12.0332 | −0.5885 | |
| 5.1648 | 10.7894 | −0.4949 | 5.1003 | 10.9639 | −1.2298 | 4.3635 | 9.9497 | −1.0497 | |
| 6.6077 | 7.4690 | −1.1663 | 9.6453 | 3.2298 | −3.6682 | 7.4625 | 3.9827 | −2.8288 | |
| 3.6815 | 11.2019 | −0.0572 | 2.4631 | 13.0378 | 0.0000 | 2.3731 | 12.6107 | 0.0000 | |
| 7.5319 | 7.0754 | −1.4504 | 9.6933 | 5.1560 | −3.5400 | 11.5742 | 5.4372 | −4.4461 | |
| 6.7242 | 6.6248 | −1.2689 | 12.4629 | 5.2963 | −4.6537 | 8.2155 | 7.5668 | −2.8619 | |
| 11.0916 | 4.0772 | −2.6697 | 12.1021 | 5.5135 | −4.4905 | 12.5587 | 4.6220 | −4.9256 | |
| To P | To N | CD | To P | To N | CD | |
|---|---|---|---|---|---|---|
| 4.7284 | 6.6700 | −0.6528 | 4.7134 | 8.7596 | −1.1297 | |
| 7.6454 | 9.4113 | −1.1716 | 5.0081 | 8.7419 | −1.2471 | |
| 5.3585 | 10.4424 | −0.4962 | 2.5674 | 11.2234 | −0.0807 | |
| 5.4175 | 10.9160 | −0.4713 | 4.1837 | 12.0676 | −0.6470 | |
| 4.4157 | 11.8336 | −0.1360 | 4.9517 | 10.1729 | −1.1064 | |
| 5.5720 | 5.8871 | −0.9360 | 8.6503 | 4.6838 | −3.0172 | |
| 3.8869 | 11.1806 | −0.0552 | 2.5402 | 11.5732 | −0.0410 | |
| 9.4268 | 7.5514 | −1.7871 | 7.6831 | 5.8474 | −2.5401 | |
| 7.5796 | 8.7996 | −1.2064 | 7.4993 | 6.9717 | −2.3746 | |
| 12.5693 | 3.1465 | −2.9679 | 10.6996 | 3.7832 | −3.8987 | |
Appendix D
| To P | To N | CD | To P | To N | CD | To P | To N | CD | |
|---|---|---|---|---|---|---|---|---|---|
| 5.3377 | 9.0922 | −0.3004 | 2.9595 | 11.0195 | −0.2455 | 3.7410 | 10.8451 | −0.7087 | |
| 5.9179 | 9.3192 | −0.4060 | 6.3708 | 9.3350 | −1.6877 | 7.3652 | 8.7613 | −2.4006 | |
| 6.3259 | 10.4385 | −0.3883 | 6.3822 | 9.2017 | −1.7028 | 4.0303 | 11.4134 | −0.7851 | |
| 7.0814 | 9.7372 | −0.6213 | 7.8588 | 8.5290 | −2.3226 | 3.8283 | 11.9050 | −0.6608 | |
| 6.1986 | 8.9975 | −0.4985 | 5.5065 | 10.5785 | −1.2565 | 4.4384 | 9.7826 | −1.0871 | |
| 6.7184 | 7.3807 | −0.7674 | 10.1255 | 3.0965 | −3.6284 | 7.3638 | 4.0340 | −2.7775 | |
| 4.5564 | 9.0719 | −0.1309 | 2.6111 | 12.4098 | 0.0000 | 2.3757 | 12.5230 | 0.0000 | |
| 8.7274 | 6.5543 | −1.2875 | 9.6544 | 5.3901 | −3.2632 | 11.5886 | 5.5351 | −4.4360 | |
| 7.7157 | 5.7744 | −1.1402 | 12.7315 | 4.7651 | −4.4920 | 8.4820 | 7.3532 | −2.9831 | |
| 12.5738 | 3.5817 | −2.4164 | 12.2012 | 5.7076 | −4.2130 | 12.2823 | 4.8807 | −4.7802 | |
| To P | To N | CD | To P | To N | CD | |
|---|---|---|---|---|---|---|
| 5.0660 | 6.0891 | −0.6528 | 4.0703 | 9.0638 | −0.8569 | |
| 8.0144 | 8.8434 | −1.1087 | 5.3538 | 8.3572 | −1.4357 | |
| 5.7812 | 10.2735 | −0.4251 | 2.4793 | 11.5480 | 0.0000 | |
| 7.2021 | 10.3930 | −0.7610 | 6.5954 | 10.7021 | −1.7334 | |
| 6.5623 | 10.3018 | −0.6134 | 6.1349 | 9.5130 | −1.6507 | |
| 6.2171 | 5.4136 | −0.9993 | 9.5635 | 4.0616 | −3.5056 | |
| 4.0897 | 10.3072 | −0.0083 | 2.9044 | 10.5571 | −0.2573 | |
| 9.7516 | 7.8837 | −1.6259 | 7.5388 | 7.2212 | −2.4154 | |
| 8.6474 | 7.9003 | −1.3543 | 9.3302 | 6.1174 | −3.2335 | |
| 11.6029 | 4.3587 | −2.4177 | 9.6517 | 5.3259 | −3.4317 | |
Appendix E
| 0.5771 | 0.3631 | 0.2140 | 0.6137 | 0.3161 | 0.2976 | 0.5920 | 0.3668 | 0.2252 | |
| 0.4343 | 0.4996 | −0.0653 | 0.5399 | 0.4374 | 0.1025 | 0.4863 | 0.4777 | 0.0087 | |
| 0.5790 | 0.4031 | 0.1759 | 0.5254 | 0.3990 | 0.1265 | 0.5859 | 0.3672 | 0.2187 | |
| 0.5291 | 0.4003 | 0.1288 | 0.4970 | 0.4543 | 0.0427 | 0.6127 | 0.3504 | 0.2623 | |
| 0.6010 | 0.3752 | 0.2258 | 0.6307 | 0.3450 | 0.2857 | 0.5170 | 0.4066 | 0.1103 | |
| 0.4998 | 0.4739 | 0.0259 | 0.3354 | 0.6414 | −0.3059 | 0.3755 | 0.6126 | −0.2372 | |
| 0.6171 | 0.3592 | 0.2579 | 0.6982 | 0.2380 | 0.4603 | 0.6602 | 0.2629 | 0.3972 | |
| 0.3057 | 0.6771 | −0.3714 | 0.3502 | 0.5913 | −0.2411 | 0.3019 | 0.6750 | −0.3731 | |
| 0.4101 | 0.5334 | −0.1233 | 0.2996 | 0.6462 | −0.3466 | 0.4124 | 0.5506 | −0.1382 | |
| 0.2481 | 0.7165 | −0.4683 | 0.2703 | 0.6919 | −0.4216 | 0.2201 | 0.6942 | −0.4741 | |
| 0.5313 | 0.4448 | 0.0864 | 0.5518 | 0.4040 | 0.1477 | |
| 0.4874 | 0.4632 | 0.0241 | 0.5022 | 0.4640 | 0.0382 | |
| 0.5469 | 0.3972 | 0.1498 | 0.6864 | 0.2748 | 0.4116 | |
| 0.5522 | 0.3918 | 0.1604 | 0.5304 | 0.4097 | 0.1208 | |
| 0.5656 | 0.4119 | 0.1537 | 0.5295 | 0.4397 | 0.0897 | |
| 0.4254 | 0.5198 | −0.0944 | 0.3212 | 0.6585 | −0.3373 | |
| 0.6229 | 0.3456 | 0.2773 | 0.6468 | 0.3233 | 0.3235 | |
| 0.3889 | 0.5677 | −0.1788 | 0.4039 | 0.5583 | −0.1544 | |
| 0.4397 | 0.5260 | −0.0863 | 0.3711 | 0.5865 | −0.2154 | |
| 0.2274 | 0.7197 | −0.4923 | 0.2531 | 0.6775 | −0.4244 | |
References
- Choi, B.Y.; Blumberg, C.; Williams, K. Mobile integrated health care and community paramedicine: An emerging emergency medical services concept. Ann. Emerg. Med. 2016, 67, 361–366. [Google Scholar] [CrossRef]
- Pereira, A.; Marins, F.; Rodrigues, B.; Portela, F.; Santos, M.F.; Machado, J.; Rua, F.; Silva, Á.; Abelha, A. Improving quality of medical service with mobile health software. Pro. Comput. Sci. 2015, 63, 292–299. [Google Scholar] [CrossRef] [Green Version]
- Rajesh, R.P.; Sreejith, A. Assessing awareness and use of mobile phone technology for health and wellness: Insights from India. Health Policy Technol. 2019, 8, 221–227. [Google Scholar]
- Lo, C.K.; Chen, H.C.; Lee, P.Y.; Ku, M.C.; Ogiela, L.; Chuang, C.H. Smart dynamic resource allocation model for patient-driven mobile medical information system using C4.5 algorithm. J. Electr. Sci. Technol. 2019, 17, 231–241. [Google Scholar]
- Veríssimo, J.M.C. Usage intensity of mobile medical apps: A tale of two methods. J. Bus. Res. 2018, 89, 442–447. [Google Scholar] [CrossRef]
- Katz, J.E.; Rice, R.E. Public views of mobile medical devices and services: A US national survey of consumer sentiments towards RFID healthcare technology. Int. J. Med. Inform. 2009, 78, 104–114. [Google Scholar] [CrossRef]
- Rajak, M.; Shaw, K. Evaluation and selection of mobile health (mHealth) applications using AHP and fuzzy TOPSIS. Technol. Soc. 2019, 59, 101186. [Google Scholar] [CrossRef]
- Dainton, C.; Chu, C.H. A review of electronic medical record keeping on mobile medical service trips in austere settings. Int. J. Med. Inform. 2017, 98, 33–40. [Google Scholar] [CrossRef]
- Liu, L.J.; Wang, L.Z.; Huang, Q.S.; Zhou, L.; Fu, X.; Liu, L. An efficient architecture for medical high-resolution images transmission in mobile telemedicine systems. Comput. Methods Programs Biomed. 2020, 187, 105088. [Google Scholar] [CrossRef]
- Shakhovska, N.; Fedushko, S.; Gregušml, M.; Shvorob, I.; Syerov, Y. Development of mobile system for medical recommendations. Pro. Comput. Sci. 2019, 155, 43–50. [Google Scholar] [CrossRef]
- Piran, P.; Thomas, J.; Kunnakkat, S.; Pandey, A.; Gilles, N.; Weingast, S.; Burton, D.; Balucani, C.; Levine, S.R.; Mobile Applications for Stroke (MAPPS) Investigators. Medical mobile applications for stroke survivors and caregivers. J. Stroke Cerebrovasc. Dis. 2019, 28, 104318. [Google Scholar] [CrossRef] [PubMed]
- Onodera, R.; Sengoku, S. Innovation process of mHealth: An overview of FDA-approved mobile medical applications. Int. J. Med. Inform. 2018, 118, 65–71. [Google Scholar] [CrossRef] [PubMed]
- Ana, F.A.; Loreto, M.S.; José, L.M.; Pablo, S.M.; Pilar, M.J.M.; Myriam, S.A. Mobile applications in oncology: A systematic review of health science databases. Int. J. Med. Inform. 2020, 133, 104001. [Google Scholar] [CrossRef]
- Bergeron, D.; Iorio-Morin, C.; Bigder, M.; Dakson, A.; Eagles, M.E.; Elliott, C.A.; Honey, C.M.; Kameda-Smith, M.M.; Persad, A.R.L.; Touchette, C.J.; et al. Canadian Neurosurgery Research Collaborative. Mobile Applications in Neurosurgery: A Systematic Review, Quality Audit, and Survey of Canadian Neurosurgery Residents. World Neurosurg. 2019, 127, 1026–1038. [Google Scholar] [CrossRef] [PubMed]
- Drincic, A.; Prahalad, P.; Greenwood, D.; David, C.; Klonoff, M.D. Evidence-based Mobile Medical Applications in Diabetes. Endocrinol. Metabol. Clin. North Am. 2016, 45, 943–965. [Google Scholar] [CrossRef] [PubMed] [Green Version]
- Hu, N.Z.; Lee, C.Y.; Hou, M.C.; Chen, Y.L. The Cloud system for mobile medical services of traditional Chinese medicine (TCM). J. Med. Syst. 2013, 37, 9978. [Google Scholar] [CrossRef] [PubMed]
- Vishnu, V.; Vinny, P.W.; Rajan, R.; Goyal, V.; Srivastava, P.; Lal, V.; Sylaja, P.; Narasimhan, L.; Dwivedi, S.N.; Nair, P.P.; et al. Neurology residents versus a mobile medical application in deducing differential diagnoses in movement disorders: A multi-center, cross-sectional, observational study. J. Neurol. Sci. 2019, 405, 90. [Google Scholar] [CrossRef] [Green Version]
- Oluwagbemi, O.; Oluwagbemi, F.; Ughamadu, C. Android Mobile Informatics Application for some Hereditary Diseases and Disorders (AMAHD): A complementary framework for medical practitioners and patients. Inf. Med. Unlocked 2016, 2, 38–69. [Google Scholar] [CrossRef] [Green Version]
- Gabor, A.; Popescu, M.; Popa-Iovanut, F.; Naaji, A. Mobile Application for Medical Diagnosis. In Telemedicine Technologies; Chapter 1; Mara Conner: London, UK; Oxford, UK; San Diego, CA, USA; Cambridge, CA, USA, 2019; pp. 1–13. [Google Scholar]
- Stec, M.; Arbour, M.W. Wellness and disease self-management mobile health apps evaluated by the Mobile Application Rating Scale. Adv. Family Pract. Nur. 2020, in press. [Google Scholar] [CrossRef]
- Başaran, S.; Haruna, Y. Integrating FAHP and TOPSIS to evaluate mobile learning applications for mathematics. Pro. Comput. Sci. 2017, 120, 91–98. [Google Scholar] [CrossRef]
- Chen, T. Assessing factors critical to smart technology applications to mobile health care—The FGM-FAHP approach. Health Policy Technol. 2020, in press. [Google Scholar] [CrossRef]
- Hao, Y.G.; Lee, K.S.; Chen, S.T.; Sim, S.C. An evaluative study of a mobile application for middle school students struggling with English vocabulary learning. Comput. Hum. Behav. 2019, 95, 208–216. [Google Scholar] [CrossRef]
- Krishankumar, R.; Ravichandran, K.S.; Saeid, A.B. A new extension to PROMETHEE under intuitionistic fuzzy environment for solving supplier selection problem with linguistic preferences. Appl. Soft. Comput. 2017, 60, 564–576. [Google Scholar]
- Sureeyatanapas, P.; Sriwattananusart, K.; Niyamosothath, T.; Sessomboon, W.; Arunyanart, S. Supplier selection towards uncertain and unavailable information: An extension of TOPSIS method. Oper. Res. Perspect. 2018, 5, 69–79. [Google Scholar] [CrossRef]
- Zi, C.H.; Chan, F.T.S.; Wen, J. A quantum framework for modelling subjectivity in multi-attribute group decision making. Comput. Ind. Eng. 2018, 124, 560–572. [Google Scholar]
- Sun, B.Z.; Ma, W.M.; Chen, X.T. Variable precision multi-granulation rough fuzzy set approach to multiple attribute group decision-making based on-similarity relation. Comput. Ind. Eng. 2019, 127, 326–343. [Google Scholar] [CrossRef]
- Liao, H.C.; Zhang, C.; Luo, L. A multiple attribute group decision making method based on two novel intuitionistic multiplicative distance measures. Inf. Sci. 2018, 467, 766–783. [Google Scholar] [CrossRef]
- Gu, D.; Deng, S.; Zheng, Q.; Liang, C.; Wu, J. Impacts of case-based health knowledge system in hospital management: The mediating role of group effectiveness. Inf. Manag. 2019, 56, 103162. [Google Scholar] [CrossRef]
- Gu, D.; Liang, C.; Zhao, H. A case-based reasoning system based on weighted heterogeneous value distance metric for breast cancer diagnosis. Aratif. Intell. Med. 2017, 77, 31–47. [Google Scholar] [CrossRef]
- Polat, G.; Bingol, B.N.; Var, O. An integrated multi-criteria-decision-making tool for mechanical designer selection. Pro. Eng. 2017, 196, 278–285. [Google Scholar] [CrossRef]
- Sarkar, S.; Pratihar, D.K.; Sarkar, B. An integrated fuzzy multiple criteria supplier selection approach and its application in a welding company. J. Manuf. Syst. 2018, 46, 163–178. [Google Scholar] [CrossRef]
- Yu, C.X.; Shao, Y.F.; Wang, K.; Zhang, L.P. A group decision making sustainable supplier selection approach using extended TOPSIS under interval-valued Pythagorean fuzzy environment. Expert Syst. Appl. 2019, 121, 1–17. [Google Scholar] [CrossRef]
- Govindan, K.; Kadziński, M.; Sivakumar, R. Application of a novel PROMETHEE-based method for construction of a group compromise ranking to prioritization of green suppliers in food supply chain. Omega 2017, 71, 129–145. [Google Scholar] [CrossRef]
- Fu, C.; Zhou, K.L.; Xue, M. Fair framework for multiple criteria decision making. Comput. Ind. Eng. 2018, 124, 379–392. [Google Scholar] [CrossRef]
- Liu, H.C.; Quan, M.Y.; Li, Z.W.; Wang, Z.L. A new integrated MCDM model for sustainable supplier selection under interval-valued intuitionistic uncertain linguistic environment. Inf. Sci. 2019, 486, 254–270. [Google Scholar] [CrossRef]
- Farhadinia, B.; Herrera-Viedma, E. Multiple criteria group decision making method based on extended hesitant fuzzy sets with unknown weight information. Appl. Soft. Comput. 2019, 78, 310–323. [Google Scholar] [CrossRef]
- Wan, S.P.; Li, S.Q.; Dong, J.Y. A three-phase method for Pythagorean fuzzy multi-attribute group decision making and application to haze management. Comput. Ind. Eng. 2018, 123, 348–363. [Google Scholar] [CrossRef]
- Xu, Z.S. Linguistic aggregation operators: An overview. In Fuzzy Sets and Their Extensions: Representation, Aggregation and Models; Bustince, H., Herrera, F., Montero, J., Eds.; Springer: Berlin, Germany, 2007; pp. 163–181. [Google Scholar]
- Cengiz, A.E.; Ayteki, O.; Ozdemir, I.; Kusan, H.; Cabuk, A. A multi-criteria decision model for construction material supplier selection. Pro. Eng. 2017, 196, 294–301. [Google Scholar] [CrossRef]
- Bhandari, U.; Neben, T.; Chang, K.; Chua, W.Y. Effects of interface design factors on affective responses and quality evaluations in mobile applications. Comput. Hum. Behav. 2017, 72, 525–534. [Google Scholar] [CrossRef]
- Sun, B.Z.; Ma, W.M.; Chen, X.T.; Li, X.N. Heterogeneous multi-granulation fuzzy rough set-based multiple attribute group decision making with heterogeneous preference information. Comput. Ind. Eng. 2018, 122, 24–38. [Google Scholar] [CrossRef]
- Aggarwal, M. Hesitant information sets and application in group decision making. Appl. Soft. Comput. 2019, 75, 120–129. [Google Scholar] [CrossRef]
- Gu, D.; Liang, C.; Kim, K.S.; Yang, C.; Cheng, W.; Wang, J. Which is more reliable, expert experience or information itself? weight scheme of complex cases for health management decision making. Int. J. Inf. Technol. Decis. Mak. 2015, 14, 597–620. [Google Scholar] [CrossRef]


| NO. | Name | Affiliated Company |
|---|---|---|
| 1 | PingAn Good Doctor | Ping An Healthcare And Technology Company Limited |
| 2 | Alibab Health | Alibaba Group |
| 3 | DingXiang Doctor | Yinchuan Dingxiang Internet hospital Co., Ltd. |
| 4 | Good Doctor Online | Beijing Interactive Peak Technology Co., Ltd. |
| 5 | We Doctor | Guahao (Hangzhou) Technology Co., Ltd. |
| 6 | ChunYu Doctor | Beijing Spring Rain Software CO., Ltd. |
| 7 | Health 160 | Shenzhen Ningyuan Technology Co., Ltd. |
| 8 | Micro-relationship | Hangzhou Choice Technology CO., Ltd. |
| 9 | Medical Consultation Rapidly | Hainan health cloud Internet hospital Co., Ltd. |
| 10 | Access to Medical | Daoyitong.com, Inc. |
| 0 | 2 | 4 | |
| 2 | 0 | 4 | |
| 4 | 2 | 0 |
| Input: individual evaluate matrix, and Table 2. |
| 1. Using reciprocal operator to normalize and gaining matrix , where ; 2. let and . They are used to record the total and j-th attribute corresponding to distance between alternatives under k-th decision maker respectively; 3. for k, from 1 to h for j, from 1 to m for i, from 1 to n for v, from 1 to n and ; end for v end for i end for j end for k 4. According to Equation (7), is calculated by ; 5. for k, from 1 to h According to Equation (9), we get of any alternative and give ranking ; end for k 6. for v, from 2 to n for i, from 1 to v-1 for k, from 1 to h taking Table 1 and to Equation (10) and calculating end for k end for i end for v |
| Output: group compromise ranking T |
| 0.1826 | 0.1342 | 0.1076 | 0.1336 | 0.1551 | |
| 0.0853 | 0.1361 | 0.1205 | 0.1056 | 0.1060 | |
| 0.1525 | 0.1410 | 0.1135 | 0.0895 | 0.1354 | |
| 0.1279 | 0.1314 | 0.1115 | 0.0929 | 0.0949 | |
| 0.1170 | 0.1130 | 0.1493 | 0.1668 | 0.1050 | |
| 0.0905 | 0.1186 | 0.1346 | 0.1178 | 0.1488 | |
| 0.1415 | 0.1056 | 0.1410 | 0.1773 | 0.1169 | |
| 0.1026 | 0.1202 | 0.1220 | 0.1164 | 0.1379 |
| 0.5936 | 0.3674 | 0.2261 | 0.5930 | 0.3314 | 0.2616 | 0.5963 | 0.3641 | 0.2322 | |
| 0.3823 | 0.5586 | −0.1763 | 0.5245 | 0.4531 | 0.0714 | 0.4806 | 0.4847 | −0.0042 | |
| 0.5540 | 0.4136 | 0.1404 | 0.5121 | 0.4139 | 0.0982 | 0.5875 | 0.3643 | 0.2232 | |
| 0.6003 | 0.3455 | 0.2548 | 0.5240 | 0.4288 | 0.0952 | 0.6172 | 0.3455 | 0.2718 | |
| 0.6403 | 0.3404 | 0.2999 | 0.6403 | 0.3337 | 0.3066 | 0.5224 | 0.4012 | 0.1212 | |
| 0.4593 | 0.5138 | −0.0545 | 0.3388 | 0.6351 | −0.2964 | 0.3717 | 0.6161 | −0.2444 | |
| 0.6480 | 0.3327 | 0.3153 | 0.7132 | 0.2262 | 0.4870 | 0.6602 | 0.2617 | 0.3985 | |
| 0.3054 | 0.6673 | −0.3619 | 0.3332 | 0.6032 | −0.2700 | 0.2983 | 0.6798 | −0.3815 | |
| 0.4037 | 0.5505 | −0.1468 | 0.3138 | 0.6358 | −0.3221 | 0.4244 | 0.5392 | −0.1148 | |
| 0.2304 | 0.7275 | −0.4971 | 0.2658 | 0.6974 | −0.4316 | 0.2057 | 0.7078 | −0.5021 | |
| 0.5155 | 0.4589 | 0.0566 | 0.5034 | 0.4453 | 0.0581 | |
| 0.4983 | 0.4613 | 0.0370 | 0.5049 | 0.4623 | 0.0426 | |
| 0.5449 | 0.4145 | 0.1304 | 0.6609 | 0.3055 | 0.3555 | |
| 0.5955 | 0.3639 | 0.2316 | 0.6100 | 0.3239 | 0.2861 | |
| 0.6205 | 0.3561 | 0.2645 | 0.5643 | 0.4156 | 0.1488 | |
| 0.4167 | 0.5133 | −0.0967 | 0.3384 | 0.6393 | −0.3008 | |
| 0.6286 | 0.3488 | 0.2798 | 0.6826 | 0.2941 | 0.3886 | |
| 0.3832 | 0.5852 | −0.2020 | 0.3490 | 0.6142 | −0.2652 | |
| 0.4579 | 0.5098 | −0.0519 | 0.4213 | 0.5399 | −0.1185 | |
| 0.1482 | 0.7975 | −0.6493 | 0.1630 | 0.7581 | −0.5951 | |
| Position | |||||
|---|---|---|---|---|---|
| 1 | |||||
| 2 | |||||
| 3 | |||||
| 4 | |||||
| 5 | |||||
| 6 | |||||
| 7 | |||||
| 8 | |||||
| 9 | |||||
| 10 |
| - | 1 | 0 | 0 | 0 | 1 | 0 | 1 | 1 | 1 | |
| 0 | - | 0 | 0 | 0 | 1 | 0 | 1 | 1 | 1 | |
| 1 | 1 | - | 0 | 0 | 1 | 0 | 1 | 1 | 1 | |
| 1 | 1 | 1 | - | 0 | 1 | 0 | 1 | 1 | 1 | |
| 1 | 1 | 1 | 1 | - | 1 | 0 | 1 | 1 | 1 | |
| 0 | 0 | 0 | 0 | 0 | - | 0 | 1 | 0 | 1 | |
| 1 | 1 | 1 | 1 | 1 | 1 | - | 1 | 1 | 1 | |
| 0 | 0 | 0 | 0 | 0 | 0 | 0 | - | 0 | 1 | |
| 0 | 0 | 0 | 0 | 0 | 1 | 0 | 1 | - | 1 | |
| 0 | 0 | 0 | 0 | 0 | 0 | 0 | 0 | 0 | - |
| 0.0701 | 0.1181 | 0.1073 | 0.1281 | 0.1254 | |
| 0.1606 | 0.1259 | 0.1144 | 0.1076 | 0.1026 | |
| 0.1236 | 0.1144 | 0.1169 | 0.1187 | 0.0804 | |
| 0.1595 | 0.1546 | 0.1237 | 0.1876 | 0.2057 | |
| 0.1401 | 0.1429 | 0.1453 | 0.1203 | 0.1362 | |
| 0.1012 | 0.1292 | 0.1429 | 0.1452 | 0.1572 | |
| 0.1086 | 0.0974 | 0.1304 | 0.1128 | 0.0999 | |
| 0.1364 | 0.1175 | 0.1191 | 0.0797 | 0.0926 |
© 2020 by the authors. Licensee MDPI, Basel, Switzerland. This article is an open access article distributed under the terms and conditions of the Creative Commons Attribution (CC BY) license (http://creativecommons.org/licenses/by/4.0/).
Share and Cite
Li, J.; Zhang, J.; Ding, Y. Uncertain Multiplicative Language Decision Method Based on Group Compromise Framework for Evaluation of Mobile Medical APPs in China. Int. J. Environ. Res. Public Health 2020, 17, 2858. https://0-doi-org.brum.beds.ac.uk/10.3390/ijerph17082858
Li J, Zhang J, Ding Y. Uncertain Multiplicative Language Decision Method Based on Group Compromise Framework for Evaluation of Mobile Medical APPs in China. International Journal of Environmental Research and Public Health. 2020; 17(8):2858. https://0-doi-org.brum.beds.ac.uk/10.3390/ijerph17082858
Chicago/Turabian StyleLi, Junchang, Jiantong Zhang, and Ye Ding. 2020. "Uncertain Multiplicative Language Decision Method Based on Group Compromise Framework for Evaluation of Mobile Medical APPs in China" International Journal of Environmental Research and Public Health 17, no. 8: 2858. https://0-doi-org.brum.beds.ac.uk/10.3390/ijerph17082858