What Keeps Them Physically Active? Predicting Physical Activity, Motor Competence, Health-Related Fitness, and Perceived Competence in Irish Adolescents after the Transition from Primary to Second-Level School


Abstract
:1. Introduction
2. Materials and Methods
2.1. Participants
2.2. Measures
2.3. Data Processing
2.4. Analysis
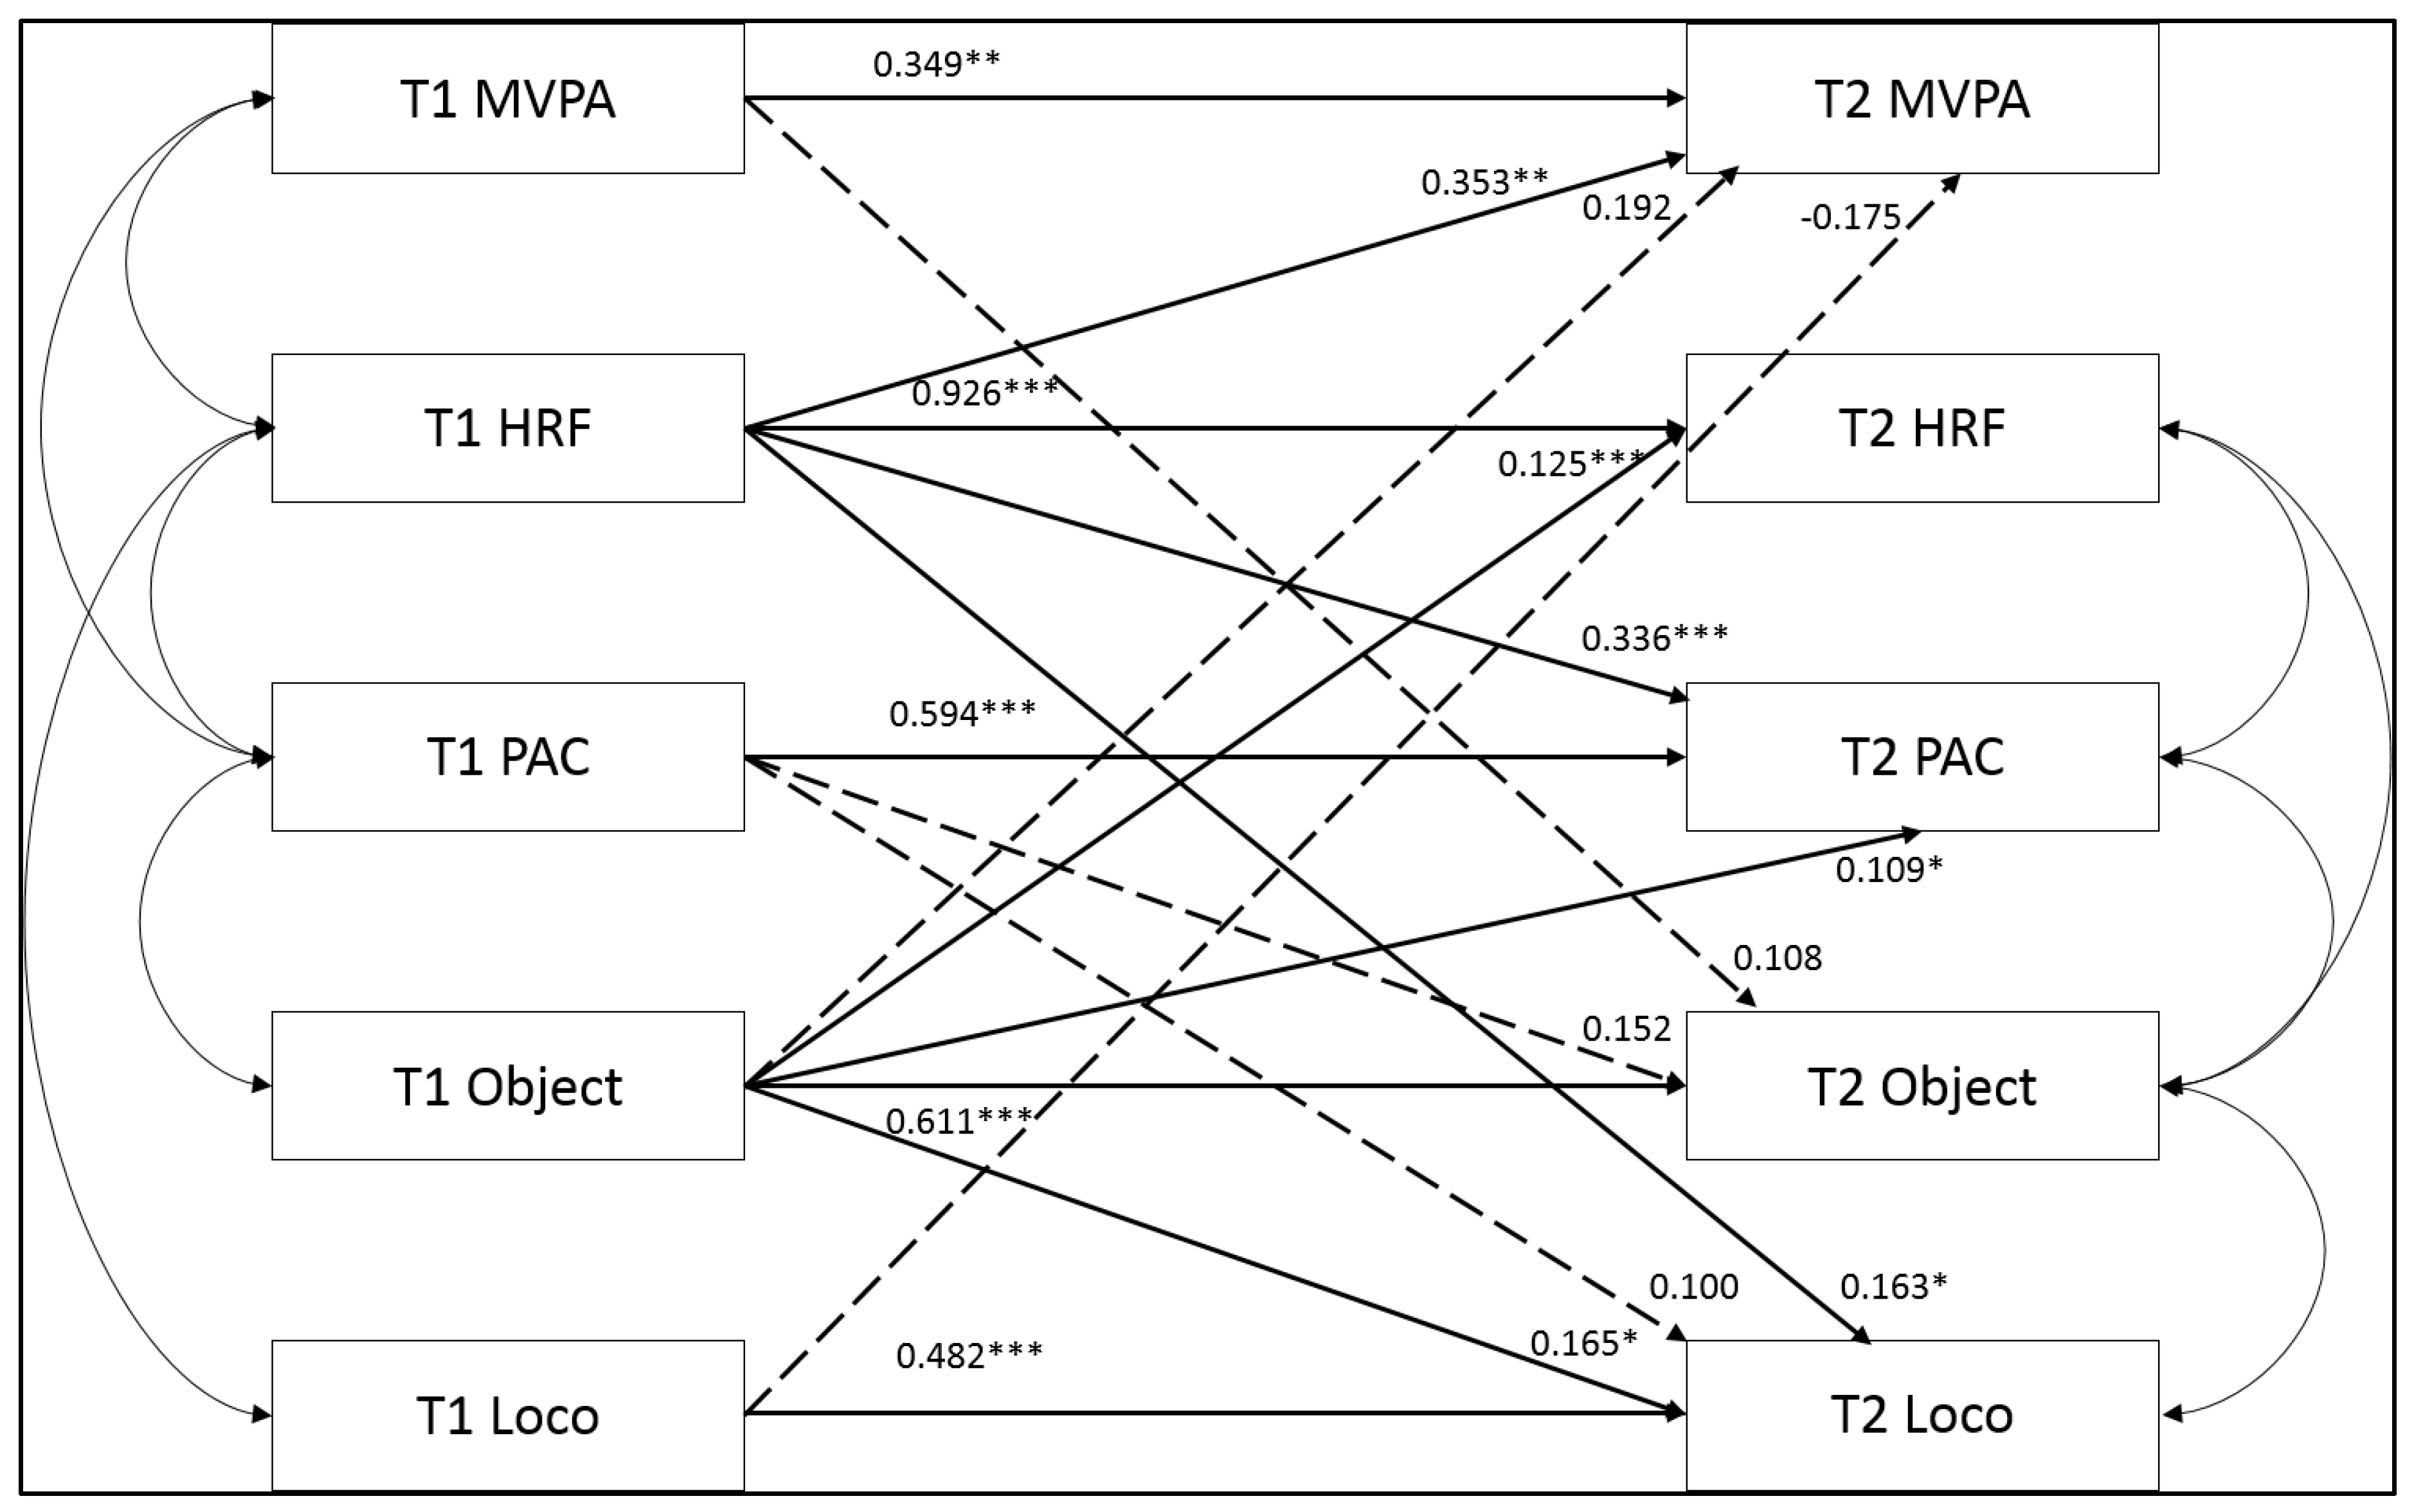
3. Results
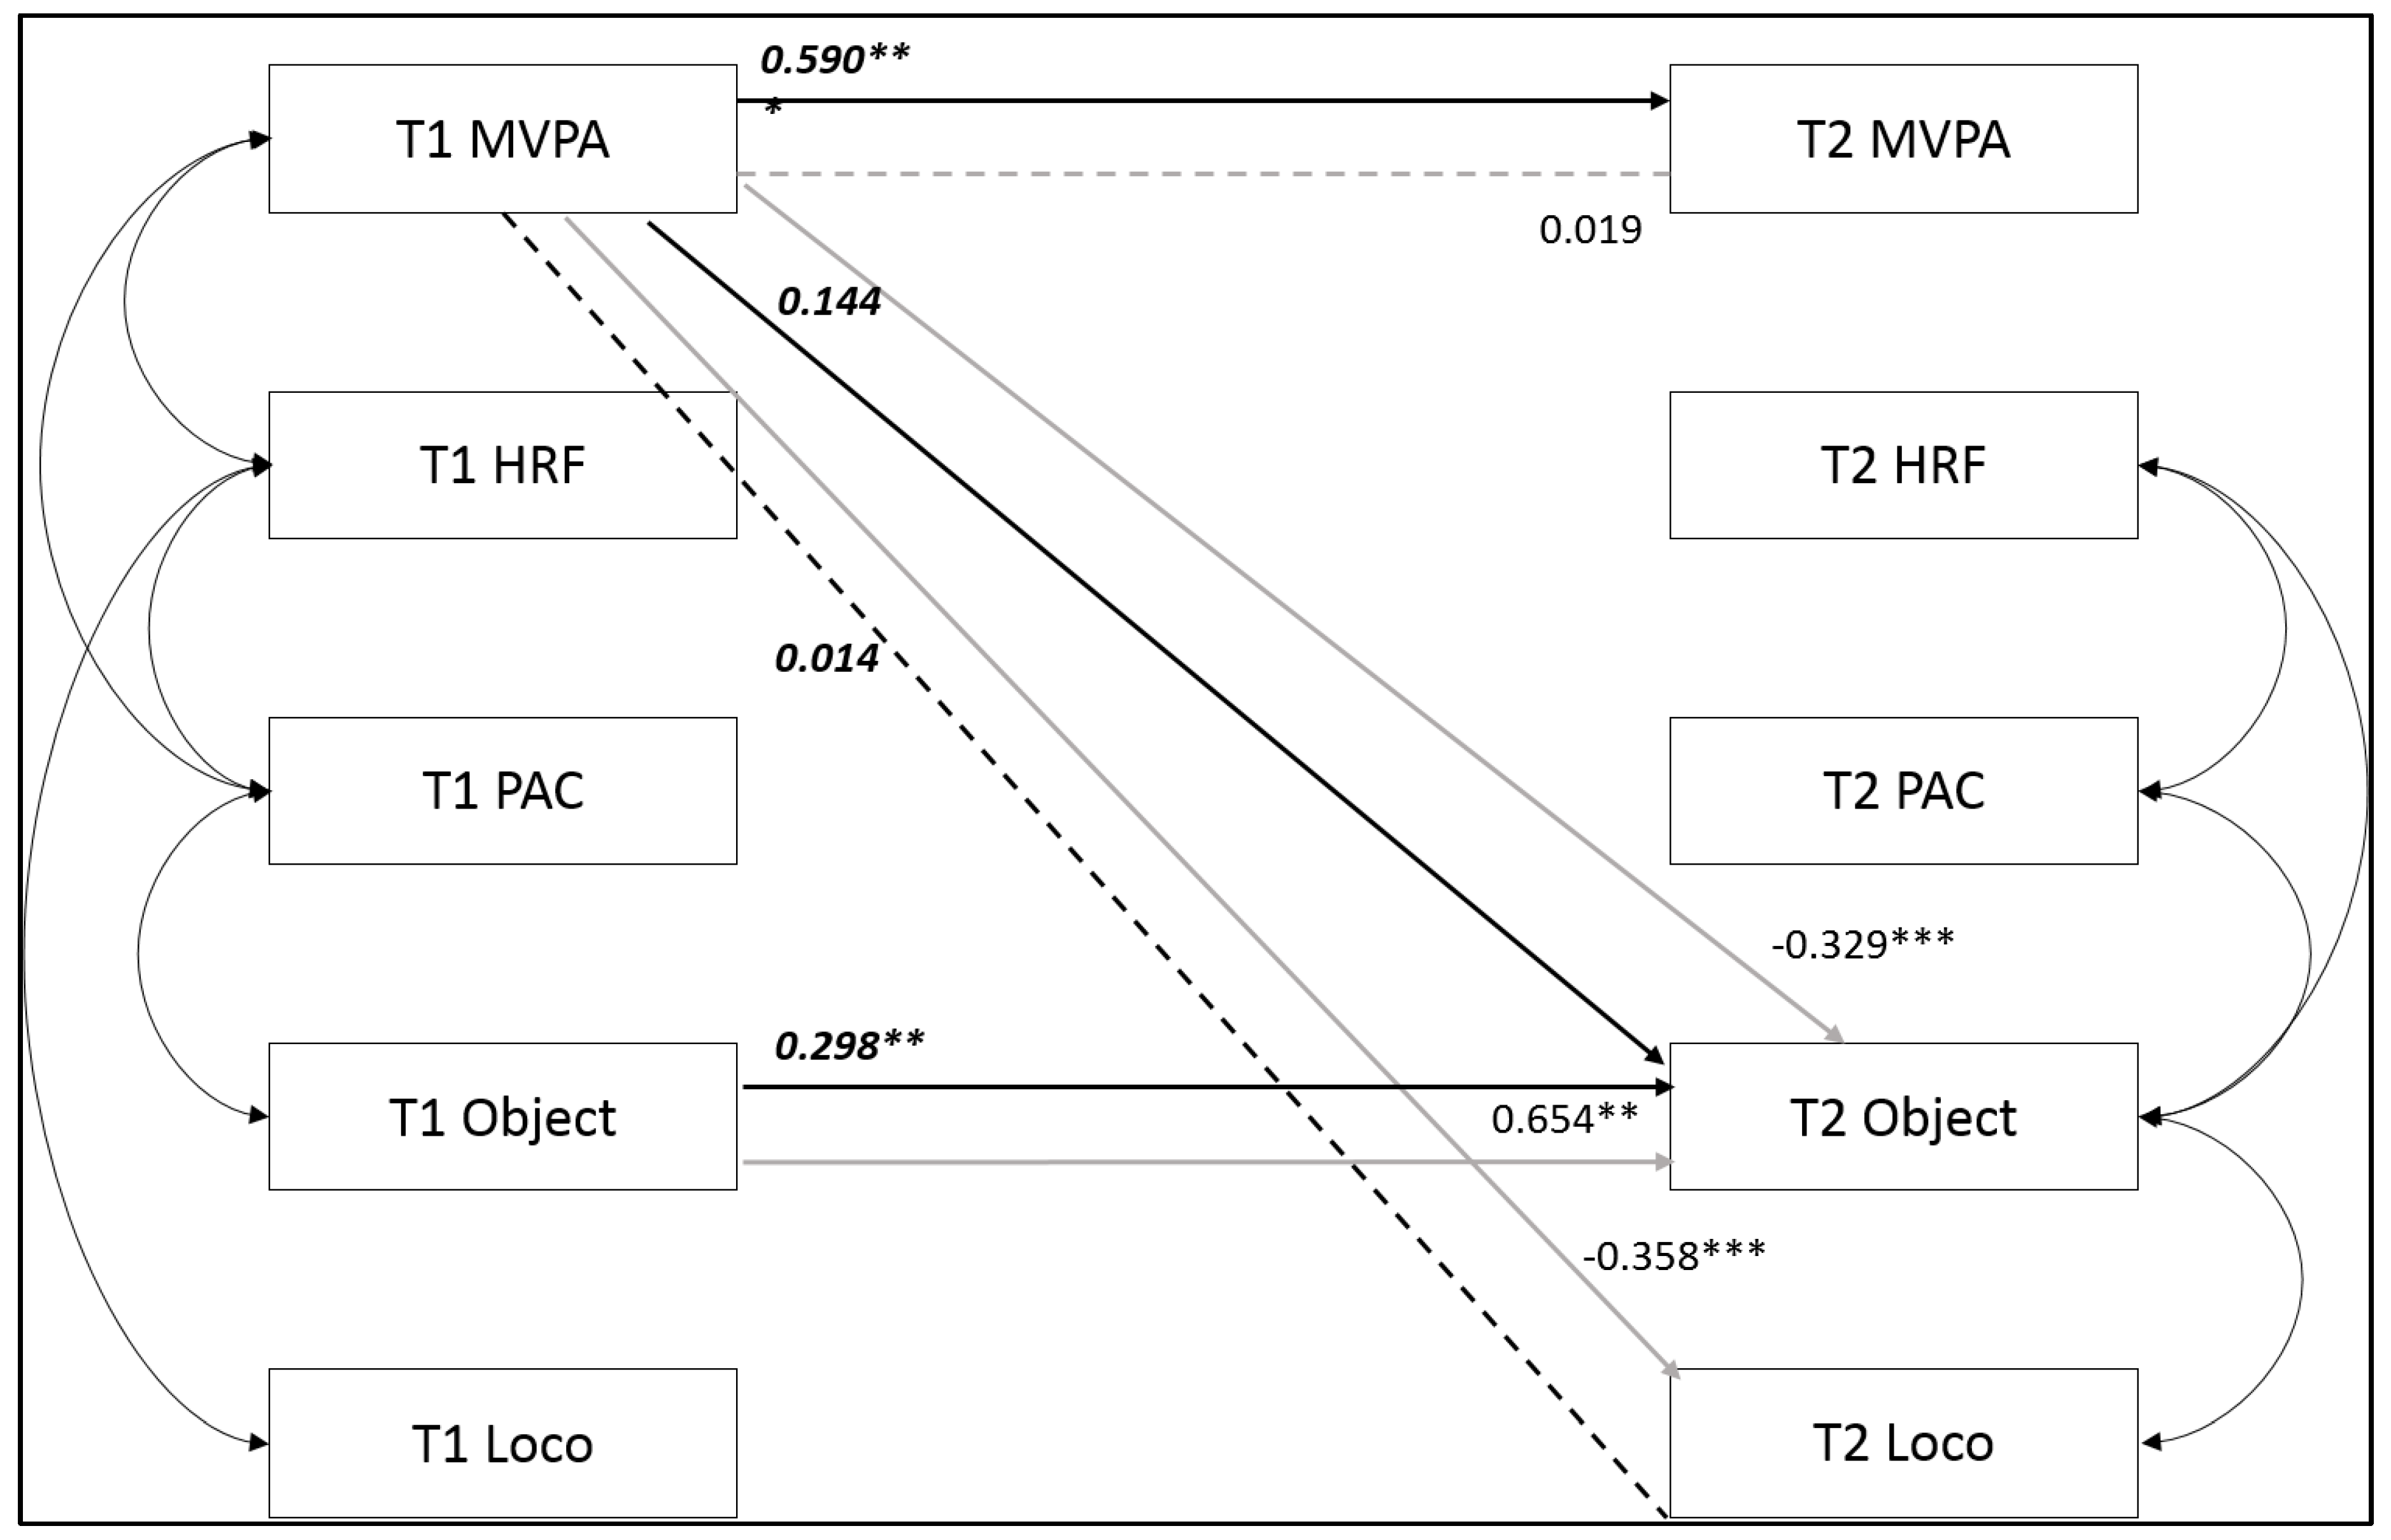
4. Discussion
Differences Between Males and Females
5. Conclusions
Author Contributions
Funding
Acknowledgments
Conflicts of Interest
References
- Bailey, D.P.; Boddy, L.M.; Savory, L.A.; Denton, S.J.; Kerr, C.J. Associations between cardiorespiratory fitness, physical activity and clustered cardiometabolic risk in children and adolescents: The HAPPY study. Eur. J. Pediatr. 2012, 171, 1317–1323. [Google Scholar] [CrossRef] [Green Version]
- Ekelund, U.; Luan, J.; Sherar, L.B.; Esliger, D.W.; Griew, P.; Cooper, A. Moderate to Vigorous Physical Activity and Sedentary Time and Cardiometabolic Risk Factors in Children and Adolescents. J. Am. Med. Assoc. 2012, 307, 704–712. [Google Scholar] [CrossRef] [Green Version]
- Inchley, J.; Kirby, J.; Currie, C. Physical Activity Among Adolescents in Scotland: Final Report of the PASS Study; Child and Adolescent Health Research Unit (CAHRU): Edinburgh, Scotland, 2008. [Google Scholar]
- De Meester, F.; Van Dyck, D.; De Bourdeaudhuij, I.; Deforche, B.; Cardon, G. Changes in physical activity during the transition from primary to secondary school in Belgian children: What is the role of the school environment? BMC Public Health 2014, 14, 261. [Google Scholar] [CrossRef] [PubMed] [Green Version]
- Marks, J.; Barnett, L.M.; Strugnell, C.; Allender, S. Changing from primary to secondary school highlights opportunities for school environment interventions aiming to increase physical activity and reduce sedentary behaviour: A longitudinal cohort study. Int. J. Behav. Nutr. Phys. Act. 2015, 12, 59. [Google Scholar] [CrossRef] [PubMed] [Green Version]
- Gavin, A.; Keane, E.; Callaghan, M.; Molcho, M.; Kelly, C.; Nic Gabhainn, S. The Irish Health Behaviour in School-Aged Children (HBSC) Study 2014; Department of Health and Children: Dublin, Ireland, 2014; ISBN 9781908358028. [Google Scholar]
- Woods, C.B.; Tannehill, D.; Quinlan, A.; Moyna, N.; Walsh, J. The Children’s Sport Participation and Physical Activity Study (CSPPA); Research Report No 1.; School of Health and Human Performance, Dublin City University: Dublin, Ireland; Irish Sports Council: Dublin, Ireland, 2010. [Google Scholar]
- Britton, Ú.; Issartel, J.; Belton, S. Small Fish, Big Pond: The role of health-related fitness and perceived athletic competence in mediating the physical activity-motor competence relationship during the transition from primary to secondary school. J. Sport Sci. 2019, 37, 2538–2548. [Google Scholar] [CrossRef] [PubMed]
- Belton, S.; Issartel, J.; McGrane, B.; Powell, D.; O’Brien, W. The Y-PATH programme: A consideration for physical literacy in Irish youth, and implications for physical education in a changing landscape. Irish Educ. Stud. 2018, 38, 193–211. [Google Scholar] [CrossRef]
- Lau, E.Y.; Dowda, M.; McIver, K.L.; Pate, R.R. Changes in Physical Activity in the School, Afterschool, and Evening Periods During. J. Sch. Health 2017, 87, 531–537. [Google Scholar] [CrossRef]
- Taymoori, P.; Berry, T.R.; Lubans, D.R. Tracking of physical activity during middle school transition in Iranian adolescents. Health Educ. J. 2011, 71, 631–641. [Google Scholar] [CrossRef]
- Robinson, L.E.; Stodden, D.F.; Barnett, L.M.; Lopes, V.P.; Logan, S.W.; Rodrigues, L.P.; D’Hondt, E. Motor Competence and its Effect on Positive Developmental Trajectories of Health. Sports Med. 2015, 45, 1273–1284. [Google Scholar] [CrossRef]
- Stodden, D.F.; Goodway, J.D.; Langendorfer, S.J.; Roberton, M.A.; Rudisill, M.E.; Garcia, C.; Garcia, L.E. A Developmental Perspective on the Role of Motor Skill Competence in Physical Activity: An Emergent Relationship. Quest 2008, 60, 290–306. [Google Scholar] [CrossRef]
- Cattuzzo, M.T.; Dos Santos Henrique, R.; Ré, A.H.N.; de Oliveira, I.S.; Melo, B.M.; de Sousa Moura, M.; de Araújo, R.C.; Stodden, D. Motor competence and health related physical fitness in youth: A systematic review. J. Sci. Med. Sport 2014, 19, 123–129. [Google Scholar] [CrossRef] [PubMed]
- Clark, J.; Metcalfe, J. The mountain of motor development: A metaphor. In Motor Development: Research and Reviews; Clark, J.E., Humphrey, J., Eds.; NASPE Publications: Reston, VA, USA, 2002; Volume 2, pp. 163–190. [Google Scholar]
- Gallahue, D.; Ozmun, J. Understanding Motor Development: Infants, Children, Adolescents, Adults; Jones & Bartlett Learning: Burlington, MA, USA, 2012. [Google Scholar]
- Barnett, L.M.; van Beurden, E.; Morgan, P.J.; Brooks, L.O.; Beard, J.R. Childhood Motor Skill Proficiency as a Predictor of Adolescent Physical Activity. J. Adolesc. Heal. 2009, 44, 252–259. [Google Scholar] [CrossRef] [PubMed]
- Lloyd, M.; Saunders, T.J.; Bremer, E.; Tremblay, M.S. Long-term importance of fundamental motor skills: A 20-year follow-up study. Adapt. Phys. Act. Q. 2014, 31, 67–78. [Google Scholar] [CrossRef] [PubMed]
- Lopes, V.P.; Rodrigues, L.P.; Maia, J.A.R.; Malina, R.M. Motor coordination as predictor of physical activity in childhood. Scand. J. Med. Sci. Sports 2011, 21, 663–669. [Google Scholar] [CrossRef]
- Belton, S.; O’ Brien, W.; Meegan, S.; Woods, C.; Issartel, J. Youth-Physical Activity Towards Health: Evidence and background to the development of the Y-PATH physical activity intervention for adolescents. BMC Public Health 2014, 14, 122. [Google Scholar] [CrossRef]
- O’Connor, S.; Whyte, E.F.; Gibbons, B.; Feeney, O.; Luc, S.; Ní Chéilleachair, N. Fundamental movement skill proficiency in juvenile Gaelic games. Sport Sci. Health 2018, 14, 161–172. [Google Scholar] [CrossRef]
- Mitchell, B.; McLennan, S.; Latimer, K.; Graham, D.; Gilmore, J.; Rush, E. Improvement of fundamental movement skills through support and mentorship of class room teachers. Obes. Res. Clin. Pract. 2013, 7, 230–234. [Google Scholar] [CrossRef]
- O’ Brien, W.; Belton, S.; Issartel, J. Fundamental movement skill proficiency amongst adolescent youth. Phys. Educ. Sport Pedagog. 2015, 21, 557–571. [Google Scholar] [CrossRef]
- Barnett, L.M.; van Beurden, E.; Morgan, P.J.; Brooks, L.O.; Beard, J.R. Gender differences in motor skill proficiency from childhood to adolescence: A longitudinal study. Res Q Exerc Sport 2010, 81, 162–170. [Google Scholar]
- Barnett, L.M.; Morgan, P.; van Beurden, E.; Beard, J. Perceived sports competence mediates the relationship between childhood motor skill proficiency and adolescent physical activity and fitness: A longitudinal assessment. Int. J. Behav. Nutr. Phys. Act. 2008, 5, 40. [Google Scholar] [CrossRef] [Green Version]
- Caspersen, C.J.; Powell, K.E.; Christenson, G.M. Physical activity, exercise, and physical fitness: Definitions and distinctions for health-related research. Public Health Rep. 1985, 100, 126–131. [Google Scholar] [PubMed]
- Ortega, F.B.; Ortega, F.B.; Artero, E.G.; Ruiz, J.R.; España-Romero, V.; Jiménez-Pavón, D.; Vicente-Rodriguez, G.; Moreno, L.A.; Manios, Y.; Béghin, L.; et al. Physical fi tness levels among European adolescents: The HELENA study. Br. J. Sports Med. 2011, 45, 20–29. [Google Scholar] [CrossRef] [PubMed] [Green Version]
- Santos, R.; Mota, J.; Santos, D.A.; Silva, A.M.; Baptista, F.; Sardinha, L.B. Physical fitness percentiles for Portuguese children and adolescents aged 10–18 years. J. Sports Sci. 2014, 32, 1510–1518. [Google Scholar] [CrossRef] [PubMed]
- Barnett, L.M.; van BeurdenN, E.; Morgan, P.J.; Brooks, L.O.; Beard, J.R. Does Childhood Motor Skill Proficiency Predict Adolescent Fitness? Med. Sci. Sport. Exerc. 2008, 40, 2137–2144. [Google Scholar] [CrossRef] [Green Version]
- Kriemler, S.; Zahner, L.; Schindler, C.; Meyer, U.; Hartmann, T.; Hebestreit, H.; Brunner-La Rocca, H.P.; van Mechelen, W.; Puder, J.J. Effect of school based physical activity programme (KISS) on fitness and adiposity in primary schoolchildren: Cluster randomised controlled trial. BMJ 2010, 340, c785. [Google Scholar] [CrossRef] [Green Version]
- Ortega, F.; Ruiz, J.R.; Castillo, M.J.; Sjöström, M. Physical fitness in childhood and adolescence: A powerful marker of health. Int. J. Obes. 2008, 32, 1–11. [Google Scholar] [CrossRef] [Green Version]
- Smith, J.J.; Eather, N.; Morgan, P.J.; Plotnikoff, R.C.; Faigenbaum, A.D.; Lubans, D.R. The Health Benefits of Muscular Fitness for Children and Adolescents: A Systematic Review and Meta-Analysis. Sports Med. 2014, 44, 1209–1223. [Google Scholar] [CrossRef]
- Aires, L.; Andersen, L.B.; Mendonça, D.; Martins, C.; Silva, G.; Mota, J. A 3-year longitudinal analysis of changes in fitness, physical activity, fatness and screen time. Acta Paediatr. Int. J. Paediatr. 2010, 99, 140–144. [Google Scholar] [CrossRef]
- Larsen, L.R.; Kristensen, P.L.; Junge, T.; Rexen, C.T.; Wedderkopp, N. Motor Performance as Predictor of Physical Activity in Children: The CHAMPS Study-DK. Med. Sci. Sports Exerc. 2015, 47, 1849–1856. [Google Scholar] [CrossRef]
- Tomkinson, G.R.; Carver, K.D.; Atkinson, F.; Daniell, N.D.; Lewis, L.K.; Fitzgerald, J.S.; Lang, J.J.; Ortega, F.B. European normative values for physical fitness in children and adolescents aged 9-17 years: Results from 2 779 165 Eurofit performances representing 30 countries. Br. J. Sports Med. 2018, 52, 1445–1456. [Google Scholar] [CrossRef] [Green Version]
- Feltz, D.L. Self-confidence and sports performance. Exerc. Sport Sci. Rev. 1988, 16, 423–457. [Google Scholar] [CrossRef] [PubMed] [Green Version]
- De Meester, A.; Maes, J.; Stodden, D.; Cardon, G.; Goodway, J.; Lenoir, M.; Haerens, L. Identifying profiles of actual and perceived motor competence among adolescents: Associations with motivation, physical activity, and sports participation. J. Sports Sci. 2016, 34, 2027–2037. [Google Scholar] [CrossRef] [PubMed]
- Masci, I.; Schmidt, M.; Marchetti, R.; Vannozzi, G.; Pesce, C. When Children’s Perceived and Actual Motor Competence Mismatch: Sport Participation and Gender Differences. J. Mot. Learn. Dev. 2018, 6, S440–S460. [Google Scholar]
- Crane, J.R.; Naylor, P.J.; Cook, R.; Temple, V.A. Do Perceptions of Competence Mediate The Relationship Between Fundamental Motor Skill Proficiency and Physical Activity Levels of Children in Kindergarten? J. Phys. Act. Health 2015, 12, 954–961. [Google Scholar] [CrossRef] [PubMed]
- Kavanaugh, K.; Moore, J.B.; Hibbett, L.J.; Kaczynski, A.T. Correlates of subjectively and objectively measured physical activity in young adolescents. J. Sport Heal. Sci. 2015, 4, 222–227. [Google Scholar] [CrossRef] [Green Version]
- Cantell, M.H.; Smyth, M.M.; Ahonen, T.P. Two distinct pathways for developmental coordination disorder: Persistence and resolution. Hum. Mov. Sci. 2003, 22, 413–431. [Google Scholar] [CrossRef]
- Piek, J.P.; Baynam, G.B.; Barrett, N.C. The relationship between fine and gross motor ability, self-perceptions and self-worth in children and adolescents. Hum. Mov. Sci. 2006, 25, 65–75. [Google Scholar] [CrossRef]
- Arens, A.K.; Yeung, A.S.; Craven, R.G.; Watermann, R.; Hasselhorn, M. Does the timing of transition matter? Comparison of German students’ self-perceptions before and after transition to secondary school. Int. J. Educ. Res. 2013, 57, 1–11. [Google Scholar] [CrossRef]
- Symonds, J.E.; Galton, M. Moving to the next school at age 10–14 years: An international review of psychological development at school transition. Rev. Educ. 2014, 2, 28–30. [Google Scholar] [CrossRef] [Green Version]
- Esliger, D.W.; Copeland, J.L.; Barnes, J.D.; Tremblay, M.S. Standardizing and optimizing the use of accelerometer data for free-living physical activity monitoring. J. Phys. Act. Heal. 2005, 2, 366–383. [Google Scholar] [CrossRef]
- Dossegger, A.; Ruch, N.; Jimmy, G.; Braun-Fahrländer, C.; Mäder, U.; Hänggi, J.; Hofmann, H.; Puder, J.J.; Kriemler, S.; Bringolf-Isler, B. Reactivity to accelerometer measurement of children and adolescents. Med. Sci. Sports Exerc. 2014, 46, 1140–1146. [Google Scholar] [CrossRef] [Green Version]
- Belton, S.; O’ Brien, W.; Wickel, E.E.; Issartel, J. Patterns of noncompliance in adolescent field-based accelerometer research. J. Phys. Act. Health 2013, 10, 1181–1185. [Google Scholar] [CrossRef] [PubMed]
- Evenson, K.R.; Catellier, D.J.; Gill, K.; Ondrak, K.S.; McMurray, R.G. Calibration of two objective measures of physical activity for children. J. Sports Sci. 2008, 26, 1557–1565. [Google Scholar] [CrossRef] [PubMed]
- Jago, R.; Page, A.S.; Cooper, A.R. Friends and physical activity during the transition from primary to secondary school. Med. Sci. Sports Exerc. 2012, 44, 111–117. [Google Scholar] [CrossRef]
- Ulrich, D. Test of Gross Motor Development-3, 3rd ed.; Pro-Ed: Austin, TX, USA, 2016. [Google Scholar]
- Victoria Department of Education. Fundamental Motor Skills. A Manual for Classroom Teachers; Community Information Service, Department of Education: Melbourne, Australia, 1996; 52p. [Google Scholar]
- Harter, S. The Self-Perception Profile for Adolescents: Manual and Questionaires; The University of Denver, Department of Psychology: Denver, CO, USA, 2012; 47p. [Google Scholar]
- Hair, J.F.; Sarstedt, M.; Ringle, C.M.; Mena, J.A. An assessment of the use of partial least squares structural equation modeling in marketing research. J. Acad. Mark. Sci. 2012, 40, 414–433. [Google Scholar] [CrossRef]
- Britton, Ú.; Issartel, J.; Fahey, G.; Conyngham, G.; Belton, S. What is health-related fitness? Investigating the underlying factor structure of fitness in youth. Eur. Phys. Educ. Rev. 2019. [Google Scholar] [CrossRef]
- Plowman, S.A.; Mahar, M.T. FITNESSGRAM/ACTIVITYGRAM Reference Guide, 4th ed.; The Cooper Institute: Dallas, TX, USA, 2013. [Google Scholar]
- Council of Europe Testing Physical Fitness: Eurofit; Council of Europe, Committee for the Development of Sport: Strasbourg, France, 1983; pp. 1–18.
- Ortega, F.; Artero, E.; Ruiz, J.; Vicente-Rodriguez, G.; Bergman, P.; Hagströmer, M.; Ottevaere, C.; Nagy, E.; Konsta, O.; Pez, R.-L.; et al. Reliability of health-related physical fitness tests in European adolescents. The HELENA Study. Int. J. Obes. 2008, 32, S49–S57. [Google Scholar] [CrossRef] [Green Version]
- Coulson, M.; Archer, D. Practical Fitness Testing; A & C Black Publishers Ltd.: London, UK, 2009. [Google Scholar]
- Tabachnick, B.G.; Fidell, L.S. Using Multivariate Statistics, 5th ed.; Allyn and Bacon: Boston, MA, USA, 2007. [Google Scholar]
- Arbuckle, J.L. IBM® SPSS® AmosTM 23 User’s Guide; StataCorp LLC: College Station, TX, USA, 2014; ISBN 9781597180955. [Google Scholar]
- Enders, C.K.; Bandalos, D.L.; Enders, C.K. The Relative Performance of Full Information Maximum Likelihood Estimation for Missing Data in Structural Equation Models. Educ. Psychol. Pap. Publ. 2001, 8, 430–457. [Google Scholar] [CrossRef]
- Shin, T.; Davison, M.; Long, J. Maximum Likelihood Versus Multiple Imputation for Missing Data in Data in Small Longitudinal Samples With Nonnormality. Psychol. Methods Am. Psychol. Assoc. 2016, 22, 426–449. [Google Scholar] [CrossRef]
- Brown, T.A. Confirmatory Factor Analysis for Applied Research; Guilford Press: New York, NY, USA, 2006. [Google Scholar]
- Harju, L.K.; Hakanen, J.J.; Schaufeli, W.B. Can job crafting reduce job boredom and increase work engagement? A three-year cross-lagged panel study. J. Vocat. Behav. 2016, 95–96, 11–20. [Google Scholar] [CrossRef]
- Byrne, B. Structural Equation Modeling with AMOS: Basic Concepts, Applications, and Programming, 3rd ed.; Routledge: New York, NY, USA, 2010. [Google Scholar]
- Schumacker, E.R.; Lomax, G.R. A Beginner’s Guide to Structural Equation Modeling; Erlbaum: Hillsdale, NJ, USA, 1996. [Google Scholar]
- Kline, R. Principles and Practice of Structural Equation Modeling, 4th ed.; Sage Publications Ltd.: London, UK, 2015. [Google Scholar]
- Hu, L.; Bentler, P. Cutoff criteria for fit indexes in covariance structure analysis: Conventional criteria versus new alternatives. Struct. Equ. Model. A Multidiscip. J. 1999, 6, 1–55. [Google Scholar] [CrossRef]
- Cohen, J. A Power Primer. Psychol. Bull. 1992, 112, 155–159. [Google Scholar] [CrossRef] [PubMed]
- Burgi, F.; Meyer, U.; Granacher, U.; Schindler, C.; Marques-Vidal, P.; Kriemler, S.; Puder, J.J. Relationship of physical activity with motor skills, aerobic fitness and body fat in preschool children: A cross-sectional and longitudinal study (Ballabeina). Int. J. Obes. 2011, 35, 937–944. [Google Scholar] [CrossRef] [PubMed] [Green Version]
- Haugen, T.; Ommundsen, Y.; Seiler, S. The Relationship Between Physical Activity and Physical Self-Esteem in Adolescents: The Role of Physical Fitness Indices. Pediatr. Exerc. Sci. 2013, 25, 138–153. [Google Scholar] [CrossRef] [Green Version]
- Jaakkola, T.; Yli-Piipari, S.; Huotari, P.; Watt, A.; Liukkonen, J. Fundamental movement skills and physical fitness as predictors of physical activity: A 6-year follow-up study. Scand. J. Med. Sci. Sports 2016, 26, 74–81. [Google Scholar] [CrossRef] [PubMed]
- Jaakkola, T.; Hakonen, H.; Kankaanpää, A.; Joensuu, L.; Kulmala, J.; Kallio, J.; Watt, A.; Tammelin, T.H. Longitudinal associations of fundamental movement skills with objectively measured physical activity and sedentariness during school transition from primary to lower secondary school. J. Sci. Med. Sport 2019, 22, 85–90. [Google Scholar] [CrossRef]
- Ré, A.H.N.; Cattuzzo, M.T.; Ré, A.H.N.; Cattuzzo, M.T.; Henrique, S.; Stodden, D.F.; Nicolai, A.H.; Cattuzzo, M.T. Physical characteristics that predict involvement with the ball in recreational youth soccer. J. Sport Sci. 2016, 34, 1716–1722. [Google Scholar] [CrossRef]
- Stodden, D.F.; True, L.K.; Langendorfer, S.J.; Gao, Z. Associations Among Selected Motor Skills and Health-Related Fitness: Indirect Evidence for Seefeldt’s Proficiency Barrier in Young Adults? Res. Q. Exerc. Sport 2013, 84, 397–403. [Google Scholar] [CrossRef]
- Belton, S.; O’Brien, W.; McGann, J.; Issartel, J. Bright spots, physical activity investments that work: Workplace Challenge. Br. J. Sports Med. 2018, 52, 1026–1028. [Google Scholar]
- Lai, S.K.; Costigan, S.A.; Morgan, P.J.; Lubans, D.R.; Stodden, D.F.; Salmon, J.; Barnett, L.M. Do School-Based Interventions Focusing on Physical Activity, Fitness, or Fundamental Movement Skill Competency Produce a Sustained Impact in These Outcomes in Children and Adolescents? A Systematic Review of Follow-Up Studies. Sports Med. 2014, 44, 67–79. [Google Scholar] [CrossRef]
- Barnett, L.M.; Morgan, P.J.; Van Beurden, E.; Ball, K.; Lubans, D.R. A reverse pathway? Actual and perceived skill proficiency and physical activity. Med. Sci. Sports Exerc. 2011, 43, 898–904. [Google Scholar] [CrossRef] [PubMed] [Green Version]
- Hardie Murphy, M.; Rowe, D.A.; Woods, C.B. Impact of physical activity domains on subsequent physical activity in youth: A 5-year longitudinal study. J. Sports Sci. 2017, 35, 262–268. [Google Scholar] [CrossRef] [PubMed]
- Murphy, M.H.; Rowe, D.A.; Woods, C.B. Sports Participation in Youth as a Predictor of Physical Activity: A 5-Year Longitudinal Study. J. Phys. Act. Heal. 2016, 13, 704–711. [Google Scholar] [CrossRef] [PubMed]
- Anderssen, N.; Wold, B.; Torsheim, T. Tracking of Physical Activity in Adolescence. Res. Q. Exerc. Sport 2005, 76, 119–129. [Google Scholar] [CrossRef]
- Hands, B.; Larkin, D.; Parker, H.; Straker, L.; Perry, M. The relationship among physical activity, motor competence and health-related fitness in 14-year-old adolescents. Scand. J. Med. Sci. Sports 2009, 19, 655–663. [Google Scholar] [CrossRef]
- Rowland, T.W. Children’s Exercise Physiology; Human Kinetics: Champaign, IL, USA, 2005. [Google Scholar]
- Anderson, L.; Jacobs, J.; Schramm, S.; Splittgerber, F. School transitions: Beginning of the end or a new beginning? Int. J. Educ. Res. 2000, 33, 325–339. [Google Scholar] [CrossRef]
- Grimminger, E. Sport motor competencies and the experience of social recognition among peers in physical education—A video-based study. Phys. Educ. Sport Pedagog. 2013, 18, 506–519. [Google Scholar] [CrossRef]
- Feltz, D.L. Athletics in the status system of female adolescents. Rev. Sport Leis. 1978, 3, 98–108. [Google Scholar]
- Williams, J.M.; White, K.A. Adolescent status systems for males and females at three age levels. Adolescence 1983, 2, 381–389. [Google Scholar]
- Utesch, T.; Bardid, F.; Busch, D.; Strauss, B. The relationship between motor competence and physical fitness from early 2 childhood to early adulthood: A meta-analysis. Sports Med. 2019, 49, 541–551. [Google Scholar] [CrossRef] [Green Version]


| HRF Component | Test | Source |
|---|---|---|
| CRE | 20 MST | FITNESSGRAM; EUROFIT |
| MS | HJ | EUROFIT; HELENA Study |
| - | VJ * | HELENA Study |
| ME | Push-ups | FITNESSGRAM |
| - | Curl-ups | FITNESSGRAM |
| Variable | χ2 | Df | p-Value | CFI | RMSEA | LCI | UCI |
|---|---|---|---|---|---|---|---|
| PAC | 5.56 | 5 | 0.352 | 0.990 | 0.040 | 0.020 | 0.070 |
| Object-Control * | 1.1 | 2 | 0.576 | 1.000 | 0.000 | 0.000 | 0.090 |
| Locomotor | 2.65 | 2 | 0.266 | 0.980 | 0.031 | 0.000 | 0.117 |
| HRF | 14.26 | 3 | 0.003 | 0.960 | 0.106 | 0.055 | 0.164 |
| Variable | χ2 | Df | p-Value |
|---|---|---|---|
| PAC | 6.33 | 4 | 0.176 |
| Object-Control * | 7.33 | 3 | 0.062 |
| Locomotor | 5.291 | 3 | 0.152 |
| HRF | 7.786 | 4 | 0.100 |
| Male | Female | t | p a | d b | |||
|---|---|---|---|---|---|---|---|
| Testing Period | n | Mean | n | Mean | |||
| 6th class MVPA (mins) | 58 | 59.27 ± 24.55 | 77 | 48.50 ± 16.82 | 2.87 | 0.005 | 0.52 |
| 1st year MVPA (mins) | 44 | 44.95 ± 18.83 | 59 | 35.11 ± 12.12 | 3.04 | 0.003 | 0.64 |
| 6th class HRF | 128 | 1.32 ± 3.71 | 133 | −1.27 ± 3.08 | 6.12 | <0.001 | 0.76 |
| 1st year HRF | 155 | 1.41 ± 3.43 | 143 | −1.51 ± 2.65 | 8.22 | <0.001 | 0.95 |
| 6th class PAC | 122 | 2.92 ± 0.67 | 125 | 2.75 ± 0.73 | 1.94 | 0.053 | 0.24 |
| 1st year PAC | 135 | 2.92 ± 0.70 | 119 | 2.58 ± 0.79 | 3.6 | <0.001 | 0.46 |
| 6th class object-control MC | 120 | 27.91 ± 4.01 | 118 | 23.12 ± 5.55 | 7.62 | <0.001 | 0.99 |
| 1st year object-control MC | 77 | 28.88 ± 3.51 | 62 | 24.90 ± 5.08 | 6.57 | <0.001 | 0.92 |
| 6th class locomotor MC | 119 | 29.29 ± 3.85 | 119 | 29.02 ± 3.64 | 0.55 | 0.580 | 0.07 |
| 1st year locomotor MC | 99 | 30.78 ± 3.21 | 86 | 24.90 ± 5.08 | 2.46 | 0.015 | 1.40 |
| Males | Females | |||
|---|---|---|---|---|
| Pathway | β | p | β | p |
| T1 MVPA–T2 MVPA | 0.590 | *** | 0.019 | NS |
| T1 Object-Control–T2 Object-Control | 0.298 | ** | 0.654 | *** |
| T1 MVPA–T2 Object-Control | 0.144 | NS | −0.329 | ** |
| T1 MVPA–T2 Locomotor | −0.004 | NS | −0.358 | ** |
© 2020 by the authors. Licensee MDPI, Basel, Switzerland. This article is an open access article distributed under the terms and conditions of the Creative Commons Attribution (CC BY) license (http://creativecommons.org/licenses/by/4.0/).
Share and Cite
Britton, U.; Issartel, J.; Symonds, J.; Belton, S. What Keeps Them Physically Active? Predicting Physical Activity, Motor Competence, Health-Related Fitness, and Perceived Competence in Irish Adolescents after the Transition from Primary to Second-Level School. Int. J. Environ. Res. Public Health 2020, 17, 2874. https://0-doi-org.brum.beds.ac.uk/10.3390/ijerph17082874
Britton U, Issartel J, Symonds J, Belton S. What Keeps Them Physically Active? Predicting Physical Activity, Motor Competence, Health-Related Fitness, and Perceived Competence in Irish Adolescents after the Transition from Primary to Second-Level School. International Journal of Environmental Research and Public Health. 2020; 17(8):2874. https://0-doi-org.brum.beds.ac.uk/10.3390/ijerph17082874
Chicago/Turabian StyleBritton, Una, Johann Issartel, Jennifer Symonds, and Sarahjane Belton. 2020. "What Keeps Them Physically Active? Predicting Physical Activity, Motor Competence, Health-Related Fitness, and Perceived Competence in Irish Adolescents after the Transition from Primary to Second-Level School" International Journal of Environmental Research and Public Health 17, no. 8: 2874. https://0-doi-org.brum.beds.ac.uk/10.3390/ijerph17082874