A Meta-Analysis of the Reliability of Four Field-Based Trunk Extension Endurance Tests

 , , ,
, , ,
Abstract
:1. Introduction
2. Materials and Methods
2.1. Study Selection
2.2. Search Strategy
| Isometric Endurance Field-Based Tests | |
| Biering-Sorensen test | |
 | The test consists of assessing how many seconds the participant can keep the unsupported upper part of the body (from the upper border of the iliac crest) horizontal while placed prone with the buttocks and legs fixed to the table bench by three wide canvas straps, with the arms across the chest. The test is continued until the participant could no longer control his/her posture for a maximum of 240 s. |
| Prone isometric chest raise test | |
 | The test consists of assessing how many seconds the participant can keep the sternum off the floor while placed prone with the arms along the body. A small pillow is placed under the iliac crest to decrease the lumbar lordosis. The subject is asked to maintain the position for as long as possible, not exceeding a 5 min time limit. |
| Prone double straight-leg raise test | |
 | The test consists of assessing how many seconds the participant can keep both legs raised with the knees off the mat while placed prone with hips extended, the hands underneath the forehead and the arms perpendicular to the body. The test is continued until the participant can no longer maintain knee clearance. |
| Dynamic Endurance Field-Based Test | |
| Dynamic extensor endurance test | |
 | The test consists of assessing how many repetitions the participant can perform while placed prone with the unsupported upper part of the body (from the upper border of the iliac crest). The arms are positioned along the body and the buttocks and legs are fixed by three straps. With the spine kept straight, the subject is instructed to extend the trunk to neutral and then to lower the upper body 45 degrees. A repeated beat guided the subject to maintain a cadence of 25 repetitions per minute until exhaustion. |
2.3. Data Extraction
2.4. Reliability Estimates
2.5. Quality Assessment
2.6. Data Synthesis and Analysis
3. Results
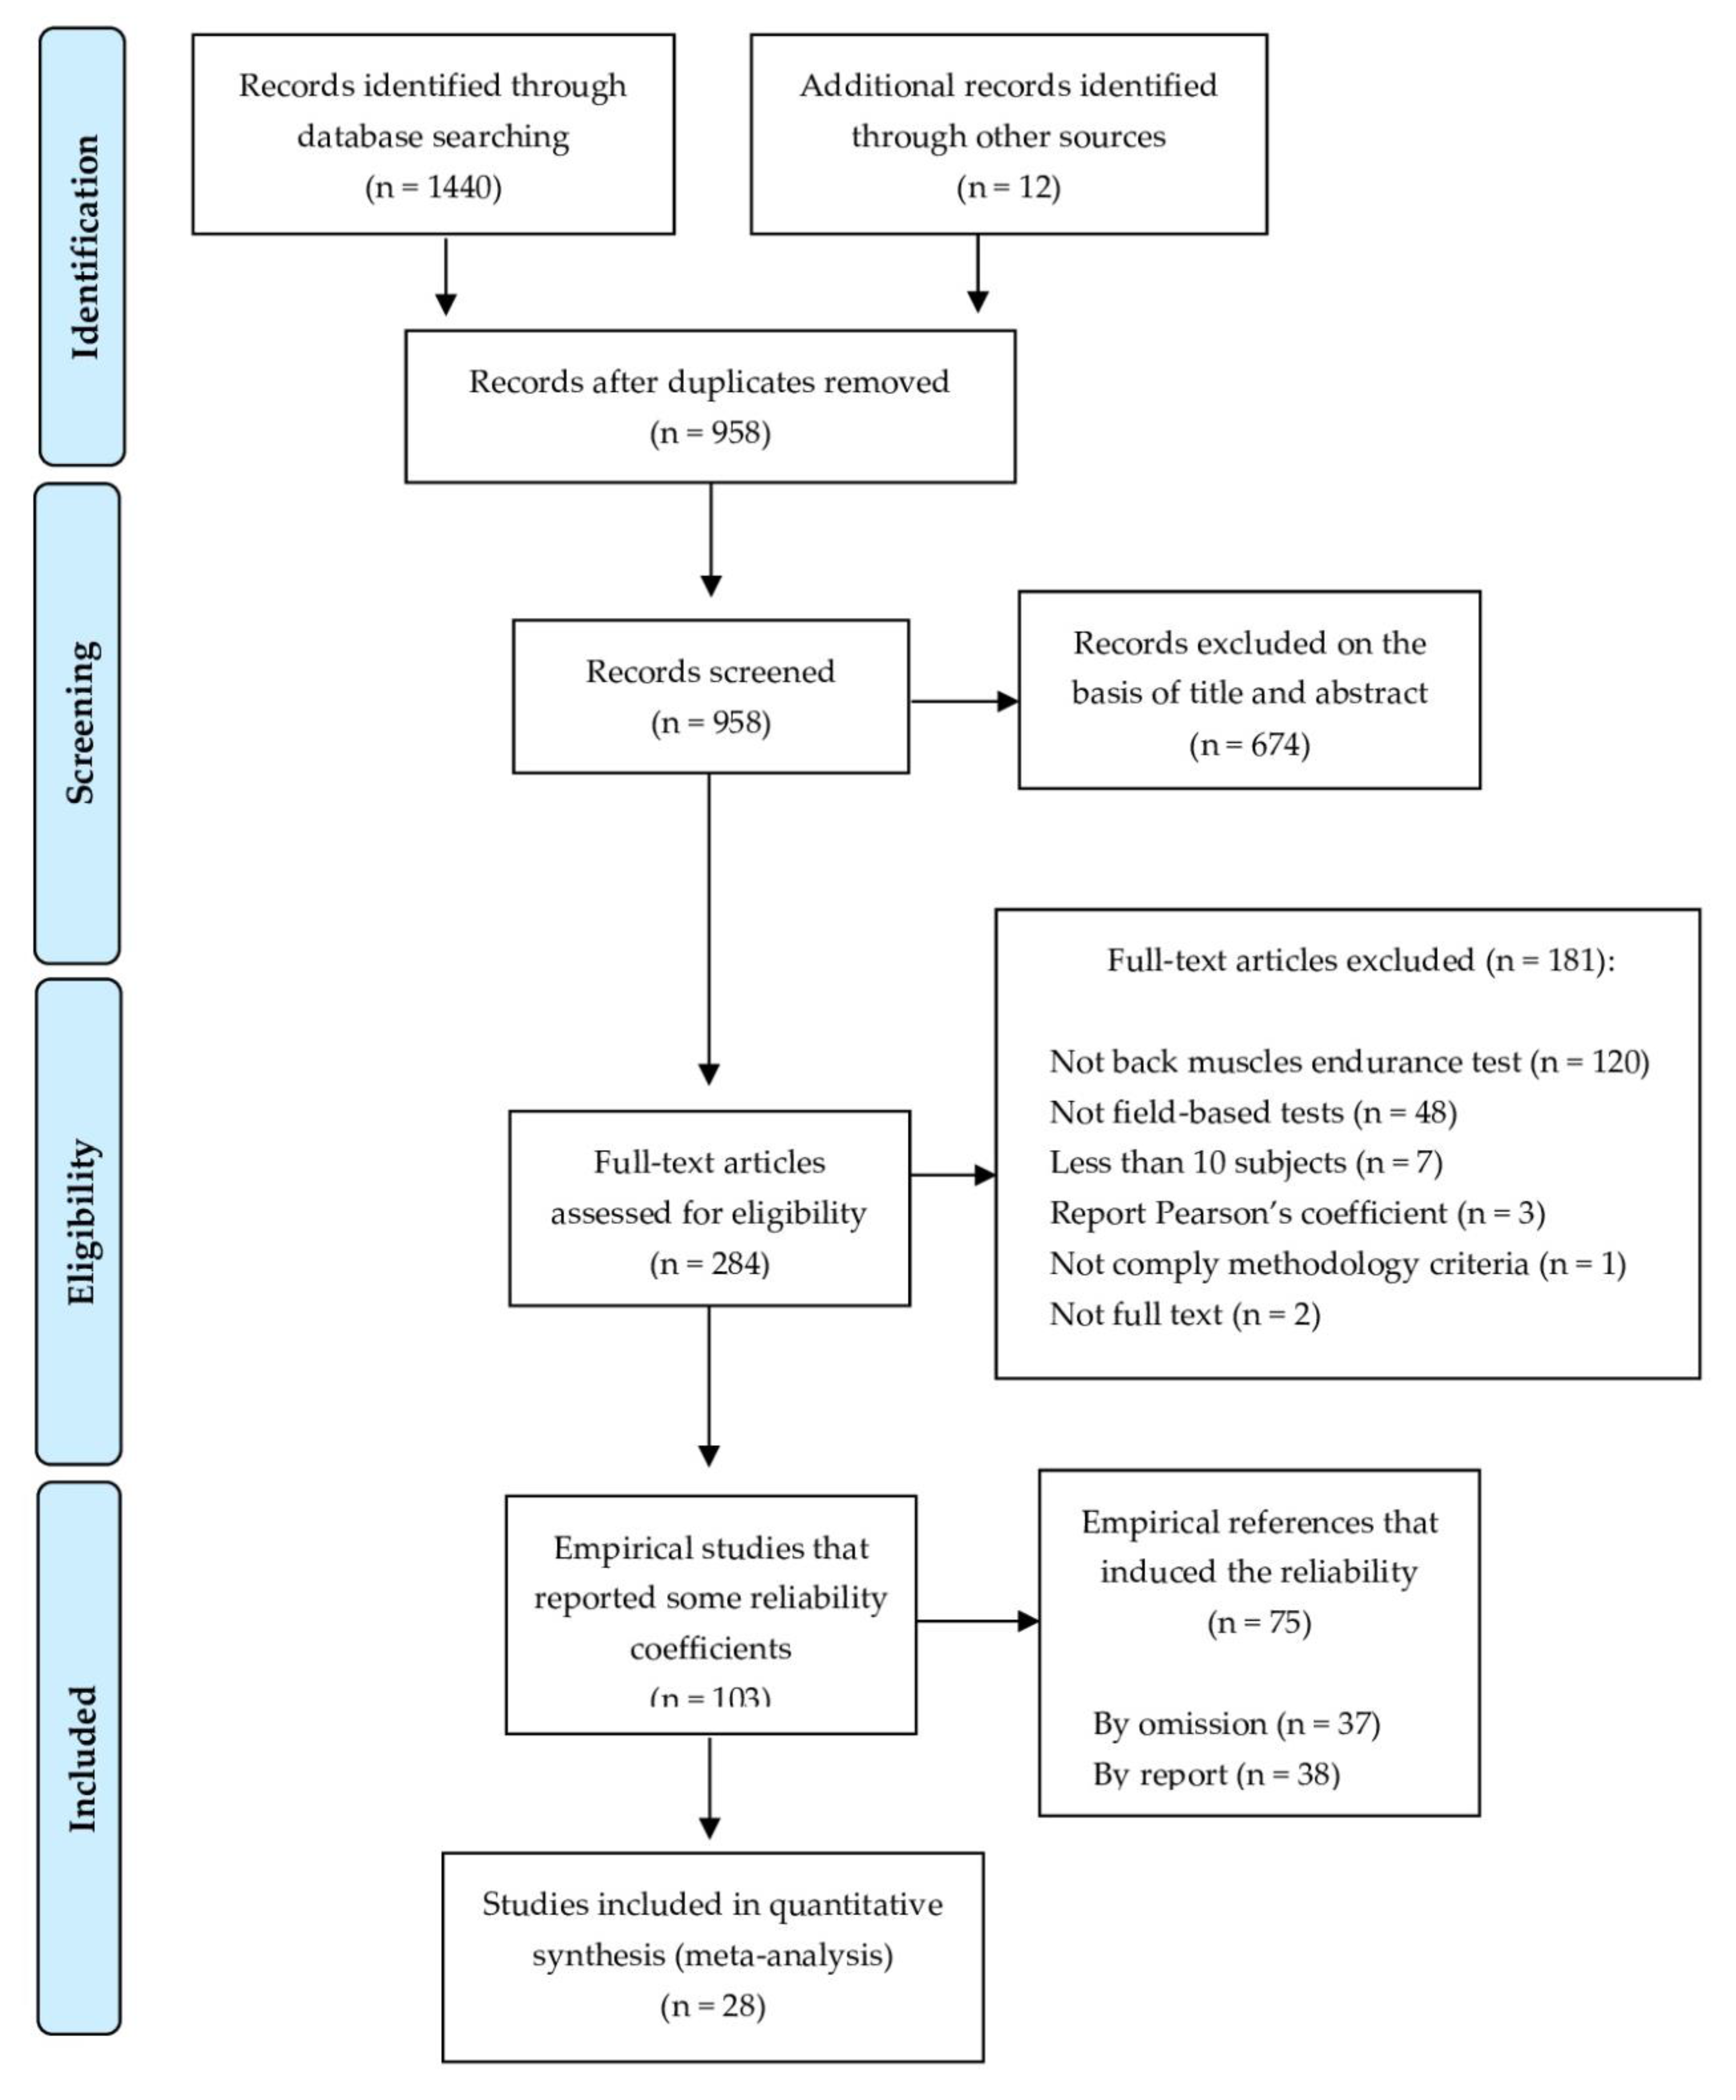
3.1. Study Selection
3.2. Descriptive Characteristics of the Selected Studies for the RG Meta-Analysis
3.3. Quality of the Selected Studies for the RG Meta-Analysis
3.4. Effect Sizes
3.4.1. Primary Outcomes
3.4.2. Analysis of the Moderator Variables
3.5. An Explanatory Model
3.6. Reliability Induction
4. Discussion
5. Limitations
6. Conclusions
Supplementary Materials
Author Contributions
Funding
Conflicts of Interest
References
- Abdelraouf, O.R.; Abdel-aziem, A.A. The relationship between core endurance and back dysfunction in collegiate male athletes with and without nonspecific low back pain. Int. J. Sports Phys. Ther. 2016, 11, 337–344. [Google Scholar] [PubMed]
- Biering-Sorensen, F. Physical Measurements as Risk Indicators of Low-Back trouble over one-year period. Spine (Phila Pa 1976) 1984, 9, 106–119. [Google Scholar] [CrossRef] [PubMed]
- Luoto, S.; Heliövaara, M.; Hurri, H.; Alaranta, H. Static back endurance low-back pain and the risk of low-back pain. Clin. Biomech. 1995, 10, 323–324. [Google Scholar] [CrossRef]
- McGill, S.M.; Childs, A.; Liebenson, C. Endurance times for low back stabilization exercises: Clinical targets for testing and training from a normal database. Arch. Phys. Med. Rehabil. 1999, 80, 941–944. [Google Scholar] [CrossRef]
- Hibbs, A.E.; Thompson, K.G.; French, D.; Wrigley, A.; Spears, I. Optimizing performance by improving core stability and strength. Sport Med. 2008, 38, 995–1008. [Google Scholar] [CrossRef] [PubMed]
- McGill, S.M. Ultimate Back Fitness and Performance, 4th ed.; Backfitpro Incorporated: Waterloo, ON, Canada, 2009. [Google Scholar]
- García-Vaquero, M.P.; Barbado, D.; Juan-Recio, C.; López-Valenciano, A.; Vera-Garcia, F.J. Isokinetic trunk flexion-extension protocol to assess trunk muscle strength and endurance: Reliability, learning effect, and sex differences. J. Sport Health Sci. 2016. [Google Scholar] [CrossRef] [Green Version]
- Gruther, W.; Wick, F.; Paul, B.; Leitner, C.; Posch, M.; Matzner, M.; Crevena, R.; Ebenbichler, G. Diagnostic accuracy and reliability of muscle strength and endurance measurements in patients with chronic low back pain. J. Rehabil. Med. 2009, 41, 613–619. [Google Scholar] [CrossRef] [Green Version]
- Mayer, T.; Gatchel, R.; Betancur, J.; Bovasso, E. Trunk Muscle Endurance Measurement. Isometric Contrasted to Isokinetic Testing in Normal Subjects. Spine (Phila Pa 1976) 1995, 20, 920–927. [Google Scholar] [CrossRef]
- Juan-Recio, C.; López-Plaza, D.; Barbado, D.; García-Vaquero, M.P.; Vera-García, F.J. Reliability assessment and correlation analysis of 3 protocols to measure trunk muscle strength and endurance muscle strength and endurance. J. Sports Sci. 2018, 36, 357–364. [Google Scholar] [CrossRef]
- Ito, T.; Shirado, O.; Suzuki, H.; Takahashi, M.; Kaneda, K.; Strax, T.E. Lumbar trunk muscle endurance testing: An inexpensive alternative to a machine for evaluation. Arch. Phys. Med. Rehabil. 1996, 77, 75–79. [Google Scholar] [CrossRef]
- McIntosh, G.; Wilson, L.; Affleck, M.; Hall, H. Trunk and lower extremity muscle endurance: Normative data. J. Rehabil. Outcomes Meas. 1998, 2, 20–39. [Google Scholar]
- Lanning, C.L.; Uhl, T.L.; Ingram, C.L.; Mattacola, C.G.; English, T.; Newsom, S. Baseline values of trunk endurance and hip strength in collegiate athletes. J. Athl. Train. 2006, 41, 427–434. [Google Scholar] [PubMed]
- Hopkins, W.G. Measures of Reliability in Sports Medicine and Science. Sports Med. 2000, 30, 375–381. [Google Scholar] [CrossRef]
- Riebe, D.; Ehrman, J.K.; Liguori, G.; Magal, M. ACSM’s Guidelines for Exercsie Testing and Prescription, 10th ed.; Wolters Kluwer: Philadelphia, PA, USA, 2018. [Google Scholar]
- Maier, T.; Gross, M.; Trösch, S.; Steiner, T.; Müller, B.; Bourban, P.; Schärer, C.; Hübner, K.; Wehrlin, J.; Tschopp, M. Manual Leistungsdiagnostik; BASPO: Magglingen, Switzerland, 2016.
- Plowman, S.A.; Meredith, M.D. FITNESSGRAM®/ACTIVITYGRAM®. Reference Guide, 4th ed.; The Cooper Institute: Dallas, TX, USA, 2013. [Google Scholar]
- Arab, M.A.; Salavati, M.; Ebrahimi, I.; Mousavi, M.E. Sensitivity, specificity and predictive value of the clinical trunk muscle endurance tests in low back pain. Clin. Rehabil. 2007, 21, 640–647. [Google Scholar] [CrossRef]
- Moreau, C.E.; Green, B.N.; Johnson, C.D.; Moreau, S.R. Isometric back extension endurance tests: A review of the literature. J. Manip. Physiol. Ther. 2001, 24, 110–122. [Google Scholar] [CrossRef] [Green Version]
- Atkinson, G.; Nevill, A. Statistical Methods for Assessing Measurement Error (Reliability) in Variables Relevant to Sports Medicine. Sports Med. 1998, 26, 217–238. [Google Scholar] [CrossRef]
- Kottner, J.; Audigé, L.; Brorson, S.; Donner, A.; Gajewski, B.J.; Hróbjartsson, A.; Roberts, C.; Shoukri, M.; Streiner, D.L. Guidelines for reporting reliability and agreement studies (GRRAS) were proposed. J. Clin. Epidemiol. 2011, 64, 96–106. [Google Scholar] [CrossRef]
- Hayen, A.; Dennis, R.J.; Finch, C.F. Determining the intra- and inter-observer reliability of screening tools used in sports injury research. J. Sci. Med. Sports 2007, 10, 201–210. [Google Scholar] [CrossRef] [Green Version]
- Latimer, J.; Maher, C.G.; Refshauge, K.; Colaco, I. The reliability and validity of the Biering-Sorensen test in asymptomatic subjects and subjects reporting current or previous nonspecific low back pain. Spine (Phila Pa 1976) 1999, 24, 2085–2089. [Google Scholar] [CrossRef]
- Larsson, H.; Tegern, M.; Monnier, A.; Skoglund, J.; Helander, C.; Persson, E.; Malm, C.; Broman, L.; Aasa, U. Content Validity Index and Intra- and Inter-Rater Reliability of a New Muscle Strength/Endurance Test Battery for Swedish Soldiers. PLoS ONE 2015, 10, e0132185. [Google Scholar] [CrossRef] [Green Version]
- Moffroid, M.; Haugh, L.; Haig, A.; Henry, S.; Pope, M. Endurance training of trunk extensor muscles. Phys. Ther. 1993, 73, 10–17. [Google Scholar] [CrossRef] [PubMed]
- Simmonds, M.J.; Olson, S.L.; Jones, S.; Hussein, T.; Lee, E.; Novy, D.; Radwan, H. Psychometric Characteristics and Clinical Usefulness of Physical Performance Tests in Patients with Low Back Pain. Spine (Phila Pa 1976) 1998, 23, 2412–2421. [Google Scholar] [CrossRef] [PubMed]
- Hannibal, N.S., III; Plowman, S.A.; Looney, M.A.; Brandenburg, J. Reliability and Validity of Low Back Strength/Muscular Endurance Field Tests in Adolescents. J. Phys. Act. Health 2006, 3 (Suppl. S2), 78–89. [Google Scholar] [CrossRef]
- Balthazard, P.; de Goumoens, P.; Rivier, G.; Demeulenaere, P.; Ballabeni, P.; Deriaz, O. Manual therapy followed by specific active exercises versus a placebo followed by specific active exercises on the improvement of functional disability in patients with chronic non specific low back pain: A randomized controlled trial. BMC Musculoskelet. Disord. 2012, 13, 162. [Google Scholar] [CrossRef]
- Coorevits, P.; Danneels, L.; Cambier, D.; Ramon, H.; Vanderstraeten, G. Assessment of the validity of the Biering-Sorensen test for measuring back muscle fatigue based on EMG median frequency characteristics of back and hip muscles. J. Electromyogr. Kinesiol. 2008, 18, 997–1005. [Google Scholar] [CrossRef]
- Kankaanpää, M.; Laaksonen, D.; Taimela, S.; Kokko, S.M.; Airaksinen, O.; Hänninen, O. Age, sex, and body mass index as determinants of back and hip extensor fatigue in the isometric Sorensen back endurance test. Arch. Phys. Med. Rehabil. 1998, 79, 1069–1075. [Google Scholar] [CrossRef]
- Evans, K.; Refshauge, K.; Adams, R. Trunk muscle endurance tests: Reliability, and gender differences in athletes. J. Sci. Med. Sports 2007, 10, 447–455. [Google Scholar] [CrossRef]
- Okada, T.; Huxel, K.C.; Nesser, T.W. Relationship between core stability, functional movement, and performance. J. Strength Cond. Res. 2011, 25, 252–261. [Google Scholar] [CrossRef]
- Vacha-Haase, T.; Kogan, L.R.; Thompson, B. Sample compositions and variabilities in published studies versus those in test manuals: Validity of score reliability inductions. Educ. Psychol. Meas. 2000, 60, 509–522. [Google Scholar] [CrossRef]
- Henson, R.K.; Thompson, B. Characterizing measurement error in scores across studies: Some recommendations for conducting ‘reliability generalization’ studies. Meas. Eval. Couns. Dev. 2002, 35, 113–126. [Google Scholar] [CrossRef]
- Rodriguez, M.C.; Maeda, Y. Meta-analysis of coefficient alpha. Psychol. Methods 2006, 11, 306–322. [Google Scholar] [CrossRef] [PubMed]
- Sánchez-Meca, J.; López-López, J.A.; López-Pina, J.A. Some recommended statistical analytic practices when reliability generalization studies are conducted. Br. J. Math. Stat. Psychol. 2013, 66, 402–425. [Google Scholar] [CrossRef] [PubMed]
- Moher, D.; Liberati, A.; Tetzlaff, J.; Altman, D.G. Preferred Reporting Items for Systematic Reviews and Meta-Analyses: The PRISMA Statement. Ann. Intern. Med. 2009, 151, 264–269. [Google Scholar] [CrossRef] [PubMed] [Green Version]
- Prinsen, C.A.C.; Mokkink, L.B.; Bouter, L.M.; Alonso, J.; Patrick, D.L.; de Vet, H.C.W.; Terwee, C.B. COSMIN guideline for systematic reviews of patient-reported outcome measures. Qual. Life Res. 2018, 27, 1147–1157. [Google Scholar] [CrossRef] [Green Version]
- Mokkink, L.B.; de Vet, H.C.W.; Prinsen, C.A.C.; Patrick, D.L.; Alonso, J.; Bouter, L.M.; Terwee, C.B. COSMIN Risk of Bias checklist for systematic reviews of Patient-Reported Outcome Measures. Qual. Life Res. 2018, 27, 1171–1179. [Google Scholar] [CrossRef] [Green Version]
- Terwee, C.B.; Prinsen, C.A.C.; Chiarotto, A.; Westerman, M.; Patrick, D.; Alonso, J.; Bouter, L.M.; de Vet, H.C.W.; Mokkink, L.B. COSMIN methodology for evaluating the content validity of patient-reported outcome measures: A Delphi study. Qual. Life Res. 2018, 27, 1159–1170. [Google Scholar] [CrossRef] [Green Version]
- Weir, J.P. Quantifying test-retest reliability using the intraclass correlation coefficient and the standard error of measurement. J. Strength Cond. Res. 2005, 19, 231–240. [Google Scholar] [CrossRef]
- Salminen, J.J.; Maki, P.; Oksanen, A.; Pentti, J. Spinal mobility and trunk muscle strength in 15-year-old schoolchildren with and without low-back pain. Spine (Phila Pa 1976) 1992, 17, 405–411. [Google Scholar] [CrossRef]
- Demoulin, C.; Sac, D.; Serre, L.; Maquet, D.; Crielaard, J.M.; Marc, V. Reproducibility and Suitability of Clinical Assessments of Trunk Flexor and Extensor Muscles. J. Musculoskelet. Pain 2008, 16, 298–308. [Google Scholar] [CrossRef]
- Sandrey, M.A.; Mitzel, J.G. Improvement in Dynamic Balance and Core Endurance after a 6-Week Core-Stability-Training Program in High School Track and Field Athletes. J. Sports Rehabil. 2013, 22, 264–271. [Google Scholar] [CrossRef]
- Terwee, C.B.C.; Mokkink, L.; Knol, D.; Ostelo, R.; Bouter, L.; de Vet, H. Rating the methodological quality in systematic reviews of studies on measurement properties: A scoring system for the COSMIN checklist. Qual. Life Res. 2012, 21, 651–657. [Google Scholar] [CrossRef] [PubMed] [Green Version]
- Orwin, R.; Vevea, J. Evaluating coding decisions. In The Handbook of Research Synthesis and Meta-Analysis, 2nd ed.; Cooper, H., Hedges, L.V., Valentine, J.C., Eds.; Russel Sage Foundation: New York, NY, USA, 2009; pp. 177–203. [Google Scholar]
- Borenstein, M.; Hedges, L.V.; Higgins, J.; Rothstein, H.R. Introduction to Meta-Analysis; John Wiley & Sons: Chichester, UK, 2009. [Google Scholar]
- Sánchez-Meca, J.; Marín-Martínez, F. Confidence Intervals for the Overall Effect Size in Random-Effects Meta-Analysis. Psychol. Methods 2008, 13, 31–48. [Google Scholar] [CrossRef] [PubMed] [Green Version]
- Huedo-Medina, T.B.; Sánchez-Meca, J.; Marín-Martínez, F.; Botella, J. Assessing heterogeneity in meta-analysis: Q statistic or I 2 Index? Psychol. Methods 2006, 11, 193–206. [Google Scholar] [CrossRef] [PubMed] [Green Version]
- Lopez-Lopez, J.A.; Botella, J.; Sanchez-Meca, J.; Marin-Martinez, F. Alternatives for Mixed-Effects Meta-Regression Models in the Reliability Generalization Approach: A Simulation Study. J. Educ. Behav. Stat. 2013, 38, 443–469. [Google Scholar] [CrossRef]
- López-López, J.A.; Marín-Martínez, F.; Sánchez-Meca, J.; Van den Noortgate, W.; Viechtbauer, W. Estimation of the predictive power of the model in mixed-effects meta-regression: A simulation study. Br. J. Math. Stat. Psychol. 2014, 67, 30–48. [Google Scholar] [CrossRef] [PubMed] [Green Version]
- Borenstein, M.; Hedges, L.V.; Higgins, J.; Rothstein, H.R. Comprehensive Meta-Analysis 3.3.; Biostat, Inc.: Englewood, NJ, USA, 2018. [Google Scholar]
- Dedering, A.; Roos Af Hjelmsäter, M.; Elfving, B.; Harms-Ringdahl, K.; Németh, G. Between-days reliability of subjective and objective assessments of back extensor muscle fatigue in subjects without lower-back pain. J. Electromyogr. Kinesiol. 2000, 10, 151–158. [Google Scholar] [CrossRef]
- Dedering, A.; Gnospelius, A.; Elfving, B. Reliability of Measurements of Endurance Time, Electromyographic Fatigue and Recovery, and Associations to Activity Limitations, in Patients with Lumbar Disc Herniation. Physiother. Res. Int. 2010, 15, 189–198. [Google Scholar] [CrossRef]
- del Pozo-Cruz, B.; Mocholi, M.; del Pozo-Cruz, J.; Parraca, J.; Adsuar, J.; Gusi, N. Reliability and validity of lumbar and abdominal trunk muscle endurance tests in office workers with nonspecific subacute low back pain. J. Back Musculoskelet. Rehabil. 2014, 27, 399–408. [Google Scholar] [CrossRef]
- Demoulin, C.; Boyer, M.; Duchateau, J.; Grosdent, S.; Jidovsteff, B.; Crielaard, J.M.; Vanderthommen, M. Is the Sørensen test valid to assess muscle fatigue of the trunk extensor muscles? J. Back Musculoskelet. Rehabil. 2016, 29, 31–40. [Google Scholar] [CrossRef]
- Geldhof, E.; Cardon, G.; De Bourdeaudhuij, I.; Danneels, L.; Coorevits, P.; Vanderstraeten, G.; de Clercq, D. Effects of back posture education on elementary schoolchildren’s back function. Eur. Spine J. 2007, 16, 829–839. [Google Scholar] [CrossRef] [Green Version]
- Javadian, Y.; Behtash, H.; Akbari, M.; Taghipour-darzi, M.; Zekavat, H. The effects of stabilizing exercises on pain and disability of patients with lumbar segmental instability. J. Back Musculoskelet. Rehabil. 2012, 25, 149–155. [Google Scholar] [CrossRef] [PubMed] [Green Version]
- Jorgensen, K.; Nicolaisen, T. Two methods for determining trunk extensor endurance. A comparative study. Eur. J. Appl. Physiol. Occup. Physiol. 1986, 55, 639–644. [Google Scholar] [CrossRef] [PubMed]
- Juan-Recio, C.; Barbado, D.; López-Valenciano, A.; Vera-García, F.J. Test de campo para valorar la resistencia de los músculos del tronco. Apunt. Educ. Fis. Deport. 2014, 3, 59–68. [Google Scholar] [CrossRef] [Green Version]
- Keller, A.; Hellesnes, J.; Brox, J.I.I. Reliability of the isokinetic trunk extensor test, Biering-Sorensen test, and Astrand bicycle test: Assessment of intraclass correlation coefficient and critical difference in patients with chronic low back pain and healthy individuals. Spine (Phila Pa 1976) 2001, 26, 771–777. [Google Scholar] [CrossRef]
- Lin, K.-H.; Huang, Y.-M.; Tang, W.; Chang, Y.; Liu, Y.; Liu, C. Correlation of static and dynamic trunk muscle endurance and bat swing velocity in high school aged baseball players. Isokinet. Exerc. Sci. 2013, 21, 113–119. [Google Scholar] [CrossRef]
- Mannion, A.F.; Connolly, B.; Wood, K.; Dolan, P. The use of surface EMG power spectral analysis in the evaluation of back muscle function. J. Rehabil. Res. Dev. 1997, 34, 427–439. [Google Scholar]
- Moffroid, M.; Reid, S.; Henry, S.; Haugh, L.; Ricamato, A. Some Endurance Measures in Persons With Chronic Low Back Pain. J. Orthop. Sports Phys. Ther. 1994, 20, 81–87. [Google Scholar] [CrossRef]
- Ozcan Kahraman, B.; Sengul, Y.; Kahraman, T.; Kalemci, O. Developing a Reliable Core Stability Assessment Battery for Patients With Nonspecific Low Back Pain. Spine (Phila Pa 1976) 2016, 41, E844–E850. [Google Scholar] [CrossRef] [Green Version]
- Palacin-Marin, F.; Esteban-Moreno, B.; Olea, N.; Herrera-Viedma, E.; Arroyo-Morales, M. Agreement between telerehabilitation and face-to-face clinical outcome assessments for low back pain in primary care. Spine (Phila Pa 1976) 2013, 38, 947–952. [Google Scholar] [CrossRef]
- de Souza, C.P.; Monteiro-Junior, R.S.; da Silva, E.B. Reliability of the endurance test for the erector spinae muscle. Fisioter. Mov. 2016, 29, 369–375. [Google Scholar] [CrossRef]
- Teyhen, D.S.; Shaffer, S.W.; Lorenson, C.L.; Wood, S.L.; Rogers, S.M.; Dugan, J.L.; Walker, M.J.; Childs, J.D. Reliability of lower quarter physical performance measures in healthy service members. US Army Med. Dep. J. 2011, 2, 37–49. [Google Scholar]
- Waldhelm, A.; Li, L. Endurance tests are the most reliable core stability related measurements. J. Sports Health Sci. 2012, 1, 121–128. [Google Scholar] [CrossRef] [Green Version]
- Denteneer, L.; Van Daele, U.; Truijen, S.; De Hertogh, W.; Meirte, J.; Stassijns, G. Reliability of physical functioning tests in patients with low back pain: A systematic review. Spine J. 2018, 18, 190–207. [Google Scholar] [CrossRef] [PubMed]
- Denteneer, L.; Stassijns, G.; De Hertogh, W.; Truijen, S.; Van Daele, U. Inter- and Intrarater Reliability of Clinical Tests Associated With Functional Lumbar Segmental Instability and Motor Control Impairment in Patients With Low Back Pain: A Systematic Review. Arch. Phys. Med. Rehabil. 2017, 98, 151–164.e6. [Google Scholar] [CrossRef] [PubMed]
- Nunnally, J.C.; Bernstein, I.H. The Assessment of Reliability. Psychom. Theory 1994, 3, 248–292. [Google Scholar]
- Sanchez-Meca, J.; Rubio-Aparicio, M.; Marin-Martinez, F.; Lopez-Pina, J.A. The phenomenon of reliability induction in social and health sciences. In Fifteenth Congress of Methodology of Behavioral Science; Spanish Association of Behavioral Sciences Methodology: Palma de Mallorca, Spain, 2015. [Google Scholar]
- Sánchez-Meca, J.; López-Pina, J.A.; López-López, J.A. Generalización de la fiabilidad: Un enfoque meta-analítico aplicado a la fiabilidad. Fisioterapia 2009, 31, 262–270. [Google Scholar] [CrossRef]


| Reliability | Pooled Result a | Overall Rating b | Quality of Evidence c |
|---|---|---|---|
| Biering-Sorensen Test | |||
| Inter-tester reliability | ICC = 094 (0.84–0.98) Consistent results Sample size = 215 | Sufficient | Moderate (as there are multiple doubtful [18,23,27] and two very good studies [64,69]) |
| Intra-tester (intra-session) reliability | ICC = 0.88 (0.83–0.92) Consistent results Sample size = 258 | Sufficient | Low (as all studies are doubtful [18,25,27,44,70]) |
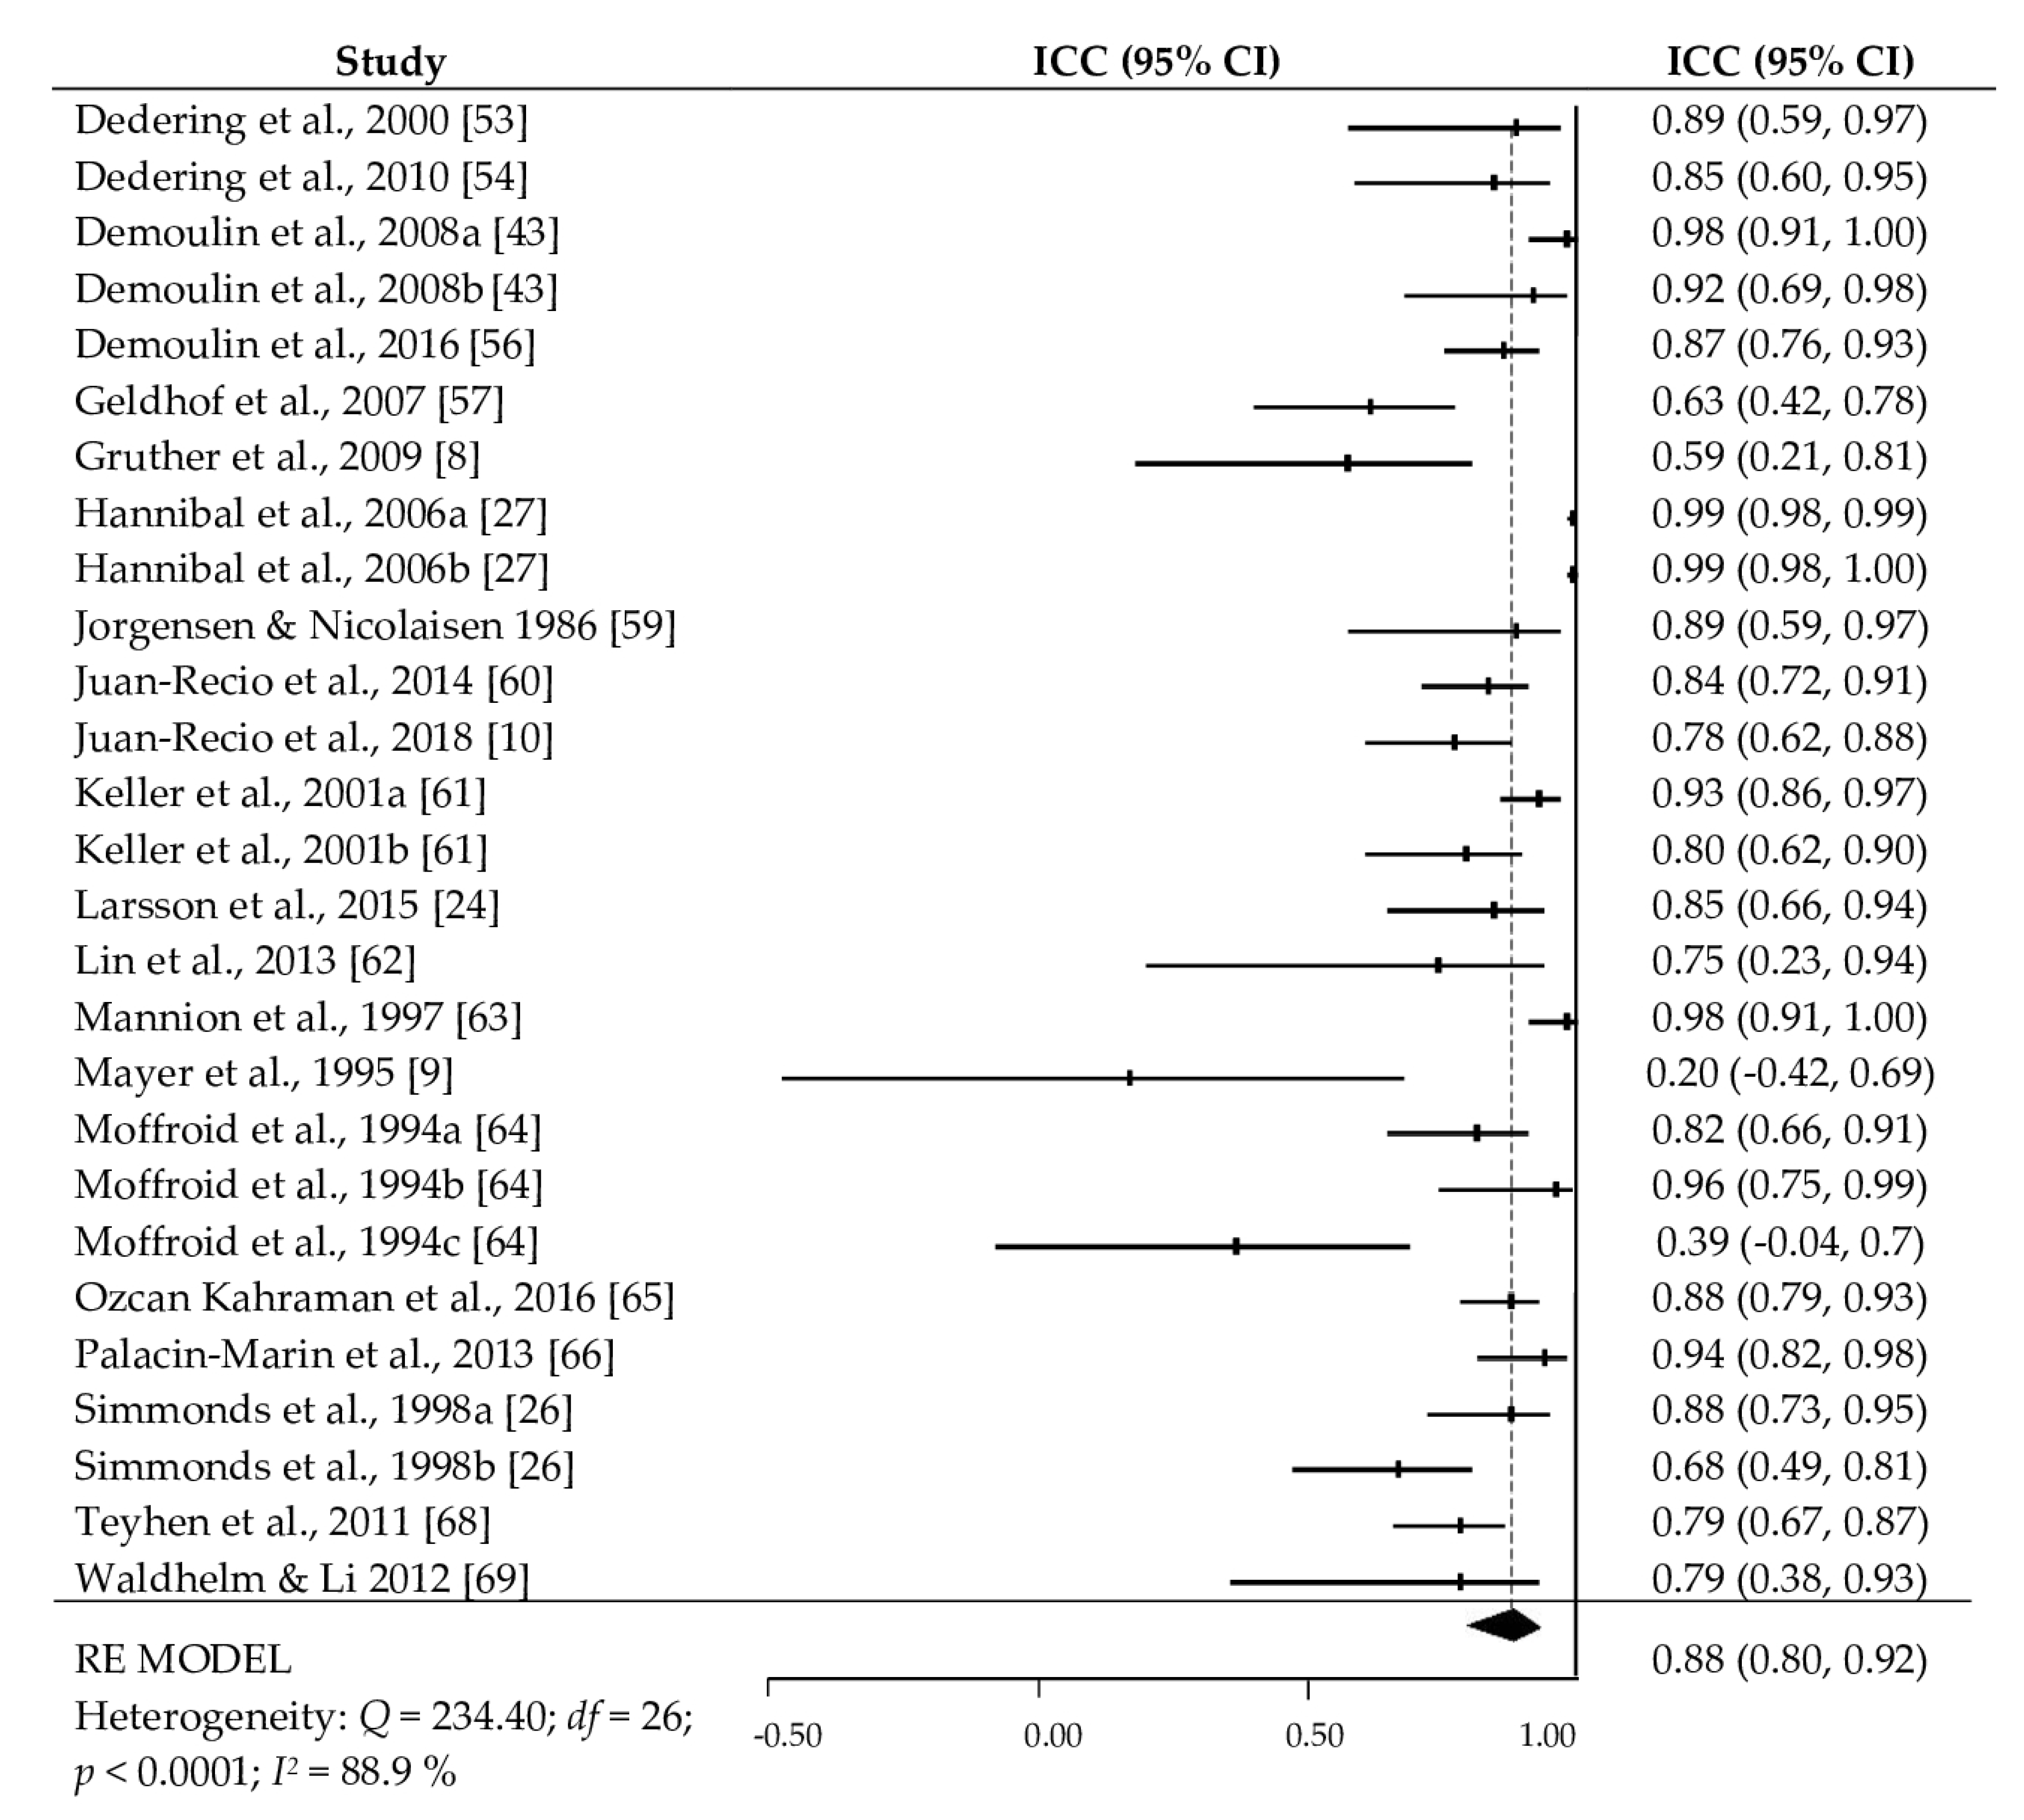
| Intra-tester (inter-session) reliability | ICC = 0.88 (0.80–0.92) Consistent results Sample size = 688 | Sufficient | Moderate (as there are multiple doubtful and five very good studies [8,10,61,63,69]) |
| Prone Isometric Chest Raise Test | |||
| Inter-tester reliability | ICC = 0.90 (0.80–0.95) Sample size = 30 | Indeterminate | Did not pool the results or grade the evidence due to there being one study available [18] |
| Intra-tester (intra-session) reliability | ICC = 0.90 (0.83–0.94) Sample size = 30 | Indeterminate | Did not pool the results or grade the evidence due to there being one study available [18] |
| Intra-tester (inter-session) reliability | ICC = 0.95 (0.91–0.97) Consistent results Sample size = 236 | Sufficient | Low (as all studies are doubtful [11,56,60]) |
| Prone Double Straight-Leg Test | |||
| Inter-tester reliability | ICC = 0.83 (0.67–0.93) Sample size = 30 | Indeterminate | Did not pool the results or grade the evidence due to there being one study available [18] |
| Intra-tester (intra-session) reliability | ICC = 0.86 (0.77–0.92) Sample size = 30 | Indeterminate | Did not pool the results or grade the evidence due to there being one study available [18] |
| Dynamic Extensor Endurance Test | |||
| Intra-tester (inter-session) reliability | ICC = 0.99 (0.88–1.00) Consistent results Sample size: 82 | Sufficient | Low (as there is one inadequate study [65]) |
| k | ICC+ | ICCL | ICCU | Q | df | p | I2 | |
|---|---|---|---|---|---|---|---|---|
| Biering-Sorensen Test: | ||||||||
| Inter-tester reliability | 8 | 0.94 | 0.84 | 0.98 | 102.37 | 7 | <0.001 | 93.1% |
| Intra-tester and intra-session reliability | 12 | 0.88 | 0.83 | 0.92 | 22.69 | 11 | 0.02 | 51.2% |
| Intra-tester and inter-session reliability | 27 | 0.88 | 0.80 | 0.92 | 234.40 | 26 | <0.001 | 88.9% |
| Prone Isometric Chest Raise test: | ||||||||
| Inter-tester reliability | 1 | 0.90 | 0.80 | 0.95 | -- | -- | -- | -- |
| Intra-tester and intra-session reliability | 2 | 0.90 | 0.83 | 0.94 | 0.034 | 1 | 0.853 | 0% |
| Intra-tester and inter-session reliability | 5 | 0.95 | 0.91 | 0.97 | 13.57 | 4 | 0.009 | 70.5% |
| Prone Double Straight-Leg Test: | ||||||||
| Inter-tester reliability | 1 | 0.83 | 0.67 | 0.92 | -- | -- | -- | -- |
| Intra-tester and intra-session reliability | 2 | 0.86 | 0.77 | 0.92 | 0.08 | 9 | 0.777 | 0% |
| Dynamic Extensor Endurance Test: | ||||||||
| Intra-tester and inter-session reliability | 5 | 0.99 | 0.88 | 1.00 | 15.73 | 4 | 0.003 | 74.5% |
| Moderator Variable | k | bj | QR | p | QE | R2 |
|---|---|---|---|---|---|---|
| Publication year | 27 | 0.003 | 0.03 | 0.855 | 232.21 * | 0 |
| Final sample size | 27 | −0.003 | 0.11 | 0.741 | 230.26 * | 0 |
| Sex (% female) | 24 | 0.002 | 0.37 | 0.542 | 200.78 * | 0 |
| Mean age (years) | 26 | −0.017 | 1.62 | 0.203 | 210.81 * | 0.01 |
| SD age | 19 | −0.009 | 0.31 | 0.578 | 177.94 * | 0 |
| % attrition | 27 | −0.008 | 1.39 | 0.238 | 227.47 * | 0 |
| Number of measurements | 27 | −0.034 | 0.01 | 0.933 | 232.93 * | 0 |
| Time interval between measurement | 26 | −0.006 | 0.18 | 0.668 | 229.87 * | 0 |
| Mean test score from total sample | 26 | 0.002 | 0.98 | 0.321 | 210.60 * | 0 |
| SD test score from total sample | 21 | 0.009 | 0.94 | 0.331 | 201.42 * | 0.02 |
| Mean test score from reliability sample | 24 | 0.001 | 0.42 | 0.514 | 207.27 * | 0 |
| SD test score from reliability sample | 20 | 0.012 | 1.54 | 0.214 | 180.06 * | 0.10 |
| Moderator Variables | k | ICC+ | 95% CI | ANOVA Results | |
|---|---|---|---|---|---|
| ICCL | ICCU | ||||
| Reliability analysis was done with the same sample: | QB (1) = 0.92, p = 0.338; R2 = 0.01 QW (25) = 217.83, p < 0.0001 | ||||
| Yes | 24 | 0.88 | 0.81 | 0.92 | |
| No | 3 | 0.77 | 0.26 | 0.94 | |
| Sex: | 9 | QB (2) = 5.98, p = 0.050; R2 = 0.27 QW (23) = 156.41, p < 0.0001 | |||
| Males | 2 | 0.88 | 0.77 | 0.94 | |
| Females | 15 | 0.97 | 0.89 | 0.99 | |
| Males and females | 0.83 | 0.72 | 0.89 | ||
| Sample type: | QB (1) = 3.73, p = 0.053; R2 = 0.18 QW (25) = 185.35, p < 0.0001 | ||||
| Children and adolescents | 4 | 0.95 | 0.86 | 0.98 | |
| Adults | 23 | 0.85 | 0.77 | 0.90 | |
| Target population: | QB (1) = 0.24, p = 0.625; R2 = 0 QW (25) = 231.60, p < 0.0001 | ||||
| Asymptomatic | 18 | 0.88 | 0.80 | 0.93 | |
| Clinical | 9 | 0.85 | 0.69 | 0.93 | |
| Physical activity level: | QB (1) = 0.78, p = 0.332; R2 = 0.03 QW (25) = 214.29, p < 0.0001 | ||||
| Sedentary | 12 | 0.84 | 0.71 | 0.92 | |
| Recreationally active | 15 | 0.89 | 0.81 | 0.94 | |
| Validated modification: | QB (1) = 0.24, p = 0.626; R2 = 0 QW (25) = 222.31, p < 0.0001 | ||||
| Yes | 17 | 0.86 | 0.76 | 0.92 | |
| No | 10 | 0.89 | 0.78 | 0.95 | |
| Tool: | QB (1) = 4.03, p = 0.045; R2 = 0.32 QW (25) = 158.11, p < 0.0001 | ||||
| Test bench | 22 | 0.85 | 0.77 | 0.90 | |
| Roman chair | 5 | 0.94 | 0.86 | 0.98 | |
| Hands position: | QB (2) = 0.37, p = 0.828; R2 = 0 QW (24) = 217.66, p < 0.0001 | ||||
| Crossed on the chest | 22 | 0.88 | 0.80 | 0.93 | |
| Along the body | 3 | 0.87 | 0.55 | 0.97 | |
| At the level of the ears | 2 | 0.80 | 0.23 | 0.96 | |
| Part of the body on the edge: | QB (3) = 1.26, p = 0.738 4; R2 = 0 QW (23) = 212.02, p < 0.0001 | ||||
| Not reported | 12 | 0.90 | 0.80 | 0.95 | |
| ASIS | 6 | 0.88 | 0.68 | 0.95 | |
| Upper border of the iliac crest | 6 | 0.85 | 0.62 | 0.95 | |
| Pubis | 3 | 0.77 | 0.28 | 0.94 | |
| Test duration: | QB (1) = 1.24, p = 0.264; R2 = 0.01 QW (25) = 212.46, p < 0.0001 | ||||
| Until exhaustion | 25 | 0.88 | 0.82 | 0.93 | |
| Until 240 s | 2 | 0.72 | 0.08 | 0.94 | |
| Position control instruments: | QB (4) = 34.49, p < 0.0001; R2 = 0.69 QW (22) = 72.29, p < 0.0001 | ||||
| Visual | 14 | 0.81 | 0.73 | 0.87 | |
| Inclinometer | 5 | 0.83 | 0.67 | 0.91 | |
| Stadiometer | 4 | 0.89 | 0.78 | 0.95 | |
| Light sensor | 2 | 0.87 | 0.59 | 0.96 | |
| Plumb-line | 2 | 0.99 | 0.98 | 0.99 | |
| Familiarization session: | QB (1) = 12.09, p = 0.0005; R2 = 0.34 QW (25) = 151.63, p < 0.0001 | ||||
| Yes | 6 | 0.96 | 0.92 | 0.98 | |
| No | 20 | 0.82 | 0.73 | 0.88 | |
| Test conditions: | QB (1) = 0.27, p = 0.605; R2 = 0 QW (25) = 222.08, p < 0.0001 | ||||
| Similar conditions | 18 | 0.88 | 0.80 | 0.93 | |
| Unclear conditions | 9 | 0.85 | 0.68 | 0.93 | |
| The profession of tester: | QB (2) = 1.88, p = 0.389; R2 = 0.02 QW (23) = 205.35, p < 0.0001 | ||||
| Sports sciences | 6 | 0.92 | 0.80 | 0.97 | |
| Physical therapy | 17 | 0.86 | 0.76 | 0.92 | |
| Medicine | 3 | 0.77 | 0.30 | 0.94 | |
| Continent: | QB (1) = 0.0004, p = 0.984; R2 = 0 QW (24) = 226.96, p < 0.0001 | ||||
| Europe | 16 | 0.88 | 0.78 | 0.93 | |
| America | 10 | 0.88 | 0.74 | 0.94 | |
| Study objective: | QB (1) = 0.02, p = 0.877; R2 = 0 QW (25) = 231.27, p < 0.0001 | ||||
| Psychometric | 20 | 0.88 | 0.79 | 0.93 | |
| Not psychometric | 7 | 0.86 | 0.67 | 0.95 | |
| Conflict of interest: | QB (1) = 0.02, p = 0.896; R2 = 0 QW (25) = 232.67, p < 0.0001 | ||||
| No conflict | 8 | 0.87 | 0.71 | 0.94 | |
| Not reported | 19 | 0.88 | 0.79 | 0.93 | |
| COSMIN Risk of Bias check-list: | QB (3) = 0.81, p = 0.848; R2 = 0 QW (23) = 223.47, p < 0.0001 | ||||
| Very good | 6 | 0.85 | 0.62 | 0.94 | |
| Adequate | 2 | 0.80 | 0.22 | 0.96 | |
| Doubtful | 17 | 0.85 | 0.79 | 0.93 | |
| Inadequate | 2 | 0.92 | 0.56 | 0.99 | |
| Source | bj | SE | Z | p |
|---|---|---|---|---|
| Intercept | 1.09 | 0.11 | 9.89 | <0.001 |
| Sample type | 0.65 | 0.27 | 2.39 | 0.017 |
| Familiarization session | 0.68 | 0.24 | 2.88 | 0.004 |
| Full model: | QR (2) = 20.57, R2 = 0.51 QE (24) = 113.67, p < 0.001 | |||
© 2020 by the authors. Licensee MDPI, Basel, Switzerland. This article is an open access article distributed under the terms and conditions of the Creative Commons Attribution (CC BY) license (http://creativecommons.org/licenses/by/4.0/).
Share and Cite
Martínez-Romero, M.T.; Ayala, F.; De Ste Croix, M.; Vera-Garcia, F.J.; Sainz de Baranda, P.; Santonja-Medina, F.; Sánchez-Meca, J. A Meta-Analysis of the Reliability of Four Field-Based Trunk Extension Endurance Tests. Int. J. Environ. Res. Public Health 2020, 17, 3088. https://0-doi-org.brum.beds.ac.uk/10.3390/ijerph17093088
Martínez-Romero MT, Ayala F, De Ste Croix M, Vera-Garcia FJ, Sainz de Baranda P, Santonja-Medina F, Sánchez-Meca J. A Meta-Analysis of the Reliability of Four Field-Based Trunk Extension Endurance Tests. International Journal of Environmental Research and Public Health. 2020; 17(9):3088. https://0-doi-org.brum.beds.ac.uk/10.3390/ijerph17093088
Chicago/Turabian StyleMartínez-Romero, María Teresa, Francisco Ayala, Mark De Ste Croix, Francisco J. Vera-Garcia, Pilar Sainz de Baranda, Fernando Santonja-Medina, and Julio Sánchez-Meca. 2020. "A Meta-Analysis of the Reliability of Four Field-Based Trunk Extension Endurance Tests" International Journal of Environmental Research and Public Health 17, no. 9: 3088. https://0-doi-org.brum.beds.ac.uk/10.3390/ijerph17093088