A Multilevel Model Approach for Investigating Individual Accident Characteristics and Neighborhood Environment Characteristics Affecting Pedestrian-Vehicle Crashes


Abstract
:1. Introduction
2. Literature Review
2.1. Individual Characteristics of Pedestrian-Vehicle Crashes
2.2. Neighborhood Environmental Characteristics of Pedestrian-Vehicle Crashes
3. Data and Model
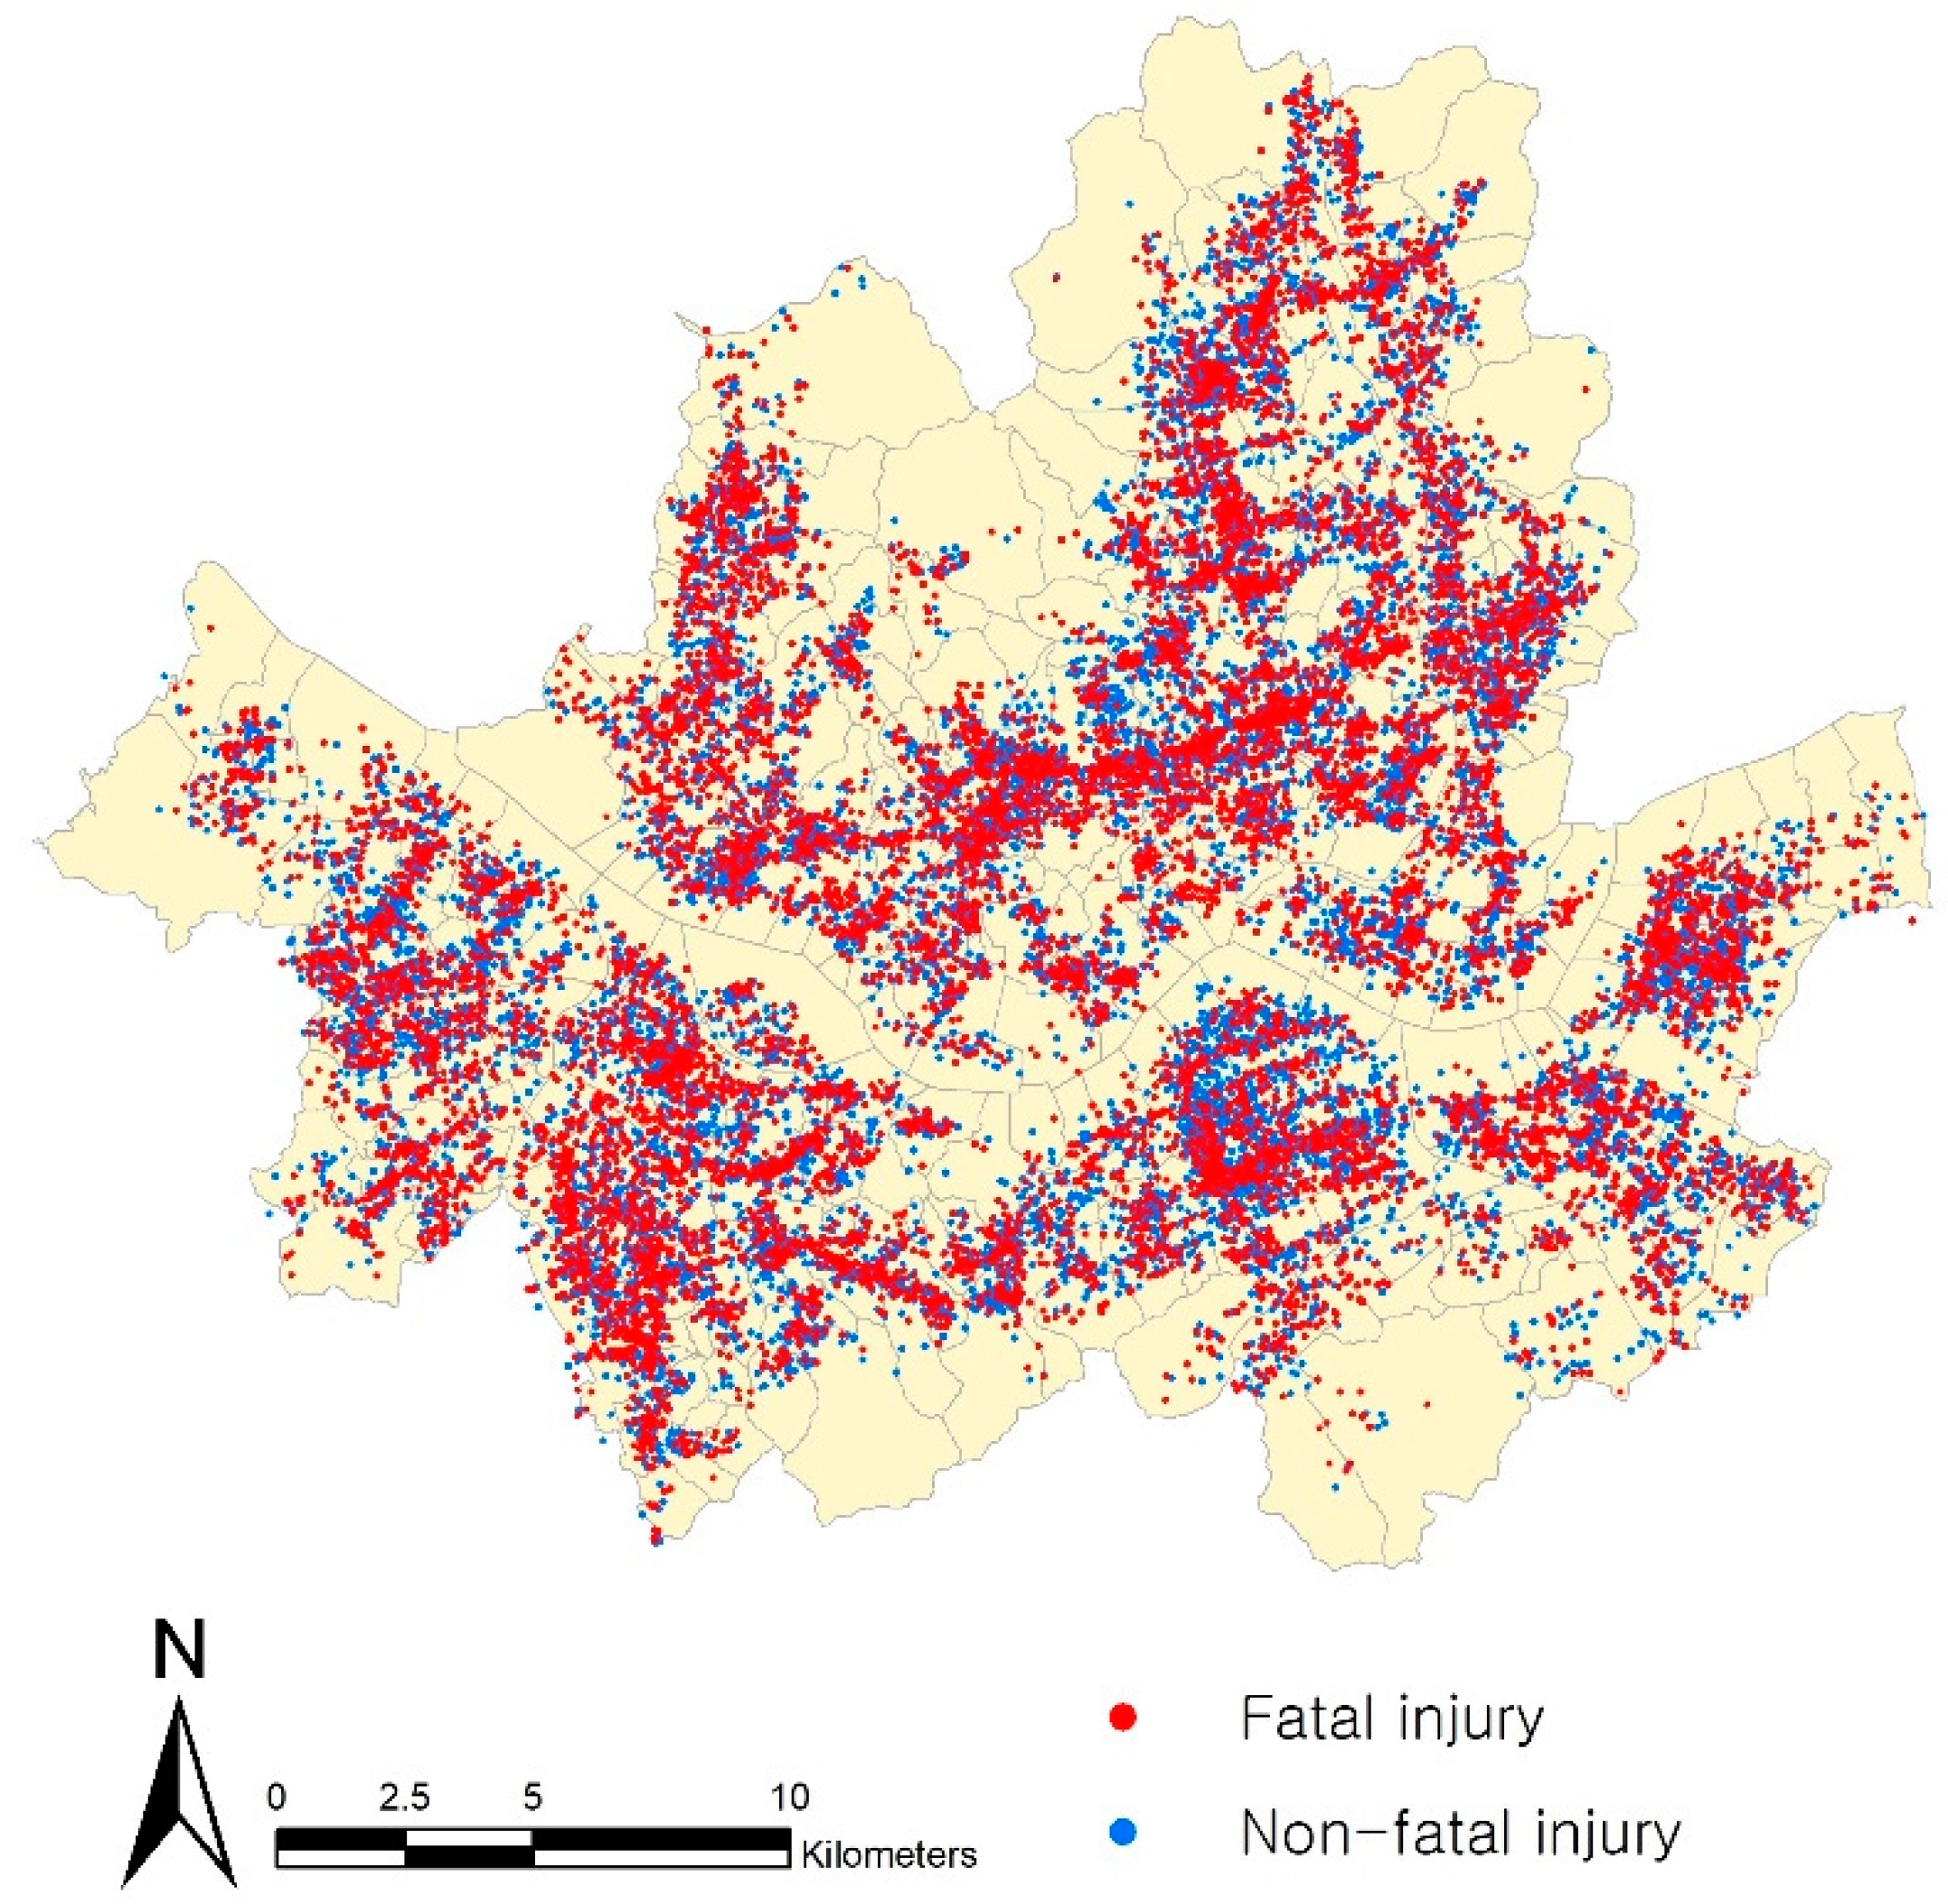
3.1. Data
3.2. Estimated Stage of Multilevel Binomial Logistic Model
4. Results and Discussion
4.1. Results of Descriptive Statistic Analysis
4.2. Discussion of Findings
5. Conclusions
Author Contributions
Funding
Conflicts of Interest
References
- Park, S.H.; Ko, D.W. Investigating the effects of the built environment on PM2. 5 and PM10: A case study of Seoul Metropolitan city, South Korea. Sustainability 2018, 10, 4552. [Google Scholar] [CrossRef] [Green Version]
- Baker, E.; Lester, L. Multiple housing problems: A view through the housing niche lens. Cities 2017, 62, 146–151. [Google Scholar] [CrossRef] [Green Version]
- Al-Hafith, O.; Satish, B.K.; Bradbury, S.; de Wilde, P. A systematic assessment of architectural approaches for solving the housing problem in Iraq. Front. Archit. Res. 2018, 7, 561–572. [Google Scholar] [CrossRef]
- De Paris, S.R.; Lopes, C.N.L. Housing flexibility problem: Review of recent limitations and solutions. Front. Archit. Res. 2018, 7, 80–91. [Google Scholar] [CrossRef]
- Park, C.; Lee, S. An Analysis of the Characteristics of Street Environment Affecting Pedestrian Accidents. J. Urban Des. Inst. Korea 2016, 17, 105–121. (In Korean) [Google Scholar]
- Yao, S.; Loo, B.P.; Lam, W.W. Measures of activity–based pedestrian exposure to the risk of vehicle–pedestrian collisions: Space–time path vs. potential path tree methods. Accid. Anal. Prev. 2015, 75, 320–332. [Google Scholar] [CrossRef]
- Yang, J. Review of injury biomechanics in car–pedestrian collisions. Int. J. Veh. Saf. 2005, 1, 100–117. [Google Scholar] [CrossRef]
- Yang, J.; Otte, D. A comparison study on vehicle traffic accident and injuries of vulnerable road users in China and Germany. In Proceedings of the 20th International Technical conference on the Enhanced Safety of Vehicles, Lyon, France, 18–21 June 2017; pp. 7–417. [Google Scholar]
- Chen, G. Road traffic safety in African countries–status, trend, contributing factors, countermeasures and challenges. Int. J. Inj. Cont. Saf. Promot. 2010, 17, 247–255. [Google Scholar] [CrossRef]
- Choi, J.; Tay, R.; Kim, S.; Jeong, S. Behaviors of older pedestrians at crosswalks in South Korea. Accid. Anal. Prev. 2019, 127, 231–235. [Google Scholar] [CrossRef]
- Choi, Y.; Yoon, H.; Jung, E. Do Silver Zones reduce auto–related elderly pedestrian collisions? Based on a case in Seoul, South Korea. Accid. Anal. Prev. 2018, 119, 104–113. [Google Scholar] [CrossRef] [PubMed]
- Chung, Y.; Chang, I. How accurate is accident data in road safety research? An application of vehicle black box data regarding pedestrian–to–taxi accidents in Korea. Accid. Anal. Prev. 2015, 84, 1–8. [Google Scholar] [CrossRef] [PubMed]
- Lee, W.K.; Lee, H.A.; Hwang, S.; Kim, H.; Lim, Y.-H.; Hong, Y.-C.; Ha, E.-H.; Park, H. A time series study on the effects of cold temperature on road traffic injuries in Seoul, Korea. Environ. Res. 2014, 132, 290–296. [Google Scholar] [CrossRef] [PubMed]
- Kwon, J.; Park, S. A Study on the Factors Affecting Pedestrian Traffic Fatal Accidents around Elementary Schools: A Case Study of the Seoul Metropolitan City. J. Korea Plan. Assoc. 2018, 53, 57–73. (In Korean) [Google Scholar] [CrossRef]
- Bae, M.; Park, S. The Effects of Individual and Neighborhood Environmental Characteristics on the Severity of Pedestrian Traffic Accidents in Daegu Metropolitan City. J. Korean Reg. Dev. Assoc. 2019, 31, 239–258. (In Korean) [Google Scholar]
- Rhee, K.A.; Kim, J.K.; Lee, Y.-I.; Ulfarsson, G.F. Spatial regression analysis of traffic crashes in Seoul. Accid. Anal. Prev. 2016, 91, 190–199. [Google Scholar] [CrossRef] [PubMed]
- Adler, M.W.; Ahrend, R. Traffic Safety in Korea. OECD Reg. Dev. Work. 2017. [Google Scholar] [CrossRef]
- Traffic Accident Analysis System (TAAS). Available online: http://taas.koroad.or.kr/sta/acs/exs/typical.do?menuId=WEB_KMP_OVT_UAS_TAT (accessed on 16 July 2019). (In Korean).
- Chen, P.; Zhou, J. Effects of the built environment on automobile–involved pedestrian crash frequency and risk. J. Transp. Health 2016, 3, 448–456. [Google Scholar] [CrossRef] [Green Version]
- Pulugurtha, S.S.; Sambhara, V.R. Pedestrian crash estimation models for signalized intersections. Accid. Anal. Prev. 2011, 43, 439–446. [Google Scholar] [CrossRef]
- Wang, J.; Huang, H.; Zeng, Q. The effect of zonal factors in estimating crash risks by transportation modes: Motor vehicle, bicycle and pedestrian. Accid. Anal. Prev. 2017, 98, 223–231. [Google Scholar] [CrossRef]
- Miranda-Moreno, L.F.; Morency, P.; El-Geneidy, A.M. The link between built environment, pedestrian activity and pedestrian–vehicle collision occurrence at signalized intersections. Accid. Anal. Prev. 2011, 43, 1624–1634. [Google Scholar] [CrossRef] [PubMed]
- Kim, J.K.; Ulfarsson, G.F.; Shankar, V.N.; Mannering, F.L. A note on modeling pedestrian–injury severity in motor–vehicle crashes with the mixed logit model. Accid. Anal. Prev. 2010, 42, 1751–1758. [Google Scholar] [CrossRef] [PubMed]
- Morency, P.; Gauvin, L.; Plante, C.; Fournier, M.; Morency, C. Neighborhood social inequalities in road traffic injuries: The influence of traffic volume and road design. Am. J. Public Health 2012, 102, 1112–1119. [Google Scholar] [CrossRef] [PubMed]
- Colucci, B.; Valle, D. Characterization of Motor Vehicle–Pedestrian Fatalities in Urban Arterial Corridor; Transportation Research Board: Washington, DC, USA, 2014; pp. 14–4444. [Google Scholar]
- Gitelman, V.; Balasha, D.; Carmel, R.; Hendel, L.; Pesahov, F. Characterization of pedestrian accidents and an examination of infrastructure measures to improve pedestrian safety in Israel. Accid. Anal. Prev. 2012, 44, 63–73. [Google Scholar] [CrossRef] [PubMed]
- Zegeer, C.V.; Bushell, M. Pedestrian crash trends and potential countermeasures from around the world. Accid. Anal. Prev. 2012, 44, 3–11. [Google Scholar] [CrossRef]
- Prijon, T.; Ermenc, B. Influence of alcohol intoxication of pedestrians on injuries in fatal road accidents. Forensic Sci. Int. Suppl. Ser. 2009, 1, 33–34. [Google Scholar] [CrossRef]
- Eluru, N.; Bhat, C.R.; Hensher, D.A. A mixed generalized ordered response model for examining pedestrian and bicyclist injury severity level in traffic crashes. Accid. Anal. Prev. 2008, 40, 1033–1054. [Google Scholar] [CrossRef] [Green Version]
- Ulfarsson, G.F.; Kim, S.; Booth, K.M. Analyzing fault in pedestrian–motor vehicle crashes in North Carolina. Accid. Anal. Prev. 2010, 42, 1805–1813. [Google Scholar] [CrossRef]
- Kim, J.-K.; Ulfarsson, G.F.; Shankar, V.N.; Kim, S. Age and pedestrian injury severity in motor–vehicle crashes: A heteroskedastic logit analysis. Accid. Anal. Prev. 2008, 40, 1695–1702. [Google Scholar] [CrossRef]
- Tay, R.; Choi, J.; Kattan, L.; Khan, A. A multinomial logit model of pedestrian–vehicle crash severity. Int. J. Sustain. Transp. 2011, 5, 233–249. [Google Scholar] [CrossRef]
- Pour-Rouholamin, M.; Zhou, H. Investigating the risk factors associated with pedestrian injury severity in Illinois. J. Saf. Res. 2016, 57, 9–17. [Google Scholar] [CrossRef] [PubMed]
- Choi, S.; Park, J.; Oh, C. Factors Affecting Injury Severity in Pedestrian–Vehicle Crash by Novice Driver. Korean Soc. Transp. 2011, 29, 43–51. (In Korean) [Google Scholar]
- Kim, M.; Kho, S.Y.; Kim, D.K. Hierarchical ordered model for injury severity of pedestrian crashes in South Korea. J. Saf. Res. 2017, 61, 33–40. [Google Scholar] [CrossRef]
- Mohamed, M.G.; Saunier, N.; Miranda-Moreno, L.F.; Ukkusuri, S.V. A clustering regression approach: A comprehensive injury severity analysis of pedestrian–vehicle crashes in New York, US and Montreal, Canada. Saf. Sci. 2013, 54, 27–37. [Google Scholar] [CrossRef] [Green Version]
- Zhang, G.; Yau, K.K.; Zhang, X. Analyzing fault and severity in pedestrian–motor vehicle accidents in China. Accid. Anal. Prev. 2014, 73, 141–150. [Google Scholar] [CrossRef] [PubMed]
- Chen, Z.; Fan, W.D. A multinomial logit model of pedestrian–vehicle crash severity in North Carolina. Int. J. Transp. Sci. Technol. 2019, 8, 43–52. [Google Scholar] [CrossRef]
- Haleem, K.; Alluri, P.; Gan, A. Analyzing pedestrian crash injury severity at signalized and non–signalized locations. Accid. Anal. Prev. 2015, 81, 14–23. [Google Scholar] [CrossRef]
- Clifton, K.J.; Burnier, C.V.; Akar, G. Severity of injury resulting from pedestrian–vehicle crashes: What can we learn from examining the built environment? Transp. Res. D Transp. Environ. 2009, 14, 425–436. [Google Scholar] [CrossRef]
- Lee, C.; Abdel-Aty, M. Comprehensive analysis of vehicle–pedestrian crashes at intersections in Florida. Accid. Anal. Prev. 2005, 37, 775–786. [Google Scholar] [CrossRef]
- Zhang, G.; Yau, K.K.; Chen, G. Risk factors associated with traffic violations and accident severity in China. Accid. Anal. Prev. 2013, 59, 18–25. [Google Scholar] [CrossRef] [PubMed]
- Michalaki, P.; Quddus, M.A.; Pitfield, D.; Huetson, A. Exploring the factors affecting motorway accident severity in England using the generalised ordered logistic regression model. J. Saf. Res. 2015, 55, 89–97. [Google Scholar] [CrossRef] [PubMed] [Green Version]
- Yu, C.Y. Built environmental designs in promoting pedestrian safety. Sustainability 2015, 7, 9444–9460. [Google Scholar] [CrossRef] [Green Version]
- Quddus, M.A.; Wang, C.; Ison, S.G. Road traffic congestion and crash severity: Econometric analysis using ordered response models. J. Transp. Eng. 2010, 136, 424–435. [Google Scholar] [CrossRef]
- Aziz, H.A.; Ukkusuri, S.V.; Hasan, S. Exploring the determinants of pedestrian–vehicle crash severity in New York City. Accid. Anal. Prev. 2013, 50, 1298–1309. [Google Scholar] [CrossRef]
- Lee, G.; Lee, S. An Analysis of the Factors of Pedestrian Traffic Accident by Driver’s Age and Accident Severity. J. Urban Des. Inst. Korea 2016, 17, 63–80. (In Korean) [Google Scholar]
- Sze, N.N.; Wong, S.C. Diagnostic analysis of the logistic model for pedestrian injury severity in traffic crashes. Accid. Anal. Prev. 2007, 39, 1267–1278. [Google Scholar] [CrossRef]
- Celik, A.K.; Oktay, E. A multinomial logit analysis of risk factors influencing road traffic injury severities in the Erzurum and Kars Provinces of Turkey. Accid. Anal. Prev. 2014, 72, 66–77. [Google Scholar] [CrossRef]
- Anastasopoulos, P.C.; Mannering, F.L. An empirical assessment of fixed and random parameter logit models using crash–and non–crash–specific injury data. Accid. Anal. Prev. 2011, 43, 1140–1147. [Google Scholar] [CrossRef]
- Harvey, C.; Aultman-Hall, L. Urban streetscape design and crash severity. Transp. Res. Rec. 2015, 2500, 1–8. [Google Scholar] [CrossRef]
- Ouyang, Y.; Bejleri, I. Geographic Information System–Based Community–Level Method to Evaluate the Influence of Built Environment on Traffic Crashes. Transp. Res. Rec. 2014, 2432, 124–132. [Google Scholar] [CrossRef]
- Xu, X.; Šarić, Ž.; Zhu, F.; Babić, D. Accident severity levels and traffic signs interactions in state roads: A seemingly unrelated regression model in unbalanced panel data approach. Accid. Anal. Prev. 2018, 120, 122–129. [Google Scholar] [CrossRef] [PubMed]
- Iranitalab, A.; Khattak, A. Comparison of four statistical and machine learning methods for crash severity prediction. Accid. Anal. Prev. 2017, 108, 27–36. [Google Scholar] [CrossRef] [PubMed]
- Narayanamoorthy, S.; Paleti, R.; Bhat, C.R. On accommodating spatial dependence in bicycle and pedestrian injury counts by severity level. Transp. Res. Part B Method 2013, 55, 245–264. [Google Scholar] [CrossRef] [Green Version]
- Clifton, K.J.; Kreamer-Fults, K. An examination of the environmental attributes associated with pedestrian–vehicular crashes near public schools. Accid. Anal. Prev. 2007, 39, 708–715. [Google Scholar] [CrossRef]
- Noland, R.B.; Quddus, M.A. Analysis of pedestrian and bicycle casualties with regional panel data. Transp. Res. Rec. 2004, 1897, 28–33. [Google Scholar] [CrossRef] [Green Version]
- Lee, H.; Lee, S. An Analysis of Associations between Neighborhood Road Networks and Pedestrian Traffic Accidents: Focused on the TAAS(2014) in Seoul, Korea. J. Korea Plan. Assoc. 2017, 52, 141–161. (In Korean) [Google Scholar] [CrossRef]
- Guerra, E.; Dong, X.; Kondo, M. Do Denser Neighborhoods Have Safer Streets? Population Density and Traffic Safety in the Philadelphia Region. J. Plan. Educ. Res. 2019. [Google Scholar] [CrossRef]
- Dumbaugh, E.; Li, W. Designing for the safety of pedestrians, cyclists, and motorists in urban environments. J. Am. Plan. Assoc. 2010, 77, 69–88. [Google Scholar] [CrossRef]
- Huang, H.; Abdel-Aty, M.A.; Darwiche, A.L. County–level crash risk analysis in Florida: Bayesian spatial modeling. Transp. Res. Rec. 2010, 2148, 27–37. [Google Scholar] [CrossRef]
- Jermprapai, K.; Srinivasan, S. Planning–level model for assessing pedestrian safety. Transp. Res. Rec. 2014, 2464, 109–117. [Google Scholar] [CrossRef]
- Pulugurtha, S.S.; Duddu, V.R.; Kotagiri, Y. Traffic analysis zone level crash estimation models based on land use characteristics. Accid. Anal. Prev. 2013, 50, 678–687. [Google Scholar] [CrossRef] [PubMed]
- Wier, M.; Weintraub, J.; Humphreys, E.H.; Seto, E.; Bhatia, R. An area–level model of vehicle–pedestrian injury collisions with implications for land use and transportation planning. Accid. Anal. Prev. 2009, 41, 137–145. [Google Scholar] [CrossRef] [PubMed]
- Traffic Accident Analysis System (TAAS). Available online: http://taas.koroad.or.kr/gis/mcm/mcl/initMap.do?menuId=GIS_GMP_STS_RSN (accessed on 12 June 2019). (In Korean).
- Seoul Open Data Plaza. Available online: http://data.seoul.go.kr/dataList/datasetList.do (accessed on 3 July 2019). (In Korean)
- Road Name Address Guidance System. Available online: http://www.juso.go.kr/addrlink/addressBuildDevNew.do?menu=mainJusoLayer (accessed on 14 June 2019). (In Korean)
- Seoul Urban Planning Portal. Available online: http://urban.seoul.go.kr/4DUPIS/index.do (accessed on 12 June 2019). (In Korean)
- National Spatial Data Infrastructure Portal. Available online: http://openapi.nsdi.go.kr/nsdi/eios/ServiceDetail.do?svcSe=F&svcId=F010 (accessed on 13 June 2019). (In Korean)
- Open Data Portal. Available online: https://www.data.go.kr/search/index.do (accessed on 14 June 2019). (In Korean)
- Korean Statistical Information Service. Available online: http://kosis.kr/statisticsList/statisticsListIndex.do?menuId=M_01_01&vwcd=MT_ZTITLE&parmTabId=M_01_01 (accessed on 15 June 2019). (In Korean).
- Diez-Roux, A.V. Bringing context back into epidemiology: Variables and fallacies in multilevel analysis. Am. J. Public Health 1998, 88, 216–222. [Google Scholar] [CrossRef] [PubMed] [Green Version]
- Kim, D.-G.; Lee, Y.; Washington, S.; Choi, K. Modeling crash outcome probabilities at rural intersections: Application of hierarchical binomial logistic models. Accid. Anal. Prev. 2007, 39, 125–134. [Google Scholar] [CrossRef]
- Snijders, T.A.; Bosker, R.J. Multilevel Analysis: An Introduction to Basic and Advanced Multilevel Modeling, 2nd ed.; Sage: London, UK, 2011. [Google Scholar]
- Raudenbush, S.W. Hierarchical Linear Models: Applications and Data Analysis Methods; Sage: London, UK, 2002. [Google Scholar]
- Wang, H.; Guo, X.-H.; Jia, Z.-W.; Li, H.-K.; Liang, Z.-G.; Li, K.-C.; He, Q. Multilevel binomial logistic prediction model for malignant pulmonary nodules based on texture features of CT image. Eur. J. Radiol. 2010, 74, 124–129. [Google Scholar] [CrossRef]
- Demetriades, D.; Murray, J.; Martin, M.; Velmahos, G.; Salim, A.; Alo, K.; Rhee, P. Pedestrians injured by automobiles: Relationship of age to injury type and severity. J. Am. Coll. Surg. 2004, 199, 382–387. [Google Scholar] [CrossRef]
- Prato, C.G.; Kaplan, S.; Patrier, A.; Rasmussen, T.K. Considering built environment and spatial correlation in modelling injury severity for pedestrian crashes. In Proceedings of the 96th Annual Meeting of the Transportation Research Board, Washington, DC, USA, 8–12 January 2017. [Google Scholar]
- Jang, J.; Choi, J.; Kim, T. Analyzing Driving Environment Effects on Severity of Elderly Driver’s Traffic Accidents. J. Transp. Res. 2017, 24, 79–94. (In Korean) [Google Scholar] [CrossRef]
- Song, K. Seeking for a Policy and Implications for Creating a Safe Transportation Environment for Elderly Drivers in Gyeongnam. Gyeongnam Inst. 2014, 2014-16, 1–12. (In Korean) [Google Scholar]
- Guo, R.; Xin, C.; Lin, P.-S.; Kourtellis, A. Mixed effects logistic model to address demographics and neighborhood environment on pedestrian injury severity. Transp. Res. Rec. 2017, 2659, 174–181. [Google Scholar] [CrossRef]
- Arbogast, H.; Patao, M.; Demeter, N.; Bachman, S.; Devietti, E.; Upperman, J.S.; Burke, R.V. The Effectiveness of Installing a Speed Hump in Reducing Motor Vehicle Accidents Involving Pedestrians under the Age of 21. J. Transp. Health 2018, 8, 30–34. [Google Scholar] [CrossRef]
- Rothman, L.; Macpherson, A.; Buliung, R.; Macarthur, C.; To, T.; Larsen, K.; Howard, A. Installation of speed humps and pedestrian–motor vehicle collisions in Toronto, Canada: A quasi-experimental study. BMC Public Health 2015, 15, 774. [Google Scholar] [CrossRef] [PubMed] [Green Version]
- Korea Consumer Agency. Safety Survey of Speed Humps; Korea Consumer Agency: Chungcheongbuk-do, Korea, 2015. (In Korean)
- Ministry of Government Legislation (Korea). Rules for the Designation and Management of Safety Zones for Children, the Elderly and the Disabled. Available online: https://www.moleg.go.kr/index.es?sid=a1 (accessed on 30 October 2019). (In Korean)
- Kwon, J.; Park, S. A Study on Association between Pedestrian Traffic Accidents and Built Environment for Safe Routes to School: Using a Spatial Regression Model. J. Korean Reg. Dev. Assoc. 2018, 30, 75–96. (In Korean) [Google Scholar]
- Hong, D.; Park, J.; Lim, J. Methods to Enhance Traffic Safety for Vulnerable Road Users. J. Transp. Res. 2018, 18-12, 1–228. (In Korean) [Google Scholar]
- Ministry of Government Legislation (Korea). Act on Promotion of the Transportation Convenience of Mobility Disadvantaged Persons. Available online: https://http://www.law.go.kr/engLsSc.do?tabMenuId=tab45&query=act%20on%20promotion%20of%20the%20transportation# (accessed on 30 October 2019). (In Korean)
- Seo, J.; Lee, S. A Study on the Physical Environmental Factors Influencing Pedestrian Traffic Accidents in Seoul, Korea: Focused on the 2014 TAAS Data. J. Korea Plan. Assoc. 2016, 51, 197–216. (In Korean) [Google Scholar] [CrossRef]
- Yoon, J.; Lee, S. Analysis of Pedestrian Traffic Accident Factors around the Exclusive Median Bus Lane Station Area: Focused on TAAS (2014–2016) Data in Seoul, Korea. J. Korea Plan. Assoc. 2018, 53, 123–142. (In Korean) [Google Scholar] [CrossRef]


| Level | Variables | Definition | Unit | Mean | Std. Dev. | |
|---|---|---|---|---|---|---|
| Severity of pedestrian injury | Severity of pedestrian injury (1 = Fatal injury, 0 = Other) | Binomial logit | 0.43 | 0.49 | ||
| Individual characteristics (Lower level) | Pedestrian characteristics | Pedestrian age | Pedestrian age | Number | 45.72 | 20.79 |
| Pedestrian sex | Pedestrian sex (1 = Male, 0 = Female) | Dummy | 0.51 | 0.50 | ||
| Driver characteristics | Driver age | Driver age | Number | 49.26 | 13.38 | |
| Driver sex | Driver sex (1 = Male, 0 = Female) | Dummy | 0.81 | 0.39 | ||
| Crash event characteristics | Vehicles | Vehicle types (1 = Truck or Van, 0 = Passenger car) | Dummy | 0.22 | 0.41 | |
| Weather | Weather condition (1 = Inclement, 0 = Other) | Dummy | 0.12 | 0.33 | ||
| Time | Time (1 = Night (18–06), 0 = Other) | Dummy | 0.42 | 0.49 | ||
| Crash at intersection | Pedestrian-vehicle crash at intersection (1 = At intersection, 0 = Other) | Dummy | 0.32 | 0.46 | ||
| Crash at crosswalk | Pedestrian-vehicle crash at crosswalk (1 = At crosswalk, 0 = Other) | Dummy | 0.08 | 0.27 | ||
| Neighborhood environmental characteristics (Upper level) | Road characteristics | Road humps | Number of humps per km2 | Density | 21.52 | 18.31 |
| Neighborhood streets | Proportion of neighborhood streets | Ratio | 61.98 | 16.30 | ||
| Main roads | Proportion of main roads | Ratio | 21.56 | 13.12 | ||
| Signalized crosswalks | Number of signalized crosswalks per km2 | Density | 25.37 | 13.49 | ||
| Non-signalized crosswalks | Number of non- signalized crosswalks per km2 | Density | 52.11 | 29.77 | ||
| Signalized intersections | Number of signalized intersections per km2 | Density | 47.50 | 28.04 | ||
| Non-signalized intersection | Number of non- signalized intersections per km2 | Density | 172.60 | 108.84 | ||
| Posted speed | Average posted speed | Avg (km/h) | 50.48 | 4.41 | ||
| Land use characteristics | Residential areas | Proportion of residential areas | Ratio | 70.62 | 28.47 | |
| Commercial areas | Proportion of commercial areas | Ratio | 7.92 | 15.08 | ||
| Land development characteristics | Gross floor area of housing buildings | Average gross floor area of housing buildings | Avg (m2) | 1423.06 | 2685.19 | |
| Gross floor area of commercial buildings | Average gross floor area of commercial buildings | Avg (m2) | 1566.66 | 2758.04 | ||
| Safety zone characteristics | School zones | Number of school zones per km2 | Density | 3.67 | 2.63 | |
| Silver zones | Number of silver zones per km2 | Density | 0.24 | 0.51 | ||
| Population characteristics | Population | Population per km2 | Density | 24,705.37 | 16,803.56 | |
| Under 15 years | Population under 15 years old per km2 | Density | 2701.67 | 2168.02 | ||
| Over 65 years | Population over 65 years old per km2 | Density | 3067.75 | 2170.37 | ||
| Classification | Variables | Model 1 | Model 2 | Model 3 | |||||||
|---|---|---|---|---|---|---|---|---|---|---|---|
| Coefficient | Std. Error | Odds Ratio | Coefficient | Std. Error | Odds Ratio | Coefficient | Std. Error | Odds Ratio | |||
| Intercept | −0.201 *** | 0.019 | 0.817 | −1.613 *** | 0.069 | 0.199 | −1.608 *** | 0.291 | 0.200 | ||
| Individual characteristics (Lower level) | Pedestrian characteristics | Pedestrian age | 0.023 *** | 0.000 | 1.023 | 0.024 *** | 0.000 | 1.024 | |||
| Pedestrian sex | −0.288 *** | 0.027 | 0.749 | −0.268 *** | 0.029 | 0.764 | |||||
| Driver characteristics | Driver age | 0.003 *** | 0.001 | 1.003 | 0.003 *** | 0.001 | 1.003 | ||||
| Driver sex | 0.001 | 0.036 | 1.001 | 0.007 | 0.039 | 1.007 | |||||
| Crash event characteristics | Vehicles | 0.133 *** | 0.033 | 1.142 | 0.132 *** | 0.036 | 1.141 | ||||
| Weather | 0.119 *** | 0.040 | 1.126 | 0.125 *** | 0.043 | 1.043 | |||||
| Time | 0.278 *** | 0.028 | 1.320 | 0.286 *** | 0.033 | 1.331 | |||||
| Crash at intersection | 0.216 *** | 0.029 | 1.241 | 0.247 *** | 0.031 | 1.280 | |||||
| Crash at crosswalk | 0.517 *** | 0.050 | 1.676 | 0.521 *** | 0.055 | 1.683 | |||||
| Neighborhood environmental characteristics (Upper level) | Road characteristics | Road humps | 0.003 *** | 0.001 | 1.003 | ||||||
| Neighborhood streets | −0.003 * | 0.002 | 0.997 | ||||||||
| Main roads | −0.002 | 0.002 | 0.998 | ||||||||
| Signalized crosswalks | −0.002 | 0.000 | 0.998 | ||||||||
| Non-signalized crosswalks | −0.002 *** | 0.000 | 0.998 | ||||||||
| Signalized intersections | 0.002 * | 0.001 | 1.002 | ||||||||
| Non-signalized intersections | −0.000 *** | 0.000 | 1.000 | ||||||||
| Posted speed | 0.006 | 0.004 | 1.006 | ||||||||
| Land use characteristics | Residential areas | −0.000 | 0.000 | 1.000 | |||||||
| Commercial areas | 0.000 | 0.001 | 1.000 | ||||||||
| Land development characteristics | Gross floor area of housing buildings | 0.000 | 0.000 | 1.000 | |||||||
| Gross floor area of commercial buildings | 0.000 | 0.000 | 1.000 | ||||||||
| Safety zone characteristics | School zones | −0.000 | 0.008 | 1.000 | |||||||
| Silver zones | 0.013 | 0.034 | 1.013 | ||||||||
| Population characteristics | Population | −0.000 | 0.000 | 1.000 | |||||||
| Under 15 years | 0.000 | 0.000 | 1.000 | ||||||||
| Over 65 years | 0.000 | 0.000 | 1.000 | ||||||||
| Random Intercept | 0.0776 | 0.0590 | 0.2683 | ||||||||
| ICC | 0.023 | 0.018 | 0.040 | ||||||||
| Deviance | 33816.3 | 32088.4 | 32033.8 | ||||||||
| Number of observations | 24826 | 24826 | 24826 | ||||||||
© 2020 by the authors. Licensee MDPI, Basel, Switzerland. This article is an open access article distributed under the terms and conditions of the Creative Commons Attribution (CC BY) license (http://creativecommons.org/licenses/by/4.0/).
Share and Cite
Park, S.; Ko, D. A Multilevel Model Approach for Investigating Individual Accident Characteristics and Neighborhood Environment Characteristics Affecting Pedestrian-Vehicle Crashes. Int. J. Environ. Res. Public Health 2020, 17, 3107. https://0-doi-org.brum.beds.ac.uk/10.3390/ijerph17093107
Park S, Ko D. A Multilevel Model Approach for Investigating Individual Accident Characteristics and Neighborhood Environment Characteristics Affecting Pedestrian-Vehicle Crashes. International Journal of Environmental Research and Public Health. 2020; 17(9):3107. https://0-doi-org.brum.beds.ac.uk/10.3390/ijerph17093107
Chicago/Turabian StylePark, Seunghoon, and Dongwon Ko. 2020. "A Multilevel Model Approach for Investigating Individual Accident Characteristics and Neighborhood Environment Characteristics Affecting Pedestrian-Vehicle Crashes" International Journal of Environmental Research and Public Health 17, no. 9: 3107. https://0-doi-org.brum.beds.ac.uk/10.3390/ijerph17093107