Article

Examining Regional Differences of Dietary Inflammatory Index and Its Association with Depression and Depressive Symptoms in Korean Adults

1
Department of Food and Nutrition, Inha University, Incheon 22212, Korea
2
Cancer Prevention and Control Program, University of South Carolina, Columbia, SC 29208, USA
3
Department of Epidemiology and Biostatistics, Arnold School of Public Health, University of South Carolina, Columbia, SC 29208, USA
4
Department of Nutrition, Connecting Health Innovations LLC, Columbia, SC 29201, USA
5
Department of Food Science and Nutrition, Gwangju University, Gwangju 61743, Korea
*
Author to whom correspondence should be addressed.
Int. J. Environ. Res. Public Health 2020, 17(9), 3205; https://0-doi-org.brum.beds.ac.uk/10.3390/ijerph17093205
Submission received: 16 March 2020 / Revised: 27 April 2020 / Accepted: 1 May 2020 / Published: 5 May 2020

Abstract

:
The relationship between the dietary inflammatory index (DII®) and depression and depressive symptoms in South Korean adults remains unclear. This study aimed to examine the overall relationship between the DII and depression in South Korea and to evaluate the association between the DII and depressive symptoms and depression across regions among Korean adults aged ≥19 years. A total of 15,929 study participants were selected from the Korea National Health and Nutrition Examination Survey (KNHANES) 2014–2017. Energy-adjusted (E-DII) scores were calculated using 24-h dietary recall data. Depression and depressive symptoms were measured on the basis of the Korean version of the Patient Health Questionnaire 9-item scale, a doctor’s diagnosis of depression, and self-reported depressive symptom-related questionnaire. Overall, 4.2% of the participants had depression, with notable gender differences (i.e., 2.4% in men and 6.2% in women). Korean adults residing in the Capital area, Chungcheong-do and Jeju-do, and with diets in the highest tertile of the E-DII (most pro-inflammatory diet) had significantly increased odds of having depression and depressive symptoms compared with those in the lowest tertile of the E-DII (most anti-inflammatory diet) after controlling for covariates (adjusted odds ratio (AOR): 1.44, 95% confidence interval (CI): 1.04–1.99; AOR 2.97, 95% CI 1.36–6.52; AOR 4.06, 95% CI 1.56–10.53, respectively). No association between the E-DII and depression/depressive symptoms was found in other regions of South Korea. A pro-inflammatory diet is associated with greater odds of depression and depressive symptoms, with distinct regional differences. The present study provides evidence regarding existing regional differences in the association of the E-DII with depression and depressive symptoms.

1. Introduction

Depression is a major health concern affecting more than 300 million people worldwide, which accounts for 4.4% of the world’s population [1]. One of the significant factors that can contribute to the occurrence of depression is nutrition. “Healthy” dietary patterns characterized by high intakes of whole grains, vegetables, fruits, fish, nuts, and seeds are associated with lower risk of depression among United States (U.S.) women [2]. In a randomized controlled study, participants in the Mediterranean-style diet group with fish oil supplementation had significantly greater improvement in depression risk than the social group provided with snacks such as biscuits, cheese, dips, tea/coffee, and water/juice [3]. This may be partially due to the fact that people with depression are more likely to engage in unhealthy lifestyle behaviors [4]. Furthermore, low socioeconomic status (SES) plays a key role in psychiatric disorders, and SES inequalities are partly explained by regional discrepancies among the population. For example, mental health was found to be associated with the level of regional social deprivation in Wales, England [5].
The relationship between diet and depression can be partly explained by inflammation. Depression has been associated with increased levels of interleukin-6 (IL-6) [6,7], tumor necrosis factor-alpha (TNF-α) [8], and C-reactive protein (CRP) [8]. For instance, previous findings reported increased circulating levels of cytokines in the cerebrospinal fluid of depressed patients, and a positive correlation was found between serum IL-1β and the severity of depression [9]. Results of the analyses from the 2009–2010 National Health and Nutrition Examination Survey (NHANES) indicate that study participants with depression had higher CRP concentrations; that is, 47.01% of the study population with depression had CRP levels of ≥3.0 mg/L, and 29.06% had CRP levels of ≥5.0 mg/L [10]. This finding partially explains the relationships between inflammation and the higher risk of comorbidities associated with depression [11]. Moreover, inflammatory cytokines may predict depression. People who had higher serum levels of IL-6 at age nine had 1.55 higher odds of depression when they reach the age of 18 years as reported in the Avon Longitudinal Study of Parents and Children in England [12]. When individuals are exposed to chronic inflammation, this will cause changes in neurotransmitter metabolism, which will lead to psychiatric disorders, specifically depression [13]. Peripheral cytokines can access the brain and activate inflammatory networks of the local central nervous system to produce alterations in neurotransmitter function and may lead to the development of depression [14].
One of the main factors modulating inflammation is diet. To quantify the inflammatory potential of diet, the dietary inflammatory index (DII®) was developed on the basis of the extant medical literature published through 2010 [15] and validated with IL-6, high-sensitivity CRP (hs-CRP), and TNF-α in Western countries [16,17,18,19]. We previously validated the DII in Korean adults using hs-CRP [20]. The relationship between the DII and depression or depressive symptom risk has been explored in the U.S. [21,22,23] and European countries [24,25,26,27]; however, to the best of our knowledge, no such studies have evaluated the relationship between the DII and depression in Korean adults. Given the influence of the regional differences with respect to mental health, data on the status of depression and depressive symptoms in South Korea are limited. Hence, this study aimed to achieve the following objectives: (1) to examine the regional differences in the DII in South Korea, and (2) to evaluate the association of the DII and depressive symptoms and depression stratified by regions using a representative sample of Korean adults using the Korea National Health and Nutrition Examination Survey (KNHANES).

2. Methods

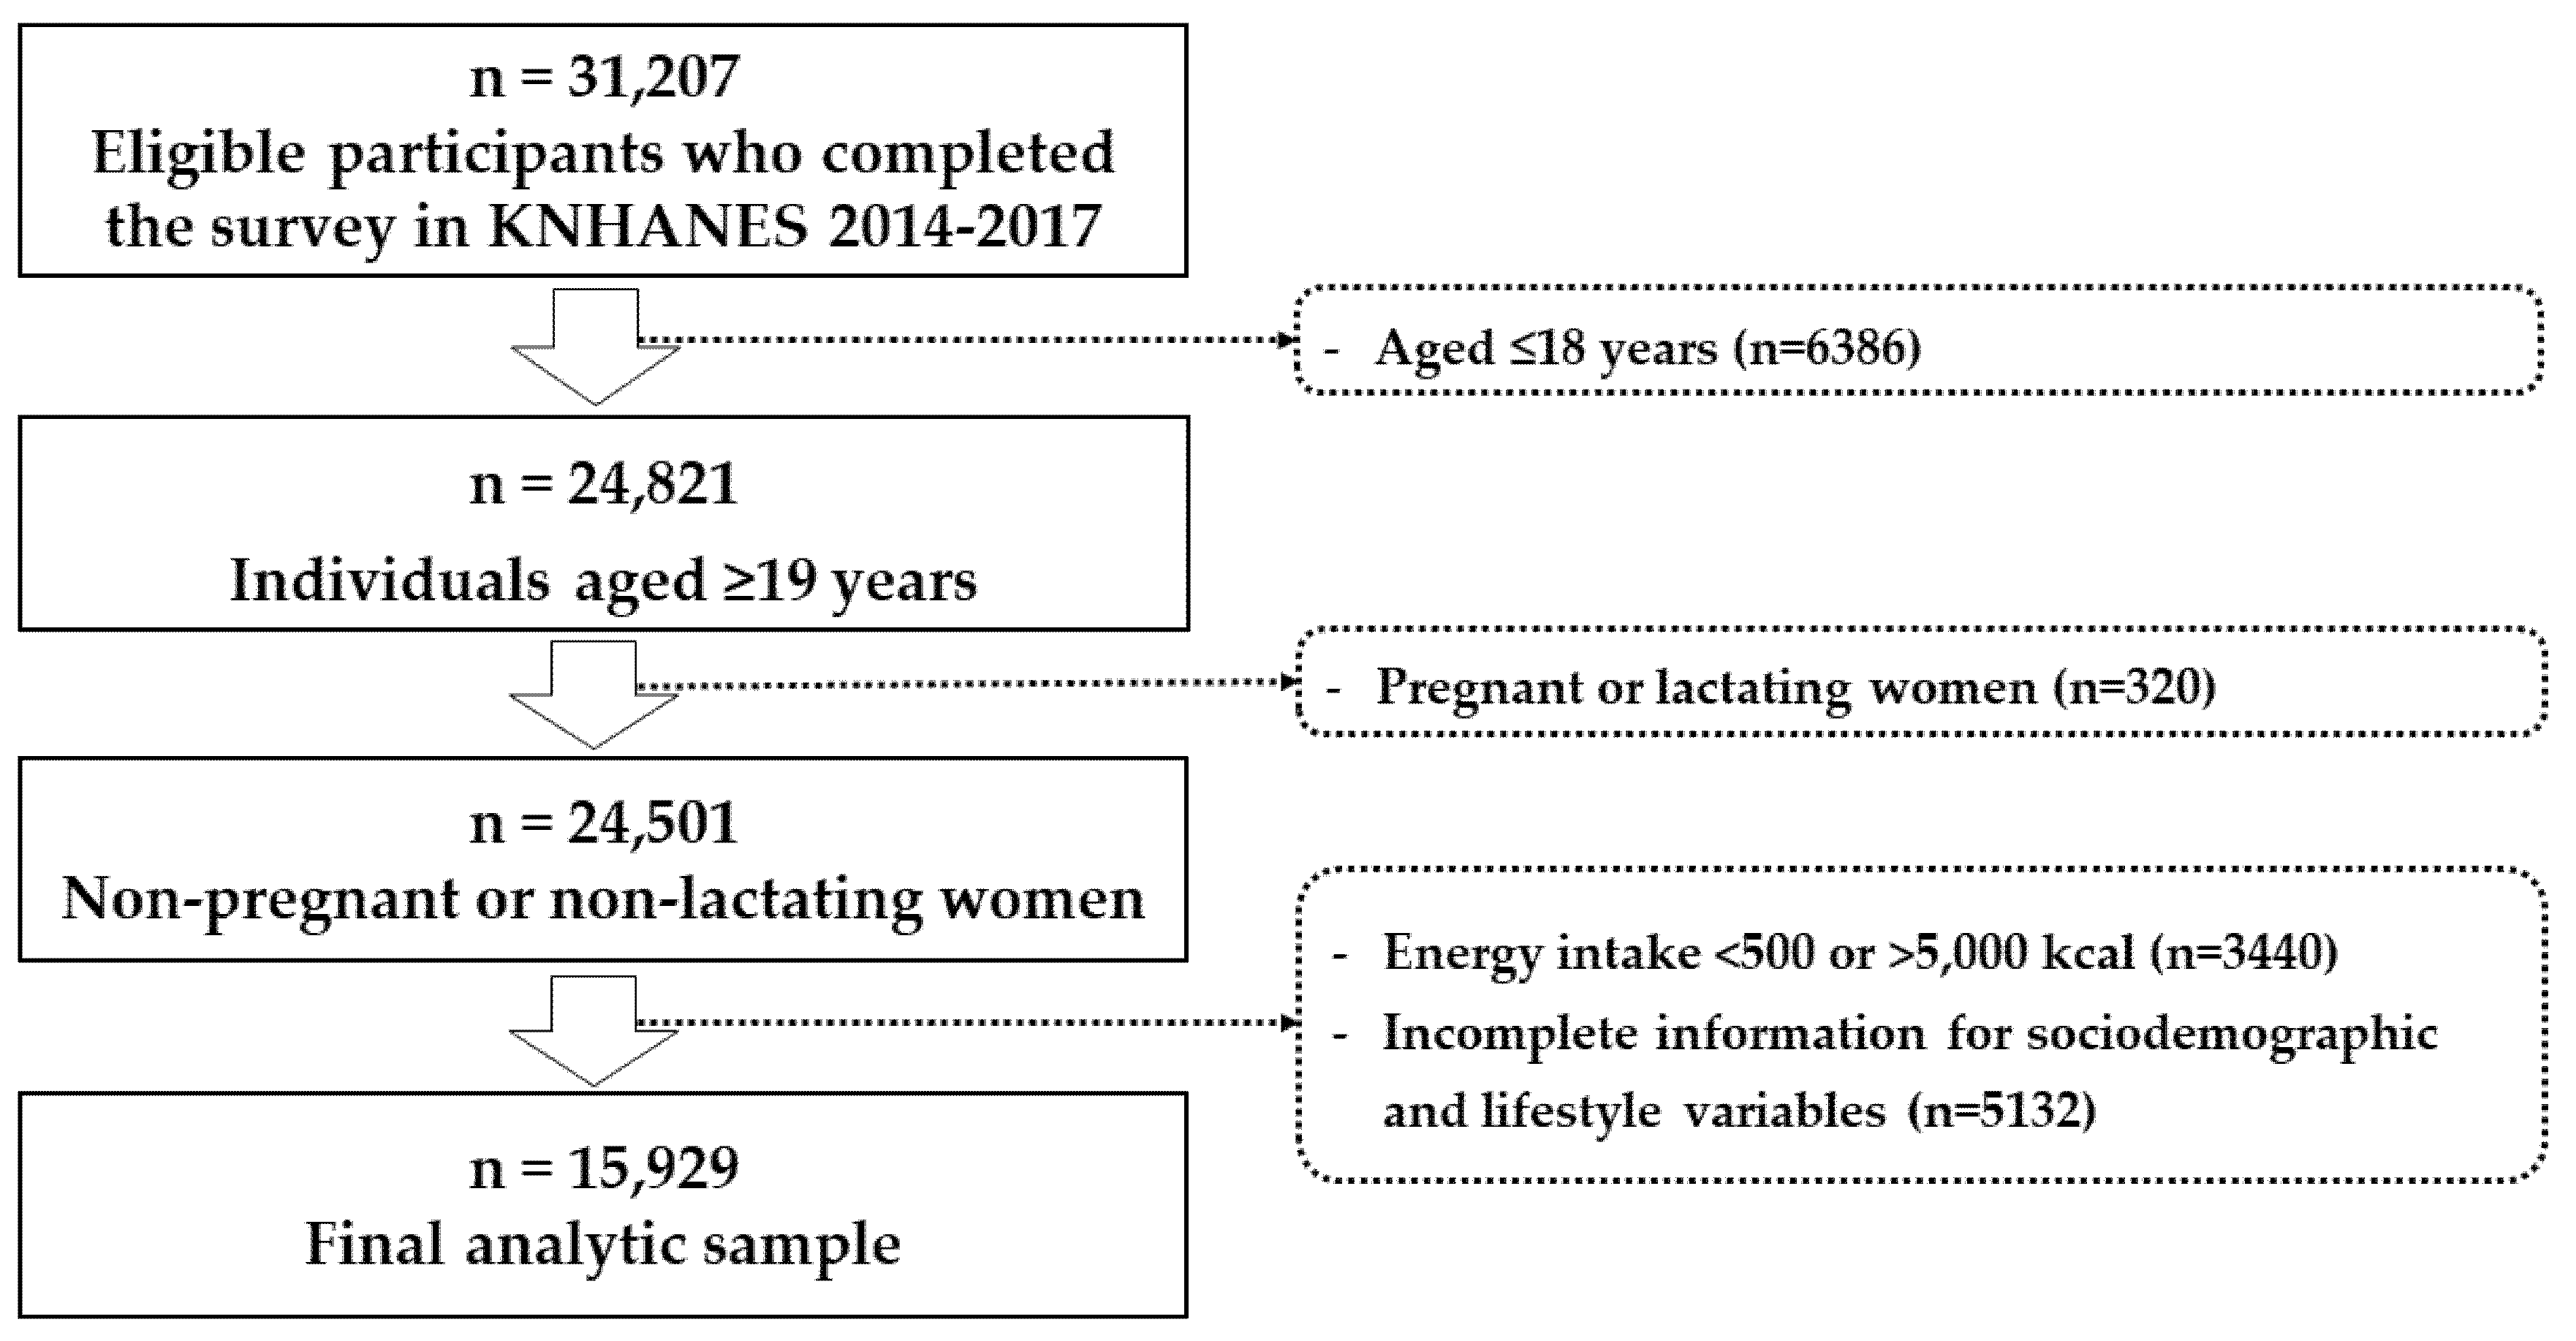
2.1. Study Population

The study included Korean adults aged ≥19 years who participated in the KNHANES 2014–2017. A total of 31,207 participants completed the survey in KNHANES 2014–2017. After excluding participants aged <19 years (n = 6386), pregnant or lactating women (n = 320), those with energy intake of <500 or >5000 kcal/day (n = 3440), and those with incomplete sociodemographic and lifestyle data (n = 5132), a total of 15,929 (7201 men and 8728 women) were included in the final analysis (Figure 1). The institutional review board (IRB) of the by the Korea Centers for Disease Control and Prevention (KCDC) reviews and approves the KNHANES survey (approval no. 2013-12EXP-03-5C). Informed consent was obtained from all participants when the surveys were conducted. IRB approval was not required because the KNHANES is a publicly available dataset.

2.2. Dietary Inflammatory Index (DII®)

The DII was developed by researchers at the University of South Carolina. Details on the development and validation of the DII have been published previously [15,17]. In brief, the literature (approximately 2000 articles) published between 1950 and 2010 was reviewed in terms of the relationship between various micronutrients, macronutrients, and whole food items (termed food parameters) and inflammation to obtain the inflammatory effect scores of the food parameters. At the same time, a global database, which contains the means and standard deviations of intake of food parameters from 11 populations around the world, was created [15]. For this study, the KNHANES dietary data, based on a single 24-h dietary recall, were used to calculate the DII. The original DII includes 45 food parameters; however, only 22 of the 45 parameters were available and used for the calculation of the DII in this study. The following 22 DII food parameters were included: carbohydrates, protein, fat; vitamin A, vitamin B1, vitamin B2, vitamin B3 (niacin), vitamin C, iron, saturated fatty acids, monounsaturated fatty acids, polyunsaturated fatty acids, omega-3 and omega-6 polyunsaturated fatty acids, dietary fiber, cholesterol, β-carotene, garlic, ginger, onion, pepper, and tea. The world mean value of each food parameter was subtracted from the actual; i.e., reported intake value of each food parameter and then divided by the world standard deviation to create a z-score. Next, the z-scores were converted to proportions (with values from 0 to 1), which were then centered on zero by doubling the value and subtracting 1 (i.e., with values ranging from −1 to +1). This value was then multiplied by the inflammatory effect score of each food parameter. These were then summarized across all food parameters to obtain the overall DII score. More positive scores indicate a higher intake of a pro-inflammatory diet; negative scores indicate a higher intake of an anti-inflammatory diet [15]. In this study, the energy-adjusted DII (E-DIITM) scores were calculated per 1000 calories by converting all nutrients from KNHANES. A global database with dietary exposures expressed per 1000 kcal/day was then used to calculate the E-DII scores.

2.3. Assessment of Depression and Depressive Symptoms

Using the self-reported Korean version of the Patient Health Questionnaire 9-item (PHQ-9) scale, depression was defined as having a PHQ score of ≥10 [28] or a doctor’s diagnosis of having depression. PHQ-9 was measured in KNHANES 2014 and 2016 only. For depressive symptoms, the study participants were asked the following question: “Has your life been disrupted by feelings of hopelessness or sadness for more than two weeks within the past year?” Participants who responded “yes” to that question were classified as having depressive symptoms.

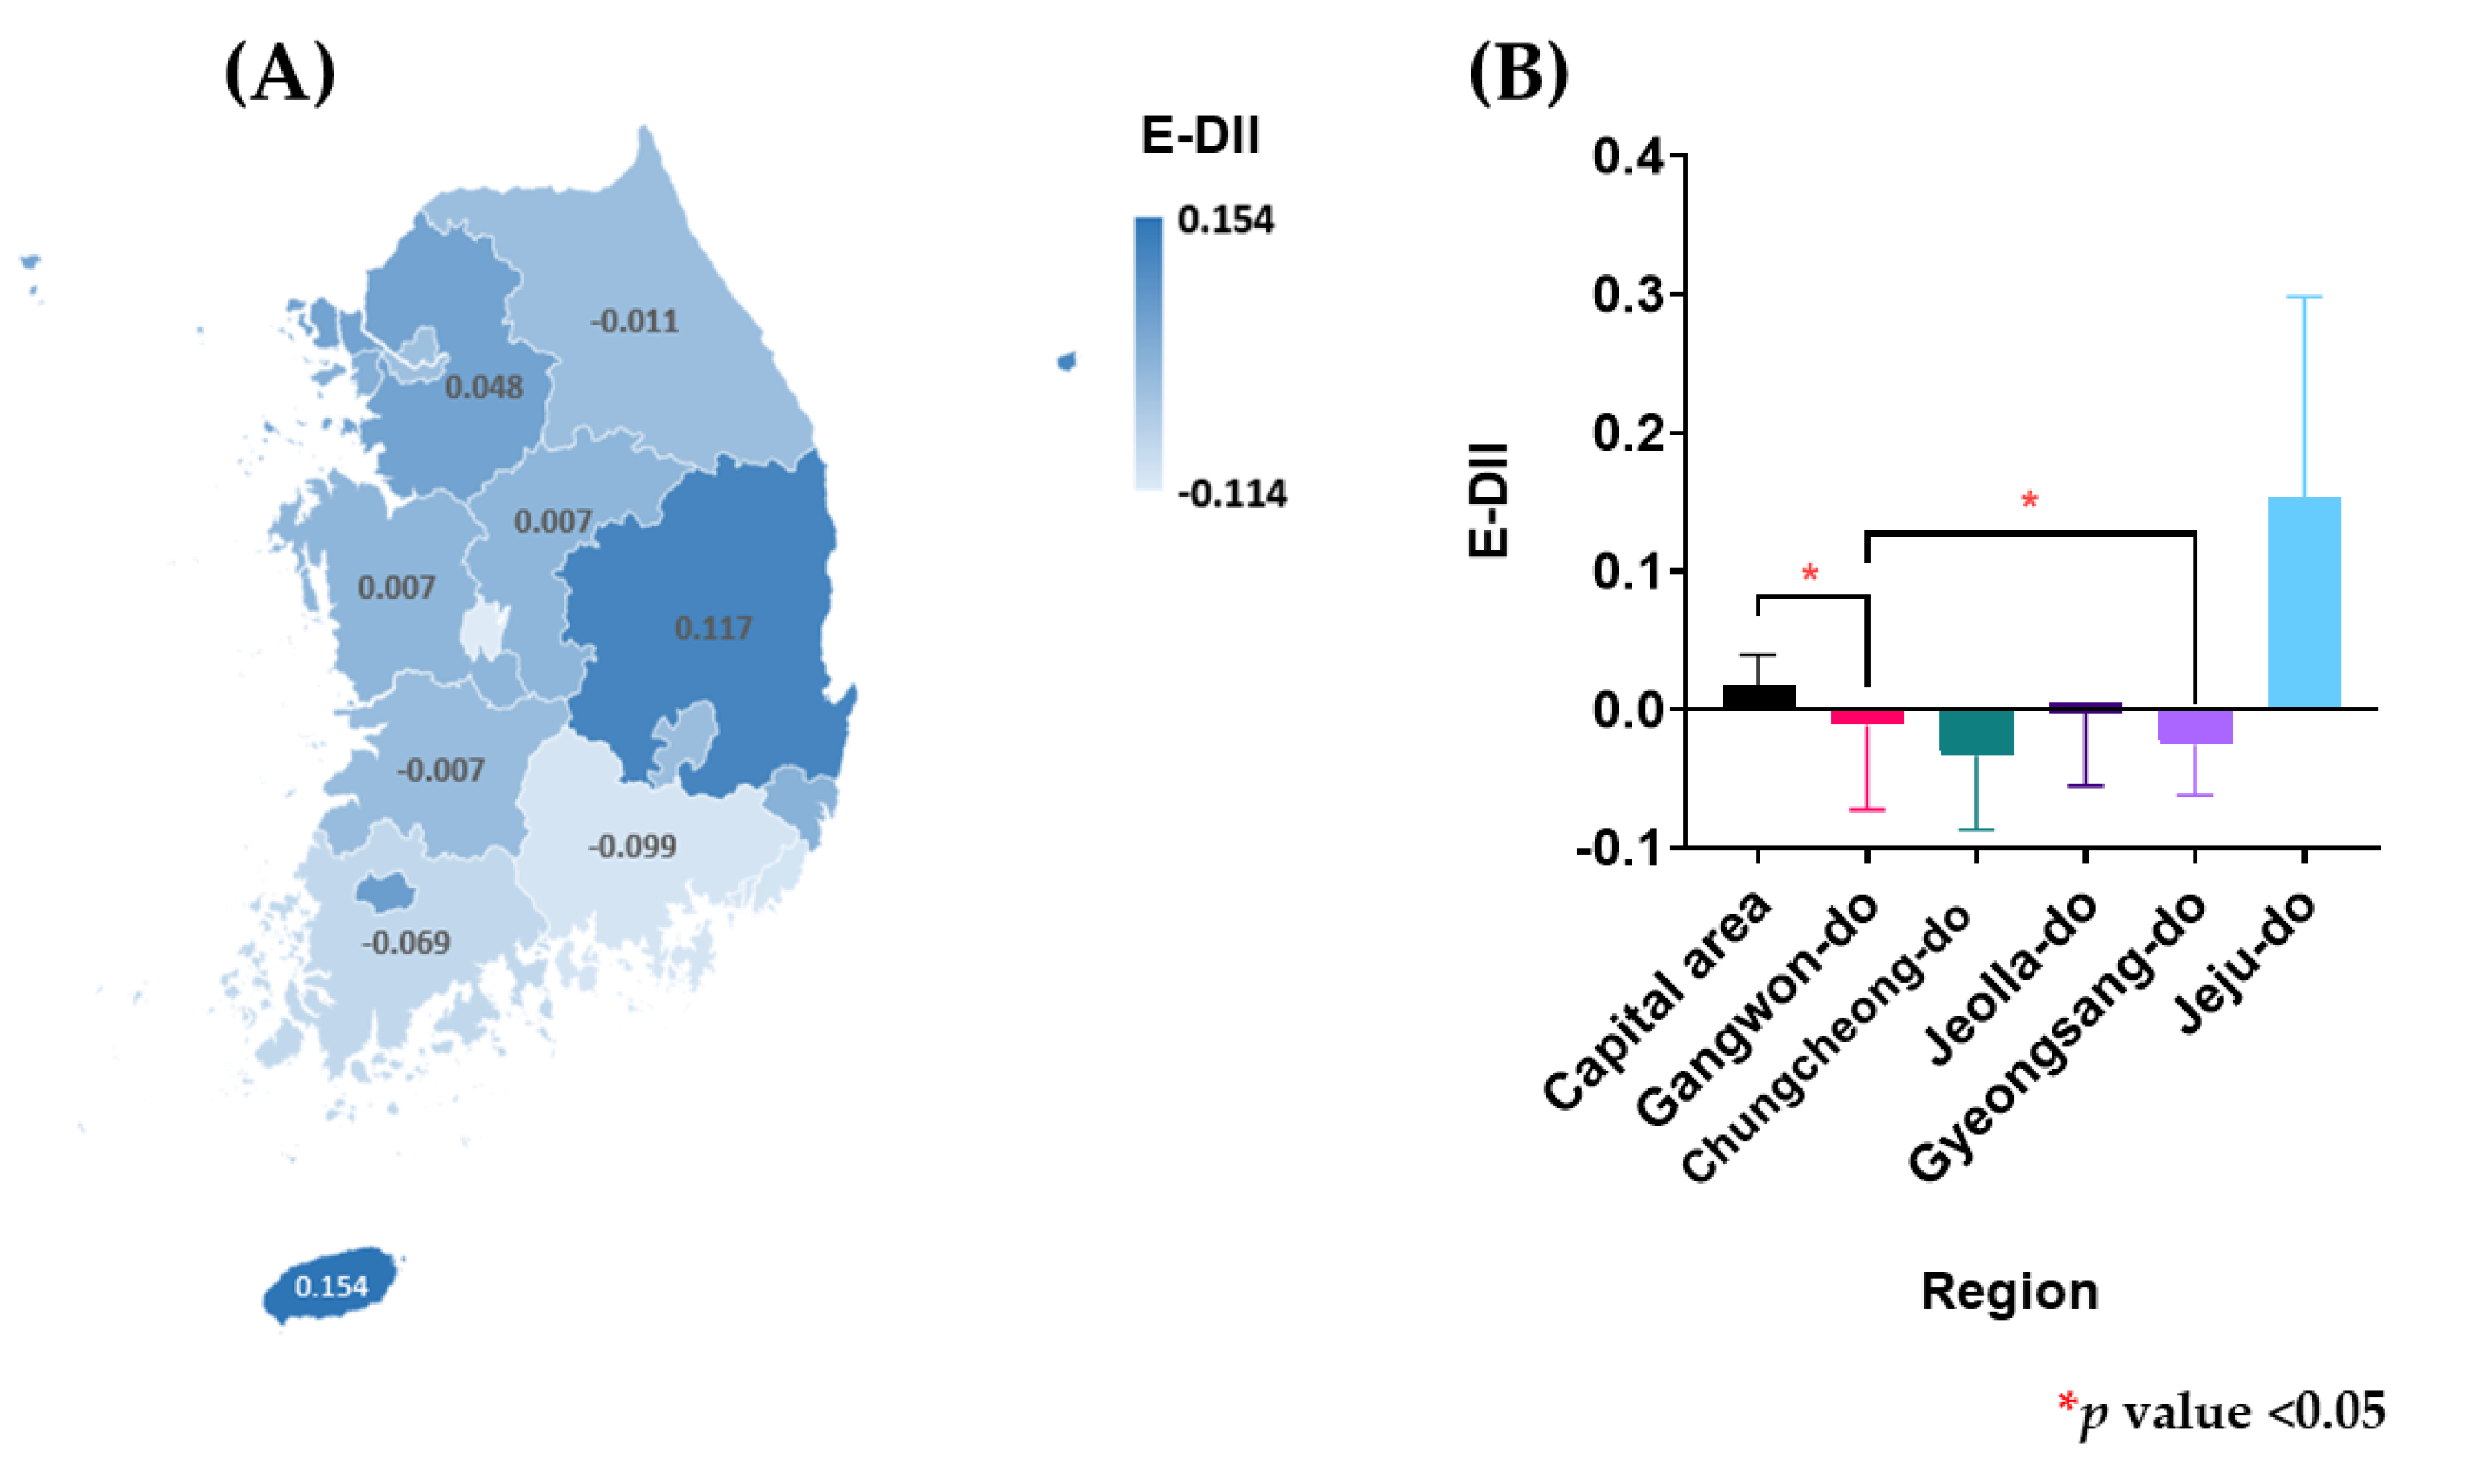
2.4. Definition of Regions

The regions were divided into the following groups (see Figure 2): (1) 16 cities and provinces including Seoul, Busan, Daegu, Incheon, Gwangju, Daejeon, Ulsan, Gyeonggi-do, Gangwon-do, Chungcheongbuk-do, Chungcheongnam-do, Jeollabuk-do, Jeollanam-do, Gyeongsangbuk-do, Gyeongsangnam-do, and Jeju-do, and (2) six regions including the Capital area (Seoul, Incheon, and Gyeonggi-do), Gangwon-do, Chungcheong-do (Deajeon, Chungcheongbuk-do, and Chungcheongnam-do), Jeolla-do (Gwangju, Jeollabuk-do, and Jeollanam-do), Gyeongsang-do (Busan, Daegu, Ulsan, Gyeongsangbuk-do, and Gyeongsangnam-do), and Jeju-do.

2.5. Statistical Analyses

The descriptive statistics of sociodemographic factors; lifestyle factors such as alcohol consumption, smoking status, and physical activity; body mass index (BMI) and regions were computed and stratified by tertiles of the E-DII. Chi-square tests were used to examine the differences in categorical variables by tertiles of the E-DII score. Mean E-DII was calculated by 16 cities and provinces and six regions. T-test was performed to examine the differences of mean E-DII between the two regions. Multivariable logistic regression analyses were used to calculate the adjusted odds ratios (AORs) and 95% confidence intervals (CIs) for the association between the tertiles of the E-DII and depression stratified by 6 regions after controlling for covariates including age, gender, education, alcohol consumption, smoking habits, physical activity, and BMI. The sample weights of the participants were constructed to represent the Korean population by accounting for the complex survey design, survey non-response, and post-stratification. All statistical analyses were conducted using SAS® version 9.4 (SAS Institute, Cary, NC, USA). Statistical significance was declared at p value <0.05.

3. Results

Table 1 presents the sociodemographic and lifestyle variables by E-DII tertiles. Gender, age, household income, education, employment status, drinking habits, smoking status, and BMI significantly differed across the E-DII tertiles (p value <0.001). The study participants in tertile 3 (most pro-inflammatory diet) were more likely to be men (60.3%), were aged 30–49 years (41.9%), had the highest quartile of household income level (30.8%), had a higher education level (58.4%), were blue-collar workers (44.2%), consumed alcohol 1–4 times/month (40.9%), were nonsmokers (70.7%), and had a normal weight (39.7%). E-DII tertile 3 had the highest number of smokers (29.3%) compared to tertile 1 (15.2%).
The mean E-DII score in 16 cities and provinces and six regions in South Korea are indicated in Figure 2. Variability of estimates in the regional subgroups was high in KNHANES, particularly in regions with a small number of subjects (n = 300) in Jeju-do. Daejeon showed the lowest E-DII score (indicating the most anti-inflammatory diet) (−0.114), while Jeju-do showed the highest E-DII score (0.154). When divided into six regions in South Korea, Jeju-do showed the highest E-DII, while Chungcheong-do and Gyeongsang-do showed the lowest E-DII. Participants who are residing in the Capital area had a significantly higher E-DII scores than in those participants who are residing in Gangwon-do and Gyeongsang-do, respectively (0.018 vs. −0.011 and −0.026; p values <0.05).
Table 2 presents the distributions of sociodemographic and lifestyle factors and E-DII scores based on the status of depression. Out of 15,929 adults, 4.2% had depression, with a notable difference that disfavored women (6.2%) compared with men (2.4%). Gender, age, household income, education, employment status, and drinking status all significantly differed by status of depression (all p values <0.05). Korean adults with depression were more likely to be women (69.6%), aged 50−64 years (34.4%), had the lowest quartile of household income (27.1%), had 7–12 years of education (46.7%), were unemployed (56.5%), and were nondrinkers (50.2%).
The mean and standard errors of the mean of the E-DII were calculated for study participants with or without depression stratified according to the six regions in South Korea as indicated in Table 3. There were no significant differences in E-DII score by status of depression. Smoking status, physical activity, BMI, regions, and E-DII score did not differ by status of depression.
The relationships of the E-DII with the risk of depression and depressive symptoms by six regions in South Korea are shown in Table 4. The study participants who lived in the Capital area and were in the highest E-DII tertile (who had the most pro-inflammatory diet) had significantly increased odds of having depression and depressive symptoms compared with those in the lowest E-DII tertile, after controlling for covariates (Adjusted odds ratio (AOR) 1.44, 95% CI: 1.04–1.99). Those adults who resided in Chungcheong-do and Jeju-do had significantly increased odds of having depression and depressive symptoms (AOR 2.97, 95% CI 1.36–6.52; AOR 4.06, 95% CI 1.56–10.53, respectively). Those who lived in Gangwon-do in the mid-tertile of E-DII had significantly higher odds of having depressing and depressive symptoms (AOR 3.64, 95% CI 1.40–9.48). However, no significant association was observed between E-DII and depression and depressive symptoms in the other regions, Jeolla-do and Gyeongsang-do.

4. Discussion

The present study found that the E-DII score among Korean adults differed by cities and provinces of South Korea. Korean adults who resided in the Capital area including Seoul, Incheon, and Gyeonggi-do, Chungcheong-do, and Jeju-do consumed pro-inflammatory diets were more likely to have depression and depressive symptoms. However, no association was found between E-DII score and depression and depressive symptoms in Jeolla-do and Gyeongsang-do. To the best of our knowledge, this is the first study to consider the regional differences when evaluating the association between DII and depression and depressive symptoms.
Using NHANES data, U.S. women with depressive symptoms demonstrated a higher DII than those without depressive symptoms [29]. In addition, in the Australian Longitudinal Study on Women’s Health, women who were in the lowest quartile of the DII had approximately 20% reduction in developing depression compared with those who were in the highest quartile of the DII [30]. In parallel with these findings, each standard deviation increase in the DII score was associated with 66% increased odds for recurrent depressive symptoms in the Whitehall II Study, which included a large cohort of British men and women [26]. Supporting this finding, Irish adults with a pro-inflammatory diet were associated with 70% increased odds of depressive symptoms, 60% higher odds of anxiety, and 38% lower odds of well-being compared with those with anti-inflammatory diets [27]. These study findings support that the pro-inflammatory diet is positively associated with the risk of depression and depressive symptoms, which is consistent with our findings on the positive association of the E-DII with depression and depressive symptoms among those who live in the Capital area, Chungcheong-do and Jeju-do.
Genetic factors play a key role in the etiology of depression [31,32]. IL-6 promoter’s single nucleotide polymorphisms rs1800795 contributed to the increased risk of inflammation in individuals with lower socioeconomic status through β-adrenergic activation of the cyclic AMP (cAMP)/protein kinase A (PKA) pathway of the erythroid transcription factor (GATA-1) [33]. As genetic polymorphisms interact with the dietary inflammation–depression relationship, future studies are warranted to evaluate the effects of the interactions between genetic variants and dietary inflammation on the effect of depression.
In the present study, we evaluated the regional differences of the E-DII across the six regions in South Korea. Korean adults in the Capital area had a significantly higher E-DII than those who live in Gangwon-do and Gyeongsang-do. This finding indicates that people who live in the Capital area are more likely to demonstrate a pro-inflammatory diet than those who live outside of the Capital area. Wirth et al. reported that a higher DII was associated with lower diet quality [34], and diet quality is influenced by socioeconomic status [35,36]. This implies that the DII is influenced by socioeconomic status such as income inequalities that exist by region and may be due, in part, to regional differences in rurality. Kim and Jeong [37] reported that income inequality in South Korea was due to the differences as demonstrated by the relatively very high income in the Seoul Metropolitan Area, which is the most developed region of the nation.
This study has several strengths. It relied on a nationally representative sample of Korean adults using KNHANES. In addition, we were able to evaluate the regional differences of the E-DII in South Korea and determined whether the relationship between the E-DII and depression and depressive symptoms differed across region using the Korean national sample. In addition, using a large sample size, we controlled for numerous confounders in the analysis. Although the study has many strengths, it also has several limitations. The E-DII score was calculated using a single 24-h recall, and this may not reflect an individual’s usual dietary intake. The E-DII score was calculated based on only 22 out of 45 food parameters. However, we previously validated the E-DII in relation to high-sensitivity CRP in Korean adults using the 2015 KNHANES that also used single 24-h recall data [20]. Moreover, there are imbalances in terms of the numbers of individuals across regions. Inevitably, this will result in differences in the statistical power across sampling units. Due to the cross-sectional study design of the KNHANES, the cause-effect relationship between the inflammatory potential of diet and depression and depressive symptoms cannot be drawn.
In conclusion, E-DII scores differed across six regions in South Korea and appeared to play a key role in the developing depression and depressive symptoms among individuals living in the Capital area, Chungcheong-do and Jeju-do. The present study provided evidence regarding the existence of regional disparities in different levels of dietary inflammation and differences in the association of the E-DII with depression and depressive symptoms.

Author Contributions

Conceptualization, D.S. and K.W.L.; methodology, D.S.; investigation, D.S. and K.W.L.; data curation, D.S.; formal analysis, D.S.; dietary inflammatory index calculation: N.S. and J.R.H.; visualization, D.S. and K.W.L.; supervision, K.W.L.; writing—original draft preparation, D.S. and K.W.L.; writing—review and editing, D.S., K.W.L, N.S., and J.R.H.; funding acquisition, D.S. All authors have read and agreed to the published version of the manuscript.

Funding

This research was supported by a fund by Research of Korea Centers for Disease Control and Prevention (Research Promotion Project for Investigation of Causes and Solutions of Regional Health Disparities) and Inha University Research Grant.

Conflicts of Interest

James R. Hébert owns controlling interest in Connecting Health Innovations LLC (CHI), a company that has licensed the right to his invention of the dietary inflammatory index (DII®) from the University of South Carolina in order to develop computer and smart phone applications for patient counseling and dietary intervention in clinical settings. Nitin Shivappa is an employee of CHI. The subject matter of this paper will not have any direct bearing on that work nor has that activity exerted any influence on this project.

References

  1. World Health Organization. Depression and Other Common Mental Disorders: Global Health Estimates; World Health Organization: Geneva, Switzerland, 2017. [Google Scholar]
  2. Kim, W.K.; Shin, D.; Song, W.O. Are dietary patterns associated with depression in US adults? J. Med. Food 2016, 19, 1074–1084. [Google Scholar] [CrossRef] [PubMed]
  3. Parletta, N.; Zarnowiecki, D.; Cho, J.; Wilson, A.; Bogomolova, S.; Villani, A.; Itsiopoulos, C.; Niyonsenga, T.; Blunden, S.; Meyer, B.; et al. A Mediterranean-style dietary intervention supplemented with fish oil improves diet quality and mental health in people with depression: A randomized controlled trial (HELFIMED). Nutr. Neurosci. 2019, 22, 474–487. [Google Scholar] [CrossRef] [PubMed] [Green Version]
  4. Cabello, M.; Miret, M.; Caballero, F.F.; Chatterji, S.; Naidoo, N.; Kowal, P.; D’Este, C.; Ayuso-Mateos, J.L. The role of unhealthy lifestyles in the incidence and persistence of depression: A longitudinal general population study in four emerging countries. Glob. Health 2017, 13, 18. [Google Scholar] [CrossRef] [PubMed] [Green Version]
  5. Skapinakis, P.; Lewis, G.; Araya, R.; Jones, K.; Williams, G. Mental health inequalities in Wales, UK: Multi-level investigation of the effect of area deprivation. Br. J. Psychiatry 2005, 186, 417–422. [Google Scholar] [CrossRef] [Green Version]
  6. Hodes, G.E.; Menard, C.; Russo, S.J. Integrating Interleukin-6 into depression diagnosis and treatment. Neurobiol. Stress 2016, 4, 15–22. [Google Scholar] [CrossRef] [Green Version]
  7. Anderson, G.; Kubera, M.; Duda, W.; Lason, W.; Berk, M.; Maes, M. Increased IL-6 trans-signaling in depression: Focus on the tryptophan catabolite pathway, melatonin and neuroprogression. Pharmacol. Rep. 2013, 65, 1647–1654. [Google Scholar] [CrossRef]
  8. Vogelzangs, N.; Duivis, H.E.; Beekman, A.T.; Kluft, C.; Neuteboom, J.; Hoogendijk, W.; Smit, J.H.; de Jonge, P.; Penninx, B.W. Association of depressive disorders, depression characteristics and antidepressant medication with inflammation. Transl. Psychiatry 2012, 2, e79. [Google Scholar] [CrossRef] [Green Version]
  9. Levine, J.; Barak, Y.; Chengappa, K.N.; Rapoport, A.; Rebey, M.; Barak, V. Cerebrospinal cytokine levels in patients with acute depression. Neuropsychobiology 1999, 40, 171–176. [Google Scholar] [CrossRef]
  10. Rethorst, C.D.; Bernstein, I.; Trivedi, M.H. Inflammation, obesity, and metabolic syndrome in depression: Analysis of the 2009-2010 National Health and Nutrition Examination Survey (NHANES). J. Clin. Psychiatry 2014, 75, e1428–e1432. [Google Scholar] [CrossRef] [Green Version]
  11. Kim, W.K.; Shin, D.; Song, W.O. Depression and its comorbid conditions more serious in women than in men in the United States. J. Womens Health 2015, 24, 978–985. [Google Scholar] [CrossRef]
  12. Khandaker, G.M.; Pearson, R.M.; Zammit, S.; Lewis, G.; Jones, P.B. Association of serum interleukin 6 and C-reactive protein in childhood with depression and psychosis in young adult life: A population-based longitudinal study. JAMA Psychiatry 2014, 71, 1121–1128. [Google Scholar] [CrossRef] [PubMed] [Green Version]
  13. Felger, J.C. Role of Inflammation in Depression and Treatment Implications. Handb. Exp. Pharmacol. 2019, 250, 255–286. [Google Scholar] [PubMed]
  14. Felger, J.C.; Lotrich, F.E. Inflammatory cytokines in depression: Neurobiological mechanisms and therapeutic implications. Neuroscience 2013, 246, 199–229. [Google Scholar] [CrossRef] [Green Version]
  15. Shivappa, N.; Steck, S.E.; Hurley, T.G.; Hussey, J.R.; Hebert, J.R. Designing and developing a literature-derived, population-based dietary inflammatory index. Public Health Nutr. 2014, 17, 1689–1696. [Google Scholar] [CrossRef] [Green Version]
  16. Ramallal, R.; Toledo, E.; Martinez-Gonzalez, M.A.; Hernandez-Hernandez, A.; Garcia-Arellano, A.; Shivappa, N.; Hebert, J.R.; Ruiz-Canela, M. Dietary Inflammatory Index and Incidence of Cardiovascular Disease in the SUN Cohort. PLoS ONE 2015, 10, e0135221. [Google Scholar] [CrossRef] [PubMed]
  17. Shivappa, N.; Steck, S.E.; Hurley, T.G.; Hussey, J.R.; Ma, Y.; Ockene, I.S.; Tabung, F.; Hebert, J.R. A population-based dietary inflammatory index predicts levels of C-reactive protein in the Seasonal Variation of Blood Cholesterol Study (SEASONS). Public Health Nutr. 2014, 17, 1825–1833. [Google Scholar] [CrossRef]
  18. Tabung, F.K.; Steck, S.E.; Zhang, J.; Ma, Y.; Liese, A.D.; Agalliu, I.; Hingle, M.; Hou, L.; Hurley, T.G.; Jiao, L. Construct validation of the dietary inflammatory index among postmenopausal women. Ann. Epidemiol. 2015, 25, 398–405. [Google Scholar] [CrossRef] [Green Version]
  19. Wirth, M.D.; Shivappa, N.; Davis, L.; Hurley, T.G.; Ortaglia, A.; Drayton, R.; Blair, S.N.; Hebert, J.R. Construct Validation of the Dietary Inflammatory Index among African Americans. J. Nutr. Health Aging 2017, 21, 487–491. [Google Scholar]
  20. Shin, D.; Lee, K.W.; Brann, L.; Shivappa, N.; Hebert, J.R. Dietary inflammatory index is positively associated with serum high-sensitivity C-reactive protein in a Korean adult population. Nutrition 2019, 63–64, 155–161. [Google Scholar]
  21. Burrows, K.; Stewart, J.L.; Antonacci, C.; Kuplicki, R.; Thompson, K.; Taylor, A.; Teague, T.K.; Paulus, M.P. Association of poorer dietary quality and higher dietary inflammation with greater symptom severity in depressed individuals with appetite loss. J. Affect. Disord. 2020, 263, 99–106. [Google Scholar] [CrossRef]
  22. Bergmans, R.S.; Malecki, K.M. The association of dietary inflammatory potential with depression and mental well-being among U.S. adults. Prev. Med. 2017, 99, 313–319. [Google Scholar] [CrossRef] [PubMed]
  23. Jorgensen, D.; White, G.E.; Sekikawa, A.; Gianaros, P. Higher dietary inflammation is associated with increased odds of depression independent of Framingham Risk Score in the National Health and Nutrition Examination Survey. Nutr. Res. 2018, 54, 23–32. [Google Scholar] [CrossRef] [PubMed]
  24. Adjibade, M.; Lemogne, C.; Touvier, M.; Hercberg, S.; Galan, P.; Assmann, K.E.; Julia, C.; Kesse-Guyot, E. The Inflammatory Potential of the Diet is Directly Associated with Incident Depressive Symptoms Among French Adults. J. Nutr. 2019, 149, 1198–1207. [Google Scholar] [CrossRef] [PubMed]
  25. Shivappa, N.; Hebert, J.R.; Veronese, N.; Caruso, M.G.; Notarnicola, M.; Maggi, S.; Stubbs, B.; Firth, J.; Fornaro, M.; Solmi, M. The relationship between the dietary inflammatory index (DII®) and incident depressive symptoms: A longitudinal cohort study. J. Affect. Disord. 2018, 235, 39–44. [Google Scholar] [CrossRef] [PubMed] [Green Version]
  26. Akbaraly, T.; Kerlau, C.; Wyart, M.; Chevallier, N.; Ndiaye, L.; Shivappa, N.; Hebert, J.R.; Kivimaki, M. Dietary inflammatory index and recurrence of depressive symptoms: Results from the Whitehall II Study. Clin. Psychol. Sci. 2016, 4, 1125–1134. [Google Scholar] [CrossRef] [Green Version]
  27. Phillips, C.M.; Shivappa, N.; Hebert, J.R.; Perry, I.J. Dietary inflammatory index and mental health: A cross-sectional analysis of the relationship with depressive symptoms, anxiety and well-being in adults. Clin. Nutr. 2018, 37, 1485–1491. [Google Scholar] [CrossRef]
  28. Han, A.L.; Shin, S.R. Relationship between dietary intake and depression in metabolic syndrome among Korean adults: Korea National Health and Nutrition Examination Survey 2014. J. Agric. Med. Community Health 2017, 42, 79. [Google Scholar]
  29. Wirth, M.D.; Shivappa, N.; Burch, J.B.; Hurley, T.G.; Hébert, J.R. The Dietary Inflammatory Index, shift work, and depression: Results from NHANES. Health Psychol. 2017, 36, 760. [Google Scholar] [CrossRef]
  30. Shivappa, N.; Schoenaker, D.A.; Hebert, J.R.; Mishra, G.D. Association between inflammatory potential of diet and risk of depression in middle-aged women: The Australian Longitudinal Study on Women’s Health. Br. J. Nutr. 2016, 116, 1077–1086. [Google Scholar] [CrossRef] [Green Version]
  31. Kendler, K.S.; Gardner, C.; Neale, M.; Prescott, C. Genetic risk factors for major depression in men and women: Similar or different heritabilities and same or partly distinct genes? Psychol. Med. 2001, 31, 605–616. [Google Scholar] [CrossRef]
  32. Demirkan, A.; Penninx, B.W.; Hek, K.; Wray, N.R.; Amin, N.; Aulchenko, Y.S.; Van Dyck, R.; de Geus, E.J.; Hofman, A.; Uitterlinden, A.G. Genetic risk profiles for depression and anxiety in adult and elderly cohorts. Mol. Psychiatry 2011, 16, 773–783. [Google Scholar] [CrossRef] [PubMed]
  33. Cole, S.W.; Arevalo, J.M.G.; Takahashi, R.; Sloan, E.K.; Lutgendorf, S.K.; Sood, A.K.; Sheridan, J.F.; Seeman, T.E. Computational identification of gene–social environment interaction at the human IL6 locus. Proc. Natl. Acad. Sci. USA 2010, 107, 5681–5686. [Google Scholar] [CrossRef] [PubMed] [Green Version]
  34. Wirth, M.D.; Hebert, J.R.; Shivappa, N.; Hand, G.A.; Hurley, T.G.; Drenowatz, C.; McMahon, D.; Shook, R.P.; Blair, S.N. Anti-inflammatory Dietary Inflammatory Index scores are associated with healthier scores on other dietary indices. Nutr. Res. 2016, 36, 214–219. [Google Scholar] [CrossRef] [PubMed] [Green Version]
  35. Drewnowski, A.; Aggarwal, A.; Hurvitz, P.M.; Monsivais, P.; Moudon, A.V. Obesity and supermarket access: Proximity or price? Am. J. Public Health 2012, 102, e74–e80. [Google Scholar] [CrossRef] [PubMed]
  36. Darmon, N.; Drewnowski, A. Does social class predict diet quality? Am. J. Clin. Nutr. 2008, 87, 1107–1117. [Google Scholar] [CrossRef] [PubMed] [Green Version]
  37. Kim, E.; Jeong, Y.H. Decomposition of regional income inequality in Korea. Rev. Reg. Stud. 2003, 33, 313–327. [Google Scholar]
Figure 1. Flow chart of study participants.
Ijerph 17 03205 g001
Figure 2. Mean energy-ajusted dietary inflammatory index (E-DII) score by (A) 16 cities and provinces and (B) 6 regions.
Ijerph 17 03205 g002
Table 1. Distributions of sociodemographic and lifestyle factors by tertiles of energy-adjusted dietary inflammatory index (E-DII).
E-DII
Tertile 1 (n = 5309)Tertile 2 (n = 5310)Tertile 3 (n = 5310)Total
nWt’d %nWt’d %nWt’d %np Value 1
Gender
Men199843.5240552.6279860.37201<0.0001
Women331156.5290547.4251239.78728
Age (year)
19–2931510.055916.4107529.41949<0.0001
30–49176639.3192841.3203341.95727
50–64189934.0158227.7111317.74594
≥65132916.7124114.5108910.93659
Household income
Low81912.389112.7102614.72736<0.0001
Middle low124721.4131822.9134825.23913
Middle high151130.1150831.3149029.34509
High 173236.2159333.1144630.84771
Education
≤Elementary school84911.292011.38919.92660<0.0001
Middle/high school225340.4207836.7183431.76165
≥College220748.4231252.1258558.47104
Employment status (n = 15,906)
Blue-collar Worker 2194040.8198942.8205744.25986<0.0001
White-collar Worker 3115721.2129823.9129922.93754
Unemployed220837.9201533.3194332.86166
Drinking status
Nondrinker237940.6216537.0178229.06326<0.0001
1–4 times/month192439.3191538.4195940.95798
≥2 times/week100620.1123024.7156930.03805
Smoking status
Nonsmoker466984.8438778.6396170.713,017<0.0001
Current smoker64015.292321.4134929.32912
Physical activity 4
No266246.5284748.8280747.983160.16
Yes264753.5246351.2250352.17613
BMI (kg/m2)
<18.51663.42184.32605.16440.0002
18.5–22.9215340.3201738.3209439.76264
23–24.9131524.5124422.9115821.53717
≥25167531.7183134.5179833.75304
Region
Capital area272854.1275456.0274156.182230.36
Gangwon-do1852.72193.11792.6583
Chungcheong-do5849.35929.55618.51737
Jella-do4858.54488.04958.51428
Gyeongsang-do123724.7119222.5122923.33658
Jeju-do900.81050.91051.0300
1 Chi-square test. 2 Blue-collar workers were craft and related trades workers, drivers, plant and machine operators, assemblers, elementary occupation workers. 3 White-collar workers were chief executives, senior officials, legislators, managers, professionals, and technicians. 4 Physical activity was defined as meeting minimum criterion of the World Health Organization’s (2010) global physical activity recommendation: 150 min of moderate-intensity physical activity, 75 min of vigorous-intensity physical activity, or an equivalent volume of moderate- to vigorous-intensity physical activity (i.e., 600 METs minutes/week); Wt’d %: weighted percentage.
Table 2. Distributions of sociodemographic, lifestyle factor, and energy-adjusted dietary inflammatory index (E-DII) scores based on the status of depression.
No Depression
(n = 15,177; 95.8%)
Depression
(n = 752; 4.2%)
nWt’d %nWt’d %p Value 1
Gender
Men702453.617730.4<0.0001
Women815346.457569.6
Age (year)
19–29189119.55813.7<0.0001
30–49554441.418331.1
50–64431925.627534.4
≥65342313.623620.9
Household income
Low250112.723527.1<0.0001
Middle low371423.119926.8
Middle high436130.614821.0
High460133.617025.1
Education
≤Elementary school244310.321719.7<0.0001
Middle/high school583235.533346.7
≥College690254.120233.6
Employment status
Blue-collar worker 2583843.514825.2<0.0001
White-collar worker 3361022.914418.3
Unemployed570633.646056.5
Drinking status
Nondrinker590334.542350.2<0.0001
1–4 times/month559040.020830.5
≥2 times/week368425.512119.3
Smoking status
Nonsmoker12,39077.562778.90.46
Current smoker278722.512521.1
Physical activity 4
No789947.741749.10.53
Yes727852.333550.9
BMI (kg/m2)
<18.56114.3335.70.11
18.5–22.9598839.527636.8
23–24.9355323.016420.8
≥25502533.227936.8
Region
Capital area785055.537355.20.62
Gangwon-do5512.8323.3
Chungcheong-do16449.1938.6
Jella-do13718.4576.8
Gyeongsang-do347723.418125.0
Jeju-do2840.9161.2
E-DII
Tertile 1505830.225131.50.80
Tertile 2505433.125632.8
Tertile 3506536.724535.7
1 Chi-square test. 2 Blue-collar workers were craft and related trades workers, drivers, plant and machine operators, assemblers, elementary occupation workers. 3 White-collar workers were chief executives, senior officials, legislators, managers, professionals, and technicians. 4 Physical activity was defined as meeting the minimum criterion of the World Health Organization’s (2010) global physical activity recommendation: 150 min of moderate-intensity physical activity, 75 min of vigorous-intensity physical activity, or an equivalent volume of moderate- to vigorous-intensity physical activity (i.e., 600 METs minutes/week); Wt’d %: weighted percentage.
Table 3. Mean energy-adjusted dietary inflammatory index (E-DII) scores between study participants with or without depression.
RegionNo Depression
(n = 15,177; 95.8%)
Depression
(n = 752; 4.2%)
p Value 1
Capital area 2 (n = 8223)0.021 ± 0.0211−0.051 ± 0.0830.38
Gangwon-do (n = 583)0.005 ± 0.060−0.325 ± 0.2720.26
Chungcheong-do (n = 1737)−0.041 ± 0.0530.147 ± 0.1580.22
Jeolla-do (n = 1428)0.001 ± 0.054−0.085 ± 0.2350.73
Gyeongsang-do (n = 3658)−0.028 ± 0.0370.027 ± 0.1530.72
Jeju-do (n = 300)0.144 ± 0.1510.328 + 0.3440.66
Data are presented as mean ± standard error of the mean. 1 p value based on t-test statistics. 2 Capital area includes Seoul, Incheon, and Gyeonggi-do.
Table 4. Associations of energy-adjusted dietary inflammatory index (E-DII) scores with the risk of depression and depressive symptoms by six regions in Korea.
RegionE-DII
Tertile 1Tertile 2Tertile 3
Capital area (n = 8223)1.00 (Ref.)1.22 (0.89–1.68)1.44 (1.04–1.99) *
Gangwon-do (n = 583)1.00 (Ref.)3.64 (1.40–9.48) *1.57 (0.57–4.33)
Chungcheong-do (n = 1737)1.00 (Ref.)1.92 (0.97–3.80)2.97 (1.36–6.52) *
Jeolla-do (n = 1428)1.00 (Ref.)0.87 (0.52–1.47)1.60 (0.88–2.90)
Gyeongsang-do (n = 3658)1.00 (Ref.)1.05 (0.73–1.51)0.96 (0.63–1.47)
Jeju-do (n = 300)1.00 (Ref.)3.61 (0.93–13.99)4.06 (1.56–10.53) *
Data are presented as adjusted odds ratios and 95% confidence intervals. Tertile 1 was set as a reference point. All models were adjusted for age, gender, education, occupation, alcohol consumption, smoking status, physical activity, and BMI. * p value < 0.05.

