Application of Process Intensification in the Treatment of Pit Latrine Sludge from Informal Settlements in Blantyre City, Malawi


Abstract
:1. Introduction
2. Materials and Methods
2.1. Study Area
2.2. Experimental Design
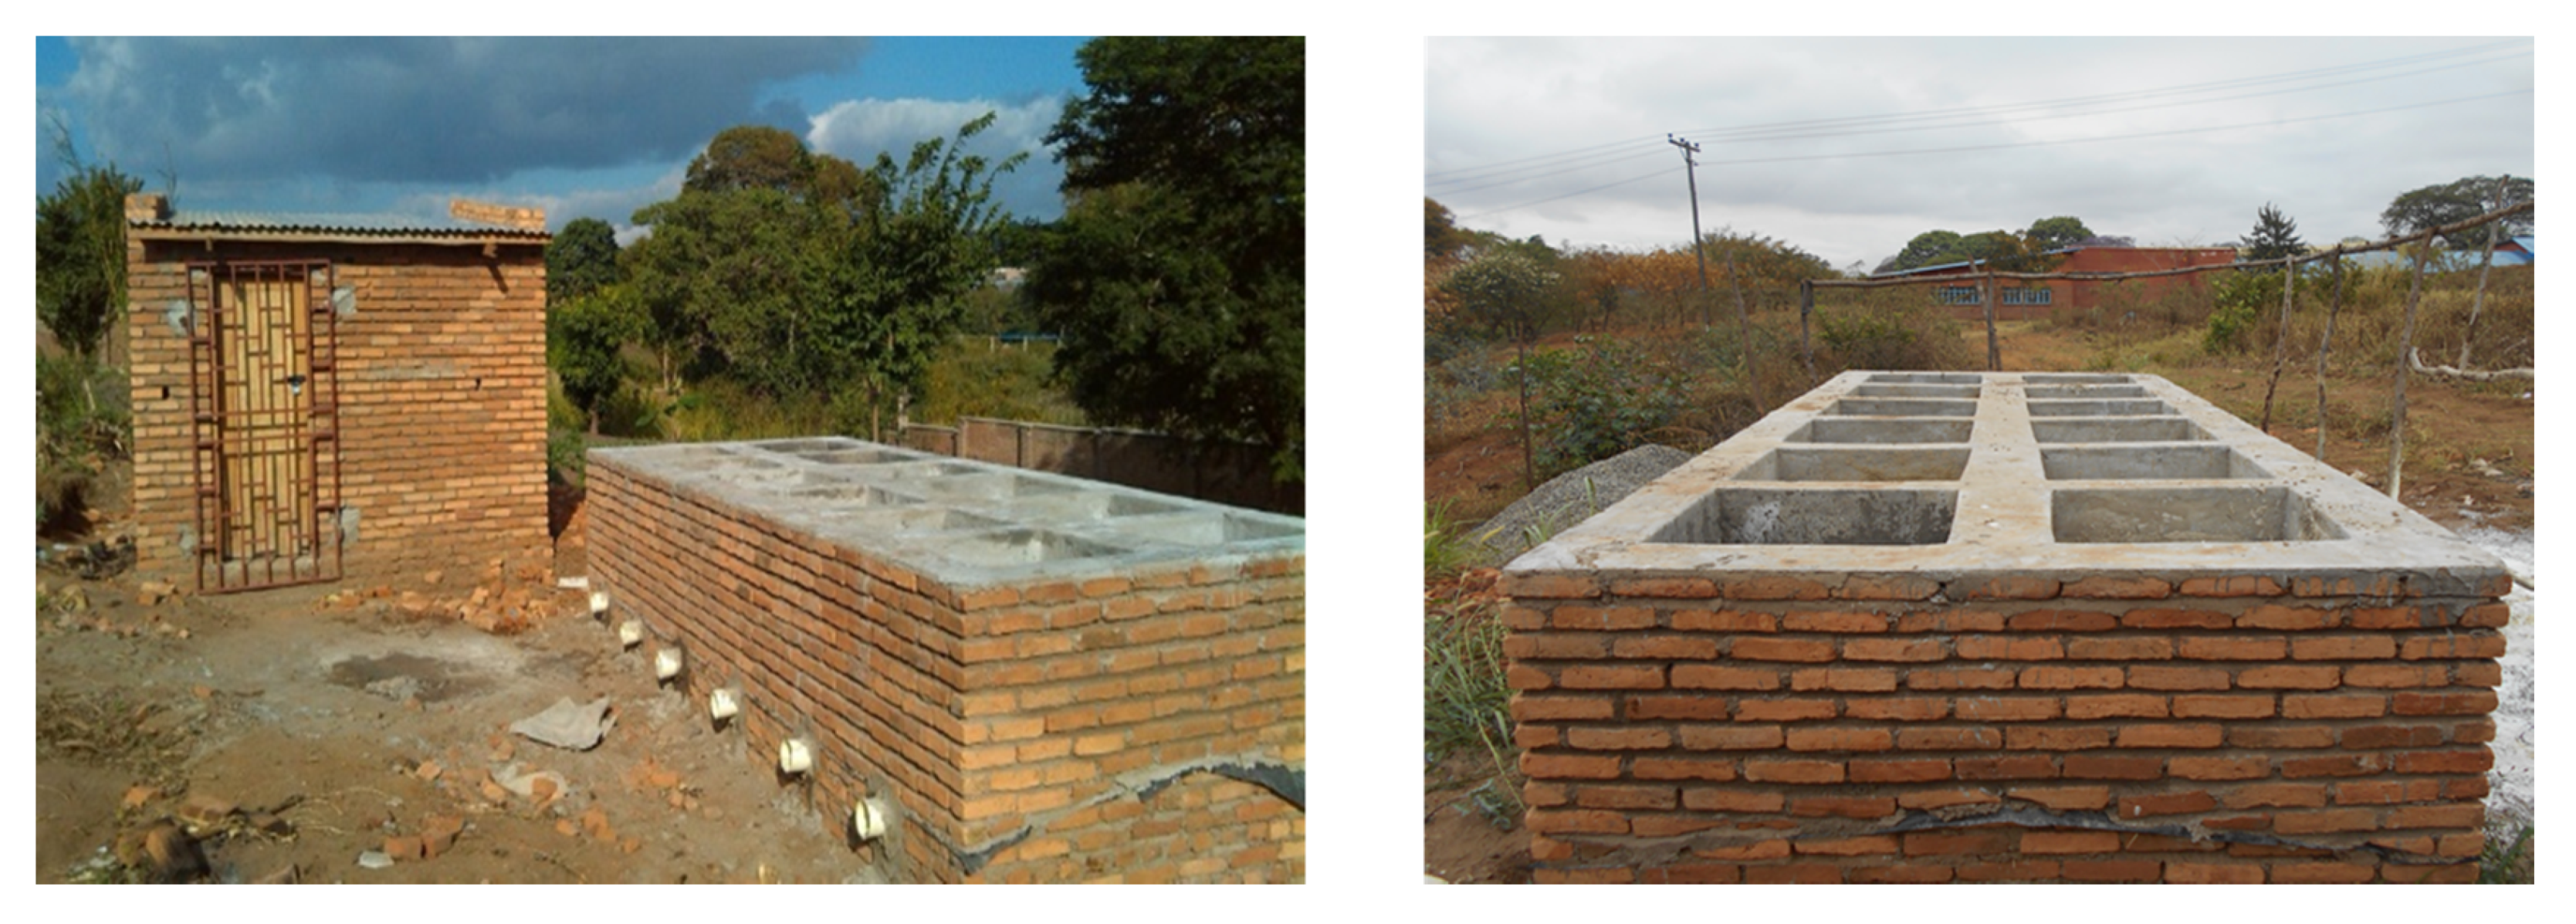
2.3. Drying Bed Prototype Design
2.4. Loading and Sampling from the Intensified System
2.5. Laboratory Analyses
2.6. Data Analysis
2.6.1. Sieve Analysis/Particle Size Distribution
2.6.2. Determination of Sludge Dewatering Cycle Time
2.6.3. Determination of Sludge Solids Loading Rates
2.6.4. Treatment Land Area Requirement Reduction
2.7. Ethical Approval
3. Results
3.1. Drying Bed Filter Material Characteristics
3.2. Sludge Additives Characteristics
3.3. Raw Sludge Characteristics
3.4. pH in Treatments and Control
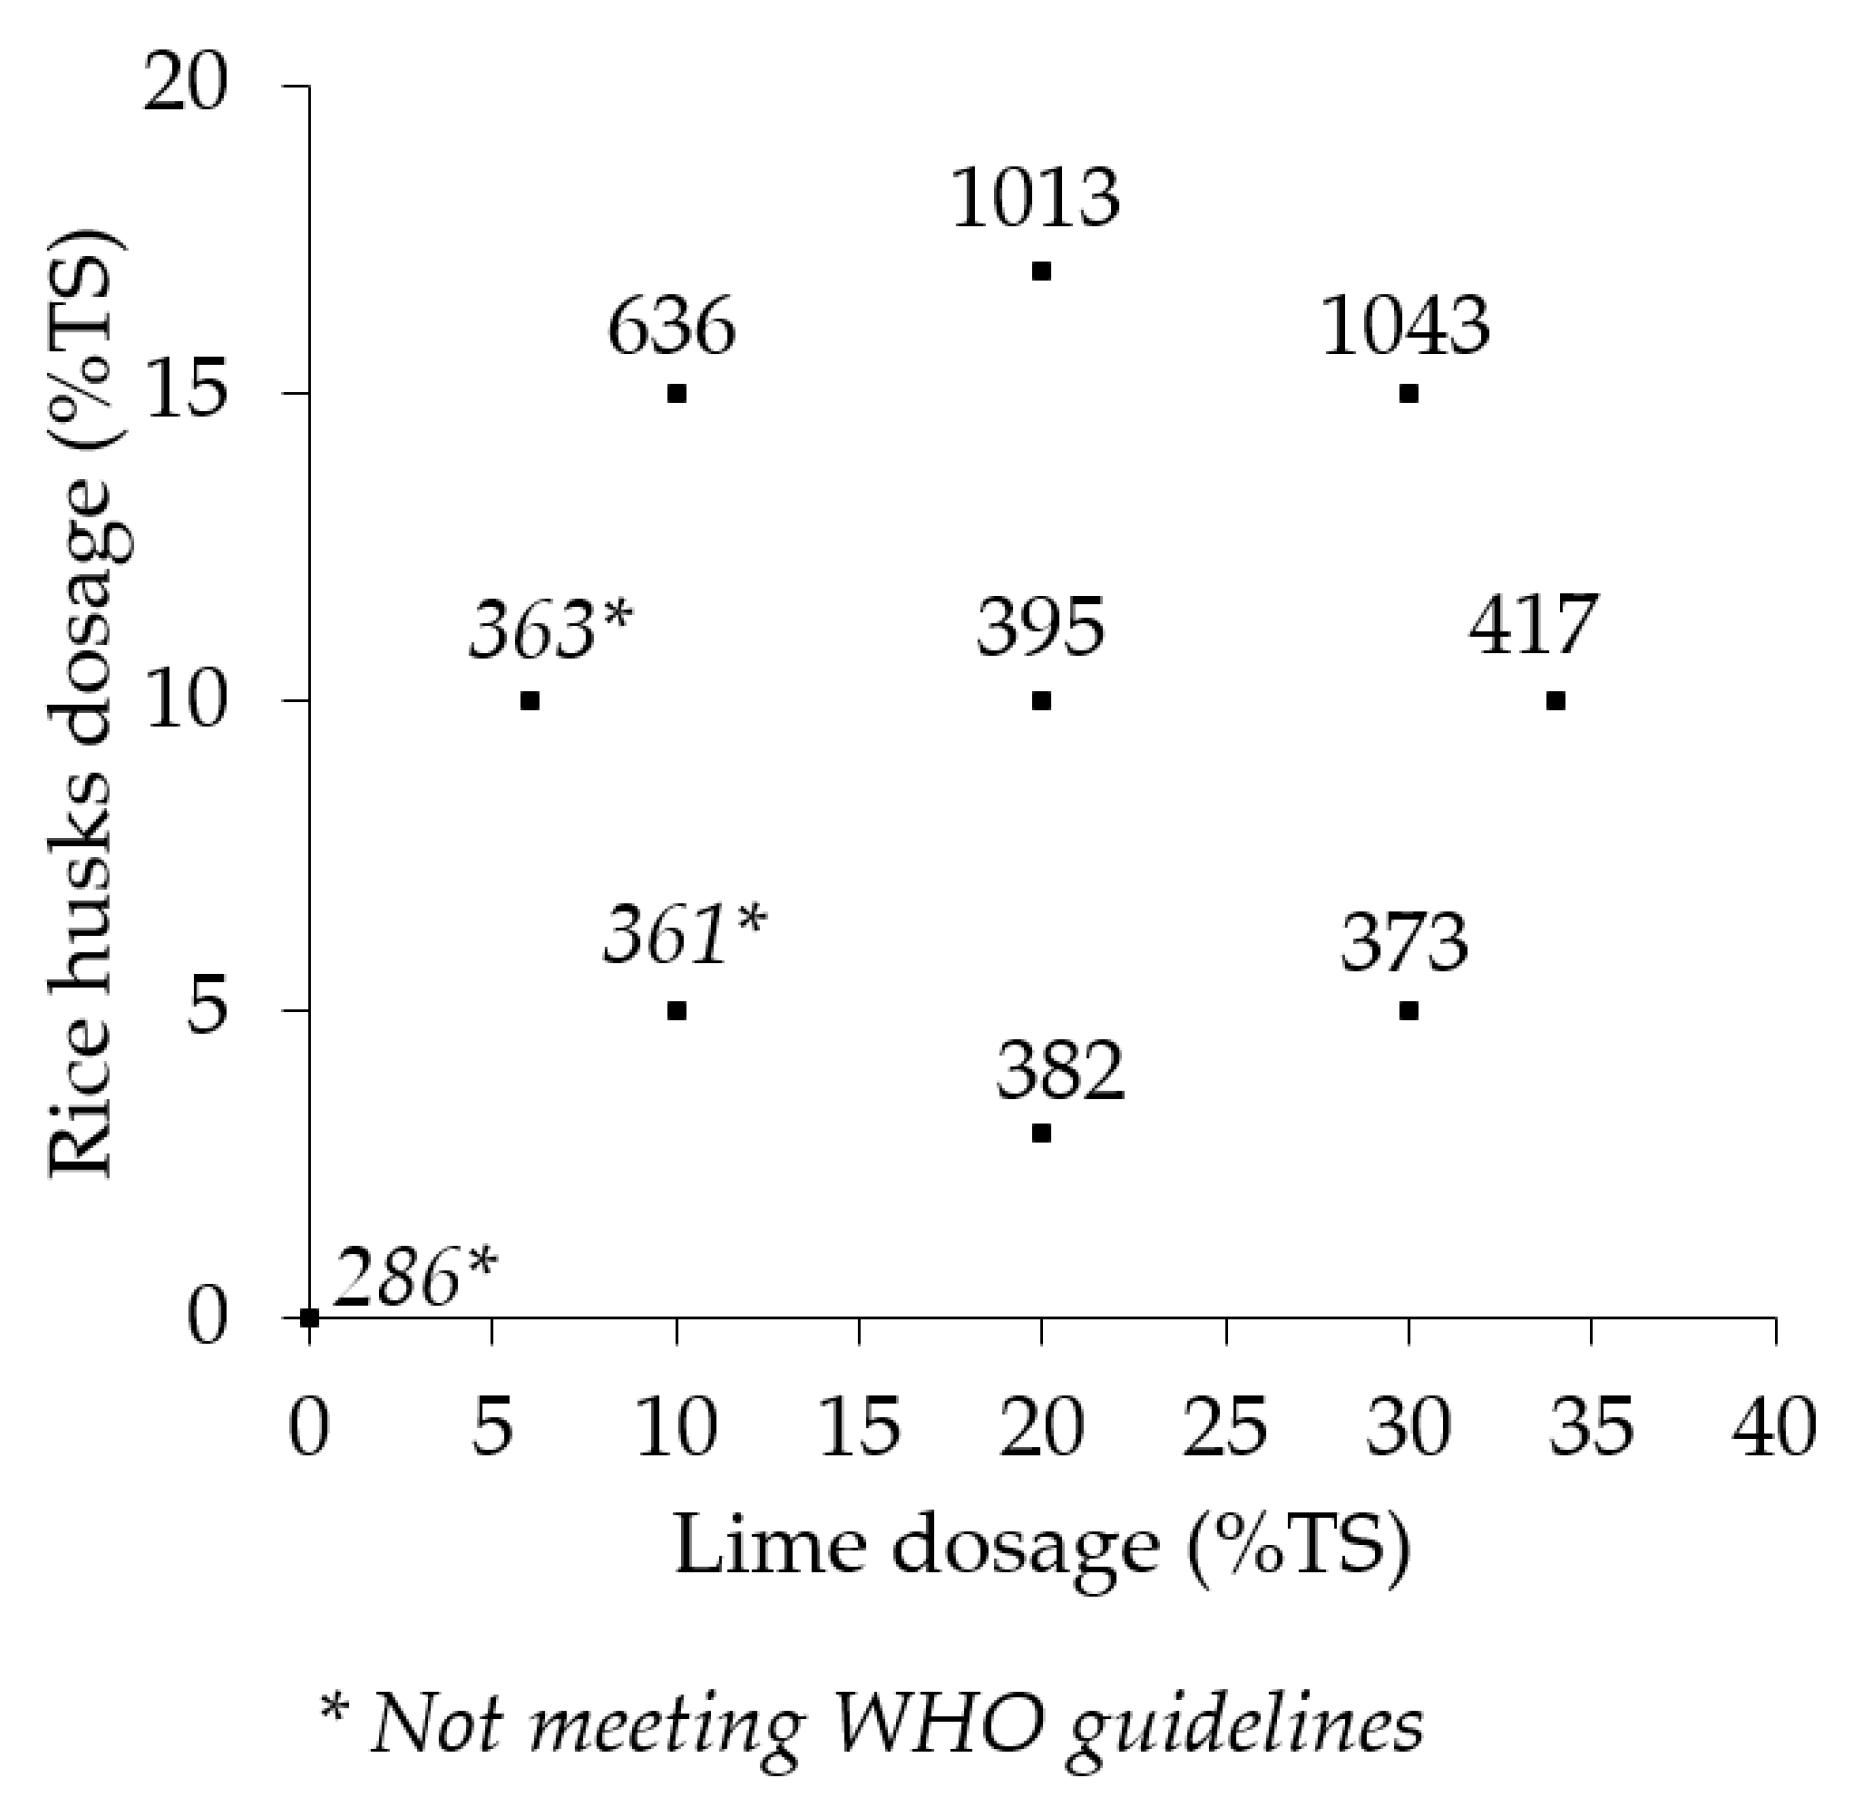
3.5. Total Ammoniacal Nitrogen
3.6. Moisture Content
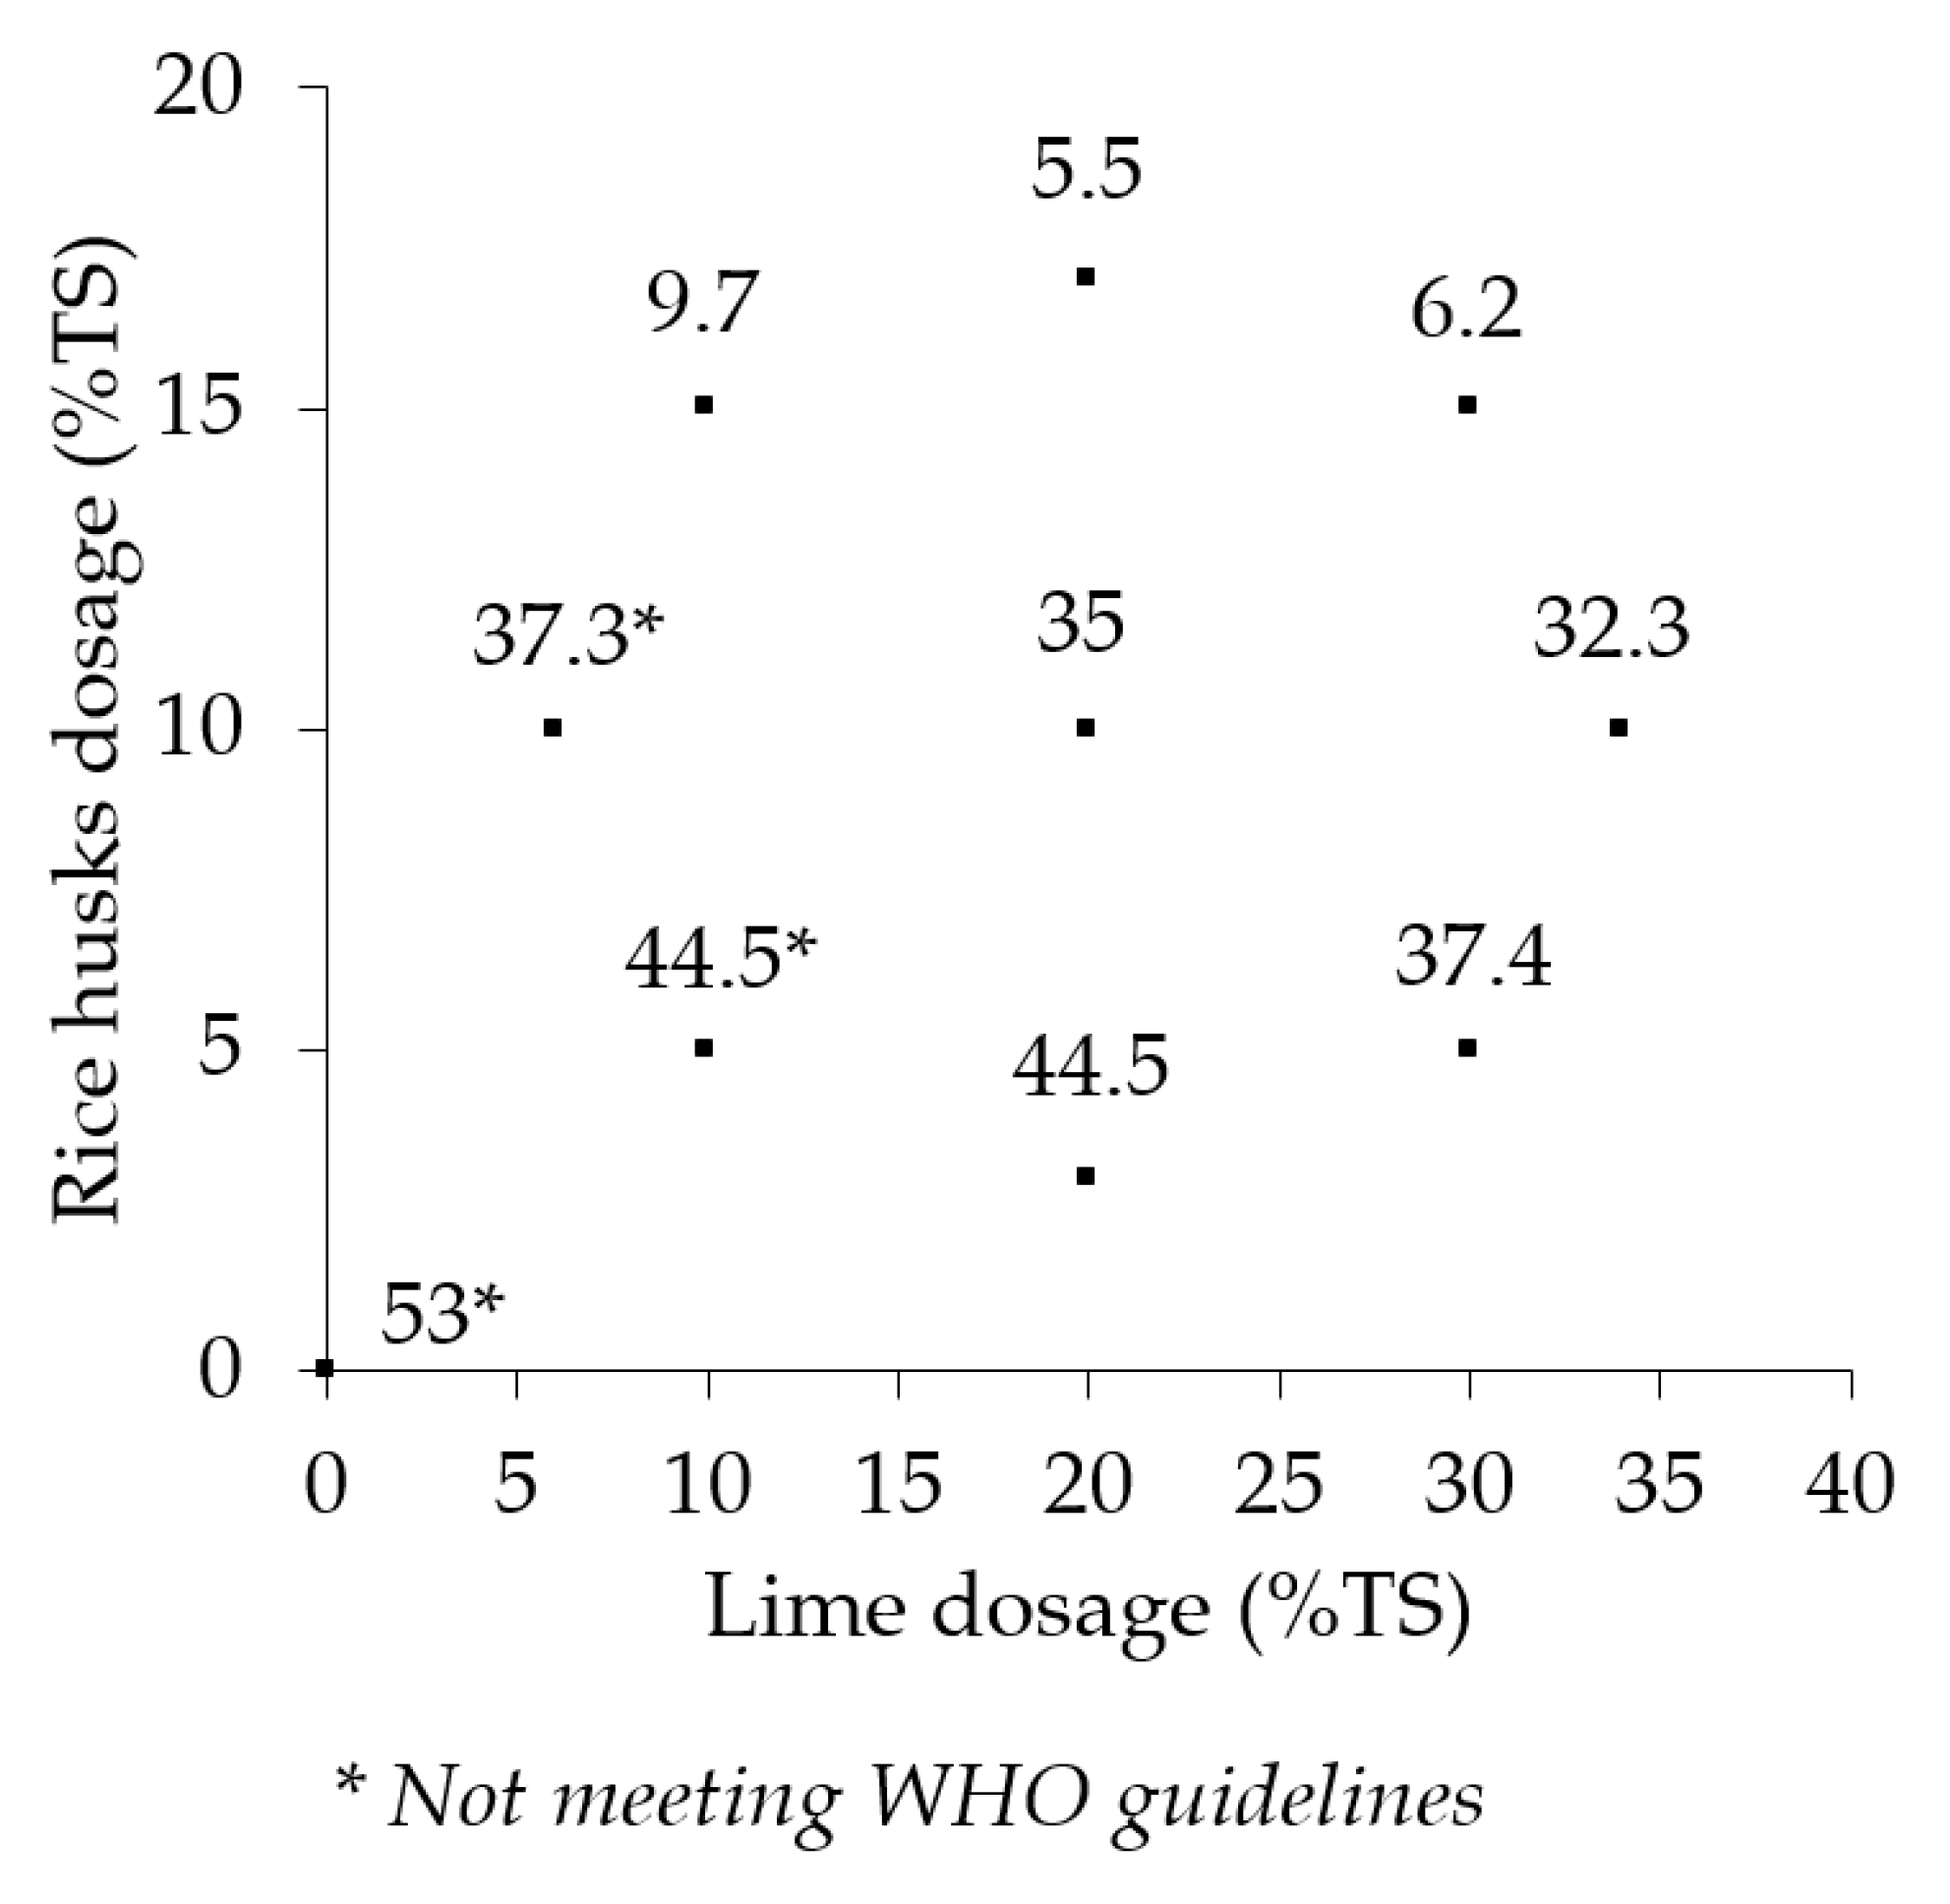
3.7. Total Solids
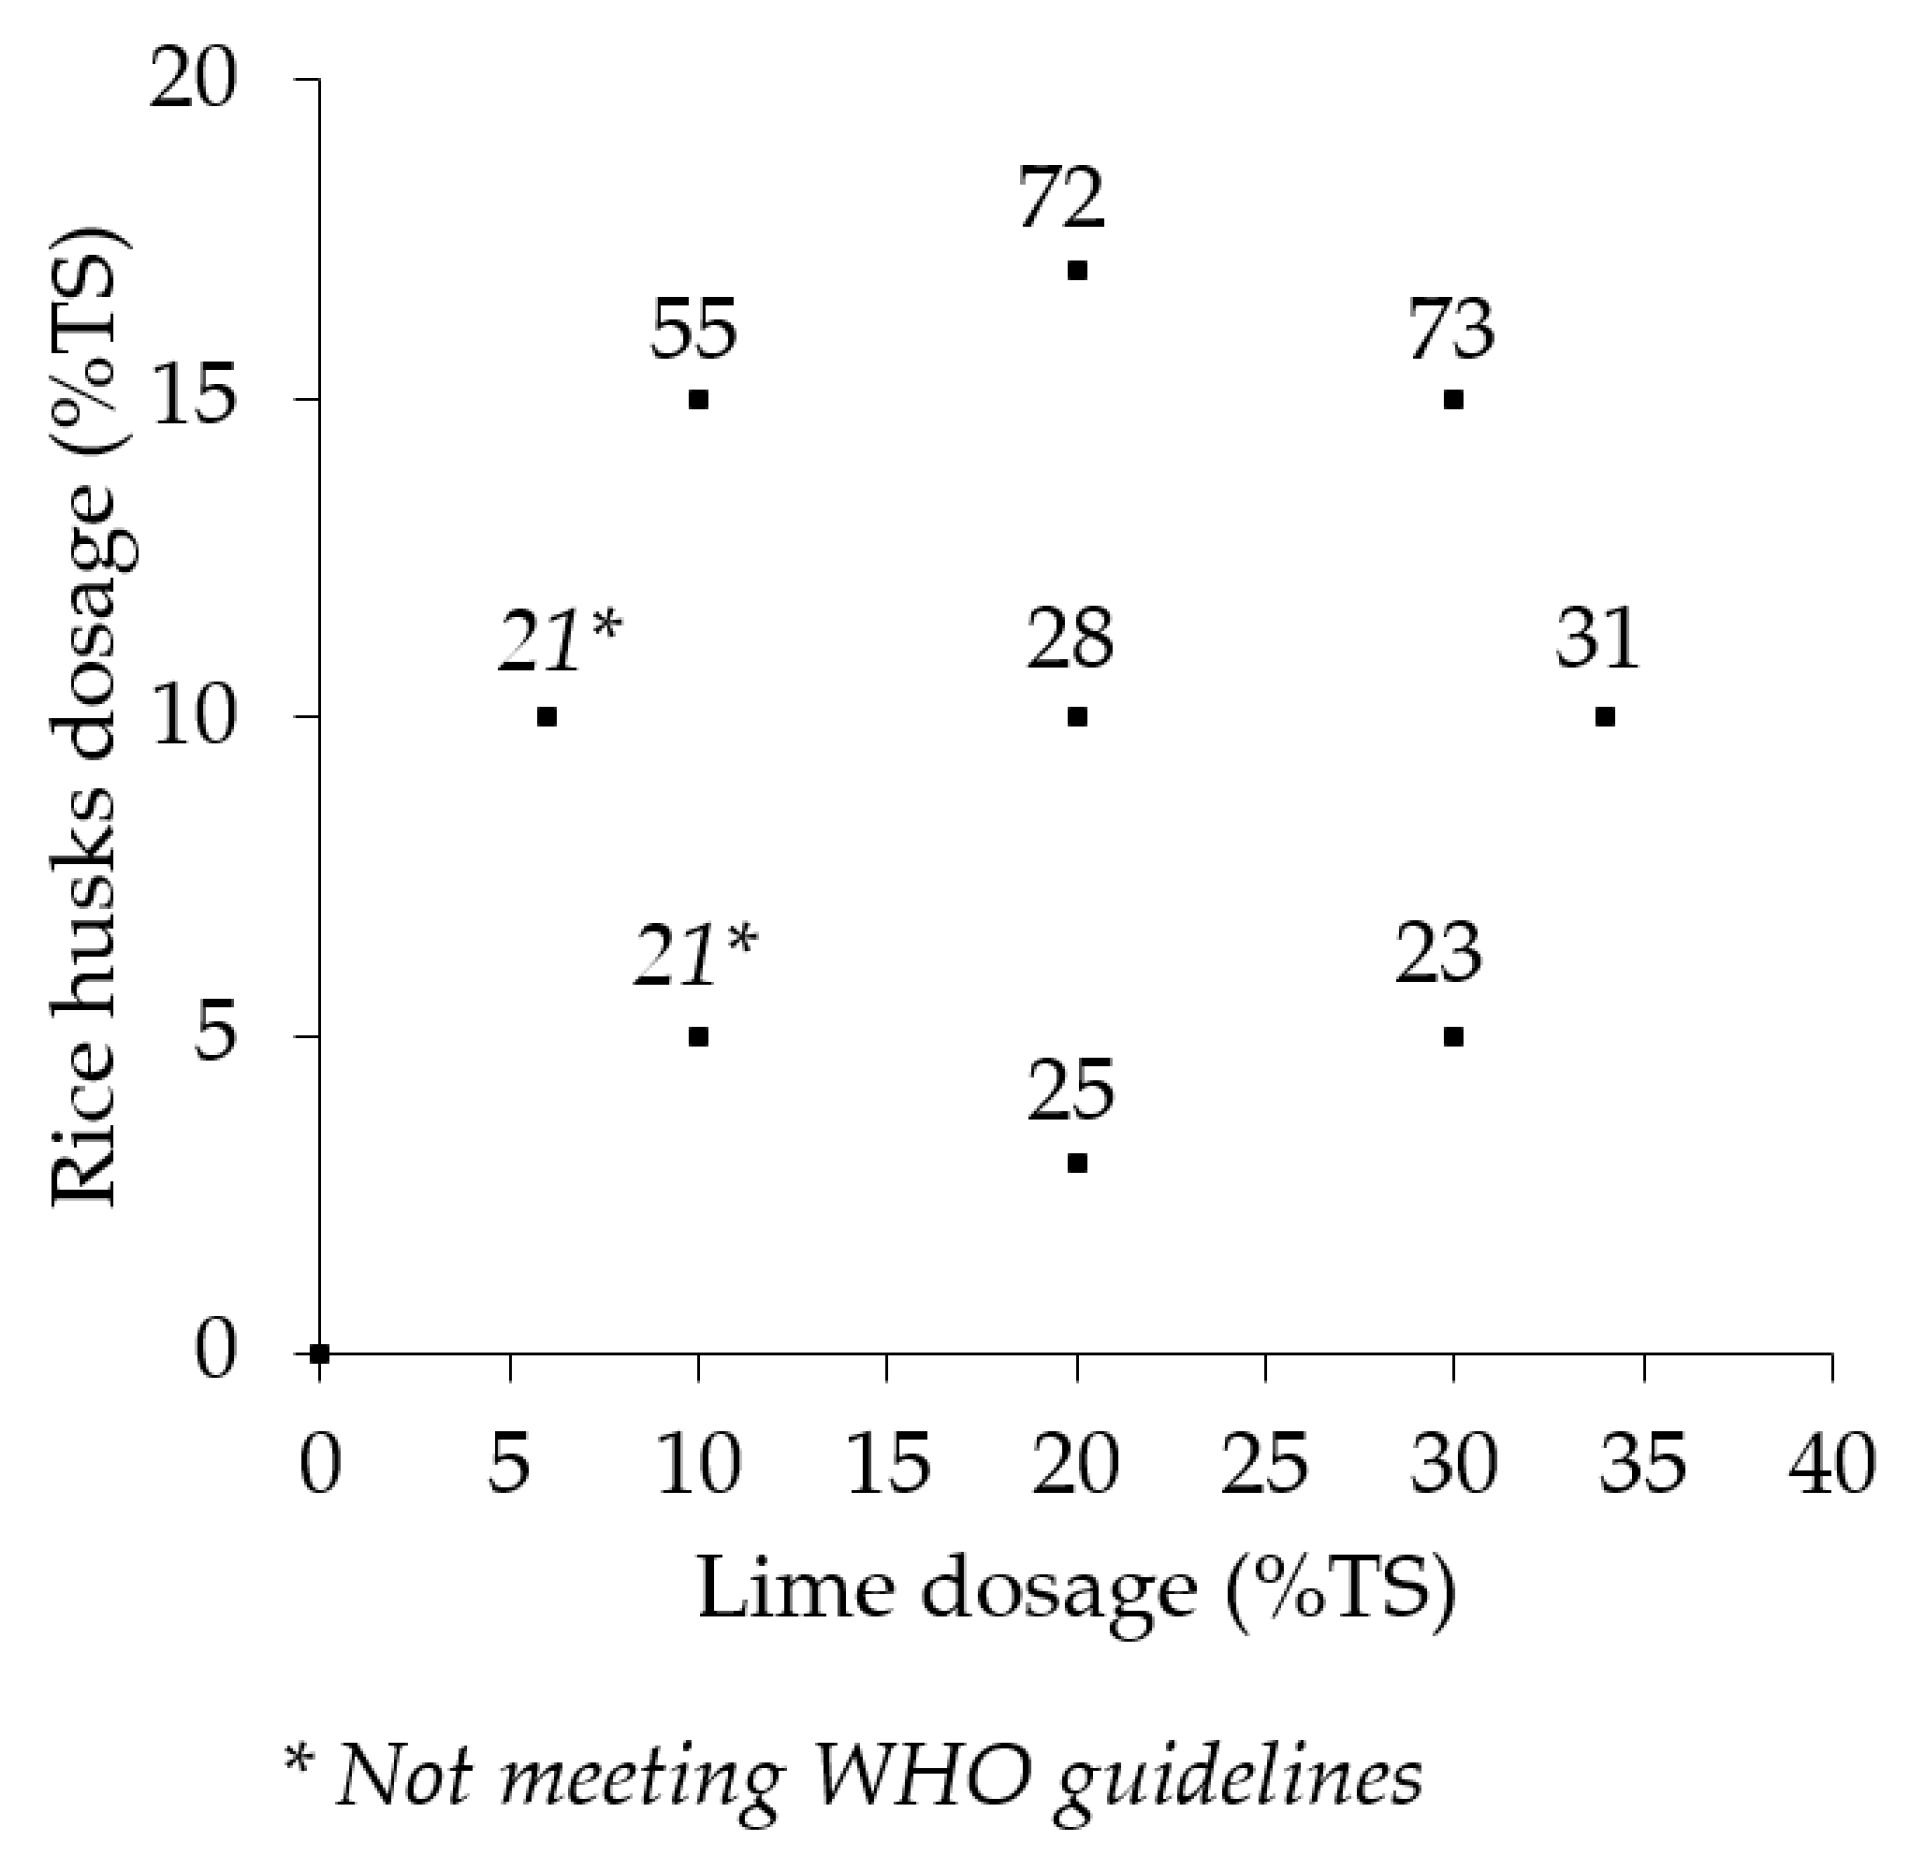
3.8. E. coli
3.9. Salmonella
3.10. Sludge Dewatering Cycle Time
3.11. Sludge Solids Loading Rates
3.12. Treatment Land Area Requirement Reduction
4. Discussion
4.1. Physical and Hydraulic Characteristics of the Intensified System Materials
4.2. Total Time to Attain Dewatering and Sanitization
4.3. Sludge Solids Loading Rates
4.4. Treatment Land Area Requirement Reduction
5. Conclusions
Author Contributions
Funding
Acknowledgments
Conflicts of Interest
References
- Taweesan, A.; Koottatep, T.; Dongo, K. Factors influencing the performance of faecal sludge management services: Case study in Thailand municipalities. Environ. Dev. Sustain. 2017, 19, 125–140. [Google Scholar] [CrossRef]
- Tayler, K. Faecal Sludge and Septage Treatment: A Guide for Low and Middle Income Countries; Practical Action Publishing: Rugby, UK, 2018. [Google Scholar]
- Massoud, M.A.; Tarhini, A.; Nasr, J.A. Decentralized approaches to wastewater treatment and management: Applicability in developing countries. J. Environ. Manag. 2009, 90, 652–659. [Google Scholar] [CrossRef]
- Bakare, B.F.; Foxon, K.M.; Brouckaert, C.J.; Buckley, C.A. Variation in VIP latrine sludge contents. Water SA 2012, 38, 479–486. [Google Scholar] [CrossRef] [Green Version]
- Blackett, I.; Hawkins, P.; Heymans, C. The Missing Link in Sanitation Service Delivery: A Review of Fecal Sludge Management in 12 Cities; WSP-World Bank Research Brief: Washington, DC, USA, 2014. [Google Scholar]
- Singh, S.; Haberl, R.; Moog, O.; Shrestha, R.R.; Shrestha, P.; Shrestha, R. Performance of an anaerobic baffled reactor and hybrid constructed wetland treating high-strength wastewater in Nepal—A model for DEWATS. Ecol. Eng. 2009, 35, 654–660. [Google Scholar] [CrossRef]
- Strauss, M.; Larmie, S.A.; Heinss, U. Treatment of sludges from on-site sanitation-Low-cost options. Water Sci. Technol. 1997, 35, 129–136. [Google Scholar] [CrossRef]
- Strande, L.; Brdjanovic, D. Faecal Sludge Management: Systems Approach for Implementation and Operation; IWA Publishing: London, UK, 2014. [Google Scholar]
- Coward, T.; Tribe, H.; Harvey, A.P. Opportunities for process intensification in the UK water industry: A review. J. Water Process. Eng. 2018, 21, 116–126. [Google Scholar] [CrossRef] [Green Version]
- Stankiewicz, A.I.; Moulijn, J.A. Process intensification: Transforming chemical engineering. Chem. Eng. Prog. 2000, 96, 22–34. [Google Scholar]
- Van Gerven, T.; Stankiewicz, A. Structure, energy, synergy, time-The fundamentals of process intensification. Ind. Eng. Chem. Res. 2009, 48, 2465–2474. [Google Scholar] [CrossRef]
- Von Münch, E.; Mayumbelo, K.M.K. Methodology to compare costs of sanitation options for low-income peri-urban areas in Lusaka, Zambia. Water SA 2007, 33, 593–602. [Google Scholar]
- Kvarnström, E.; McConville, J.; Bracken, P.; Johansson, M.; Fogde, M. The sanitation ladder-a need for a revamp? J. Water Sanit. Hyg. Dev. 2011, 1, 3–12. [Google Scholar] [CrossRef]
- Katukiza, A.Y.; Ronteltap, M.; Niwagaba, C.B.; Foppen, J.W.A.; Kansiime, F.P.N.L.; Lens, P.N.L. Sustainable sanitation technology options for urban slums. Biotechnol. Adv. 2012, 964–978. [Google Scholar] [CrossRef] [PubMed]
- Van Dijk, M.P.; Etajak, S.; Mwalwega, B.; Ssempebwa, J. Financing sanitation and cost recovery in the slums of Dar es Salaam and Kampala. Habitat Int. 2014, 43, 206–213. [Google Scholar] [CrossRef] [Green Version]
- Lutze, P.; Gani, R.; Woodley, J.M. Process intensification: A perspective on process synthesis. Chem. Eng. Process. Process. Intensif. 2010, 49, 547–558. [Google Scholar] [CrossRef]
- Qiu, Z.; Zhao, L.; Weatherley, L. Process intensification technologies in continuous biodiesel production. Chem. Eng. Process. Process. Intensif. 2010, 49, 323–330. [Google Scholar] [CrossRef]
- Rao, D.P.; Bhowal, A.; Goswami, P.S. Process intensification in rotating packed beds (HIGEE): An appraisal. Ind. Eng. Chem. Res. 2004, 43, 1150–1162. [Google Scholar] [CrossRef]
- Drioli, E.; Stankiewicz, A.I.; Macedonio, F. Membrane engineering in process intensification—An overview. J. Membr. Sci. 2011, 380, 1–8. [Google Scholar] [CrossRef]
- Pekdemir, T.; Keskinler, B.; Yildiz, E.; Akay, G. Process intensification in wastewater treatment: Ferrous iron removal by a sustainable membrane bioreactor system. J. Chem. Technol. Biotechnol. 2003, 78, 773–780. [Google Scholar] [CrossRef]
- Keskinler, B.; Akay, G.; Pekdemir, T.; Yildiz, E.; Nuhoglu, A. Process intensification in wastewater treatment: Oxygen transfer characterisation of a jet loop reactor for aerobic biological wastewater treatment. Int. J. Environ. Technol. Manag. 2004, 4, 220–235. [Google Scholar] [CrossRef]
- Seck, A.; Gold, M.; Niang, S.; Mbéguéré, M.; Diop, C.; Strande, L. Faecal sludge drying beds: Increasing drying rates for fuel resource recovery in Sub-Saharan Africa. J. Water Sanit. Hyg. Dev. 2015, 5, 72–80. [Google Scholar] [CrossRef] [Green Version]
- Gold, M.; Dayer, P.; Faye, M.C.A.S.; Clair, G.; Seck, A.; Niang, S.; Morgenroth, E.; Strande, L. Locally produced natural conditioners for dewatering of faecal sludge. Environ. Technol. 2016, 37, 2802–2814. [Google Scholar] [CrossRef] [Green Version]
- Sitter, S.; Chen, Q.; Grossmann, I.E. An overview of process intensification methods. Curr. Opin. Chem. Eng. 2019. [Google Scholar] [CrossRef]
- World Health Organization. Guidelines for the Safe Use of Wastewater, Excreta and Greywater: Excreta and Greywater Use in Agriculture; World Health Organization: Geneva, Switzerland, 2006; Volume 4. [Google Scholar]
- UN-HABITAT. Malawi: Blantyre Urban Profile; UN-HABITAT: Nairobi, Kenya, 2011. [Google Scholar]
- Jimenez-Cisneros, B.E.; Maya-Rendon, C.; Salgado-Velázquez, G. The elimination of helminth ova, faecal coliforms, Salmonella and protozoan cysts by various physicochemical processes in wastewater and sludge. Water Sci. Technol. 2001, 43, 179–182. [Google Scholar] [CrossRef] [PubMed]
- Abu-Orf, M.M.; Brewster, J.; Oleszkiewicz, J.; Reimers, R.S.; Lagasse, P.; Amy, B.; Glindemann, D. Production of class A biosolids with anoxic low dose alkaline treatment and odor management. Water Sci. Technol. 2004, 49, 131–138. [Google Scholar] [CrossRef] [PubMed]
- Greya, W.; Thole, B.; Anderson, C.; Kamwani, F.; Spit, J.; Mamani, G. Off-Site Lime Stabilisation as an Option to Treat Pit Latrine Faecal Sludge for Emergency and Existing On-Site Sanitation Systems. J. Waste Manag. 2016. [Google Scholar] [CrossRef] [Green Version]
- Kalulu, K.; Thole, B.; Mkandawire., T.; Kululanga, G. Variability of the characteristics of pit latrine sludge from unplanned settlements in the cities of Malawi. Mal. J. Appl. Sci. Innov, under review.
- Tilley, E.; Lüthi, C.; Morel, A.; Zurbrügg, C.; Schertenleib, R. Compendium of Sanitation Systems and Technologies; Swiss Federal Institute of Aquatic Science and Technology (Eawag): Dübendorf, Switzerland, 2008. [Google Scholar]
- Still, D.A. After The Pit Latrine is Full. What then? Effective Options for Pit Latrine Management. In Proceedings of the WISA Biennial Conference, Durban, South Africa, 19–23 May 2002. [Google Scholar]
- Koné, D.; Cofie, O.; Zurbrügg, C.; Gallizzi, K.; Moser, D.; Drescher, S.; Strauss, M. Helminth eggs inactivation efficiency by faecal sludge dewatering and co-composting in tropical climates. Water Res. 2007, 41, 4397–4402. [Google Scholar] [CrossRef]
- British Standard BS 1377. Methods of Test for Soils for Civil Engineering Purposes, Part 1–4; British Standards Institution: London, UK, 1990.
- Water Research Commission. WRC 2173: Protocol for LaDePa Sludge Characterisation; Water Research Commission: Pretoria, South Africa, 2013. [Google Scholar]
- British Standard BS 6068. Water Quality: Specification and Method of Tests; British Standards Institution (BAI): London, UK, 1995.
- AOAC. Official Methods of Analysis of AOAC International, 17th ed.; AOAC International: Gaithersburg, MA, USA, 2000. [Google Scholar]
- Gee, G.W.; Or, D. Particle-size analysis. Methods Soil Anal. 2002, 4, 255–293. [Google Scholar]
- Smollen, M. Evaluation of municipal sludge drying and dewatering with respect to sludge volume reduction. Water Sci. Technol. 1990, 22, 153–161. [Google Scholar] [CrossRef]
- Davison, L.; Bayley, M.; Kohlenberg, T.; Craven, J. Performance of Reed Beds and Single Pass sand Filters with Characterisation of Domestic Effluent: NSW North Coast; NSW Dept. of Local Government, Lismore City Council: Lismore Water, Australia, 2002.
- Wang, L.K.; Shammas, N.K.; Hung, Y.T. Biosolids Treatment Processes; Humana Press: Totowa, NJ, USA, 2007; Volume 6. [Google Scholar]
- Kuffour, A.R.; Awuah, E.; Sarpong, D.; Anyemedu, F.O.K.; Koné, D. Effects of different solid loading rates of faecal sludge on the dewatering performances of unplanted filter bed. Civ. Environ. Res. 2013, 3, 39–48. [Google Scholar]
- Kengne, I.M.; Akoa, A.; Koné, D. Recovery of biosolids from constructed wetlands used for faecal sludge dewatering in tropical regions. Environ. Sci. Technol. 2009, 43, 6816–6821. [Google Scholar] [CrossRef]
- Niwagaba, C.; Kulabako, R.N.; Mugala, P.; Jönsson, H. Comparing microbial die-off in separately collected faeces with ash and sawdust additives. Waste Manag. 2009, 29, 2214–2219. [Google Scholar] [CrossRef] [PubMed]
- Cofie, O.O.; Agbottah, S.; Strauss, M.; Esseku, H.; Montangero, A.; Awuah, E.; Kone, D. Solid-liquid separation of faecal sludge using drying beds in Ghana: Implications for nutrient recycling in urban agriculture. Water Res. 2006, 40, 75–82. [Google Scholar] [CrossRef] [PubMed]
- Kuffour, R.A. Improving Faecal Sludge Dewatering Efficiency of Unplanted Drying Bed. Ph.D. Thesis, Kwame Nkrumah University of Science and Technology, Kumasi, Ghana, 2010. [Google Scholar]


| Treatment | Lime Dosage (% TS *) | Rice Husks Dosage (% /TS) | Lime Quantity (kg) | Rice Husks Quantity (kg) | Rice Husks Volume (L) | Volume of Sludge (L) |
|---|---|---|---|---|---|---|
| L10, RH5 | 10 | 5 | 3.15 | 1.6 | 14 | 70 |
| L10, RH15 | 10 | 15 | 3.15 | 4.7 | 42 | 42 |
| L30, RH15 | 30 | 15 | 9.46 | 4.7 | 42 | 42 |
| L30, RH5 | 30 | 5 | 9.46 | 1.6 | 14 | 70 |
| L6, RH10 | 6 | 10 | 1.89 | 3.2 | 28 | 56 |
| L34, RH10 | 34 | 10 | 10.72 | 3.2 | 28 | 56 |
| L20, RH3 | 20 | 3 | 6.31 | 0.9 | 8 | 76 |
| L20, RH17 | 20 | 17 | 6.31 | 5.4 | 48 | 37 |
| L20, RH10 | 20 | 10 | 6.31 | 3.2 | 28 | 56 |
| Control | 0 | 0 | 0 | 0 | 0 | 85 |
| Parameter | Mean | Min | Max |
|---|---|---|---|
| pH | 8.3 | 8.0 | 9.0 |
| Density (kg/m3) | 1107 | 1085 | 1115 |
| BOD5 (mg/l) | 11,107 | 7452 | 15,653 |
| COD (mg/l) | 105,984 | 56,640 | 168,000 |
| TAN (mg/g TS) | 1.5 | 0.9 | 3.4 |
| MC (%) | 85.3 | 77.5 | 94.7 |
| TS (%) | 14.7 | 5.3 | 22.5 |
| TVS (mg/g TS) | 506 | 452 | 540 |
| E. coli (cfu/g TS) | 584,182 | 160,780 | 1,504,514 |
| Salmonella (cfu/g TS) | 1659 | 80 | 3134 |
© 2020 by the authors. Licensee MDPI, Basel, Switzerland. This article is an open access article distributed under the terms and conditions of the Creative Commons Attribution (CC BY) license (http://creativecommons.org/licenses/by/4.0/).
Share and Cite
Kalulu, K.; Thole, B.; Mkandawire, T.; Kululanga, G. Application of Process Intensification in the Treatment of Pit Latrine Sludge from Informal Settlements in Blantyre City, Malawi. Int. J. Environ. Res. Public Health 2020, 17, 3296. https://0-doi-org.brum.beds.ac.uk/10.3390/ijerph17093296
Kalulu K, Thole B, Mkandawire T, Kululanga G. Application of Process Intensification in the Treatment of Pit Latrine Sludge from Informal Settlements in Blantyre City, Malawi. International Journal of Environmental Research and Public Health. 2020; 17(9):3296. https://0-doi-org.brum.beds.ac.uk/10.3390/ijerph17093296
Chicago/Turabian StyleKalulu, Khumbo, Bernard Thole, Theresa Mkandawire, and Grant Kululanga. 2020. "Application of Process Intensification in the Treatment of Pit Latrine Sludge from Informal Settlements in Blantyre City, Malawi" International Journal of Environmental Research and Public Health 17, no. 9: 3296. https://0-doi-org.brum.beds.ac.uk/10.3390/ijerph17093296