Relationship between Biological Maturation, Physical Fitness, and Kinanthropometric Variables of Young Athletes: A Systematic Review and Meta-Analysis

 ,
,  , and
, and
Abstract
:1. Introduction
2. Materials and Methods
2.1. Search Strategy
2.2. Data Extraction and Risk of Bias
2.3. Quality Assessment and Risk of Bias
2.4. Statistical Analysis
3. Results
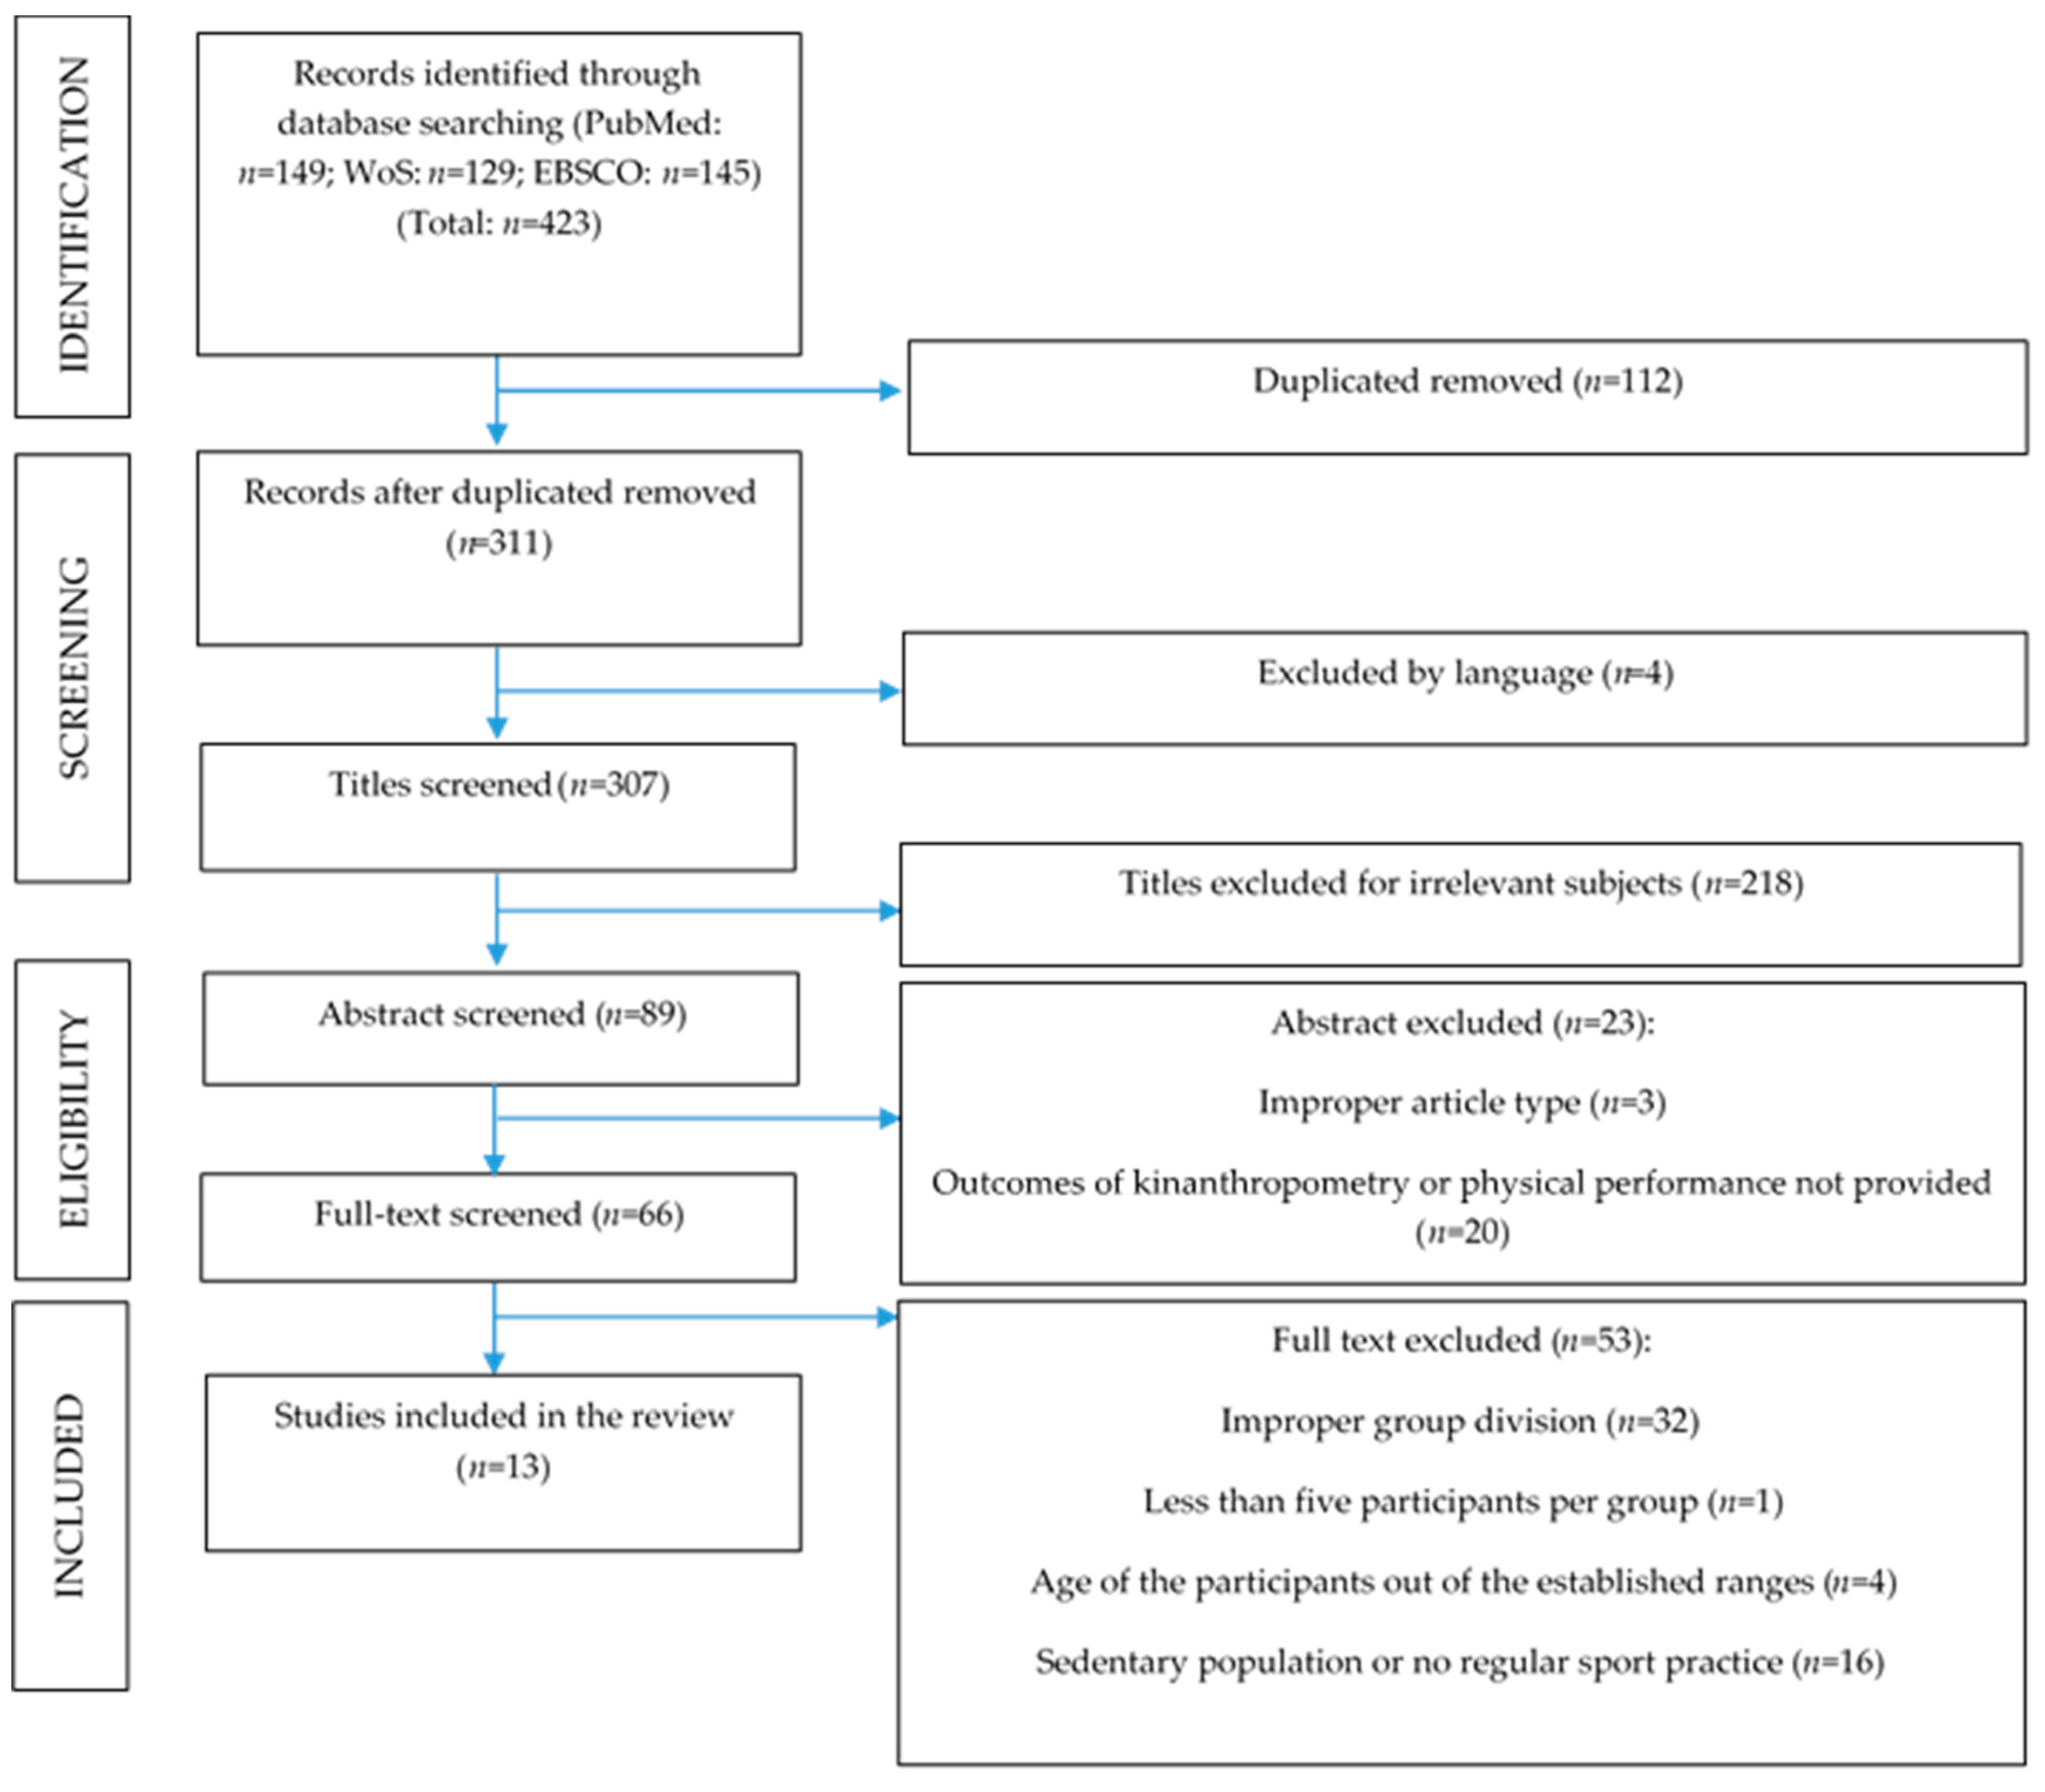
3.1. Data Search and Characteristics of the Studies
3.2. Physical Fitness Results
3.3. Kinanthropometric Variables Results
4. Discussion
5. Conclusions
Supplementary Materials
Author Contributions
Funding
Institutional Review Board Statement
Informed Consent Statement
Data Availability Statement
Conflicts of Interest
References
- Pion, J.; Segers, V.; Fransen, J.; Debuyck, G.; Deprez, D.; Haerens, L.; Vaeyens, R.; Philippaerts, R.; Lenoir, M. Generic anthropometric and performance characteristics among elite adolescent boys in nine different sports. Eur. J. Sport Sci. 2015, 15, 357–366. [Google Scholar] [CrossRef] [PubMed]
- Peña-González, I.; Fernández-Fernández, J.; Moya-Ramón, M.; Cervelló, E. Relative Age Effect, Biological Maturation, and Coaches’ Efficacy Expectations in Young Male Soccer Players. Res. Q. Exerc. Sport 2018, 89, 373–379. [Google Scholar] [CrossRef] [PubMed]
- Hertzog, M.; Paul, D.J.; Nassis, G.P.; Silva, J.R. Does Early Recruitment Predict Greater Physical Performance in Academy Soccer Players? Sports 2018, 6, 108. [Google Scholar] [CrossRef] [PubMed] [Green Version]
- Johnston, K.; Wattie, N.; Schorer, J.; Baker, J. Talent Identification in Sport: A Systematic Review. Sports Med. 2018, 48, 97–109. [Google Scholar] [CrossRef]
- López-Plaza, D.; Alacid, F.; Muyor, J.M.; López-Miñarro, P. Sprint kayaking and canoeing performance prediction based on the relationship between maturity status, anthropometry and physical fitness in young elite paddlers. J. Sports Sci. 2017, 35, 1083–1090. [Google Scholar] [CrossRef]
- Sánchez Muñoz, C.; Muros, J.J.; López Belmonte, Ó.; Zabala, M. Anthropometric Characteristics, Body Composition and Somatotype of Elite Male Young Runners. Int. J. Environ. Res. Public Health 2020, 17, 674. [Google Scholar] [CrossRef] [Green Version]
- Carter, J. Body composition of Montreal Olympic athletes. In Physical Struc Ture of Olympic Athletes Part I: The Montreal Olympic Games Anthropological Project; Carter, J., Ed.; Karger: Basel, Switzerland, 1982. [Google Scholar]
- Booysen, M.J.; Gradidge, P.J.; Constantinou, D. Anthropometric and Motor Characteristics of South African National Level Female Soccer Players. J. Hum. Kinet 2019, 66, 121–129. [Google Scholar] [CrossRef] [Green Version]
- López-Plaza, D.; Alacid, F.; Muyor, J.M.; López-Miñarro, P. Differences in Anthropometry, Biological Age and Physical Fitness Between Young Elite Kayakers and Canoeists. J. Hum. Kinet 2017, 57, 181–190. [Google Scholar] [CrossRef] [Green Version]
- Malina, R.M.; Bouchard, C. Growth, Maturation, and Physical Activity; Human Kinetics Books: Champaign, IL, USA, 1991. [Google Scholar]
- Mirwald, R.L.; Baxter-Jones, A.D.; Bailey, D.A.; Beunen, G.P. An assessment of maturity from anthropometric measurements. Med. Sci. Sports Exerc. 2002, 34, 689–694. [Google Scholar]
- Greulich, W.; Pyle, S.J. Radiographic Atlas of Skeletal Development of the Hand Wrist, 2nd ed.; Stanford University Press: Menlo Park, CA, USA, 1959. [Google Scholar]
- Tanner, J.; Whitehouse, R.; Cameron, N.; Marshall, W.; Healy, M.; Goldstein, H. Assessment of Skeletal Maturity and Prediction of Adult Height (TW2 Method), 2nd ed.; Academic Press: London, UK, 1975. [Google Scholar]
- Mills, K.; Baker, D.; Pacey, V.; Wollin, M.; Drew, M.K. What is the most accurate and reliable methodological approach for predicting peak height velocity in adolescents? A systematic review. J. Sci. Med. Sport 2017, 20, 572–577. [Google Scholar] [CrossRef]
- Ayvaz, G.; Çimen, A.R. Methods or body composition analysis in adults. Open Obes. J. 2011, 3, 62–69. [Google Scholar] [CrossRef] [Green Version]
- Mattsson, S.; Thomas, B.J. Development of methods for body composition studies. Phys. Med. Biol. 2006, 51, 203–228. [Google Scholar] [CrossRef] [Green Version]
- Marshall, W.A.; Tanner, J.M. Variations in the pattern of pubertal changes in boys. Arch. Dis. Child. 1970, 45, 13–23. [Google Scholar] [CrossRef] [PubMed] [Green Version]
- Marshall, W.A.; Tanner, J.M. Variations in pattern of pubertal changes in girls. Arch. Dis. Child. 1969, 44, 291–303. [Google Scholar] [CrossRef] [PubMed] [Green Version]
- Desmangles, J.C.; Lappe, J.M.; Lipaczewski, G.; Haynatzki, G. Accuracy of pubertal Tanner staging self-reporting. J. Pediatr. Endocrinol. Metab. 2006, 19, 213–221. [Google Scholar] [CrossRef] [PubMed]
- Sierra-Díaz, M.J.; González-Víllora, S.; Pastor-Vicedo, J.C.; Serra-Olivares, J. Soccer and Relative Age Effect: A Walk among Elite Players and Young Players. Sports 2017, 5, 5. [Google Scholar] [CrossRef] [PubMed] [Green Version]
- Isorna-Folgar, M.; Vaquero-Cristóbal, R.; Vinuesa-González, J.C.; Rial-Boubeta, A. The effect of relative age on participation in the national sport training plan and the achievement of sporting success in canoeing. Apunts. Ef Y D 2014, 1, 46–53. [Google Scholar]
- Hulthén, L.; Bengtsson, B.A.; Sunnerhagen, K.S.; Hallberg, L.; Grimby, G.; Johannsson, G. GH is needed for the maturation of muscle mass and strength in adolescents. J. Clin. Endocrinol. Metab. 2001, 86, 4765–4770. [Google Scholar] [CrossRef] [Green Version]
- Neu, C.M.; Rauch, F.; Rittweger, J.; Manz, F.; Schoenau, E. Influence of puberty on muscle development at the forearm. Am. J. Physiol. Endocrinol. Metab. 2002, 283, E103–E107. [Google Scholar] [CrossRef] [Green Version]
- Kanehisa, H.; Yata, H.; Ikegawa, S.; Fukunaga, T. A cross-sectional study of the size and strength of the lower leg muscles during growth. Eur. J. Appl. Physiol. Occup. Physiol. 1995, 72, 150–156. [Google Scholar] [CrossRef]
- Tanda, G.; Knechtle, B. Marathon performance in relation to body fat percentage and training indices in recreational male runners. Open Access J. Sports Med. 2013, 4, 141–149. [Google Scholar] [CrossRef] [PubMed] [Green Version]
- Knechtle, B.; Rosemann, T. Skin-fold thickness and race performance in male mountain ultra-marathoners. JHSE 2009, 4, 211–220. [Google Scholar] [CrossRef] [Green Version]
- Keogh, J.W.; Hume, P.A.; Pearson, S.N.; Mellow, P.J. Can absolute and proportional anthropometric characteristics distinguish stronger and weaker powerlifters? J. Strength Cond. Res. 2009, 23, 2256–2265. [Google Scholar] [CrossRef]
- Holway, F.E.; Garavaglia, R. Kinanthropometry of Group I rugby players in Buenos Aires, Argentina. J. Sports Sci. 2009, 27, 1211–1220. [Google Scholar] [CrossRef]
- Sandhu, J.; Ben-Shlomo, Y.; Cole, T.J.; Holly, J.; Davey Smith, G. The impact of childhood body mass index on timing of puberty, adult stature and obesity: A follow-up study based on adolescent anthropometry recorded at Christ‘s Hospital (1936–1964). Int. J. Obes. 2005, 30, 14–22. [Google Scholar] [CrossRef] [Green Version]
- Holmgren, A.; Niklasson, A.; Nierop, A.F.; Gelander, L.; Aronson, A.S.; Sjöberg, A.; Lissner, L.; Albertsson-Wikland, K. Pubertal height gain is inversely related to peak BMI in childhood. Pediatr. Res. 2017, 81, 448–454. [Google Scholar] [CrossRef]
- Guimarães, E.; Ramos, A.; Janeira, M.A.; Baxter-Jones, A.D.G.; Maia, J. How Does Biological Maturation and Training Experience Impact the Physical and Technical Performance of 11-14-Year-Old Male Basketball Players? Sports 2019, 7, 243. [Google Scholar] [CrossRef] [Green Version]
- Carling, C.; Le Gall, F.; Malina, R.M. Body size, skeletal maturity, and functional characteristics of elite academy soccer players on entry between 1992 and 2003. J. Sports Sci. 2012, 30, 1683–1693. [Google Scholar] [CrossRef]
- Arede, J.; Paulo Ferreira, A.; Gonzalo-Skok, O.; Leite, N. Maturational Development as a Key Aspect in Physiological Performance and National-Team Selection in Elite Male Basketball Players. Int. J. Sports Physiol. 2019, 14, 902–910. [Google Scholar] [CrossRef] [PubMed]
- Söğüt, M.; Luz, L.G.O.; Kaya, Ö.B.; Altunsoy, K.; Doğan, A.A.; Kirazci, S.; Clemente, F.M.; Nikolaidis, P.T.; Rosemann, T.; Knechtle, B. Age- and Maturity-Related Variations in Morphology, Body Composition, and Motor Fitness among Young Female Tennis Players. Int. J. Environ. Res. Public Health 2019, 16, 2412. [Google Scholar] [CrossRef] [PubMed] [Green Version]
- Murtagh, C.F.; Brownlee, T.E.; O’Boyle, A.; Morgans, R.; Drust, B.; Erskine, R.M. Importance of Speed and Power in Elite Youth Soccer Depends on Maturation Status. J. Strength Cond Res. 2018, 32, 297–303. [Google Scholar] [CrossRef] [PubMed] [Green Version]
- Gil, S.M.; Zabala-Lili, J.; Bidaurrazaga-Letona, I.; Aduna, B.; Lekue, J.A.; Santos-Concejero, J.; Granados, C. Talent identification and selection process of outfield players and goalkeepers in a professional soccer club. J. Sports Sci. 2014, 32, 1931–1939. [Google Scholar] [CrossRef] [PubMed]
- Carvalho, H.M.; Lekue, J.A.; Gil, S.M.; Bidaurrazaga-Letona, I. Pubertal development of body size and soccer-specific functional capacities in adolescent players. Res. Sports Med. 2017, 25, 421–436. [Google Scholar] [CrossRef] [PubMed]
- Bidaurrazaga-Letona, I.; Lekue, J.A.; Amado, M.; Gil, S.M. Progression in Youth Soccer: Selection and Identification in Youth Soccer Players Aged 13-15 Years. J. Strength Cond. Res. 2019, 33, 2548–2558. [Google Scholar] [CrossRef] [PubMed]
- Bidaurrazaga-Letona, I.; Carvalho, H.M.; Lekue, J.A.; Santos-Concejero, J.; Figueiredo, A.J.; Gil, S.M. Longitudinal field test assessment in a Basque soccer youth academy: A multilevel modeling framework to partition effects of maturation. Int. J. Sports Med. 2015, 36, 234–240. [Google Scholar] [CrossRef] [PubMed]
- Gil, S.M.; Badiola, A.; Bidaurrazaga-Letona, I.; Zabala-Lili, J.; Gravina, L.; Santos-Concejero, J.; Lekue, J.A.; Granados, C. Relationship between the relative age effect and anthropometry, maturity and performance in young soccer players. J. Sports Sci. 2014, 32, 479–486. [Google Scholar] [CrossRef]
- Beets, M.; Hammer, S.; Pitetti, K. Relationship Of Maturation And Sport Participation To 20-m Shuttle Run Performance In High School Girls. Med. Sci. Sports Exerc. 2005, 37, S17. [Google Scholar] [CrossRef]
- Matthys, S.P.; Vaeyens, R.; Coelho, E.S.M.J.; Lenoir, M.; Philippaerts, R. The contribution of growth and maturation in the functional capacity and skill performance of male adolescent handball players. Int. J. Sports Med. 2012, 33, 543–549. [Google Scholar] [CrossRef]
- Liberati, A.; Altman, D.G.; Tetzlaff, J.; Mulrow, C.; Gøtzsche, P.C.; Ioannidis, J.P.; Clarke, M.; Devereaux, P.J.; Kleijnen, J.; Moher, D. The PRISMA statement for reporting systematic reviews and meta-analyses of studies that evaluate healthcare interventions: Explanation and elaboration. BMJ 2009, 339, b2700. [Google Scholar] [CrossRef] [Green Version]
- Eberbach, H.; Hohloch, L.; Feucht, M.J.; Konstantinidis, L.; Südkamp, N.P.; Zwingmann, J. Operative versus conservative treatment of apophyseal avulsion fractures of the pelvis in the adolescents: A systematical review with meta-analysis of clinical outcome and return to sports. BMC Musculoskelet Disord. 2017, 18, 162. [Google Scholar] [CrossRef] [Green Version]
- McHugh, M.L. Interrater reliability: The kappa statistic. Biochem. Med. 2012, 22, 276–282. [Google Scholar] [CrossRef]
- von Elm, E.; Altman, D.G.; Egger, M.; Pocock, S.J.; Gotzsche, P.C.; Vandenbroucke, J.P. Declaración de la Iniciativa STROBE (Strengthening the Reporting of Observational studies in Epidemiology): Directrices para la comunicación de estudios observacionales. Gac. Sanit. 2008, 22, 144–150. [Google Scholar] [CrossRef] [Green Version]
- Egger, M.; Davey Smith, G.; Schneider, M.; Minder, C. Bias in meta-analysis detected by a simple, graphical test. BMJ 1997, 315, 629–634. [Google Scholar] [CrossRef] [Green Version]
- Rosenthal, R. The file draw problem and tolerance for null results. Psychol. Bull. 1979, 86, 638–641. [Google Scholar] [CrossRef]
- Sterne, J.A.; Sutton, A.J.; Ioannidis, J.P.; Terrin, N.; Jones, D.R.; Lau, J.; Carpenter, J.; Rücker, G.; Harbord, R.M.; Schmid, C.H.; et al. Recommendations for examining and interpreting funnel plot asymmetry in meta-analyses of randomised controlled trials. BMJ 2011, 343, d4002. [Google Scholar] [CrossRef] [Green Version]
- Ioannidis, J.P. Interpretation of tests of heterogeneity and bias in meta-analysis. J. Eval. Clin. Pr. 2008, 14, 951–957. [Google Scholar] [CrossRef] [PubMed]
- Higgins, J.P.; Thompson, S.G. Controlling the risk of spurious findings from meta-regression. Stat. Med. 2004, 23, 1663–1682. [Google Scholar] [CrossRef] [PubMed]
- Knapp, G.; Hartung, J. Improved tests for a random effects meta-regression with a single covariate. Stat. Med. 2003, 22, 2693–2710. [Google Scholar] [CrossRef]
- Cohen, J. Statistical Power Analysis for Behavioral Science, 2nd ed.; Lawrence Erlbaum Associates: Hillsdale, MI, USA, 1988. [Google Scholar]
- Leonardi, T.J.; Paes, R.P.; Breder, L.; Foster, C.; Goncalves, C.E.; Carvalho, H.M. Biological maturation, training experience, body size and functional capacity of adolescent female basketball players: A Bayesian analysis. Int. J. Sports Sci. Coa 2018, 13, 713–722. [Google Scholar] [CrossRef]
- Figueiredo, A.J.; Gonçalves, C.E.; Coelho-E-Silva, M.J.; Malina, R.M. Youth soccer players, 11-14 years: Maturity, size, function, skill and goal orientation. Ann. Hum. Biol. 2009, 36, 60–73. [Google Scholar] [CrossRef] [Green Version]
- Gastin, P.B.; Bennett, G.; Cook, J. Biological maturity influences running performance in junior Australian football. J. Sci. Med. Sport 2013, 16, 140–145. [Google Scholar] [CrossRef] [PubMed]
- Gouvea, M.; Cyrino, E.S.; Ribeiro, A.S.; da Silva, D.R.P.; Ohara, D.; Valente-dos-Santos, J.; Coelho-e-Silva, M.J.; Ronque, E. Influence of Skeletal Maturity on Size, Function and Sport-specific Technical Skills in Youth Soccer Players. Int. J. Sports Med. 2016, 37, 464–469. [Google Scholar] [CrossRef] [PubMed]
- Hammami, R.; Sekulic, D.; Selmi, M.A.; Fadhloun, M.; Spasic, M.; Uljevic, O.; Chaouachi, A. Maturity status as a determinant of the relationships between conditioning qualities and preplanned agility in young handball athletes. J. Strength Cond. Res. 2018, 32, 2302–2313. [Google Scholar] [CrossRef] [PubMed]
- Matta, M.d.O.; Figueiredo, A.J.B.; Garcia, E.S.; Seabra, A.F.T. Morphological, maturational, functional and technical profile of young Brazilian soccer players. Rev. Bras. Cineantropometria Desempenho Hum. 2014, 16, 277–286. [Google Scholar] [CrossRef] [Green Version]
- Valente-Dos-Santos, J.; Coelho-E-Silva, M.J.; Vaz, V.; Figueiredo, A.J.; Capranica, L.; Sherar, L.B.; Elferink-Gemser, M.T.; Malina, R.M. Maturity-associated variation in change of direction and dribbling speed in early pubertal years and 5-year developmental changes in young soccer players. J. Sports Med. Phys. Fit. 2014, 54, 307–316. [Google Scholar]
- Carling, C.; Orhant, E. Variation in body composition in professional soccer players: Interseasonal and intraseasonal changes and the effects of exposure time and player position. J. Strength Cond. Res. 2010, 24, 1332–1339. [Google Scholar] [CrossRef] [Green Version]
- Moritani, T.; de Vries, H.A. Neural factors versus hypertrophy in the time course of muscle strength gain. Am. J. Phys. Med. 1979, 58, 115–130. [Google Scholar]
- Petré, H.; Wernstål, F.; Mattsson, C.M. Effects of Flywheel Training on Strength-Related Variables: A Meta-analysis. Sports Med. Open 2018, 4, 55. [Google Scholar] [CrossRef]
- Kraemer, W.J.; Newton, R.U. Training for muscular power. Phys. Med. Rehabil Clin. N. Am. 2000, 11, 341–368. [Google Scholar] [CrossRef]
- Fitts, R.H.; McDonald, K.S.; Schluter, J.M. The determinants of skeletal muscle force and power: Their adaptability with changes in activity pattern. J. Biomech. 1991, 24 (Suppl. 1), 111–122. [Google Scholar] [CrossRef]
- Handelsman, D.J.; Hirschberg, A.L.; Bermon, S. Circulating Testosterone as the Hormonal Basis of Sex Differences in Athletic Performance. Endocr. Rev. 2018, 39, 803–829. [Google Scholar] [CrossRef] [Green Version]
- Vingren, J.L.; Kraemer, W.J.; Ratamess, N.A.; Anderson, J.M.; Volek, J.S.; Maresh, C.M. Testosterone physiology in resistance exercise and training: The up-stream regulatory elements. Sports Med. 2010, 40, 1037–1053. [Google Scholar] [CrossRef] [PubMed]
- Ross, W.D.; Kerr, D.A. Fraccionamiento de la masa corporal: Un nuevo método para utilizar en nutrición clínica y medicina deportiva. Apunts. Med. Esport 1991, 18, 175–187. [Google Scholar]
- Tanda, G.; Knechtle, B. Effects of training and anthropometric factors on marathon and 100 km ultramarathon race performance. Open Access J. Sports Med. 2015, 6, 129–136. [Google Scholar] [CrossRef] [PubMed] [Green Version]
- Knechtle, B.; Knechtle, P.; Rosemann, T.; Lepers, R. Personal best marathon time and longest training run, not anthropometry, predict performance in recreational 24-hour ultrarunners. J. Strength Cond. Res. 2011, 25, 2212–2218. [Google Scholar] [CrossRef] [PubMed] [Green Version]
- Knechtle, B.; Knechtle, P.; Rosemann, T.; Senn, O. What is associated with race performance in male 100-km ultra-marathoners—Anthropometry, training or marathon best time? J. Sport Sci. 2011, 29, 571–577. [Google Scholar] [CrossRef] [PubMed]
- Zingg, M.A.; Rüst, C.A.; Rosemann, T.; Lepers, R.; Knechtle, B. Runners in their forties dominate ultra-marathons from 50 to 3,100 miles. Clinics 2014, 69, 203–211. [Google Scholar] [CrossRef]
- Ayala, F.; Sainz de Baranda, P.; De Ste Croix, M.; Santonja, F. Absolute reliability of five clinical tests for assessing hamstring flexibility in professional futsal players. J. Sci. Med. Sport 2012, 15, 142–147. [Google Scholar] [CrossRef]
- López-Miñarro, P.A.; Muyor, J.M.; Alacid, F. Influence of Hamstring Extensibility on Spinal and Pelvic Postures in Highly Trained Athletes. In Posture Types, Exercises and Health Effects; Curran, S.A., Ed.; Nova Biomedical: New York, NY, USA, 2014; pp. 81–94. [Google Scholar]
- Vaquero-Cristóbal, R.; López-Miñarro, P.A.; Alacid, F.; Esparza-Ros, F. The effects of the pilates method on hamstring extensibility, pelvic tilt and trunk flexion. Nutr. Hosp. 2015, 32, 1967–1986. [Google Scholar]
- Avrillon, S.; Lacourpaille, L.; Hug, F.; Le Sant, G.; Frey, A.; Nordez, A.; Guilhem, G. Hamstring muscle elasticity differs in specialized high-performance athletes. Scand. J. Med. Sci. Sports 2020, 30, 83–91. [Google Scholar] [CrossRef]
- Klaver, M.; de Blok, C.J.M.; Wiepjes, C.M.; Nota, N.M.; Dekker, M.J.H.J.; de Mutsert, R.; Schreiner, T.; Fisher, A.D.; T’Sjoen, G.; den Heijer, M. Changes in regional body fat, lean body mass and body shape in trans persons using cross-sex hormonal therapy: Results from a multicenter prospective study. Eur. J. Endocrinol. 2018, 178, 163–171. [Google Scholar] [CrossRef] [PubMed]
- Richmond, E.; Rogol, A.D. Treatment of growth hormone deficiency in children, adolescents and at the transitional age. Best Pr. Res. Clin. Endocrinol. Metab. 2016, 30, 749–755. [Google Scholar] [CrossRef] [PubMed]
- Saenger, P. Dose effects of growth hormone during puberty. Horm Res. 2003, 60, 52–57. [Google Scholar] [CrossRef]
- Ode, J.J.; Pivarnik, J.M.; Reeves, M.J.; Knous, J.L. Body mass index as a predictor of percent fat in college athletes and nonathletes. Med. Sci. Sports Exerc. 2007, 39, 403–409. [Google Scholar] [CrossRef] [PubMed]
- Perchard, R.; Clayton, P.E. Ghrelin and Growth. Endocr. Dev. 2017, 32, 74–86. [Google Scholar] [CrossRef] [PubMed] [Green Version]
- Veldhuis, J.D.; Roemmich, J.N.; Richmond, E.J.; Rogol, A.D.; Lovejoy, J.C.; Sheffield-Moore, M.; Mauras, N.; Bowers, C.Y. Endocrine control of body composition in infancy, childhood, and puberty. Endocr. Rev. 2005, 26, 114–146. [Google Scholar] [CrossRef]
- Vaquero-Cristóbal, R.; Alacid, F.; Esparza-Ros, F.; López-Plaza, D.; Muyor, J.M.; López-Miñarro, P.A. The effects of a reformer Pilates program on body composition and morphological characteristics in active women after a detraining period. Women Health 2016, 56, 784–806. [Google Scholar] [CrossRef]
- Cabañas, M.D.; Esparza, F. Compendio de Cineantropometría; CTO Editorial: Madrid, Spain, 2009. [Google Scholar]
- Reinehr, T.; Bosse, C.; Lass, N.; Rothermel, J.; Knop, C.; Roth, C.L. Effect of Weight Loss on Puberty Onset in Overweight Children. J. Pediatr. 2017, 184, 143–150.e141. [Google Scholar] [CrossRef]
- Markovic, G.; Dizdar, D.; Jukic, I.; Cardinale, M. Reliability and factorial validity of squat and countermovement jump tests. J. Strength Cond. Res. 2004, 18, 551–555. [Google Scholar] [CrossRef]
- Davis, K.L.; Kang, M.; Boswell, B.B.; DuBose, K.D.; Altman, S.R.; Binkley, H.M. Validity and reliability of the medicine ball throw for kindergarten children. J. Strength Cond. Res. 2008, 22, 1958–1963. [Google Scholar] [CrossRef] [Green Version]
- Hamilton, A.; Balnave, R.; Adams, R. Grip strength testing reliability. J. Hand 1994, 7, 163–170. [Google Scholar] [CrossRef]
- Altmann, S.; Ringhof, S.; Neumann, R.; Woll, A.; Rumpf, M.C. Validity and reliability of speed tests used in soccer: A systematic review. PLoS ONE 2019, 14, e0220982. [Google Scholar] [CrossRef] [PubMed] [Green Version]
- Pauole, K.; Madole, K.; Garhammer, J.; Lacourse, M.; Rozenek, R. Reliability and Validity of the T-Test as a measure of agility, leg power, and leg speed in college-aged men and women. J. Strength Cond. Res. 2000, 14, 443–450. [Google Scholar]
- Krustrup, P.; Mohr, M.; Amstrup, T.; Rysgaard, T.; Johansen, J.; Steensberg, A.; Pedersen, P.K.; Bangsbo, J. The yo-yo intermittent recovery test: Physiological response, reliability, and validity. Med. Sci. Sports Exerc. 2003, 35, 697–705. [Google Scholar] [CrossRef]
- McCrary, J.M.; Ackermann, B.J.; Halaki, M. A systematic review of the effects of upper body warm-up on performance and injury. Br. J. Sports Med. 2015, 49, 935–942. [Google Scholar] [CrossRef] [Green Version]
- Coburn, J.W.; Malek, M.H. Manual NSCA: Fundamentos del Entrenamiento Personal, 2nd ed.; Paidotribo: Barcelona, Spain, 2014. [Google Scholar]
- Vaquero-Cristóbal, R.; Albaladejo-Saura, M.; Luna-Badachi, A.E.; Esparza-Ros, F. Differences in fat mass estimation formulas in physically active adult population and relationship with sums of skinfolds. Int. J. Environ. Res. Public Health 2020, 17, 7777. [Google Scholar] [CrossRef]
- Sterkowicz-Przybycień, K.L.; Sterkowicz, S.; Zarów, R.T. Somatotype, body composition and proportionality in polish top greco-roman wrestlers. J. Hum. Kinet 2011, 28, 141–154. [Google Scholar] [CrossRef]
- Sammoud, S.; Nevill, A.M.; Negra, Y.; Bouguezzi, R.; Chaabene, H.; Hachana, Y. 100-m Breaststroke Swimming Performance in Youth Swimmers: The Predictive Value of Anthropometrics. Pediatr. Exerc. Sci. 2018, 30, 393–401. [Google Scholar] [CrossRef]


| Author | Sex (n) | Age (X ± SD) | Competitive Level | Sport | Maturation Offset Estimation | Maturational Status | Physical Fitness Tests | Kinanthropometric Measurements and Body Composition |
|---|---|---|---|---|---|---|---|---|
| Arede et al. (2018) [33] | M (34) | 14.6 ± 0.23 | National | Basketball | Method: kinanthropometry; Equation: Mirwald et al. (2002) | Pre-pubertal, pubertal, post-pubertal | SJ, CMJ, ABK, medicinal ball throw (2 kg), sprint (20 m), Yo-Yo intermittent recovery test, agility T-test, sit and reach test | Body mass, height, sitting height |
| Carling et al. (2012) [61] | M (158) | 13.5 ± 0.4 | Elite | Football | Method: Hand and wrist radiography; Greulich and Pyle (1959) | Delayed, average, advanced | CMJ, sprint (10, 20, and 40 m), VO2máx, quadriceps isokinetic strength | Body mass, height, four skinfolds (triceps, biceps, subscapular, iliac crest), fat mass percentage (method: kinanthropometry; equation: Durnin and Womersley) |
| Figueiredo et al. (2009) [55] | M (87) | 11.0 to 12.0 (11.8 ± 0.53) | Regional | Football | Method: Hand and wrist radiography; Roche (1988) and Tanner (1962) | Late, on time, early | SJ, CMJ, Yo-Yo intermittent recovery test, seven-sprint protocol, agility shuttle run | Body mass, height, sitting height, four skinfolds (triceps, subscapular, iliac crest, calf) |
| M (72) | 13.0 to 14.9 (14.4 ± 0.56) | |||||||
| Gastin et al. (2013) [56] | M (52) | - | Regional | Australian Football | Method: kinanthropometry; Equation: Mirwald et al. (2002) | Less mature, more mature | 20 m shuttle run test, sprint (20 m) | Body mass, height, sitting height |
| Gouvea et al. (2016) [57] | M (28) | 12.8 ± 1.2 | Semi-professional | Football | Method: Hand and wrist radiography; Greulich and Pyle (1959) | Late, on time, early | SJ, CMJ, handgrip strength, sit and reach test, sit-up test, Yo-Yo intermittent recovery test | Body mass, height, fat mass percentage (Method: Bod Pod; equation: Lohman), BMI |
| Guimaraes et al. (2019) [31] | M (152) | 13.3 ± 0.7 | Regional | Basketball | Method: kinanthropometry; Equation: Mirwald et al. (2002) | Late, average, early | SJ, CMJ, medicine ball throw (3kg), Yo-Yo intermittent recovery test, sprint (20 m), agility T-test, handgrip strength | Body mass, height, sitting height, leg length |
| Hammami et al. (2017) [58] | M (56) | 12 to 14 | Elite | Handball | Method: kinanthropometry; Equation: Moore et al. (2015) | Pre-PHV, post-PHV | SJ, CMJ, SLJ, H-CMJ, H-SJ, 3HOPT, sprint (10, 20, 30 m), agility T-half test, CODAT | Body mass, height, fat mass percentage (method: kinanthropometry; equation: Slaughter) |
| Leonardi et al. (2018) [54] | F (47) | 13.5 (11.5–15.6) | Regional | Basketball | Method: sexual maturation; Age at menarche | Late, average, early | CMJ, Yo-Yo intermittent recovery test, Line Drill test | Body mass, height, BMI, four skinfolds (triceps, subscapular, iliac crest, calf) |
| López-Plaza et al. (2016) [9] | M (89) | 13.7 ± 0.6 | Elite | Kayak | Method: kinanthropometry; Equation: Mirwald et al. (2002) | Pre-PHV, circum-PHV, post-PHV | SJ, CMJ, medicine ball throw (3 kg), VO2max | Body mass, height, sitting height, BMI, six skinfolds (triceps, subscapular, biceps, iliac crest, supraspinal, calf), fat mass percentage (method: kinanthropometry; equation: Slaughter), muscle mass percentage (method: kinanthropometry; equation: Poortmans) |
| M (82) | 13.7 ± 0.6 | Elite | Canoe | |||||
| Matta et al. (2014) [59] | M (114) | 14.2 ± 0.5 | Regional | Football | Method: sexual maturation; Marshall and Tanner (1962) | Sexual maturation P3, P4, P5 | SJ, CMJ, Yo-Yo intermittent recovery test, RAST, sprint (5, 30 m), agility t-test | Body mass, height, four skinfolds (triceps, subscapular, iliac crest, calf) |
| Matthys et al. (2012) [42] | M (168) | 14.5±0.13 | Regional and national | Handball | Method: kinanthropometry; Equation: Mirwald et al. (2002) | Late, on time, early | 5-jump test, handgrip strength, sprint (5, 20 m) | Body mass, height, sitting height, body fat percentage (Method: electric bioimpedance) |
| Sogut et al. (2019) [34] | F (61) | 11.8±0.8 | National | Tennis | Method: Hand and wrist radiography; Lohman and Roche (1988) | Latest, Earliest | Handgrip strength, hexagon agility test | Body mass, height, sitting height, two skinfolds (triceps, calf), fat mass percentage (method: kinanthropometry; equation: Slaughter) |
| Valente-Dos Santos et al. (2014) [60] | M (36) | 12 | Regional | Football | Method: Hand and wrist radiography; Roche (1988) Malina (2004) | Late, on time, early | CMJ, agility shuttle run test, dribbling speed | Body mass, height, two skinfolds (triceps, subscapular), fat mass (method: kinanthropometry; equation: Slaughter), fat free mass |
| M (53) | 13 | |||||||
| M (91) | 14 | |||||||
| M (51) | 15 |
| Study | 1 | 2 | 3 | 4 | 5 | 6 | 7 | 8 | 9 | 10 | 11 | 12 | 13 | 14 | 15 | 16 | 17 | 18 | 19 | 20 | 21 | 22 | 100% | Total |
|---|---|---|---|---|---|---|---|---|---|---|---|---|---|---|---|---|---|---|---|---|---|---|---|---|
| Arede et al. (2018) [33] | 1 | 1 | 1 | 1 | 1 | 0 | 0 | 1 | 0 | 0 | 1 | 1 | 0 | 1 | 1 | 1 | 1 | 1 | 0 | 1 | 0 | 1 | 68.18 | 15 |
| Carling et al. (2012) [32] | 1 | 1 | 1 | 1 | 1 | 0 | 1 | 1 | 0 | 0 | 1 | 1 | 1 | 1 | 1 | 1 | 1 | 1 | 0 | 1 | 1 | 0 | 77.27 | 17 |
| Figueiredo et al. (2009) [55] | 1 | 1 | 1 | 1 | 1 | 0 | 1 | 1 | 0 | 0 | 1 | 0 | 1 | 1 | 1 | 1 | 1 | 1 | 0 | 1 | 0 | 0 | 68.18 | 15 |
| Gastin et al. (2013) [56] | 1 | 1 | 1 | 1 | 1 | 0 | 1 | 1 | 0 | 0 | 1 | 1 | 1 | 1 | 1 | 1 | 1 | 1 | 0 | 1 | 0 | 1 | 77.27 | 17 |
| Gouvea et al. (2016) [57] | 1 | 1 | 1 | 1 | 1 | 0 | 1 | 1 | 0 | 0 | 1 | 1 | 1 | 1 | 1 | 1 | 1 | 1 | 1 | 1 | 0 | 1 | 81.82 | 18 |
| Guimaraes et al. (2019) [31] | 1 | 1 | 1 | 1 | 1 | 1 | 1 | 1 | 0 | 0 | 1 | 1 | 1 | 1 | 1 | 1 | 1 | 1 | 1 | 1 | 1 | 1 | 90.91 | 20 |
| Hammami et al. (2017) [58] | 1 | 1 | 1 | 1 | 0 | 0 | 1 | 0 | 0 | 0 | 1 | 1 | 1 | 1 | 1 | 1 | 1 | 1 | 1 | 1 | 1 | 1 | 77.27 | 17 |
| Leonardi et al. (2018) [54] | 1 | 1 | 1 | 1 | 1 | 0 | 1 | 1 | 0 | 0 | 1 | 1 | 1 | 1 | 1 | 1 | 1 | 1 | 0 | 1 | 0 | 1 | 77.27 | 17 |
| López-Plaza et al. (2016) [9] | 1 | 1 | 1 | 1 | 1 | 1 | 1 | 1 | 0 | 0 | 1 | 1 | 1 | 1 | 1 | 1 | 1 | 1 | 0 | 1 | 1 | 1 | 86.36 | 19 |
| Matta et al. (2014) [59] | 1 | 1 | 1 | 1 | 1 | 0 | 1 | 1 | 0 | 0 | 1 | 1 | 1 | 1 | 1 | 1 | 1 | 1 | 0 | 1 | 0 | 0 | 72.73 | 16 |
| Matthys et al. (2012) [42] | 1 | 1 | 1 | 1 | 1 | 0 | 1 | 1 | 0 | 0 | 1 | 1 | 1 | 1 | 1 | 1 | 1 | 1 | 1 | 1 | 0 | 1 | 81.82 | 18 |
| Sogut et al. (2019) [34] | 1 | 1 | 1 | 1 | 1 | 1 | 1 | 1 | 0 | 0 | 1 | 1 | 1 | 1 | 1 | 1 | 1 | 1 | 1 | 1 | 0 | 1 | 86.36 | 19 |
| Valente-Dos Santos et al. (2014) [60] | 1 | 1 | 1 | 1 | 1 | 0 | 1 | 1 | 0 | 0 | 1 | 1 | 1 | 1 | 1 | 1 | 1 | 1 | 1 | 1 | 1 | 1 | 86.36 | 19 |
| Mean of total scores: | 79.37 | 17.46 | ||||||||||||||||||||||
| Number of Studies | Early (Mean ± SD) | On Time (Mean ± SD) | Late (Mean ± SD) | Early vs. On Time | Early vs. Late | On Time vs. Late | ||||||||||
|---|---|---|---|---|---|---|---|---|---|---|---|---|---|---|---|---|
| SMD | 95% CI | Z | p | SMD | 95% CI | Z | p | SMD | 95% CI | Z | p | |||||
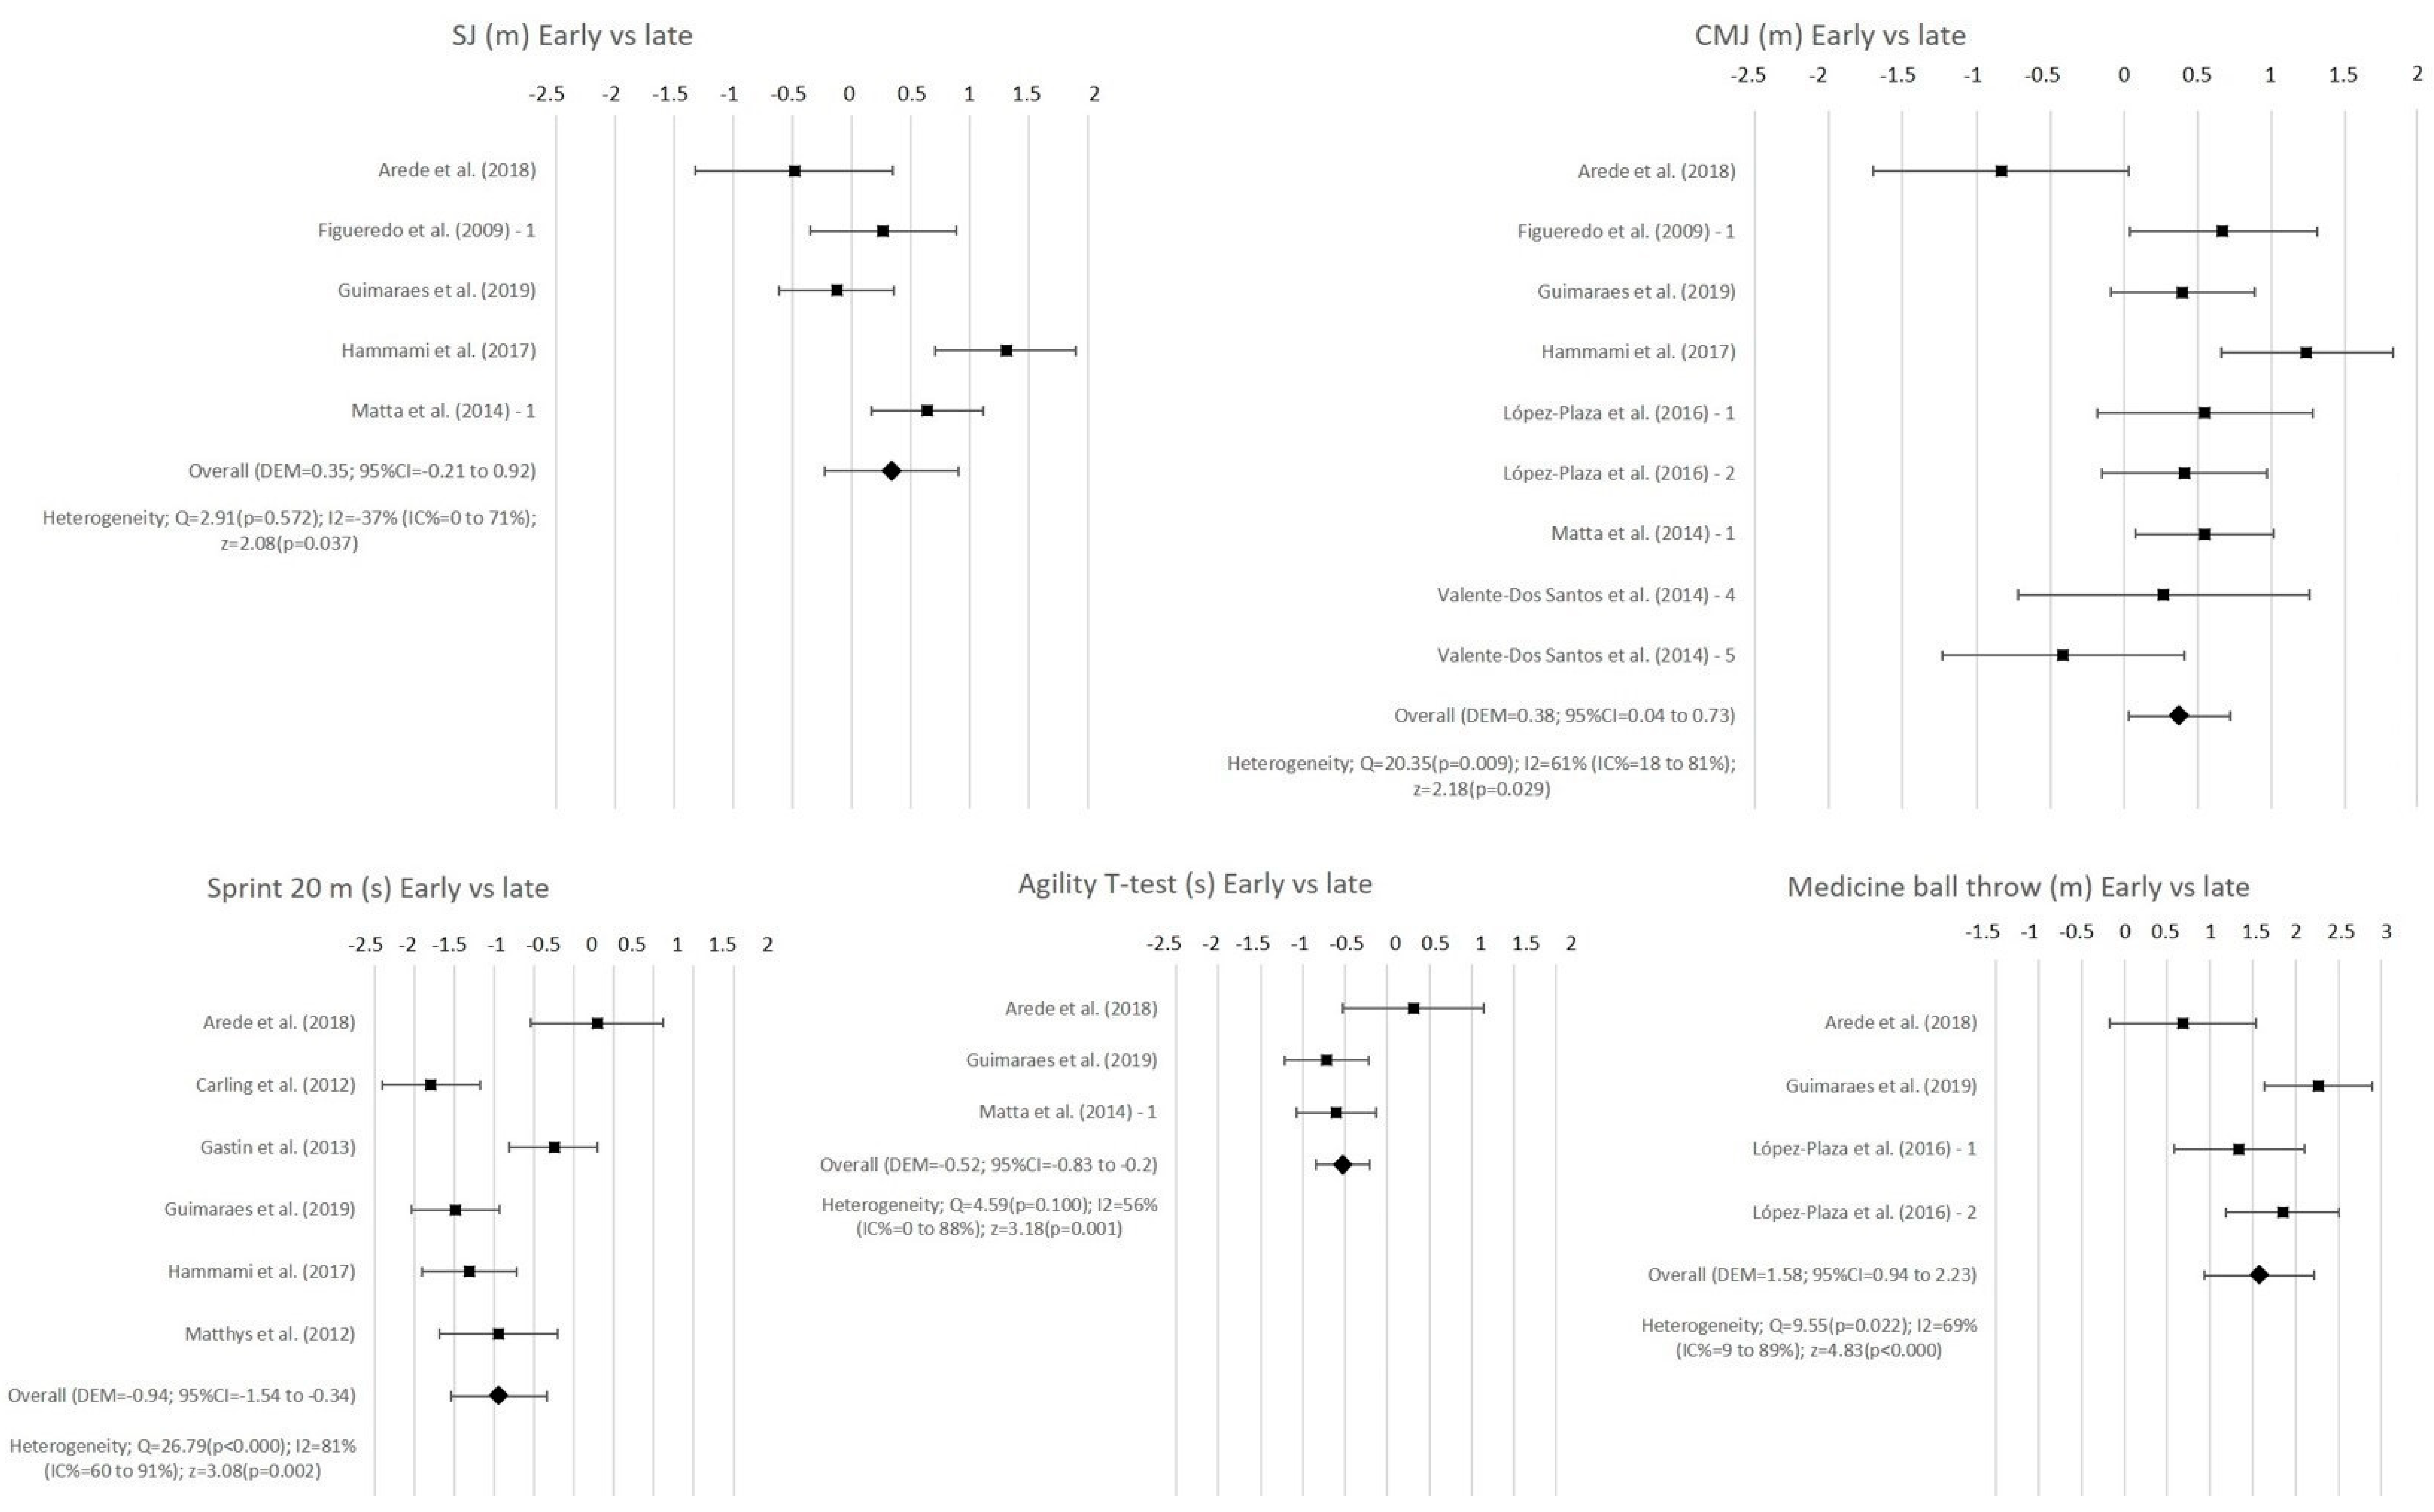
| CMJ (m) | 8 (Table S1) | 0.32 ± 0.05 | 0.31 ± 0.05 | 0.30 ± 0.05 | 0.17 | 0.01 to 0.33 | 2.06 | 0.04 | 0.38 | 0.04 to 0.73 | 2.18 | 0.03 | 0.12 | −0.07 to 0.31 | 1.20 | 0.23 |
| SJ (m) | 6 (Table S2) | 0.28 ± 0.04 | 0.27 ± 0.05 | 0.26 ± 0.06 | 0.23 | 0.01 to 0.45 | 2.08 | 0.04 | 0.35 | −0.21 to 0.92 | 1.22 | 0.22 | 0.04 | −0.26 to 0.33 | 0.24 | 0.81 |
| Medicine ball throw (m) | 3 (Table S6) | 5.96 ± 0.94 | 5.19 ± 0.71 | 4.60 ± 0.76 | 0.99 | 0.73 to 1.25 | 7.40 | <0.001 | 1.58 | 0.94 to 2.23 | 4.83 | <0.001 | 0.89 | 0.60 to 1.18 | 6.04 | <0.001 |
| Handgrip strength (kg) | 3 (Table S5) | 42.50 ± 7.60 | 33.75 ± 6.35 | 26.40 ± 5.85 | 1.31 | 0.96 to 1.67 | 7.20 | <0.001 | 2.31 | 1.79 to 2.84 | 8.70 | <0.001 | 1.09 | 0.79 to 1.39 | 7.12 | <0.001 |
| Sprint 20 m (s) | 6 (Table S3) | 3.24 ± 0.23 | 3.39 ± 0.20 | 3.43 ± 0.22 | −0.52 | −1.07 to 0.04 | 1.81 | 0.07 | −0.94 | −1.54 to −0.34 | 3.08 | <0.001 | −0.42 | −0.82 to 0.01 | 1.93 | 0.05 |
| Yo-Yo test (m) | 6 (Table S4) | 1150.41 ± 488.92 | 1243.48 ± 487.34 | 1154.44 ± 374.73 | −0.21 | −0.54 to 0.12 | 1.22 | 0.22 | 0.05 | −1.08 to 0.08 | 1.69 | 0.09 | −0.16 | −0.37 to 0.05 | 1.47 | 0.14 |
| Agility t-test (s) | 3 (Table S7) | 9.99 ± 0.64 | 10.10 ± 0.56 | 10.20 ± 0.50 | −0.19 | −0.82 to 0.43 | 0.61 | 0.54 | −0.52 | −0.83 to −0.20 | 3.18 | 0.001 | −0.13 | −0.42 to 0.15 | 0.90 | 0.37 |
| Sit and reach (m) | 4 (Table S8) | 0.12 ± 0.08 | 0.11 ± 0.09 | 0.11 ± 0.07 | 0.23 | −0.08 to 0.54 | 1.45 | 0.15 | 0.31 | −0.08 to 0.70 | 1.56 | 0.12 | 0.02 | −0.35 to 0.38 | 0.09 | 0.93 |
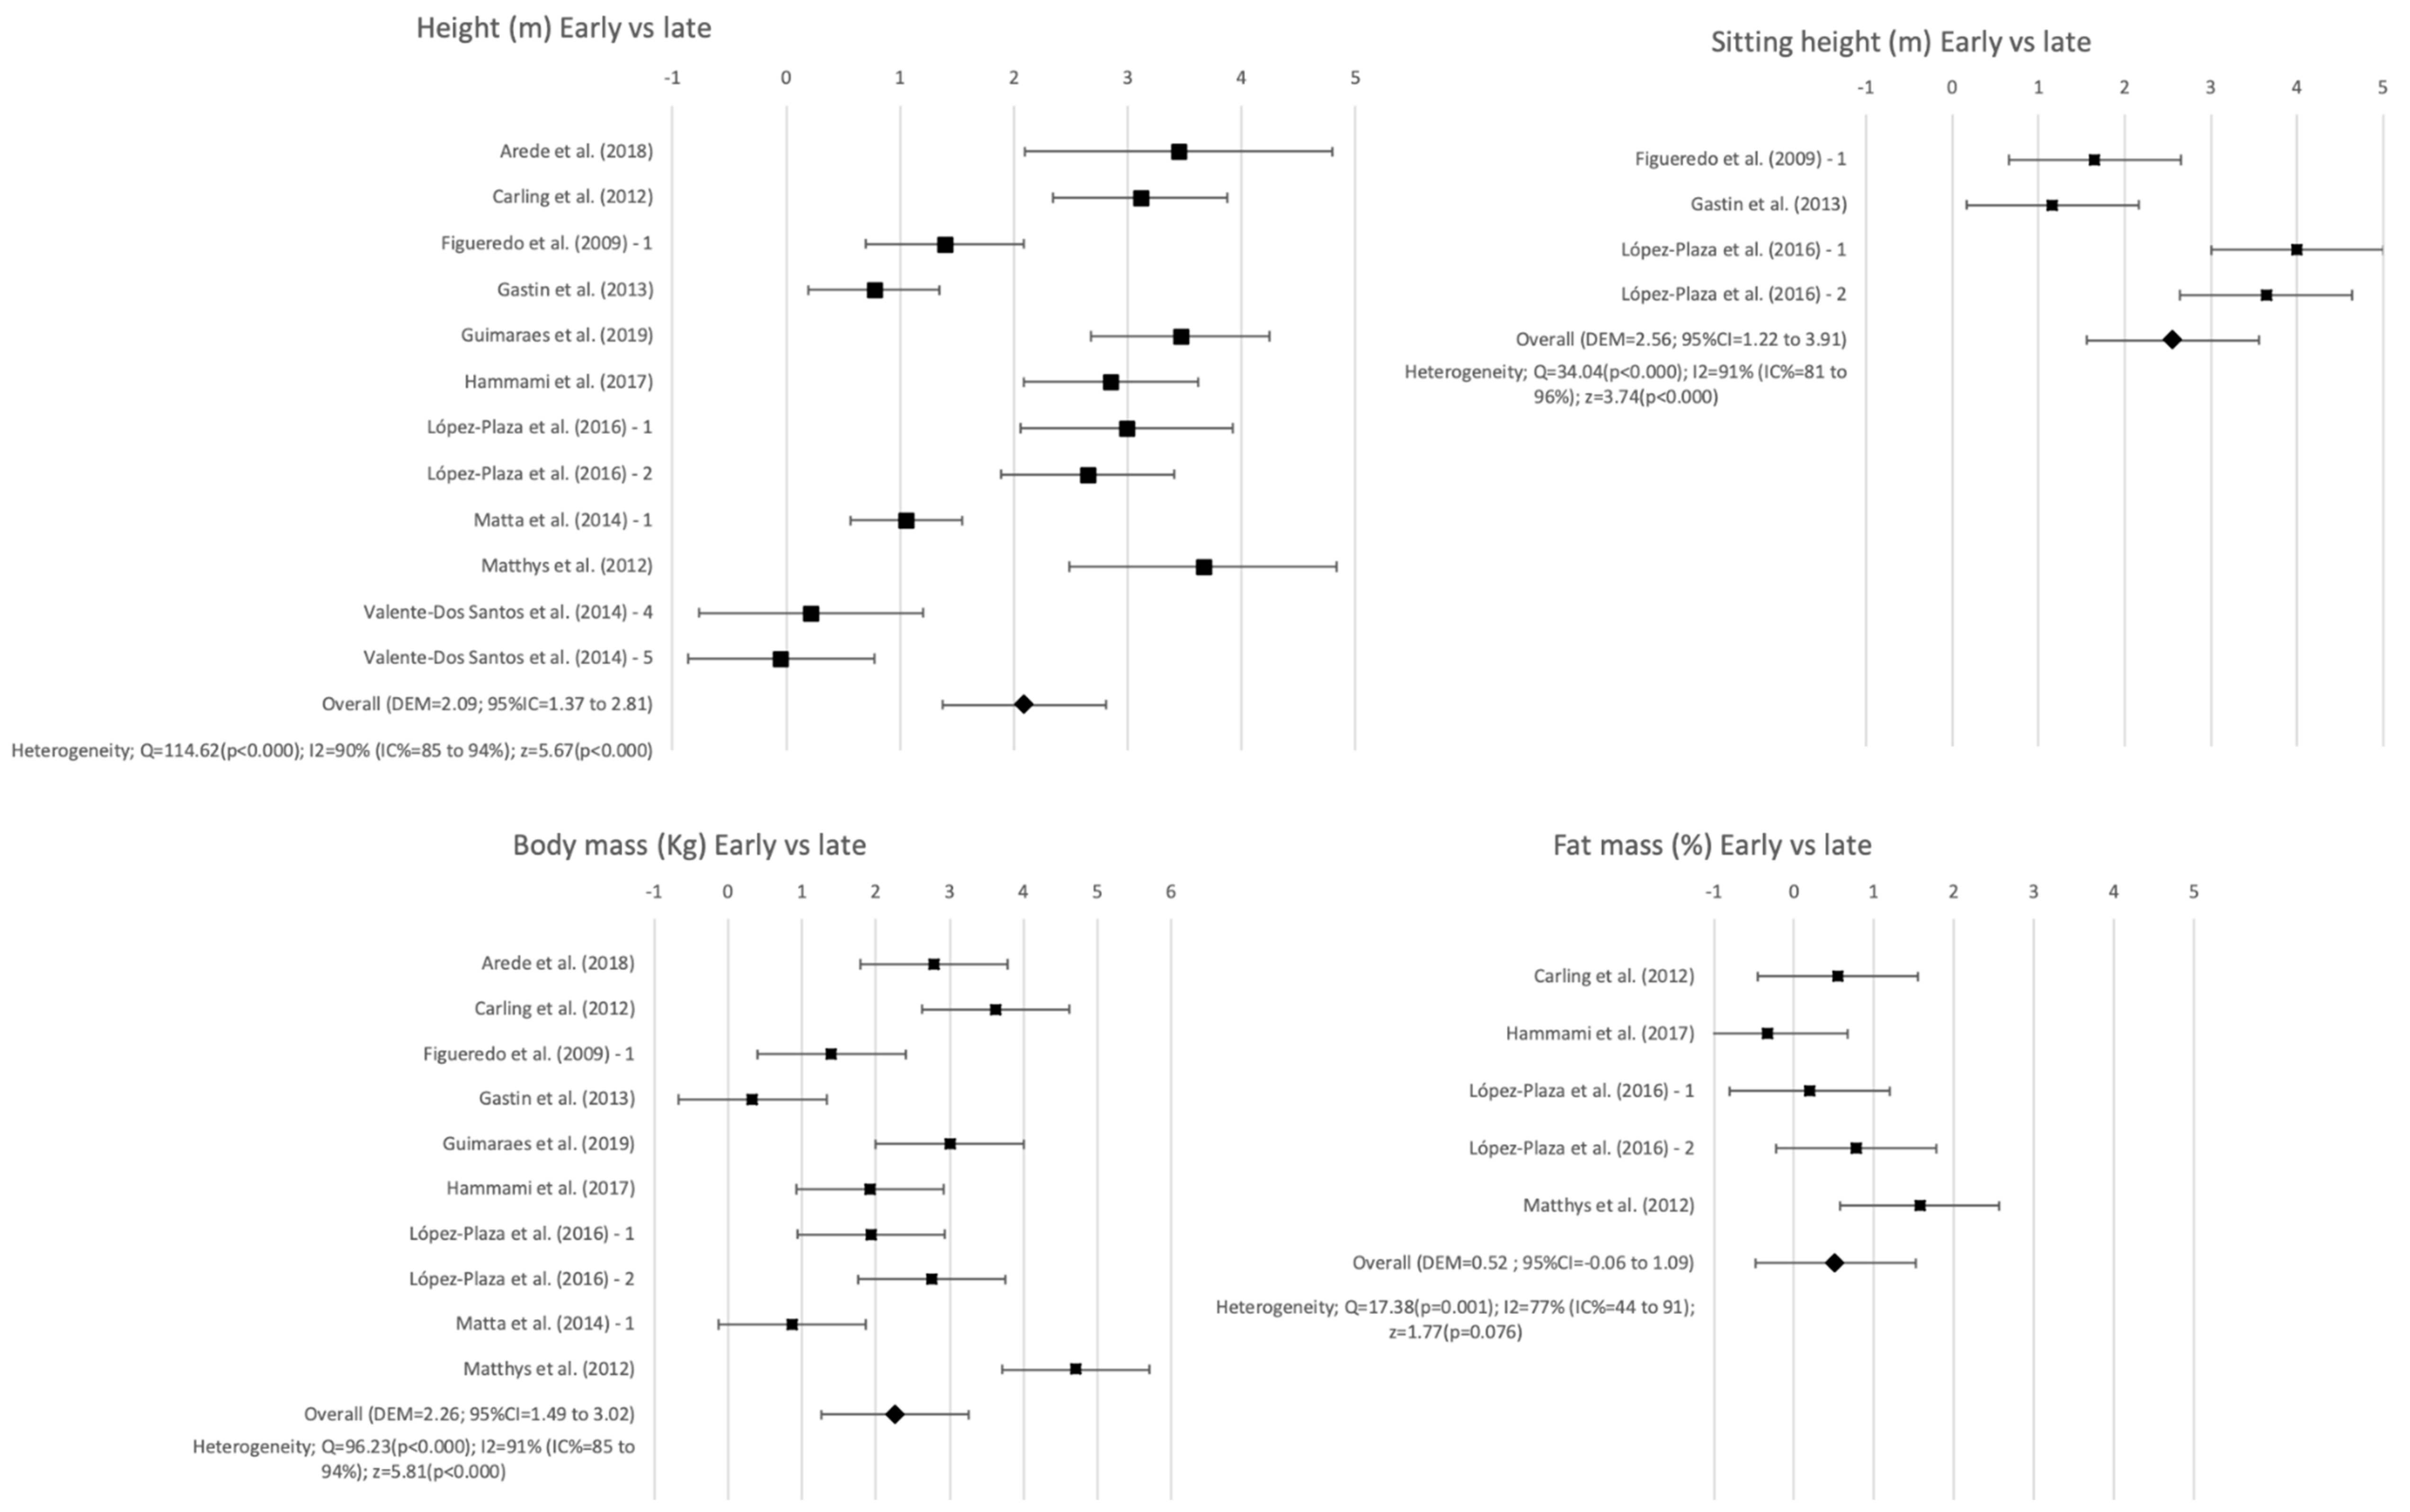
| Body mass (kg) | 11 (Table S10) M | 63.47 ± 8.47 | 54.37 ± 8.00 | 45.96 ± 7.26 | 1.07 | 0.77 to 1.38 | 6.84 | <0.001 | 2.26 | 1.49 to 3.02 | 5.81 | <0.001 | 1.29 | 0.99 to 1.59 | 8.41 | <0.001 |
| Height (m) | 11 (Table S9) M | 1.69 ± 0.06 | 1.63 ± 0.07 | 1.56 ± 0.13 | 0.90 | 0.50 to 1.29 | 4.44 | <0.001 | 2.09 | 1.37 to 2.81 | 5.67 | <0.001 | 1.13 | 0.76 to 1.50 | 6.04 | <0.001 |
| Sitting height (m) | 3 (Table S12) M | 86.15 ± 2.96 | 81.42 ± 2.85 | 79.91 ± 3.23 | 1.64 | 0.92 to 2.36 | 4.46 | <0.001 | 2.56 | 1.22 to 3.91 | 3.74 | <0.001 | 1.76 | 0.77 to 2.75 | 3.47 | <0.001 |
| BMI (kg/m2) | 1 (Table S13) M | 21.93 ± 2.59 | 20.52 ± 2.38 | 18.76 ± 1.73 | 0.54 | 0.20 to 0.88 | 3.13 | 0.002 | 1.35 | 0.65 to 2.05 | 3.80 | <0.001 | 0.82 | 0.36 to 1.28 | 3.52 | <0.001 |
| Fat mass (%) | 5 (Table S11) M | 15.76 ± 5.32 | 13.75 ± 4.60 | 12.49 ± 4.77 | 0.37 | 0.06 to 0.67 | 2.33 | 0.02 | 0.52 | −0.06 to 1.09 | 1.77 | 0.07 | 0.47 | 0.22 to 0.72 | 3.65 | <0.001 |
| Body mass (kg) | 2 (Table S15) F | 54.8 ± 10.10 | − | 44.75 ± 8.80 | − | − | − | − | 0.96 | 0.54 to 1.39 | 4.42 | <0.001 | − | − | − | − |
| Height (m) | 2 (Table S14) F | 1.62 ± 0.06 | − | 1.53 ± 0.08 | − | − | − | − | 1.19 | 0.75 to 1.63 | 5.31 | <0.001 | − | − | − | − |
| BMI (kg/m2) | 2 (Table S16) F | 20.5 ± 3.27 | − | 18.65 ± 2.54 | − | − | − | − | 0.56 | −0.21 to 1.32 | 1.43 | 0.15 | − | − | − | − |
Publisher’s Note: MDPI stays neutral with regard to jurisdictional claims in published maps and institutional affiliations. |
© 2021 by the authors. Licensee MDPI, Basel, Switzerland. This article is an open access article distributed under the terms and conditions of the Creative Commons Attribution (CC BY) license (http://creativecommons.org/licenses/by/4.0/).
Share and Cite
Albaladejo-Saura, M.; Vaquero-Cristóbal, R.; González-Gálvez, N.; Esparza-Ros, F. Relationship between Biological Maturation, Physical Fitness, and Kinanthropometric Variables of Young Athletes: A Systematic Review and Meta-Analysis. Int. J. Environ. Res. Public Health 2021, 18, 328. https://0-doi-org.brum.beds.ac.uk/10.3390/ijerph18010328
Albaladejo-Saura M, Vaquero-Cristóbal R, González-Gálvez N, Esparza-Ros F. Relationship between Biological Maturation, Physical Fitness, and Kinanthropometric Variables of Young Athletes: A Systematic Review and Meta-Analysis. International Journal of Environmental Research and Public Health. 2021; 18(1):328. https://0-doi-org.brum.beds.ac.uk/10.3390/ijerph18010328
Chicago/Turabian StyleAlbaladejo-Saura, Mario, Raquel Vaquero-Cristóbal, Noelia González-Gálvez, and Francisco Esparza-Ros. 2021. "Relationship between Biological Maturation, Physical Fitness, and Kinanthropometric Variables of Young Athletes: A Systematic Review and Meta-Analysis" International Journal of Environmental Research and Public Health 18, no. 1: 328. https://0-doi-org.brum.beds.ac.uk/10.3390/ijerph18010328