Green Space Exposure Association with Type 2 Diabetes Mellitus, Physical Activity, and Obesity: A Systematic Review

 ,
, 
Abstract
:1. Introduction
2. Materials and Methods
2.1. Data Sources and Search Strategy
2.2. Selection Criteria
2.3. Data Extraction and Management
2.4. Quality Assessment in Included Studies
3. Results
3.1. Diabetes
3.2. Overweight and Obesity
3.3. Physical Activity
4. Discussion
5. Conclusions
Author Contributions
Funding
Institutional Review Board Statement
Informed Consent Statement
Data Availability Statement
Acknowledgments
Conflicts of Interest
Appendix A

| Section/Topic | # | Checklist Item | Reported on Page |
|---|---|---|---|
| TITLE | |||
| Title | 1 | Identify the report as a systematic review, meta-analysis, or both. | 1 |
| ABSTRACT | |||
| Structured summary | 2 | Provide a structured summary including, as applicable: background; objectives; data sources; study eligibility criteria, participants, and interventions; study appraisal and synthesis methods; results; limitations; conclusions and implications of key findings; systematic review registration number. | 1 |
| INTRODUCTION | |||
| Rationale | 3 | Describe the rationale for the review in the context of what is already known. | 1–4 |
| Objectives | 4 | Provide an explicit statement of questions being addressed with reference to participants, interventions, comparisons, outcomes, and study design (PICOS). | 5 |
| METHODS | |||
| Protocol and registration | 5 | Indicate whether a review protocol exists, whether and where it can be accessed (e.g., Web address), and, if available, provide registration information including registration number. | NA |
| Eligibility criteria | 6 | Specify study characteristics (e.g., PICOS, length of follow-up) and report characteristics (e.g., years considered, language, publication status) used as criteria for eligibility, giving rationale. | 6 |
| Information sources | 7 | Describe all information sources (e.g., databases with dates of coverage, contact with study authors to identify additional studies) in the search and date last searched. | 5 |
| Search | 8 | Present full electronic search strategy for at least one database, including any limits used, such that it could be repeated. | 5 |
| Study selection | 9 | State the process for selecting studies (i.e., screening, eligibility, included in systematic review, and, if applicable, included in the meta-analysis). | 6 |
| Data collection process | 10 | Describe method of data extraction from reports (e.g., piloted forms, independently, in duplicate) and any processes for obtaining and confirming data from investigators. | 6 |
| Data items | 11 | List and define all variables for which data were sought (e.g., PICOS, funding sources) and any assumptions and simplifications made. | 5 |
| Risk of bias in individual studies | 12 | Describe methods used for assessing risk of bias of individual studies (including specification of whether this was done at the study or outcome level), and how this information is to be used in any data synthesis. | 6 |
| Summary measures | 13 | State the principal summary measures (e.g., risk ratio, difference in means). | 6 |
| Synthesis of results | 14 | Describe the methods of handling data and combining results of studies, if done, including measures of consistency (e.g., I2) for each meta-analysis. | NA |
| Risk of bias across studies | 15 | Specify any assessment of risk of bias that may affect the cumulative evidence (e.g., publication bias, selective reporting within studies). | 5 |
| Additional analyses | 16 | Describe methods of additional analyses (e.g., sensitivity or subgroup analyses, meta-regression), if done, indicating which were pre-specified. | NA |
| RESULTS | |||
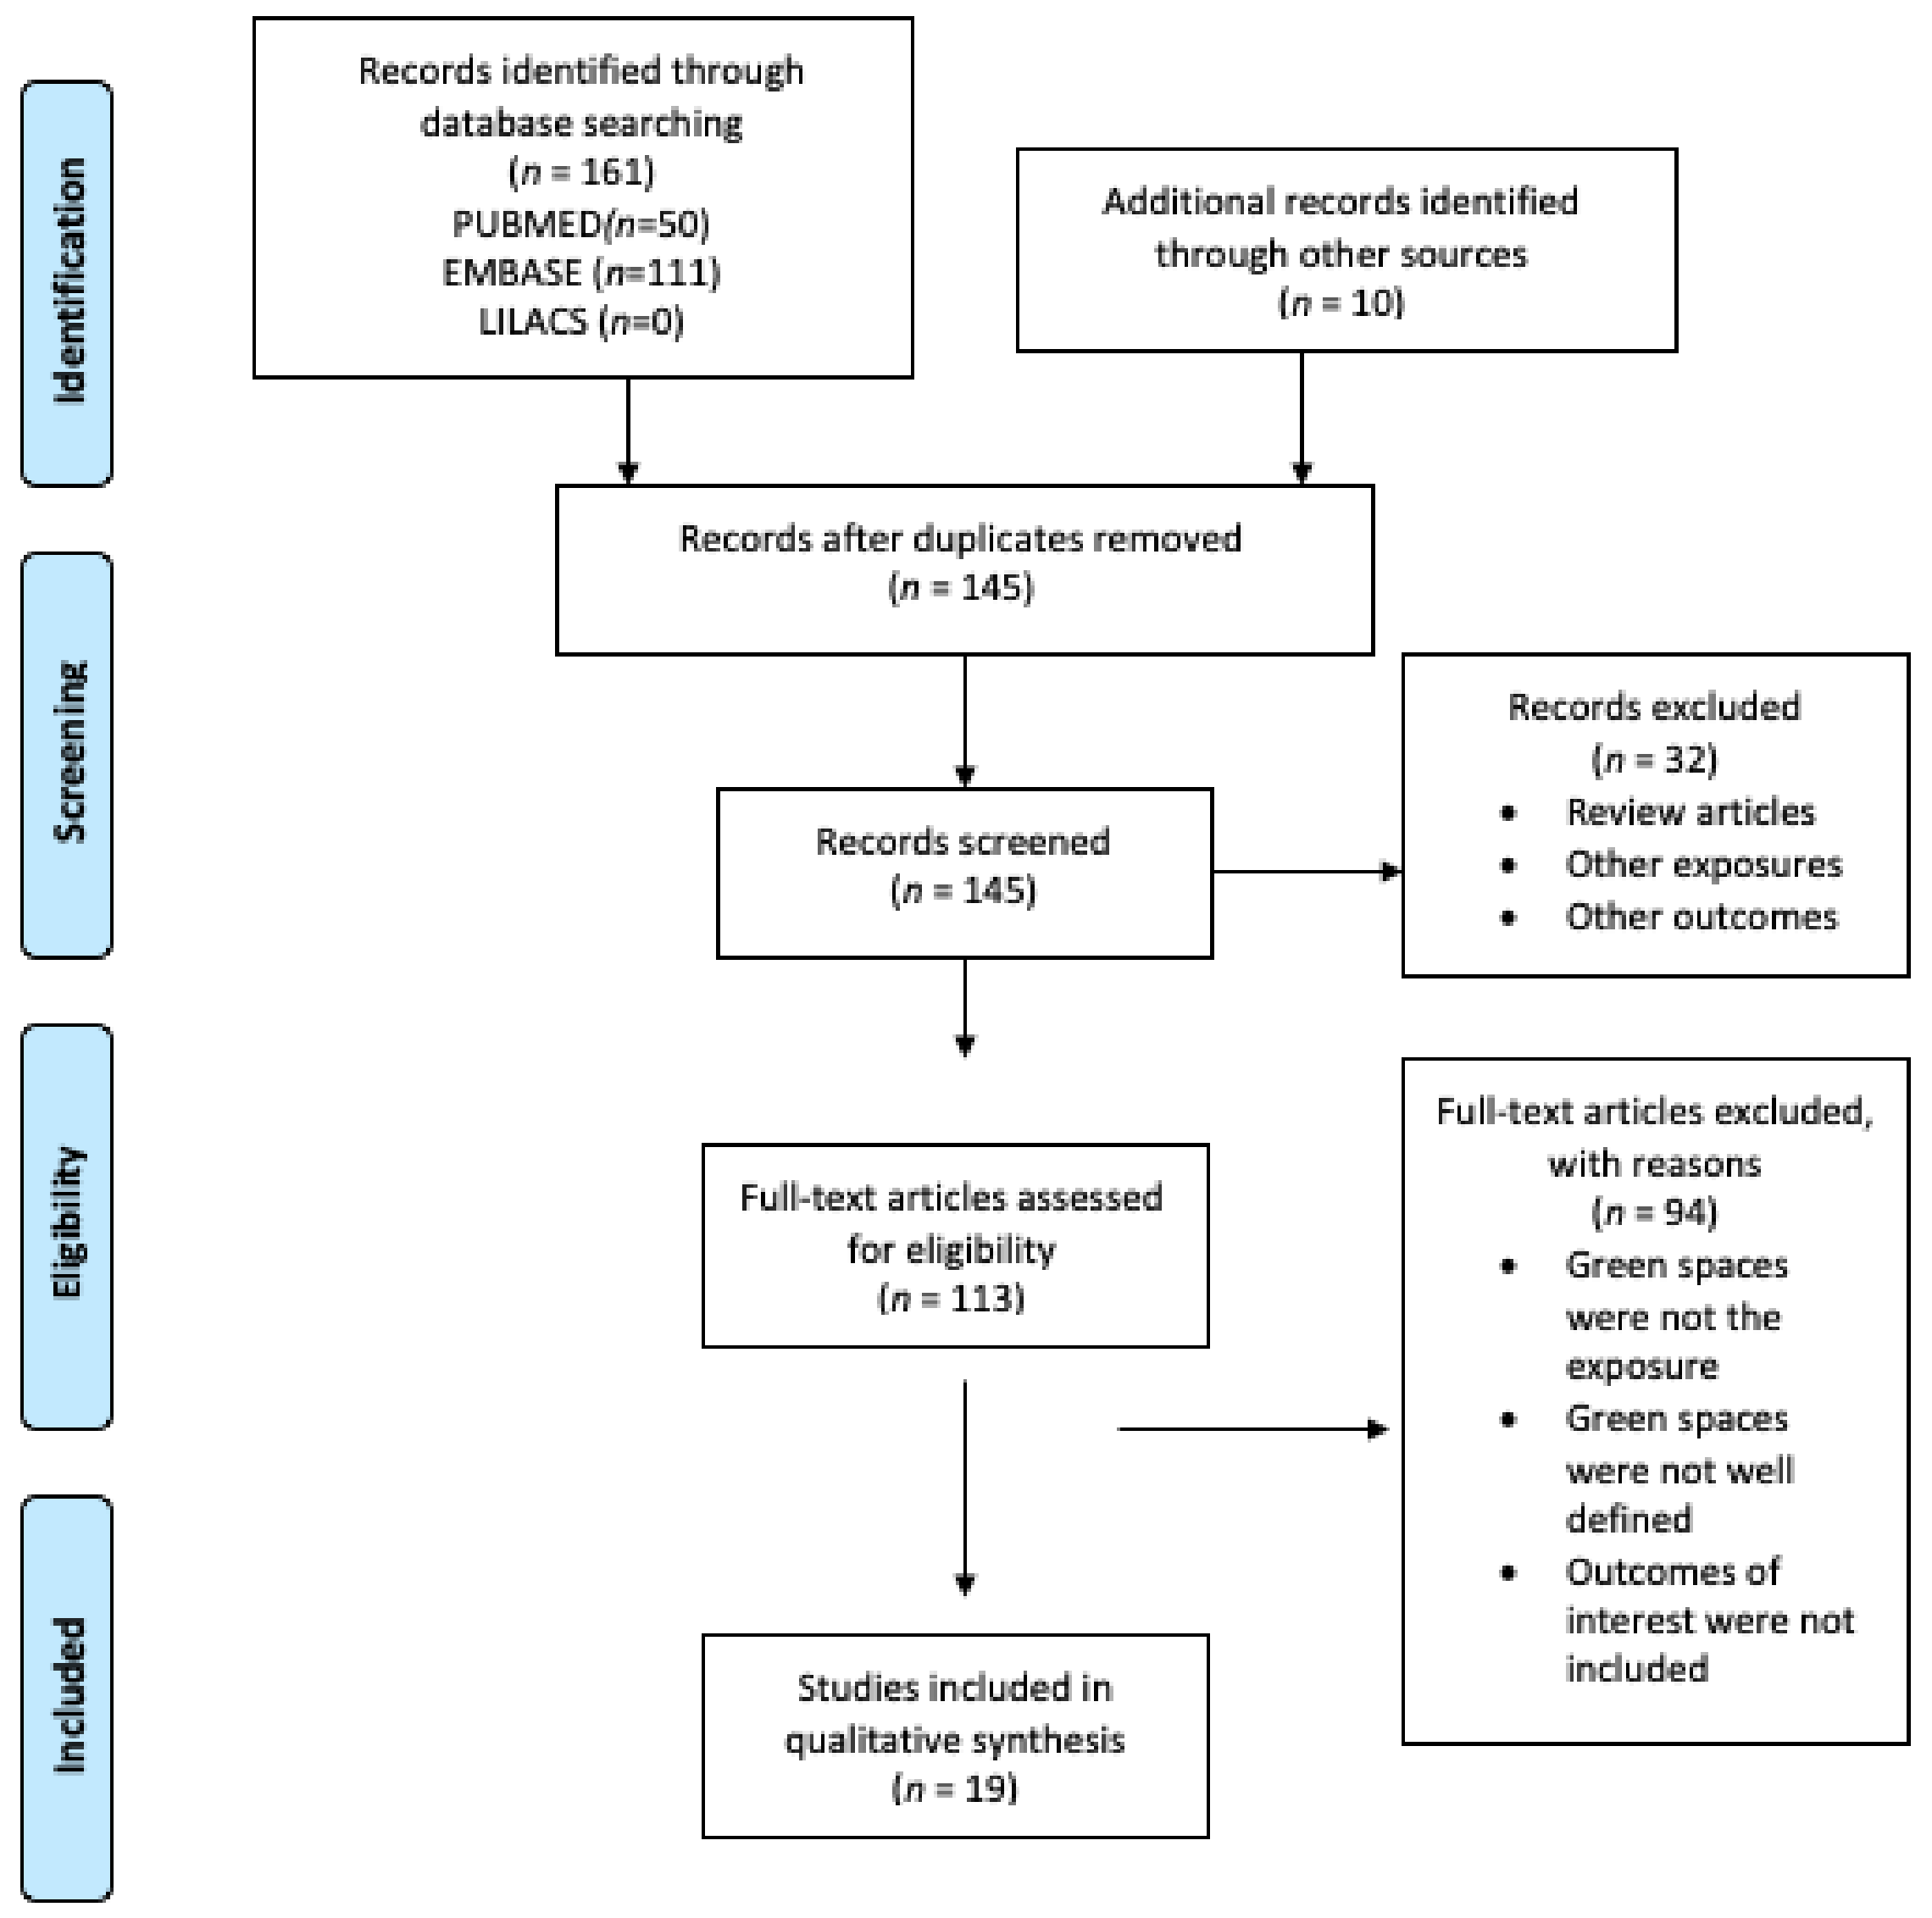
| Study selection | 17 | Give numbers of studies screened, assessed for eligibility, and included in the review, with reasons for exclusions at each stage, ideally with a flow diagram. | 7 |
| Study characteristics | 18 | For each study, present characteristics for which data were extracted (e.g., study size, PICOS, follow-up period) and provide the citations. | 8–16 |
| Risk of bias within studies | 19 | Present data on risk of bias of each study and, if available, any outcome level assessment (see item 12). | 8–16 |
| Results of individual studies | 20 | For all outcomes considered (benefits or harms), present, for each study: (a) simple summary data for each intervention group (b) effect estimates and confidence intervals, ideally with a forest plot. | 8–16 |
| Synthesis of results | 21 | Present results of each meta-analysis done, including confidence intervals and measures of consistency. | NA |
| Risk of bias across studies | 22 | Present results of any assessment of risk of bias across studies (see Item 15). | 8–16 |
| Additional analysis | 23 | Give results of additional analyses, if done (e.g., sensitivity or subgroup analyses, meta-regression (see Item 16)). | NA |
| DISCUSSION | |||
| Summary of evidence | 24 | Summarize the main findings including the strength of evidence for each main outcome; consider their relevance to key groups (e.g., healthcare providers, users, and policymakers). | 17 |
| Limitations | 25 | Discuss limitations at study and outcome level (e.g., risk of bias), and at review level (e.g., incomplete retrieval of identified research, reporting bias). | 19 |
| Conclusions | 26 | Provide a general interpretation of the results in the context of other evidence and implications for future research. | 20 |
| FUNDING | |||
| Funding | 27 | Describe sources of funding for the systematic review and other support (e.g., supply of data) and the role of funders for the systematic review. | 20 |
References
- International Diabetes Federation. IDF Diabetes Atlas, Ninth Edition. 2019. Available online: https://diabetesatlas.org/upload/resources/material/20200302_133351_IDFATLAS9e-final-web.pdf (accessed on 15 September 2020).
- World Health Organization. International Diabetes Federation Diagnosis and Management of Type 2 Diabetes-(HEARTS-D); World Health Organization: Geneva, Switzerland, 2020. [Google Scholar]
- Bommer, C.; Sagalova, V.; Heesemann, E.; Manne-Goehler, J.; Atun, R.; Bärnighausen, T.; Davies, J.; Vollmer, S. Global Economic Burden of Diabetes in Adults: Projections From 2015 to 2030. Diabetes Care 2018, 41, 963–970. [Google Scholar] [CrossRef] [Green Version]
- Gassasse, Z.; Smith, D.; Finer, S.; Gallo, V. Association between urbanisation and type 2 diabetes: An ecological study. BMJ Glob. Health 2017, 2, e000473. [Google Scholar] [CrossRef] [Green Version]
- Fletcher, B.; Gulanick, M.; Lamendola, C. Risk factors for type 2 diabetes mellitus. J. Cardiovasc. Nurs. 2002, 16, 17–23. [Google Scholar] [CrossRef]
- Kautzky-Willer, A.; Harreiter, J.; Pacini, G. Sex and Gender Differences in Risk, Pathophysiology and Complications of Type 2 Diabetes Mellitus. Endocr. Rev. 2016, 37, 278–316. [Google Scholar] [CrossRef] [Green Version]
- Clark, M.L.; Utz, S.W. Social determinants of type 2 diabetes and health in the United States. World J. Diabetes 2014, 5, 296–304. [Google Scholar] [CrossRef] [PubMed]
- Cockerham, W.C.; Hamby, B.W.; Oates, G.R. The Social Determinants of Chronic Disease. Am. J. Prev. Med. 2017, 52, S5–S12. [Google Scholar] [CrossRef] [PubMed] [Green Version]
- Graham, H.; White, P.C.L. Social determinants and lifestyles: Integrating environmental and public health perspectives. Public Health 2016, 141, 270–278. [Google Scholar] [CrossRef] [PubMed]
- Dendup, T.; Feng, X.; Clingan, S.; Astell-Burt, T. Environmental Risk Factors for Developing Type 2 Diabetes Mellitus: A Systematic Review. Int. J. Environ. Res. Public Health 2018, 15, 78. [Google Scholar] [CrossRef] [PubMed] [Green Version]
- Scott, A.; Chambers, D.; Goyder, E.; O’Cathain, A. Socioeconomic inequalities in mortality, morbidity and diabetes management for adults with type 1 diabetes: A systematic review. PLoS ONE 2017, 12, e0177210. [Google Scholar] [CrossRef] [Green Version]
- Ramón, C.L.; García, M.I.Á. Diabetes mellitus hacia una perspectiva social. Rev. Cuba. Salud Pública 2013, 39, 331–345. [Google Scholar]
- Den Braver, N.R.; Lakerveld, J.; Rutters, F.; Schoonmade, L.J.; Brug, J.; Beulens, J.W.J. Built environmental characteristics and diabetes: A systematic review and meta-analysis. BMC Med. 2018, 16, 12. [Google Scholar] [CrossRef] [PubMed] [Green Version]
- Freedman, V.A.; Grafova, I.B.; Rogowski, J. Neighborhoods and Chronic Disease Onset in Later Life. Am. J. Public Health 2011, 101, 79–86. [Google Scholar] [CrossRef] [PubMed]
- Rojas-Rueda, D.; Nieuwenhuijsen, M.J.; Gascon, M.; Perez-Leon, D.; Mudu, P. Green spaces and mortality: A systematic review and meta-analysis of cohort studies. Lancet Planet. Health 2019, 3, e469–e477. [Google Scholar] [CrossRef] [Green Version]
- Jennings, V.; Bamkole, O. The Relationship between Social Cohesion and Urban Green Space: An Avenue for Health Promotion. Int. J. Environ. Res. Public Health 2019, 16, 452. [Google Scholar] [CrossRef] [PubMed] [Green Version]
- Swanwick, C.; Dunnett, N.; Woolley, H. Nature, Role and Value of Green Space in Towns and Cities: An Overview. Built Environ. 2003, 29, 94–106. [Google Scholar] [CrossRef]
- World Health Organization. Regional Office for Europe Urban Green Spaces a Brief for Action 2017; World Health Organization: Geneva, Switzerland, 2017. [Google Scholar]
- Mears, M.; Brindley, P.; Jorgensen, A.; Maheswaran, R. Population-level linkages between urban greenspace and health inequality: The case for using multiple indicators of neighbourhood greenspace. Health Place 2020, 62, 102284. [Google Scholar] [CrossRef]
- Hibbard, K.A.; Hoffman, F.M.; Huntzinger, D.; West, T.O.; Wuebbles, D.J.; Fahey, D.W.; Hibbard, K.A.; Dokken, D.J.; Stewart, B.C.; Maycock, T.K. Ch. 10: Changes in Land Cover and Terrestrial Biogeochemistry. 2017. Available online: https://science2017.globalchange.gov/chapter/10/ (accessed on 20 October 2020).
- Sheldon, T.A.; Wright, J. Twin epidemics of covid-19 and non-communicable disease. BMJ 2020, 369, m2618. [Google Scholar] [CrossRef]
- Huang, I.; Lim, M.A.; Pranata, R. Diabetes mellitus is associated with increased mortality and severity of disease in COVID-19 pneumonia—A systematic review, meta-analysis, and meta-regression. Diabetes Metab. Syndr. 2020, 14, 395–403. [Google Scholar] [CrossRef]
- Slater, S.J. Recommendations for Keeping Parks and Green Space Accessible for Mental and Physical Health During COVID-19 and Other Pandemics. Prev. Chronic Dis. 2020, 17, E59. [Google Scholar] [CrossRef]
- Braubach, M.; Egorov, A.; Mudu, P.; Wolf, T.; Ward Thompson, C.; Martuzzi, M. Effects of Urban Green Space on Environmental Health, Equity and Resilience. In Nature-Based Solutions to Climate Change Adaptation in Urban Areas: Linkages between Science, Policy and Practice; Kabisch, N., Korn, H., Stadler, J., Bonn, A., Eds.; Springer International Publishing: Cham, Switzerland, 2017; pp. 187–205. ISBN 978-3-319-56091-5. [Google Scholar]
- Lin, B.; Meyers, J.; Barnett, G. Understanding the potential loss and inequities of green space distribution with urban densification. Urban For. Urban Green. 2015, 14, 952–958. [Google Scholar] [CrossRef]
- De la Barrera, F.; Henriquez, C.; Ruiz, V.; Inostroza, L. Urban Parks and Social Inequalities in the Access to Ecosystem Services in Santiago, Chile. IOP Conf. Ser. Mater. Sci. Eng. 2019, 471, 102042. [Google Scholar] [CrossRef]
- Wüstemann, H.; Kalisch, D.; Kolbe, J. Access to urban green space and environmental inequalities in Germany. Landsc. Urban Plan. 2017, 164, 124–131. [Google Scholar]
- Rook, G.A. Regulation of the immune system by biodiversity from the natural environment: An ecosystem service essential to health. Proc. Natl. Acad. Sci. USA 2013, 110, 18360–18367. [Google Scholar] [CrossRef] [PubMed] [Green Version]
- Higgins, J.P.T.; Green, S. Manual Cochrane de Revisiones Sistemáticas de Intervención; Versión 5.1.0. Available online: https://es.cochrane.org/sites/es.cochrane.org/files/public/uploads/Manual_Cochrane_510_reduit.pdf (accessed on 15 September 2020).
- Moher, D.; Liberati, A.; Tetzlaff, J.; Altman, D.G.; Group, T.P. Preferred Reporting Items for Systematic Reviews and Meta-Analyses: The PRISMA Statement. PLoS Med. 2009, 6, e1000097. [Google Scholar] [CrossRef] [PubMed] [Green Version]
- Liberati, A.; Altman, D.G.; Tetzlaff, J.; Mulrow, C.; Gøtzsche, P.C.; Ioannidis, J.P.A.; Clarke, M.; Devereaux, P.J.; Kleijnen, J.; Moher, D. The PRISMA statement for reporting systematic reviews and meta-analyses of studies that evaluate healthcare interventions: Explanation and elaboration. BMJ 2009, 339, b2700. [Google Scholar] [CrossRef] [Green Version]
- National Heart, Lung and Blood Institute. National Institute of Health Study Quality Assessment Tools|NHLBI, NIH. Available online: https://www.nhlbi.nih.gov/health-topics/study-quality-assessment-tools (accessed on 1 October 2020).
- Ngom, R.; Gosselin, P.; Blais, C.; Rochette, L. Type and Proximity of Green Spaces Are Important for Preventing Cardiovascular Morbidity and Diabetes—A Cross-Sectional Study for Quebec, Canada. Int. J. Environ. Res. Public Health 2016, 13, 423. [Google Scholar] [CrossRef] [Green Version]
- Sidawi, B.; Alhariri, M.T.; Albaker, W.I. Creating a healthy built environment for diabetic patients: The case study of the eastern province of the Kingdom of Saudi Arabia. Glob. J. Health Sci. 2014, 6, 136–147. [Google Scholar] [CrossRef] [Green Version]
- Clark, C.; Sbihi, H.; Tamburic, L.; Brauer, M.; Frank, L.D.; Davies, H.W. Association of Long-Term Exposure to Transportation Noise and Traffic-Related Air Pollution with the Incidence of Diabetes: A Prospective Cohort Study. Environ. Health Perspect. 2017, 125, 087025. [Google Scholar] [CrossRef] [Green Version]
- Paquet, C.; Coffee, N.T.; Haren, M.T.; Howard, N.J.; Adams, R.J.; Taylor, A.W.; Daniel, M. Food environment, walkability, and public open spaces are associated with incident development of cardio-metabolic risk factors in a biomedical cohort. Health Place 2014, 28, 173–176. [Google Scholar] [CrossRef]
- Lee, H.; Kang, H.-M.; Ko, Y.-J.; Kim, H.-S.; Kim, Y.-J.; Bae, W.K.; Park, S.; Cho, B. Influence of urban neighbourhood environment on physical activity and obesity-related diseases. Public Health 2015, 129, 1204–1210. [Google Scholar] [CrossRef]
- Dalton, A.M.; Jones, A.P.; Sharp, S.J.; Cooper, A.J.M.; Griffin, S.; Wareham, N.J. Residential neighbourhood greenspace is associated with reduced risk of incident diabetes in older people: A prospective cohort study. BMC Public Health 2016, 16, 1117. [Google Scholar] [CrossRef] [PubMed] [Green Version]
- Bodicoat, D.H.; O’Donovan, G.; Dalton, A.M.; Gray, L.J.; Yates, T.; Edwardson, C.; Hill, S.; Webb, D.R.; Khunti, K.; Davies, M.J.; et al. The association between neighbourhood greenspace and type 2 diabetes in a large cross-sectional study. BMJ Open 2014, 4, e006076. [Google Scholar] [CrossRef] [PubMed] [Green Version]
- Lovasi, G.S.; Schwartz-Soicher, O.; Quinn, J.W.; Berger, D.K.; Neckerman, K.; Jaslow, R.; Lee, K.K.; Rundle, A. Neighborhood safety and green space as predictors of obesity among preschool children from low-income families in New York City. Prev. Med. 2013, 57, 189–193. [Google Scholar] [CrossRef] [PubMed] [Green Version]
- Shanahan, D.F.; Bush, R.; Gaston, K.J.; Lin, B.B.; Dean, J.; Barber, E.; Fuller, R.A. Health Benefits from Nature Experiences Depend on Dose. Sci. Rep. 2016, 6, 28551. [Google Scholar] [CrossRef] [PubMed] [Green Version]
- Prince, S.A.; Kristjansson, E.A.; Russell, K.; Billette, J.-M.; Sawada, M.; Ali, A.; Tremblay, M.S.; Prud’homme, D. A Multilevel Analysis of Neighbourhood Built and Social Environments and Adult Self-Reported Physical Activity and Body Mass Index in Ottawa, Canada. Int. J. Environ. Res. Public Health 2011, 8, 3953–3978. [Google Scholar] [CrossRef]
- Lovasi, G.S.; Jacobson, J.S.; Quinn, J.W.; Neckerman, K.M.; Ashby-Thompson, M.N.; Rundle, A. Is the Environment Near Home and School Associated with Physical Activity and Adiposity of Urban Preschool Children? J. Urban Health 2011, 88, 1143–1157. [Google Scholar] [CrossRef] [Green Version]
- Hrudey, E.J.; Kunst, A.E.; Stronks, K.; Vrijkotte, T.G.M. Do neighborhood characteristics in Amsterdam influence adiposity at preschool age? Int. J. Environ. Res. Public Health 2015, 12, 5561–5580. [Google Scholar] [CrossRef] [Green Version]
- Sanders, T.; Feng, X.; Fahey, P.P.; Lonsdale, C.; Astell-Burt, T. Green Space and Child Weight Status: Does Outcome Measurement Matter? Evidence from an Australian Longitudinal Study. J. Obes. 2015, 2015, 194838. [Google Scholar] [CrossRef] [Green Version]
- Putrik, P.; van Amelsvoort, L.; De Vries, N.K.; Mujakovic, S.; Kunst, A.E.; van Oers, H.; Jansen, M.; Kant, I. Neighborhood Environment Is Associated with Overweight and Obesity, Particularly in Older Residents: Results from Cross-Sectional Study in Dutch Municipality. J. Urban Health 2015, 92, 1038–1051. [Google Scholar] [CrossRef] [PubMed] [Green Version]
- James, P.; Kioumourtzoglou, M.-A.; Hart, J.E.; Banay, R.F.; Kloog, I.; Laden, F. Interrelationships between Walkability, Air Pollution, Greenness, and Body Mass Index. Epidemiology 2017, 28, 780–788. [Google Scholar] [CrossRef]
- Klompmaker, J.O.; Hoek, G.; Bloemsma, L.D.; Gehring, U.; Strak, M.; Wijga, A.H.; van den Brink, C.; Brunekreef, B.; Lebret, E.; Janssen, N.A.H. Green space definition affects associations of green space with overweight and physical activity. Environ. Res. 2018, 160, 531–540. [Google Scholar] [CrossRef] [PubMed]
- Petraviciene, I.; Grazuleviciene, R.; Andrusaityte, S.; Dedele, A.; Nieuwenhuijsen, M.J. Impact of the Social and Natural Environment on Preschool-Age Children Weight. Int. J. Environ. Res. Public Health 2018, 15, 449. [Google Scholar] [CrossRef] [PubMed] [Green Version]
- Dadvand, P.; Villanueva, C.M.; Font-Ribera, L.; Martinez, D.; Basagaña, X.; Belmonte, J.; Vrijheid, M.; Gražulevičienė, R.; Kogevinas, M.; Nieuwenhuijsen, M.J. Risks and Benefits of Green Spaces for Children: A Cross-Sectional Study of Associations with Sedentary Behavior, Obesity, Asthma, and Allergy. Environ. Health Perspect. 2014, 122, 1329–1335. [Google Scholar] [CrossRef]
- Coombes, E.; Jones, A.P.; Hillsdon, M. The relationship of physical activity and overweight to objectively measured green space accessibility and use. Soc. Sci. Med. 2010, 70, 816–822. [Google Scholar] [CrossRef] [PubMed] [Green Version]
- Groenewegen, P.P.; Zock, J.-P.; Spreeuwenberg, P.; Helbich, M.; Hoek, G.; Ruijsbroek, A.; Strak, M.; Verheij, R.; Volker, B.; Waverijn, G.; et al. Neighbourhood social and physical environment and general practitioner assessed morbidity. Health Place 2018, 49, 68–84. [Google Scholar] [CrossRef]
- Lachowycz, K.; Jones, A.P. Towards a better understanding of the relationship between greenspace and health: Development of a theoretical framework. Landsc. Urban Plan. 2013, 118, 62–69. [Google Scholar] [CrossRef]
- Waverijn, G.; Heijmans, M.; Groenewegen, P.P. Chronic illness self-management: A mechanism behind the relationship between neighbourhood social capital and health? Eur. J. Public Health 2017, 27, 594–599. [Google Scholar] [CrossRef] [Green Version]
- Vieira, J.; Matos, P.; Mexia, T.; Silva, P.; Lopes, N.; Freitas, C.; Correia, O.; Santos-Reis, M.; Branquinho, C.; Pinho, P. Green spaces are not all the same for the provision of air purification and climate regulation services: The case of urban parks. Environ. Res. 2018, 160, 306–313. [Google Scholar] [CrossRef]
- Liu, L.; Zhong, Y.; Ao, S.; Wu, H. Exploring the Relevance of Green Space and Epidemic Diseases Based on Panel Data in China from 2007 to 2016. Int. J. Environ. Res. Public Health 2019, 16, 2551. [Google Scholar] [CrossRef] [Green Version]


| No. | Author, Year, Location | Study Design | Population Description | Exposure | Exposure Assessment | Outcome | Outcome Assessment | Effect Size/Association | Factors Adjusted | Quality Assessment |
|---|---|---|---|---|---|---|---|---|---|---|
| 1 | Ngom et al., 2016, Canada [33] | Cross sectional study | n = 3,920,000, male and females >20 years old | Green spaces | Geographic information system, postal code | Diabetes | Health databases from surveillance | People who live further from green spaces with sports facilities have a prevalence rate ratio = 1.09 (1.03–1.13), p < 0.01 | Age and gender | 10/14 |
| 2 | Sidawi et al., 2014, Kingdom of Saudi Arabia [34] | Cross sectional study | n = 76 male and female, 15–70 years old | Build environment- recreation and sport centers | Questionnaire about home environmental conditions | Diabetes | Medical records | Respondents, who had diabetes earlier, said that the recreation and sport centers are farther from their homes than those who had diabetes later | Socioeconomic conditions of the neighborhood | 5/14 |
| 3 | Clark et al., 2017, Canada [35] | Cohort | n = 380,378 males and females 45–85 years old | Green spaces | Normalized difference vegetation index (NVDI) | Diabetes | Medical records | Exposure to green spaces is protective against T2DM; adjusted odds ratio = 0.9, CI (0.87–0.93) | Age, gender, area-level household income | 11/14 |
| 4 | Paquet et al., 2014, Australia [36] | Cohort | n = 3145 >18 years old | Public open spaces with green spaces | Normalized difference vegetation index (NVDI) | Diabetes, prediabetes | Medical records by fasting blood samples | People who have more access to open public spaces with green spaces have a relative risk = 0.75 (0.69–0.83), p < 0.001 | Age, gender, education, household income, and area-level deprivation | 13/14 |
| 5 | Lee et al., 2015, Korea [37] | Cross sectional study | n = 16,178 47.50 mean age | Area of parks in neighborhood (km2) | Geographic information system | Diabetes, obesity, abdominal obesity | Medical records | People who live in a community with more parks areas in neighborhood have a lower risk of diabetes, OR = 0.86 (0.75–0.99); obesity, OR = 0.97(0.90–1.04); and abdominal obesity, OR = 0.83 (0.77–0.91) | Age, sex, smoking status, drinking status, and income level | 12/14 |
| 6 | Dalton et al., 2016, United Kingdom [38] | Cohort | n = 23,865mean age 59.1 years old | Neighborhood green space | Zip code- Geographic information system | Diabetes | Survey, medical records, hospital data | Individuals living in the greenest district quartile had a lower risk of developing diabetes, hazard ratio = 0.81 (0.65–0.9), p = 0.042 | Sex, age, body mass index (BMI), parental diabetes, and socioeconomic status | 13/14 |
| 7 | Bodicoat et al., 2014, United Kingdom [39] | Cross sectional study | n = 1047 20–75 years old | Neighborhood green space | Zip code- geographic information system | Diabetes | Medical records by oral glucose tolerance test | For diabetes prevalence, the OR = 0.97 (0.80–1.17), 0.78 (0.62–0.98), and 0.67 (0.49–0.93) for increasing quartiles of neighborhood greenspace compared with the lowest quartile | Age, sex, ethnicity, area social deprivation score, urban/rural status | 13/14 |
| No. | Author, Year, Location | Study Design | Population Description | Exposure | Exposure Assessment | Outcome | Outcome Assessment | Effect Size/Association | Factors Adjusted | Quality Assessment |
|---|---|---|---|---|---|---|---|---|---|---|
| 1 | Lovasi et al., 2013, USA [40] | Cross-sectional study | n = 11,562 children, 3–5 years old | Green spaces in neighborhood | Density of trees and park area per km2 using ZIP code | Obesity | Body mass index (BMI) z-score by health care provider | Density of street trees, β = −0.02 CI (−0.08, 0.03); prevalence ratio (PR) = 0.88 (0.79, 0.99) Area covered by parks, β = −0.01 (−0.03–0.01); PR = 0.99 (0.94–1.04) | Sex, race/ethnicity, age, and neighborhood characteristics | 10/14 |
| 2 | Shanahan et al., 2016, Australia [41] | Cross-sectional study | n = 1538, 18–70 years old | Frequency and intensity of exposure to nature | Self-reported by questionnaire/survey using the Nature Relatedness Scale | Physical activity | Number of days exercised for 30 minutes or more per week | Nature experience duration β = 0.19, p < 0.001; nature experience frequency β = 0.16, p < 0.001 | Age, gender, income, children in home, neighborhood disadvantage, workday/week, highest qualification, ethnicity, BMI, social cohesion | 11/14 |
| 3 | Prince et al., 2011, Canada [42] | Cross-sectional study | n = 3883, males and female, >18 years old | Green spaces and park areas | Geographic information system, geocode | Obesity Physical activity (PA) | Obesity = BMI measurement PA = Self-reported by questionnaire | Physical activity was lower for men in neighborhoods with a higher green space area, odds ratio (OR) = 0.93, 95% CI (0.87, 0.9). For females, green spaces were protective of being obese or overweight, OR = 0.67 CI (0.54–0.84) | Sex, age, socioeconomic status, social and built environment characteristics | 12/14 |
| 4 | Lovasi et al., 2011, USA [43] | Longitudinal study | n = 428, 2–5 years old, males and females | Green spaces | Street tree density by geographic database | Physical activity | Accelerometer | Land use mix was associated with physical activity (26 more activity counts/minute per standard deviation increase in mixed land use, p = 0.015) | Age, sex, and race/ethnicity, mother (age, born outside of the USA, use of Spanish, employed/student status), household (number of rooms), the total number of hours recorded as awake, the time of year | 13/14 |
| 5 | Hrudey et al., 2015, Netherlands [44] | Cohort | n = 3469, 5–6 years old | Green spaces | Survey with Likert scale of green spaces satisfaction | Obesity and overweight | Self-reported | No significant association was found, after adjusting for variables. β = −0.002, CI 95% (−0.3–0.3) | Maternal pre-pregnancy BMI, maternal smoking during pregnancy (yes, no), duration of exclusive breastfeeding (<3 months, 3–6 months, ≥6 months), and age at introduction of solid foods (<4 months, ≥4 months), Maternal education and maternal BMI | 13/14 |
| 6 | Sanders et al., 2015, Australia [45] | Cohort | n = 4423, 6–13 years old | Green spaces | Proportion of green spaces available in neighborhood by postcode | Obesity | Face-to-face interview, waist circumference (WC), and waist-to-height ratio (WtHR) | Compared to those who have 0% to 5% green spaces at the local level, children with >40% green space tended to have lower WC (β boys, −1.15, 95% CI −2.44, 0.14; β girls, −0.21, 95% CI −1.47, 1.05) and WtHR (β boys, −0.82, 95% CI −1.65, 0.01; β girls, −0.32, 95% CI −1.13, 0.49). No statistically significant results were found | Sex, age, socio economic status | 10/14 |
| 10 | Putrit et al., 2015, USA [46] | Cross-sectional study | n = 9971, >18 years old | Green spaces, parking facilities | Self-reported survey | Obesity/overweight | Self-reported | People who perceived more availability of green spaces showed odds ratio = 0.84, CI (0.72–0.97) for obesity and OR = 1.08, CI (0.98–1.20) for overweight. After adjusting for age, the effect size, for people from 40 to ≤65 OR for obesity = 0.80, CI (0.66–0.96), and >65 years old OR = 0.71, CI (0.54–0.93) | Age, gender, educational level | 13/14 |
| 11 | James et al., 2017, USA [47] | Cohort | n = 23,435 women, 60–87 years old | Green spaces | Normalized difference vegetation Index | Obesity | Self-reported weight and height | No significant association between all variables in the model and BMI 0.01% (−0.36–0.37) | Age, race, smoking status, husband’s education level | 10/14 |
| 12 | Klompmaker et al., 2018, Netherlands [48] | Cross-sectional study | n = 387,195, >19 years old | Green spaces | Distance to the nearest park and normalized difference vegetation index | Obesity Physical activity | Self- reported | No significant association was found, within 100 m of a park compared to the reference category (>1000 m) where 1.04 (95% CI: 0.83–1.25) and 1.02 (95% CI: 0.96– 1.07) for the highly urban and moderate–low urban population, respectively. For the elderly (≥65 years) and non-elderly, these odds ratios were 1.01 (95% CI 0.96–1.07) and 1.02 (95% CI: 0.94–1.08), respectively. Physical activity was higher in people who lived closer to the park entrance, odds ratio = 1.08 (1.03–1.14). For NVDI, greenness increased the OR = 1.14 (1.10–1.17) in the highest quintile compared to that in the lowest. | Age, sex, socioeconomic status, marital status, country of origin, work, household income, level of education, smoking status, alcohol use, indoor physical activity | 12/14 |
| 13 | Petraviciene et al., 2018, Lithuania [49] | Cross-sectional study | n = 1489 mothers and their 4–6-year-old children | Green spaces | Normalized difference vegetation Index | Obesity and overweight | Self-reported by standardized questionnaires | Children who live in areas with less greenness exposure, have higher risk of being obese/overweight OR = 1.72 CI (1.15–2.60), p < 0.05 | Family status, maternal age, education, employment status, smoking during pregnancy, secondhand smoking, mother–child relationship, NO2; child´s sex, birth weight, and sedentary behavior | 12/14 |
| 14 | Dadvand et al., 2014, Spain [50] | Cross-sectional study | n = 3178, 9–12 years old | Green spaces | Normalized difference vegetation index, proximity to green space by Urban Atlas Map | Obesity | Self-reported by questionnaire | In relation to 4 buffers of green spaces: 100 m buffer and obesity odds ratio (OR) = 0.32, CI (0.75–0.93), 250 m buffer OR = 0.81, CI (0.71–0.92), 500 m buffer OR = 0.83, CI (0.78–0.98) | Parental education, type of school, sport activity, and having siblings | 12/14 |
| 15 | Coombes et al., 2010, England [51] | Cross-sectional study | n = 6803, >18 years old | Green spaces | Geographic information system, geocoding | Obesity Physical Activity | Self-reported by questionnaire | Respondents who visit green spaces with less frequency showed odds ratio = 0.39, CI (0.33–0.45), p < 0.01 of achieved physical activity guidelines and odds ratio = 1.44, CI (1.25–1.66) of being obese or overweight | Age, sex, socioeconomic status, self-rated health, area-level deprivation | 13/14 |
Publisher’s Note: MDPI stays neutral with regard to jurisdictional claims in published maps and institutional affiliations. |
© 2020 by the authors. Licensee MDPI, Basel, Switzerland. This article is an open access article distributed under the terms and conditions of the Creative Commons Attribution (CC BY) license (http://creativecommons.org/licenses/by/4.0/).
Share and Cite
De la Fuente, F.; Saldías, M.A.; Cubillos, C.; Mery, G.; Carvajal, D.; Bowen, M.; Bertoglia, M.P. Green Space Exposure Association with Type 2 Diabetes Mellitus, Physical Activity, and Obesity: A Systematic Review. Int. J. Environ. Res. Public Health 2021, 18, 97. https://0-doi-org.brum.beds.ac.uk/10.3390/ijerph18010097
De la Fuente F, Saldías MA, Cubillos C, Mery G, Carvajal D, Bowen M, Bertoglia MP. Green Space Exposure Association with Type 2 Diabetes Mellitus, Physical Activity, and Obesity: A Systematic Review. International Journal of Environmental Research and Public Health. 2021; 18(1):97. https://0-doi-org.brum.beds.ac.uk/10.3390/ijerph18010097
Chicago/Turabian StyleDe la Fuente, Felipe, María Angélica Saldías, Camila Cubillos, Gabriela Mery, Daniela Carvajal, Martín Bowen, and María Paz Bertoglia. 2021. "Green Space Exposure Association with Type 2 Diabetes Mellitus, Physical Activity, and Obesity: A Systematic Review" International Journal of Environmental Research and Public Health 18, no. 1: 97. https://0-doi-org.brum.beds.ac.uk/10.3390/ijerph18010097