
The Effect of Weekly Training Load across a Competitive Microcycle on Contextual Variables in Professional Soccer

 , ,
, ,  ,
, 
Abstract
:1. Introduction
2. Materials and Methods
2.1. Participants
2.2. Study Design
2.3. Time Motion Analysis
2.4. Quantification and Management of TL
2.5. Contextual Variables
2.6. Statistical Analyses
3. Results
4. Discussion
5. Conclusions
Author Contributions
Funding
Institutional Review Board Statement
Informed Consent Statement
Data Availability Statement
Acknowledgments
Conflicts of Interest
References
- Bradley, P.S.; Ade, J.D. Are current physical match performance metrics in elite soccer fit for purpose or is the adoption of an integrated approach needed? Int. J. Sports Physiol. Perform. 2018, 13, 656–664. [Google Scholar] [CrossRef] [PubMed]
- Bradley, P.S.; Di Mascio, M.; Peart, D.; Olsen, P.; Sheldon, B. High-intensity activity profiles of elite soccer players at different performance levels. J. Strength Cond. Res. 2010, 24, 2343–2351. [Google Scholar] [CrossRef]
- Bradley, P.S.; Sheldon, W.; Wooster, B.; Olsen, P.; Boanas, P.; Krustrup, P. High-intensity running in English FA Premier League soccer matches. J. Sports Sci. 2009, 27, 159–168. [Google Scholar] [CrossRef] [PubMed]
- Bush, M.; Barnes, C.; Archer, D.T.; Hogg, B.; Bradley, P.S. Evolution of match performance parameters for various playing positions in the English Premier League. Hum. Mov. Sci. 2015, 39, 1–11. [Google Scholar] [CrossRef]
- Dellal, A. Analysis of the Soccer Player’s Physical Activity and of Its Consequences in the Training: Special Reference to the High Intensity Intermittent Exercises and the Small Sided-Games; Strasbourg University: Strasbourg, France, 2008. [Google Scholar]
- Lago, C. The influence of match location, quality of opposition, and match status on possession strategies in professional association football. J. Sports Sci. 2009, 27, 1463–1469. [Google Scholar] [CrossRef]
- Castellano, J.; Blanco-Villaseñor, A.; Alvarez, D. Contextual variables and time-motion analysis in soccer. Int. J. Sports Med. 2011, 32, 415–421. [Google Scholar] [CrossRef] [PubMed] [Green Version]
- Owen, A.L.; Djaoui, L.; Newton, M.; Malone, S.; Mendes, B. A contemporary multi-modal mechanical approach to training monitoring in elite professional soccer. Sci. Med. Footb. 2017, 1, 216–221. [Google Scholar] [CrossRef]
- Di Salvo, V.; Baron, R.; Tschan, H.; Montero, F.C.; Bachl, N.; Pigozzi, F. Performance characteristics according to playing position in elite soccer. Int. J. Sports Med. 2007, 28, 222–227. [Google Scholar] [CrossRef]
- Casamichana, D.; Castellano, J.; Calleja-Gonzalez, J.; San Román, J.; Castagna, C. Relationship between indicators of training load in soccer players. J. Strength Cond. Res. 2013, 27, 369–374. [Google Scholar] [CrossRef]
- Scott, B.R.; Lockie, R.G.; Knight, T.J.; Clark, A.C.; de Jonge, X.A.J. A comparison of methods to quantify the in-season training load of professional soccer players. Int. J. Sports Physiol. Perform. 2013, 8, 195–202. [Google Scholar] [CrossRef] [Green Version]
- Di Salvo, V.; Gregson, W.; Atkinson, G.; Tordoff, P.; Drust, B. Analysis of high intensity activity in Premier League soccer. Int. J. Sports Med. 2009, 30, 205–212. [Google Scholar] [CrossRef]
- Mohr, M.; Krustrup, P.; Bangsbo, J. Match performance of high-standard soccer players with special reference to development of fatigue. J. Sports Sci. 2003, 21, 519–528. [Google Scholar] [CrossRef] [Green Version]
- Carling, C.; Williams, A.M.; Reilly, T. Handbook of Soccer Match Analysis: A Systematic Approach to Improving Performance; Psychology Press: New York, NY, USA, 2005. [Google Scholar]
- Salazar, H.; Svilar, L.; Aldalur-Soto, A.; Castellano, J. Differences in Weekly Load Distribution Over Two Euroleague Seasons with a Different Head Coach. Int. J. Environ. Res. Public Heal. 2020, 17, 2812. [Google Scholar] [CrossRef]
- Lago, C.; Casais, L.; Dominguez, E.; Sampaio, J. The effects of situational variables on distance covered at various speeds in elite soccer. Eur. J. Sport Sci. 2010, 10, 103–109. [Google Scholar] [CrossRef]
- Taylor, J.B.; Mellalieu, S.D.; James, N.; Shearer, D.A. The influence of match location, quality of opposition, and match status on technical performance in professional association football. J. Sports Sci. 2008, 26, 885–895. [Google Scholar] [CrossRef]
- White, A.; Hills, S.P.; Hobbs, M.; Cooke, C.B.; Kilduff, L.P.; Cook, C.; Roberts, C.; Russell, M. The physical demands of professional soccer goalkeepers throughout a week-long competitive microcycle and transiently throughout match-play. J. Sports Sci. 2020, 38, 848–854. [Google Scholar] [CrossRef] [PubMed]
- Suarez-Arrones, L.; Nakamura, F.Y.; Maldonado, R.A.; Torreno, N.; Di Salvo, V.; Mendez-Villanueva, A. Applying a holistic hamstring injury prevention approach in elite football: 12 seasons, single club study. Scand. J. Med. Sci. Sports 2021, 31, 861–874. [Google Scholar] [CrossRef]
- Malone, J.J.; Di Michele, R.; Morgans, R.; Burgess, D.; Morton, J.P.; Drust, B. Seasonal training-load quantification in elite English premier league soccer players. Int. J. Sports Physiol. Perform. 2015, 10, 489–497. [Google Scholar] [CrossRef] [PubMed] [Green Version]
- Impellizzeri, F.M.; Rampinini, E.; Coutts, A.J.; Sassi, A.; Marcora, S.M. Use of RPE-based training load in soccer. Med. Sci. Sports Exerc. 2004, 36, 1042–1047. [Google Scholar] [CrossRef] [PubMed]
- Kelly, V.G.; Coutts, A.J. Planning and monitoring training loads during the competition phase in team sports. Strength Cond. J. 2007, 29, 32. [Google Scholar] [CrossRef]
- Owen, A.L.; Lago-Peñas, C.; Gómez, M.; Mendes, B.; Dellal, A. Analysis of a training mesocycle and positional quantification in elite European soccer players. Int. J. Sports Sci. Coach. 2017, 12, 665–676. [Google Scholar] [CrossRef]
- Hoppe, M.W.; Baumgart, C.; Polglaze, T.; Freiwald, J. Validity and reliability of GPS and LPS for measuring distances covered and sprint mechanical properties in team sports. PLoS ONE 2018, 13, e0192708. [Google Scholar] [CrossRef] [PubMed] [Green Version]
- Di Prampero, P.E.; Botter, A.; Osgnach, C. The energy cost of sprint running and the role of metabolic power in setting top performances. Eur. J. Appl. Physiol. 2015, 115, 451–469. [Google Scholar] [CrossRef]
- Baptista, I.; Johansen, D.; Figueiredo, P.; Rebelo, A.; Pettersen, S.A. Positional Differences in Peak-and Accumulated-Training Load Relative to Match Load in Elite Football. Sports 2020, 8, 1. [Google Scholar] [CrossRef] [Green Version]
- Silva, J.R.; Rebelo, A.; Marques, F.; Pereira, L.; Seabra, A.; Ascensão, A.; Magalhães, J. Biochemical impact of soccer: An analysis of hormonal, muscle damage, and redox markers during the season. Appl. Physiol. Nutr. Metab. 2014, 39, 432–438. [Google Scholar] [CrossRef] [Green Version]
- Young, W.B.; Hepner, J.; Robbins, D.W. Movement demands in Australian rules football as indicators of muscle damage. J. Strength Cond. Res. 2012, 26, 492–496. [Google Scholar] [CrossRef] [PubMed] [Green Version]
- Pollard, R. Home advantage in soccer: A retrospective analysis. J. Sports Sci. 1986, 4, 237–248. [Google Scholar] [CrossRef] [PubMed]
- Rahnama, N.; Bambaeichi, E.; Sadeghiour, H.R. Home advantage in the Asian football. J. Sports Sci. Med. 2009, 6, 209. [Google Scholar]
- Seckin, A.; Pollard, R. Home advantage in Turkish professional soccer. Percept. Mot. Skills 2008, 107, 51–54. [Google Scholar] [CrossRef] [Green Version]
- Ehrmann, F.E.; Duncan, C.S.; Sindhusake, D.; Franzsen, W.N.; Greene, D.A. GPS and Injury Prevention in Professional Soccer. J. Strength Cond. Res. 2016, 30, 360–367. [Google Scholar] [CrossRef]


| Code | Metrics | Definition | |
|---|---|---|---|
| Volume | TDC | Total distance covered (m) | Total distance covered in meters |
| ACC | Number of acceleration (m/s2) | Number of events >2.50 m/s2 | |
| DEC | Number of deceleration (m/s2) | Number of events <−2.50 m/s2 | |
| HSR | High-speed running (m) | Total distance covered >21 km/h | |
| Intensity | EDI | Equivalent distance index (%) | Ratio between ED (represents the distance that the athlete would have covered at constant speed by using the total energy consumed during a training session) and the TDC |
| MP | Metabolic power (W/Kg) | Energy expenditure per unit of time, above resting (speed · energy cost) | |
| RTDC | Relative distance covered (m/min) | Total distance covered in meters/time | |
| RHSR | Relative high-speed running (m/min) | Total distance covered >21 km/h/time |
| Volume | Intensity | |||||||
|---|---|---|---|---|---|---|---|---|
| TDC 1 (m) | Acc (events) | Dec (events) | HSR (m) | EDI | MP (W/Kg) | RTDC (m/min) | RHSR (m/min) | |
| MD-4 | 5260.8 ± 635.7 | 69.7 ± 14.1 | 72.6 ± 11.3 | 174 ± 83 | 15.1 ± 1 | 5.7 ± 0.7 | 78.1 ± 8.4 | 2.9 ± 1.5 |
| MD-3 | 5889.5 ± 587.8 | 51.8 ± 8.8 | 56.9 ± 8.3 | 313.8 ± 58.3 | 14 ± 0.9 | 7.8 ± 0.6 | 93.2 ± 12.1 | 4.9 ± 1.1 |
| MD-2 | 3125.2 ± 592.8 | 28.6 ± 6 | 30.6 ± 6 | 98.5 ± 67.5 | 11.8 ± 1.3 | 5.1 ± 1 | 68.1 ± 13.8 | 2 ± 1 |
| MD-1 | 3725.2 ± 475.1 | 36.5 ± 3.8 | 38.1 ± 4.6 | 182.6 ± 48.3 | 13.6 ± 48.3 | 5.3 ± 0.7 | 73 ± 7.9 | 3.6 ± 1.1 |
| MD | 9540.18 ± 201.1 | 87.6 ± 11.6 | 100 ± 10.1 | 496.2 ± 63.4 | 15.4 ± 1.2 | 7.7 ± 0.4 | 101.2 ± 2.2 | 5.3 ± 0.66 |
| Volume | Intensity | |||||||
|---|---|---|---|---|---|---|---|---|
| TDC 1 | Acc | Dec | HSR | EDI | MP | RTDC | RHSR | |
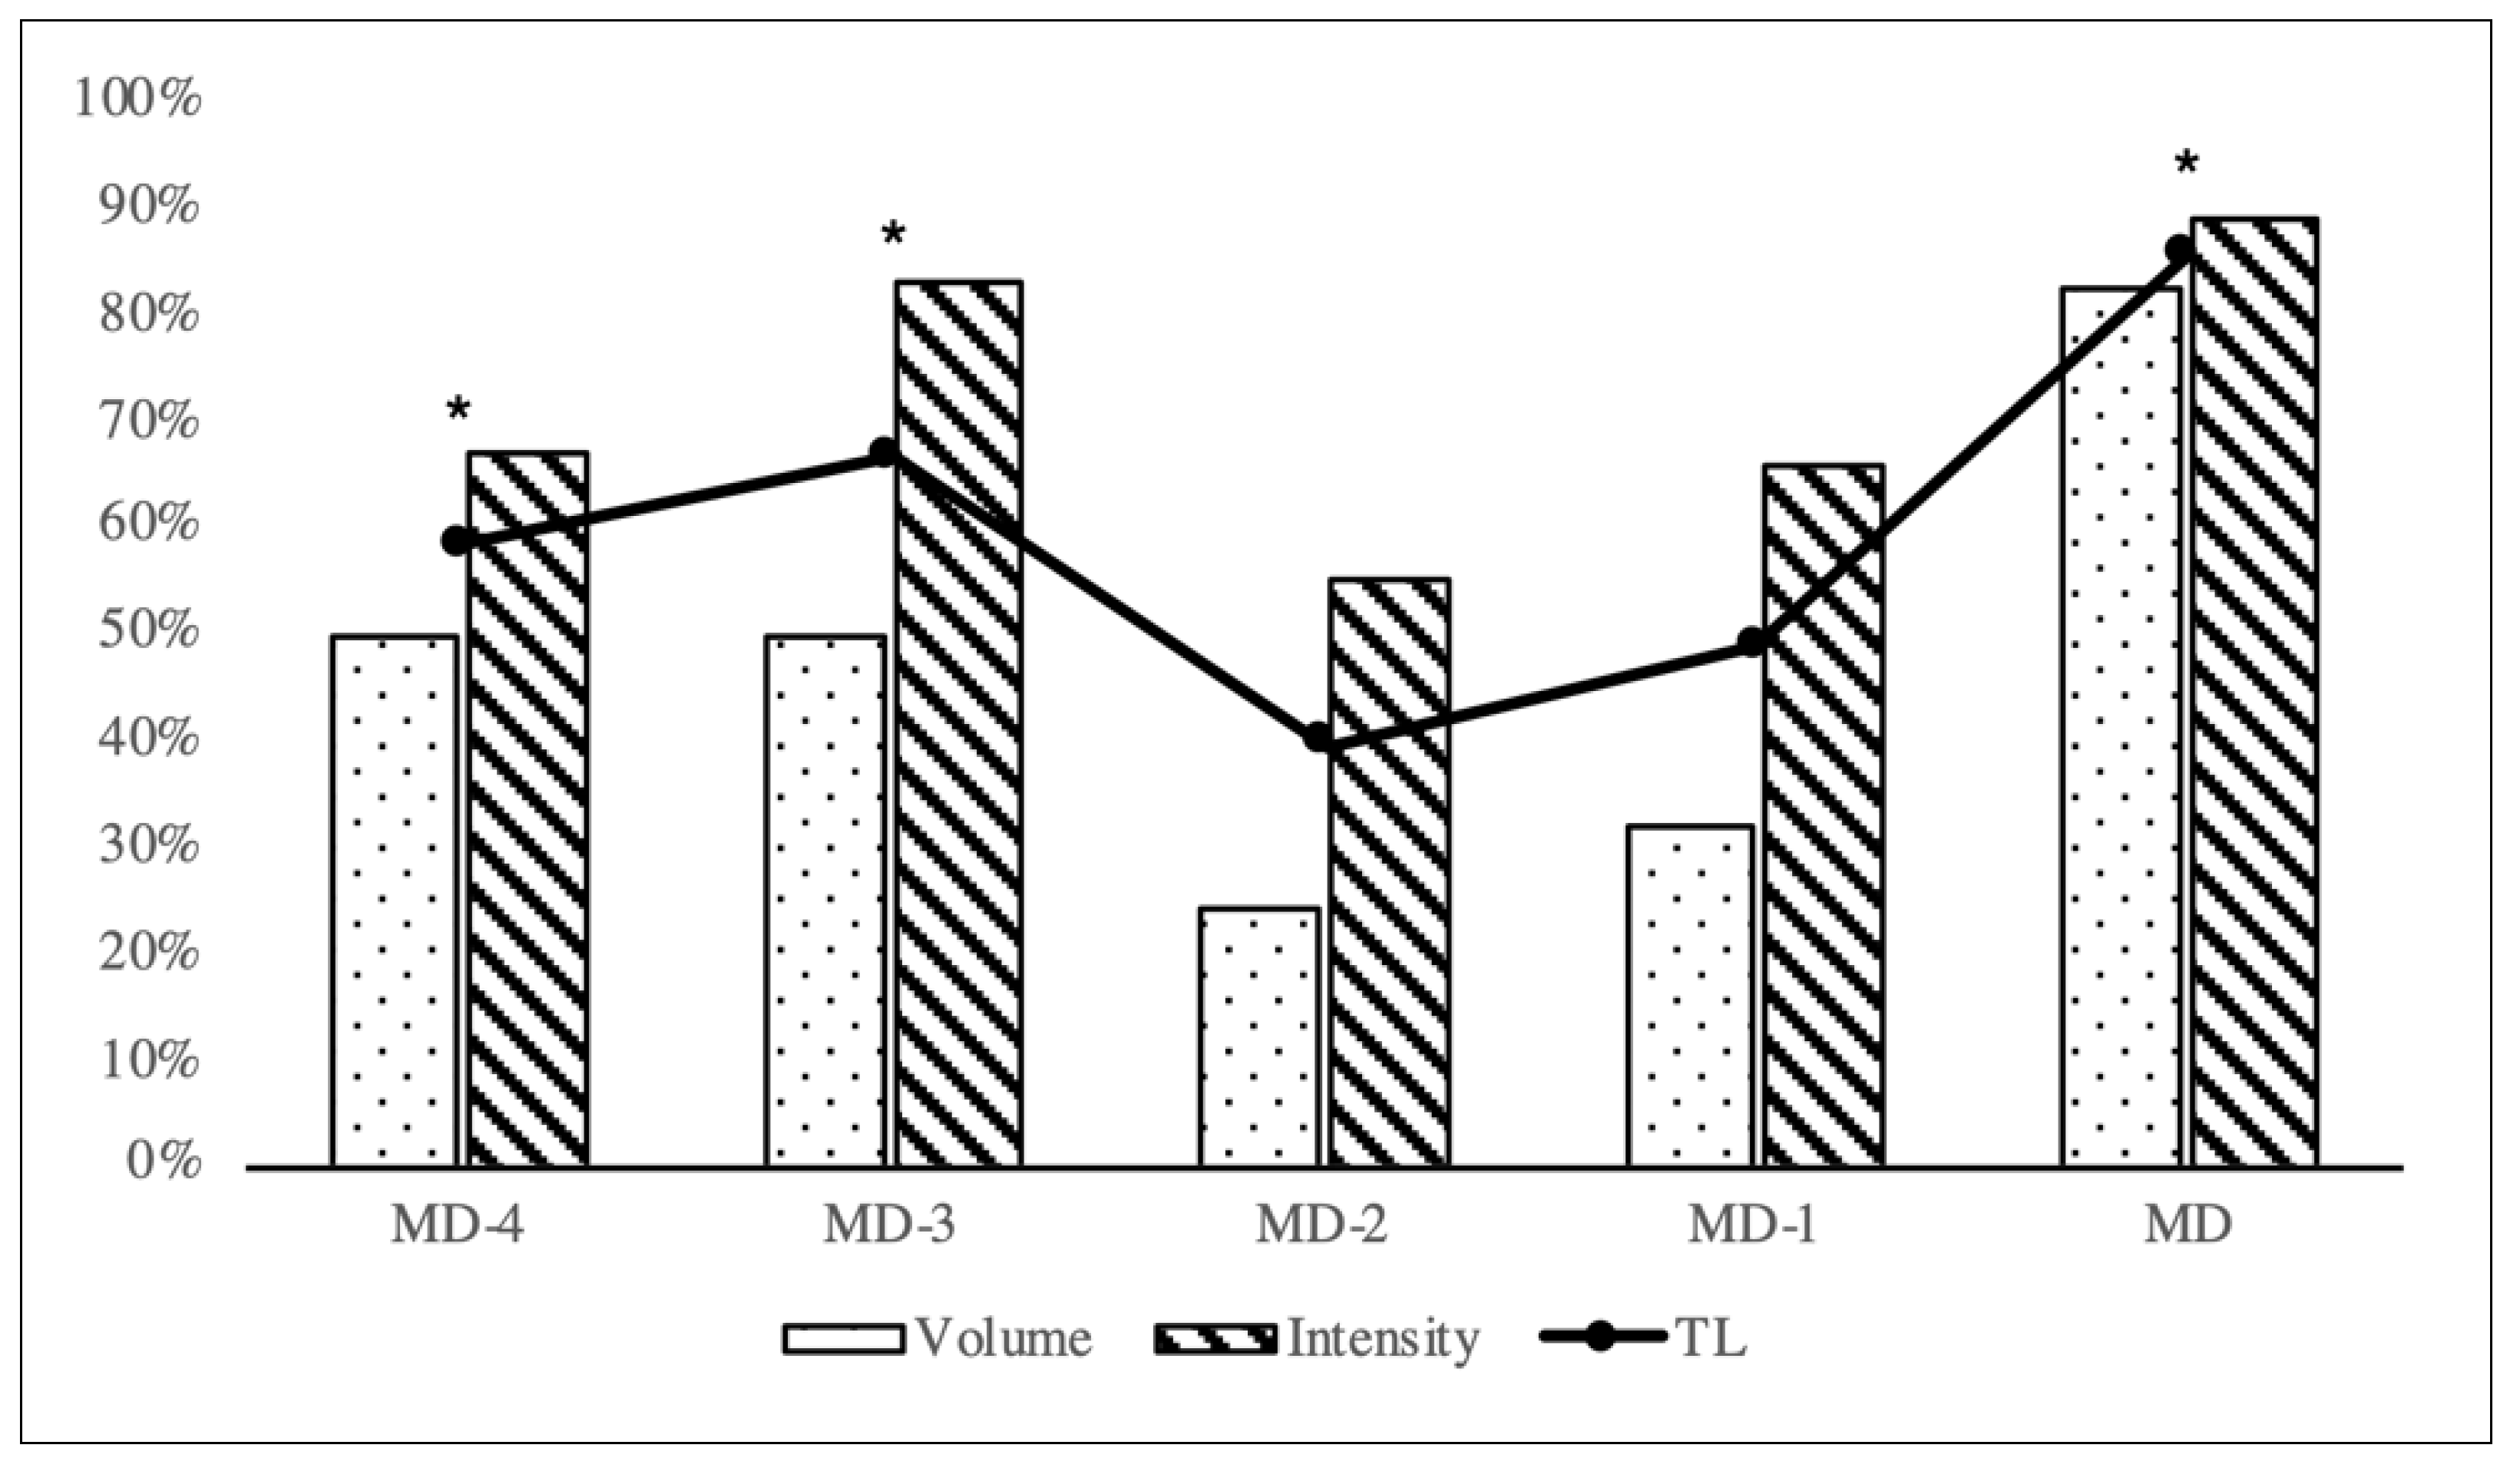
| MD-4 | 52.7 ± 0.7 | 58.5 ±1.6 | 58.8 ± 1.1 | 27.6 ± 1.7 | 80.3 ± 0.8 | 68.7 ± 0.9 | 75.1 ± 0.8 | 43.7 ± 2.5 |
| MD-3 | 60.1 ± 0.5 | 43.5 ± 1.0 | 46.1 ± 0.8 | 49.7 ± 1.2 | 74.6 ± 0.6 | 92.9 ± 0.8 | 89.7 ± 1.2 | 74.6 ± 2.7 |
| MD-2 | 31.3 ± 0.6 | 24 ± 0.7 | 24.8 ± 0.6 | 15.6 ± 1.4 | 62.9 ± 0.9 | 61.2 ± 1.8 | 65.5 ± 1.3 | 30.5 ± 2.4 |
| MD-1 | 37.4 ± 0.5 | 30.6 ± 0.4 | 30.8 ± 0.5 | 28.9 ± 1.1 | 72.7 ± 0.8 | 63.9 ± 0.9 | 70.3 ± 0.8 | 55.2 ± 2.5 |
| MD | 95.7 ± 2.4 | 73.5 ± 2.7 | 80.9 ± 2.6 | 79.0 ± 3.1 | 84.5 ± 0.7 | 92.1 ± 0.6 | 97.4 ± 2.1 | 80.4 ± 1.3 |
| WTL | 277.1 ± 1.2 | 230.2 ± 0.9 | 241.3 ± 1.8 | 200.8 ± 1.3 | 375 ± 0.5 | 378.8 ± 0.8 | 398 ± 1.3 | 284.5 ± 2.1 |
| Volume | Intensity | WTL | ||||||||
|---|---|---|---|---|---|---|---|---|---|---|
| 1 WTLTDC | WTLAcc | WTLDec | WTLHSR | WTLEDI | WTLMP | WTLRTDC | WTLRHSR | |||
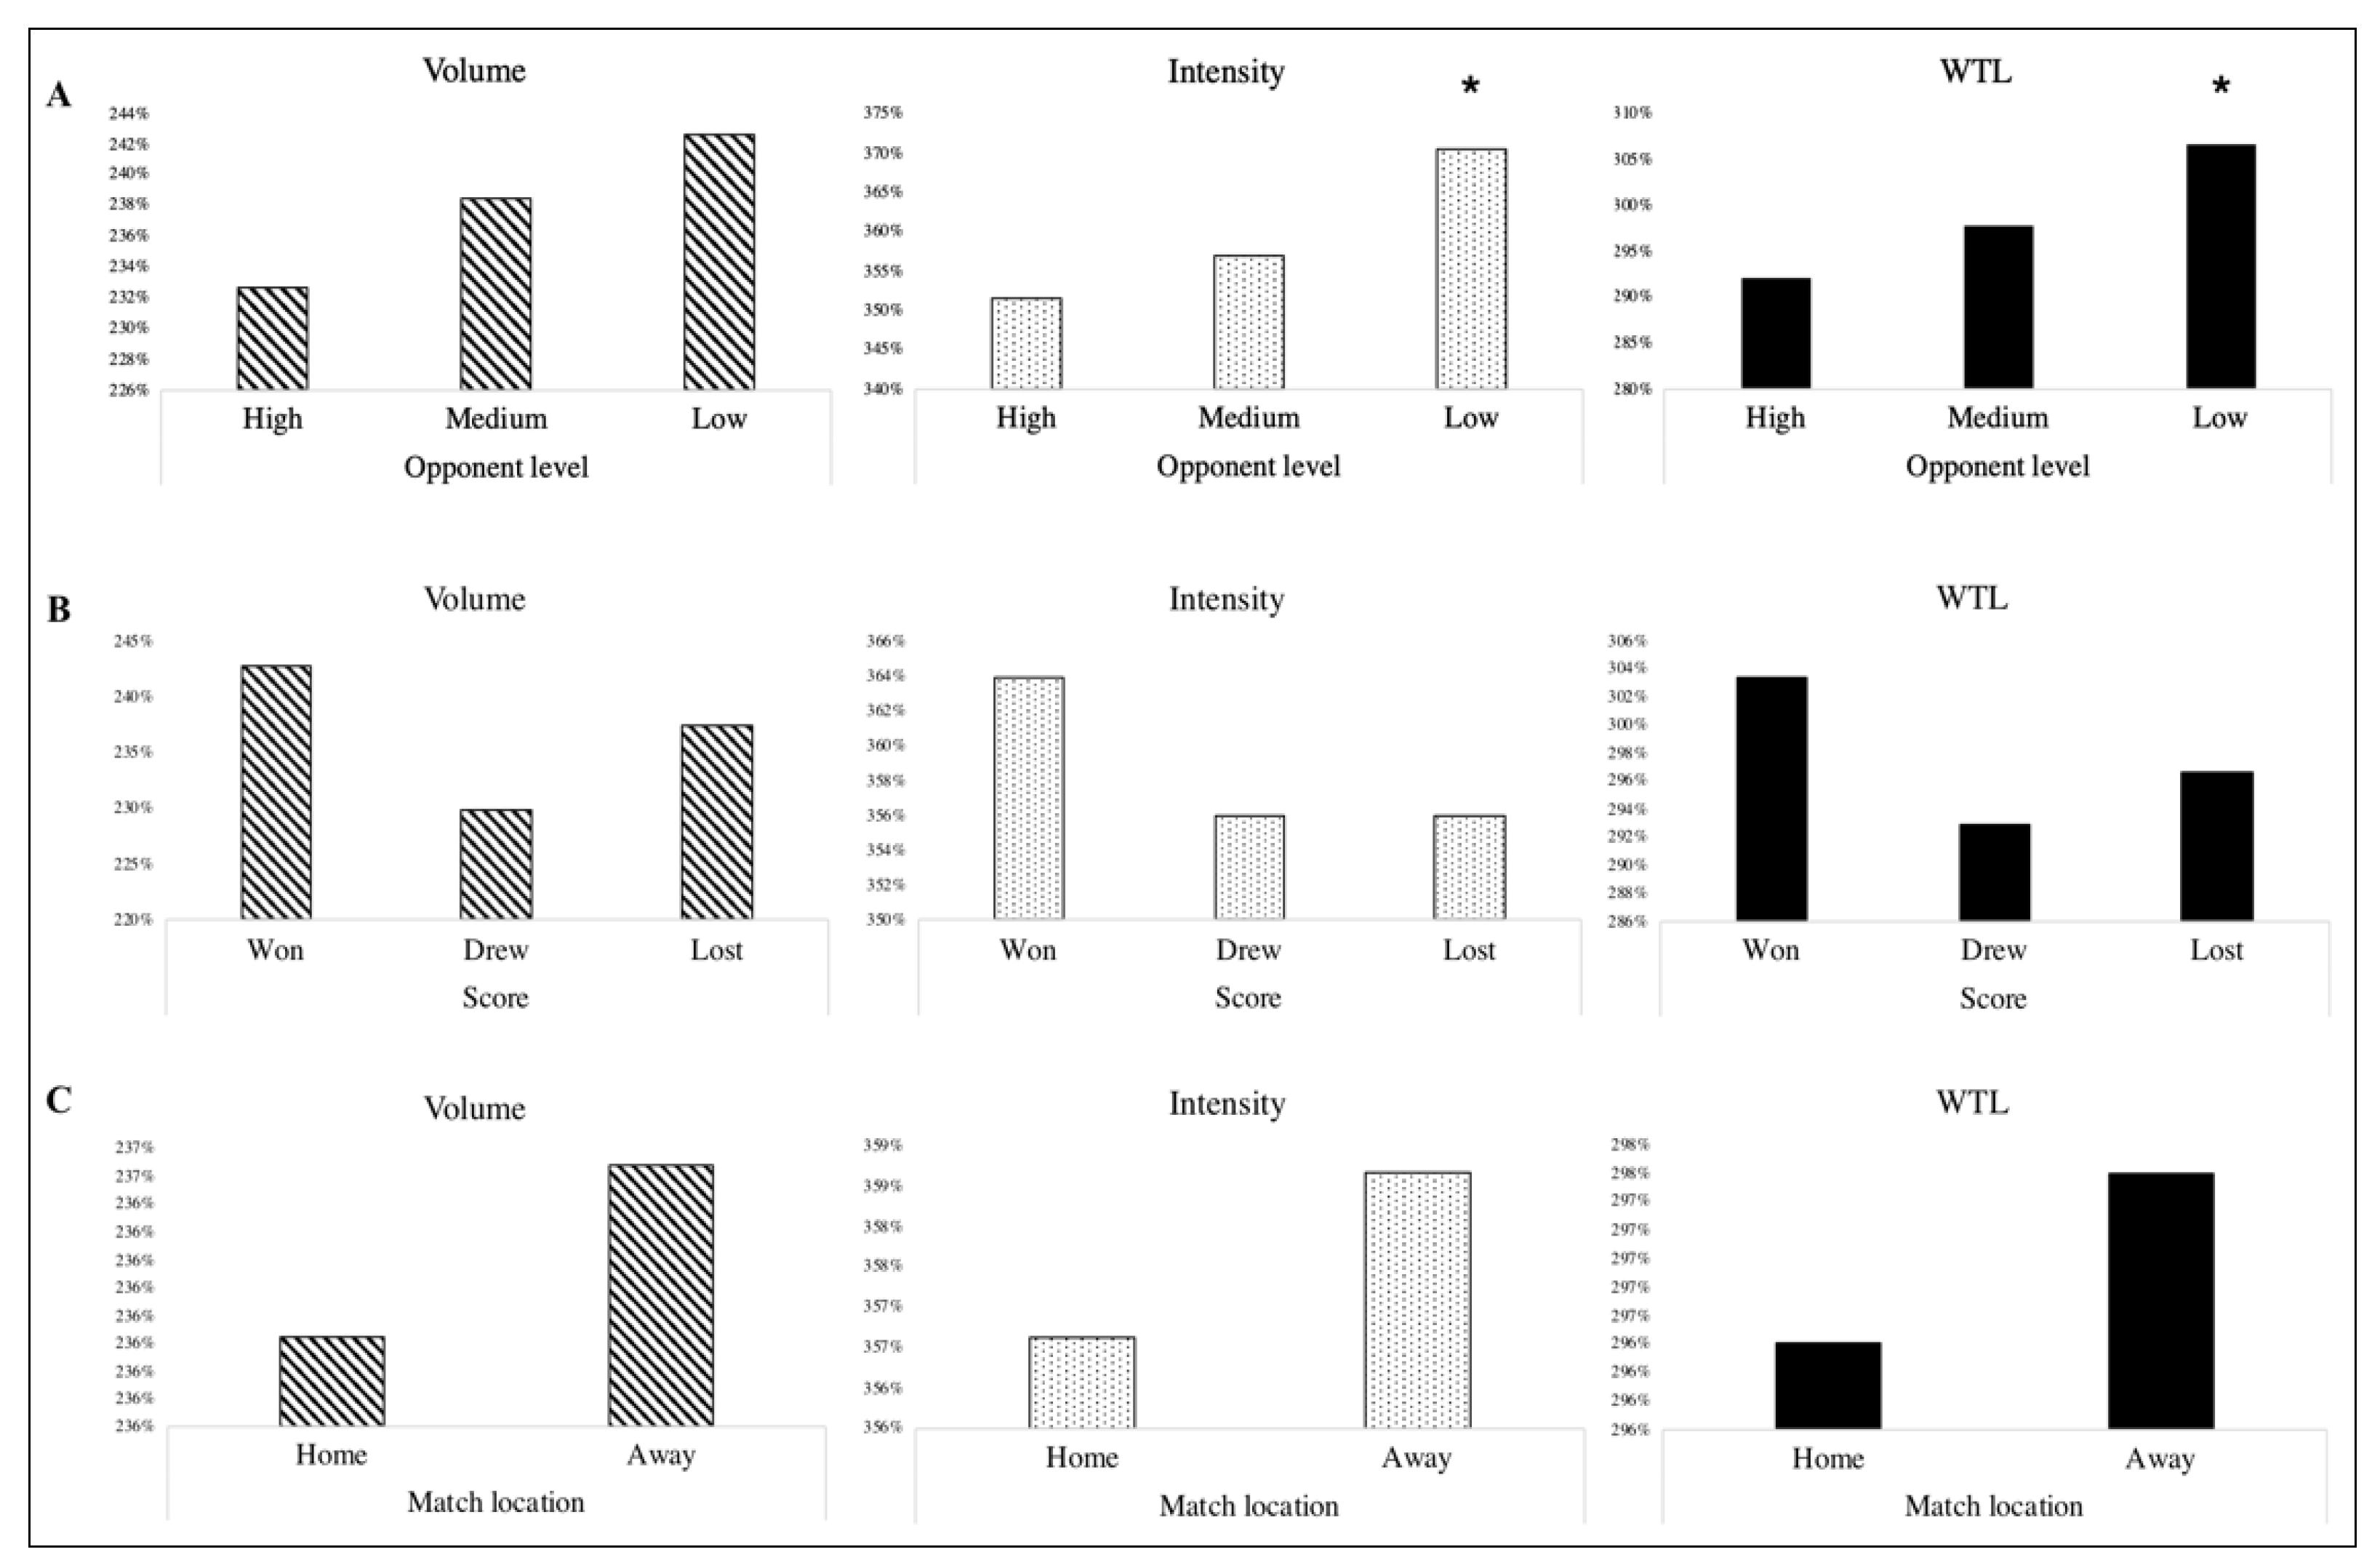
| Opponent’s level | High | 274.5 ± 1.1 | 227.8 ± 1.3 | 238.2 ± 1.3 | 190.3 ± 1.8 | 371.8 ± 1.3 | 371.3 ± 1.1 | 391.1 ± 2.0 | 271.6 ± 0.3 | 292.1 ± 0.1 |
| Medium | 280.8 ± 1.1 | 228.0 ± 1.9 | 239.6 ± 1.9 | 205.5 ± 2.2 | 367.0 ± 1.5 | 377.7 ± 1.4 | 397.0 ± 2.0 | 285.9 ± 0.3 | 297.7 ± 1.1 | |
| Low | 276.4 ± 1.9 | 236.4 ± 1.5 | 248.2 ± 1.5 | 209.6 ± 2.4 | 381.6 ± 1.1 | 390.0 ± 1.1 | 409.6 ± 2.5 | 300.8 ± 0.3 | 306.7 ± 1.1 $ | |
| Final score | Won | 279.9 ± 1.0 | 236.6 ± 1.4 | 247.1 ± 1.4 | 207.7 ± 2.1 | 376.3 ± 1.3 | 380.7 ± 1.9 | 405.3 ± 1.4 | 293.3 ± 2.5 | 303.4 ± 0.1 |
| Drew | 269.2 ± 0.4 | 222.4 ± 1.5 | 228.1 ± 1.2 | 199.8 ± 2.6 | 372.1 ± 1.5 | 384.3 ± 2.7 | 385.2 ± 2.6 | 282.4 ± 4.8 | 293.0 ± 1.4 | |
| Lost | 279.3 ± 1.9 | 229.9 ± 1.6 | 244.2 ± 1.6 * | 196.2 ± 2.1 | 370.9 ± 1.3 | 374.0 ± 1.7 | 399.8 ± 2.6 | 279.1 ± 2.9 | 296.7 ± 1.4 | |
| Match location | Home | 276.1 ± 0.1 | 226.7 ± 1.8 | 239.3 ± 1.6 | 202.7 ± 2.1 | 368.2 ± 1.4 | 379.8 ± 1.8 | 393.4 ± 1.7 | 285.1 ± 2.7 | 296.4 ± 1.0 |
| Away | 277.6 ± 1.7 | 231.0 ± 1.2 | 240.9 ± 1.6 | 196.5 ± 2.4 | 376.5 ± 1.3 | 378.9 ± 2.2 | 399.8 ± 2.5 | 279.5 ± 3.7 | 297.6 ± 1.4 | |
Publisher’s Note: MDPI stays neutral with regard to jurisdictional claims in published maps and institutional affiliations. |
© 2021 by the authors. Licensee MDPI, Basel, Switzerland. This article is an open access article distributed under the terms and conditions of the Creative Commons Attribution (CC BY) license (https://creativecommons.org/licenses/by/4.0/).
Share and Cite
Chena, M.; Morcillo, J.A.; Rodríguez-Hernández, M.L.; Zapardiel, J.C.; Owen, A.; Lozano, D. The Effect of Weekly Training Load across a Competitive Microcycle on Contextual Variables in Professional Soccer. Int. J. Environ. Res. Public Health 2021, 18, 5091. https://0-doi-org.brum.beds.ac.uk/10.3390/ijerph18105091
Chena M, Morcillo JA, Rodríguez-Hernández ML, Zapardiel JC, Owen A, Lozano D. The Effect of Weekly Training Load across a Competitive Microcycle on Contextual Variables in Professional Soccer. International Journal of Environmental Research and Public Health. 2021; 18(10):5091. https://0-doi-org.brum.beds.ac.uk/10.3390/ijerph18105091
Chicago/Turabian StyleChena, Marcos, José Alfonso Morcillo, María Luisa Rodríguez-Hernández, Juan Carlos Zapardiel, Adam Owen, and Demetrio Lozano. 2021. "The Effect of Weekly Training Load across a Competitive Microcycle on Contextual Variables in Professional Soccer" International Journal of Environmental Research and Public Health 18, no. 10: 5091. https://0-doi-org.brum.beds.ac.uk/10.3390/ijerph18105091