
Urban–Rural Disparities in the Magnitude and Determinants of Stunting among Children under Five in Tanzania: Based on Tanzania Demographic and Health Surveys 1991–2016


Abstract
:1. Introduction
2. Materials and Methods
2.1. Data Sources
2.2. Study Population and Sample Size
2.3. Measurement of the Outcome Variable
2.4. Independent Variables
2.5. Statistical Analysis
3. Results
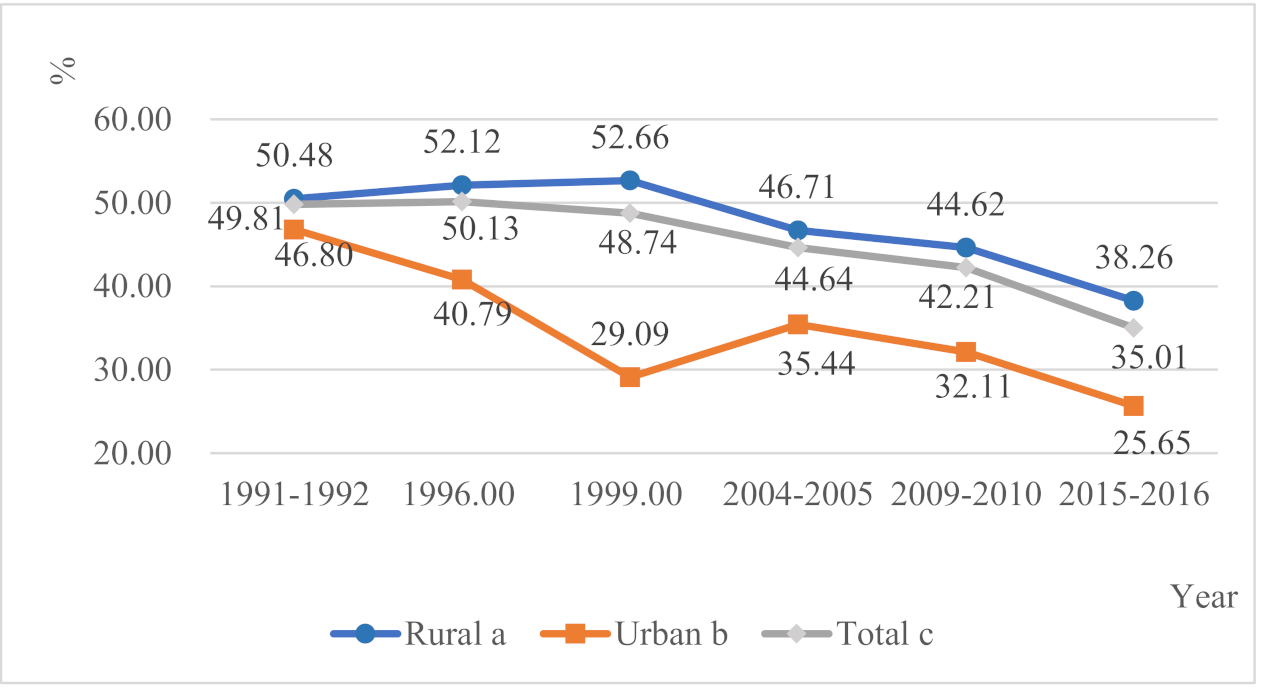
3.1. Trends in the Prevalence of Stunting in Urban and Rural Areas
3.2. Characteristics of Urban and Rural Children
3.3. Determinants of Child Stunting in the Urban and Rural Areas
4. Discussion
5. Conclusions
Supplementary Materials
Author Contributions
Funding
Institutional Review Board Statement
Informed Consent Statement
Data Availability Statement
Conflicts of Interest
Consent for publication
References
- Mendez, M.A.; Adair, L.S. Severity and timing of stunting in the first two years of life affect performance on cognitive tests in late childhood. J. Nutr. 1999, 129, 1555–1562. [Google Scholar] [CrossRef] [Green Version]
- Black, R.E.; Victora, C.G.; Walker, S.P.; Bhutta, Z.A.; Christian, P.; de Onis, M.; Ezzati, M.; Grantham-McGregor, S.; Katz, J.; Martorell, R.; et al. Maternal and child undernutrition and overweight in low-income and middle-income countries. Lancet 2013, 382, 427–451. [Google Scholar] [CrossRef]
- WHO Working Group. Use and Interpretation of Anthropometric Indicators of Nutritional Status. Bull World Health Organ 1986, 64, 929–941. [Google Scholar]
- WHO. Nutrition Landscape Information System (NLIS) Country Profile Indicators: Interpretation Guide; World Health Organization: Geneva, Switzerland, 2010. [Google Scholar]
- Sachs, J.; Schmidt-Traub, G.; Kroll, C.; Durand-Delacre, D.; Teksoz, K. SDG Index and Dashboards Report 2017; Bertelsmann Stiftung and Sustainable Development Solutions Network (SDSN): New York, NY, USA, 2017. [Google Scholar]
- WHO. Reducing Stunting in Children: Equity Considerations for Achieving the Global Targets 2025. Available online: https://www.who.int/nutrition/publications/severemalnutrition/reducing-stunting-children-equity/en/ (accessed on 26 August 2019).
- UNICEF. Improving Child Nutrition: The Achievable Imperative for Global Progress; UNICEF: New York, NY, USA, 2013. [Google Scholar]
- Ministry of Health, Community Development, Gender, Elderly and Children (MoHCDGEC) [Tanzania Mainland], Ministry of Health (MoH) [Zanzibar], National Bureau of Statistics (NBS), Office of the Chief Government Statistician (OCGS), and ICF. Tanzania Demographic and Health Survey and Malaria Indicator Survey (TDHS-MIS) 2015-16; MoHCDGEC, MoH, NBS, OCGS, and ICF: Dar es Salaam, Tanzania; Rockville, MD, USA, 2016. [Google Scholar]
- UNICEF; WHO; The World Bank Group. Joint Child Malnutrition Estimates 2017 Edition; UNICEF: New York, NY, USA; WHO: Geneva, Switzerland; World Bank Group: Washington, DC, USA, 2017. [Google Scholar]
- UNICEF. Maternal Child Health. Available online: https://www.unicef.org/vietnam/maternal-child-health (accessed on 6 May 2019).
- WHO. United Republic of Tanzania WHO Country Cooperation Strategy 2016–2020; WHO Regional Office for Africa: Brazzaville, Republic of Congo, 2016. [Google Scholar]
- Restrepo-Mendez, M.C.; Barros, A.J.; Black, R.E.; Victora, C.G. Time trends in socio-economic inequalities in stunting prevalence: Analyses of repeated national surveys. Public Health Nutr. 2015, 18, 2097–2104. [Google Scholar] [CrossRef] [Green Version]
- Dorsey, J.L.; Manohar, S.; Neupane, S.; Shrestha, B.; Klemm, R.D.W.; West, K.P., Jr. Individual, household, and community level risk factors of stunting in children younger than 5 years: Findings from a national surveillance system in Nepal. Matern. Child Nutr. 2018, 14, e12434. [Google Scholar] [CrossRef] [PubMed] [Green Version]
- Amarante, V.; Figueroa, N.; Ullman, H. Inequalities in the reduction of child stunting over time in Latin America: Evidence from the DHS 2000–2010. Oxf. Dev. Stud. 2018, 46, 519–535. [Google Scholar] [CrossRef]
- Gatica-Dominguez, G.; Victora, C.; Barros, A.J.D. Ethnic inequalities and trends in stunting prevalence among Guatemalan children: An analysis using national health surveys 1995–2014. Int. J. Equity Health 2019, 18. [Google Scholar] [CrossRef] [Green Version]
- Mduma, E.R.; Gratz, J.; Patil, C.; Matson, K.; Dakay, M.; Liu, S.; Pascal, J.; McQuillin, L.; Mighay, E.; Hinken, E.; et al. The Etiology, Risk Factors, and Interactions of Enteric Infections and Malnutrition and the Consequences for Child Health and Development Study (MAL-ED): Description of the Tanzanian Site. Clin. Infect. Dis. 2014, 59, S325–S330. [Google Scholar] [CrossRef] [PubMed]
- Makoka, D.; Masibo, P.K. Is there a threshold level of maternal education sufficient to reduce child undernutrition? Evidence from Malawi, Tanzania and Zimbabwe. BMC Pediatr. 2015, 15. [Google Scholar] [CrossRef] [PubMed] [Green Version]
- Sudfeld, C.R.; McCoy, D.C.; Fink, G.; Muhihi, A.; Bellinger, D.C.; Masanja, H.; Smith, E.R.; Danaei, G.; Ezzati, M.; Fawzi, W.W. Malnutrition and Its Determinants Are Associated with Suboptimal Cognitive, Communication, and Motor Development in Tanzanian Children. J. Nutr. 2015, 145, 2705–2714. [Google Scholar] [CrossRef] [PubMed] [Green Version]
- National Bureau of Statistics and Macro International Inc. Tanzania Reproductive and Child Health Survey 1999; National Bureau of Statistics and Macro International Inc.: Calverton, MD, USA, 2000. [Google Scholar]
- WHO. Child Growth Standards. Length/Height-for-Age, Weight-for-Age, Weight-for-Length, Weight-Forheight and Body Mass Index-for-Age. Available online: https://www.who.int/childgrowth/en/ (accessed on 3 March 2020).
- de Onis, M.; Onyango, A.W.; Borghi, E.; Garza, C.; Yang, H.; WHO Multicentre Growth Reference Study Group. Comparison of the World Health Organization (WHO) Child Growth Standards and the National Center for Health Statistics/WHO international growth reference: Implications for child health programmes. Public Health Nutr. 2006, 9, 942–947. [Google Scholar] [CrossRef] [Green Version]
- Victora, C.G.; Vaughan, J.P.; Kirkwood, B.R.; Martines, J.C.; Barcelos, L.B. Risk-Factors for Malnutrition in Brazilian Children—The Role of Social and Environmental Variables. Bull World Health Organ 1986, 64, 299–309. [Google Scholar] [PubMed]
- Kikafunda, J.K.; Walker, A.F.; Collett, D.; Tumwine, J.K. Risk factors for early childhood malnutrition in Uganda. Pediatrics 1998, 102. [Google Scholar] [CrossRef] [Green Version]
- Masibo, P.K.; Makoka, D. Trends and determinants of undernutrition among young Kenyan children: Kenya Demographic and Health Survey; 1993, 1998, 2003 and 2008–2009. Public Health Nutr. 2012, 15, 1715–1727. [Google Scholar] [CrossRef] [PubMed] [Green Version]
- Amugsi, D.A.; Mittelmark, M.B.; Lartey, A. An analysis of socio-demographic patterns in child malnutrition trends using Ghana demographic and health survey data in the period 1993–2008. BMC Public Health 2013, 13. [Google Scholar] [CrossRef] [PubMed] [Green Version]
- Chowdhury, M.R.K.; Rahman, M.S.; Khan, M.M.H.; Mondal, M.N.I.; Rahman, M.M.; Billah, B. Risk Factors for Child Malnutrition in Bangladesh: A Multilevel Analysis of a Nationwide Population-Based Survey. J. Pediatr. 2016, 172, 194–201. [Google Scholar] [CrossRef] [PubMed]
- Rakotomanana, H.; Gates, G.E.; Hildebrand, D.; Stoecker, B.J. Determinants of stunting in children under 5 years in Madagascar. Matern. Child Nutr. 2017, 13. [Google Scholar] [CrossRef] [PubMed]
- Tariq, J.; Sajjad, A.; Zakar, R.; Zakar, M.Z.; Fischer, F. Factors Associated with Undernutrition in Children under the Age of Two Years: Secondary Data Analysis Based on the Pakistan Demographic and Health Survey 2012–2013. Nutrients 2018, 10, 676. [Google Scholar] [CrossRef] [PubMed] [Green Version]
- UNICEF. The State of the World’s Children; UNICEF: New York, NY, USA, 1998. [Google Scholar]
- Rothman, K.J.; Greenland, S.; Walker, A.M. Concepts of interaction. Am. J. Epidemiol. 1980, 112, 467–470. [Google Scholar] [CrossRef]
- Andersson, T.; Alfredsson, L.; Källberg, H.; Zdravkovic, S.; Ahlbom, A. Calculating measures of biological interaction. Eur. J. Epidemiol. 2005, 20, 575–579. [Google Scholar] [CrossRef] [PubMed]
- Knol, M.J.; VanderWeele, T.J. Recommendations for presenting analyses of effect modification and interaction. Int. J. Epidemiol. 2012, 41, 514–520. [Google Scholar] [CrossRef] [Green Version]
- National Multisectoral Nutrition Action Plan (NMNAP) for the Period July 2016–June 2021; Prime Minister’s Office, United Republic of Tanzania: Dar es Salaam, Tanzania, 2016.
- Paciorek, C.J.; Stevens, G.A.; Finucane, M.M.; Ezzati, M.; Nutrition Impact Model Study Group. Children’s height and weight in rural and urban populations in low-income and middle-income countries: A systematic analysis of population-representative data. Lancet Glob. Health 2013, 1, e300–e309. [Google Scholar] [CrossRef] [Green Version]
- Horiuchi, Y.; Kusama, K.; Kanha, S.; Yoshiike, N.; FIDR Research Team. Urban-Rural Differences in Nutritional Status and Dietary Intakes of School-Aged Children in Cambodia. Nutrients 2018, 11, 14. [Google Scholar] [CrossRef] [Green Version]
- Srinivasan, C.S.; Zanello, G.; Shankar, B. Rural-urban disparities in child nutrition in Bangladesh and Nepal. BMC Public Health 2013, 13, 581. [Google Scholar] [CrossRef] [PubMed] [Green Version]
- Sharaf, M.F.; Rashad, A.S. Regional inequalities in child malnutrition in Egypt, Jordan, and Yemen: A Blinder-Oaxaca decomposition analysis. Health Econ. Rev. 2016, 6, 23. [Google Scholar] [CrossRef] [Green Version]
- Sunguya, B.F.; Zhu, S.; Mpembeni, R.; Huang, J. Trends in prevalence and determinants of stunting in Tanzania: An analysis of Tanzania demographic health surveys (1991–2016). Nutr. J. 2019, 18, 85. [Google Scholar] [CrossRef] [PubMed]
- Brakohiapa, L.A.; Bille, A.; Quansah, E.; Kishi, K.; Yartey, J.; Harrison, E.; Armar, M.A.; Yamamoto, S. Does Prolonged Breastfeeding Adversely Affect a Childs Nutritional-Status. Lancet 1988, 2, 416–418. [Google Scholar] [CrossRef]
- WHO. World Health Organization Breastfeeding Website. Available online: https://www.who.int/health-topics/breastfeeding#tab=tab_1 (accessed on 28 February 2020).
- Fein, S.B.; Labiner-Wolfe, J.; Scanlon, K.S.; Grummer-Strawn, L.M. Selected complementary feeding practices and their association with maternal education. Pediatrics 2008, 122 (Suppl. S2), S91–S97. [Google Scholar] [CrossRef] [PubMed] [Green Version]
- Rao S, K.A.; Yajnik, C.S.; Fall, C.H. Seasonality in maternal intake and activity influence offspring’s birth size among rural Indian mothers--Pune Maternal Nutrition Study. Int. J. Epidemiol. 2009, 38, 1094–1103. [Google Scholar] [CrossRef] [PubMed] [Green Version]
- Smith, L.C.; Ruel, M.T.; Ndiaye, A. Why is child malnutrition lower in urban than in rural areas? Evidence from 36 developing countries. World Dev. 2005, 33, 1285–1305. [Google Scholar] [CrossRef] [Green Version]
- Demilew, Y.M.; Tafere, T.E.; Abitew, D.B. Infant and young child feeding practice among mothers with 0-24 months old children in Slum areas of Bahir Dar City, Ethiopia. Int. Breastfeed J. 2017, 12, 26. [Google Scholar] [CrossRef] [PubMed]
- Abebe, Z.; Tariku, A.; Bikes, G.A.; Wassie, M.M.; Gonete, K.A.; Awoke, T.; Gebeye, E.; Gete, A.A.; Yesuf, M.E.; Kebede, Y.; et al. Poor child complementary Feeding Practices in northwest Ethiopia: Finding from the Baseline Survey of Nutrition Project, 2016. Ital. J. Pediatr. 2019, 45, 154. [Google Scholar] [CrossRef] [PubMed]
- Jones, A. Race, Socioeconomic Status, and Health during Childhood: A Longitudinal Examination of Racial/Ethnic Differences in Parental Socioeconomic Timing and Child Obesity Risk. Int. J. Environ. Res. Public Health 2018, 15, 728. [Google Scholar] [CrossRef] [Green Version]
- Ruhm, C.J. Maternal Employment and Adolescent Development. Labour Econ. 2008, 15, 958–983. [Google Scholar] [CrossRef] [Green Version]
- Aguayo, V.M.; Menon, P. Stop stunting: Improving child feeding, women’s nutrition and household sanitation in South Asia. Matern. Child Nutr. 2016, 12 (Suppl. S1), 3–11. [Google Scholar] [CrossRef] [Green Version]
- Beal, T.; Tumilowicz, A.; Sutrisna, A.; Izwardy, D.; Neufeld, L.M. A review of child stunting determinants in Indonesia. Matern. Child Nutr. 2018, 14, e12617. [Google Scholar] [CrossRef]
- WHO. Diarrhoeal Disease. Available online: https://www.who.int/news-room/fact-sheets/detail/diarrhoeal-disease (accessed on 2 February 2021).
- Rah, J.H.; Sukotjo, S.; Badgaiyan, N.; Cronin, A.A.; Torlesse, H. Improved sanitation is associated with reduced child stunting amongst Indonesian children under 3 years of age. Matern. Child Nutr. 2020, 16 (Suppl. S2), e12741. [Google Scholar] [CrossRef] [PubMed]
- Moss, C.; Bekele, T.H.; Salasibew, M.M.; Sturgess, J.; Ayana, G.; Kuche, D.; Eshetu, S.; Abera, A.; Allen, E.; Dangour, A.D. Sustainable Undernutrition Reduction in Ethiopia (SURE) evaluation study: A protocol to evaluate impact, process and context of a large-scale integrated health and agriculture programme to improve complementary feeding in Ethiopia. BMJ Open 2018, 8, e022028. [Google Scholar] [CrossRef] [PubMed]
- Desalegn, B.B.; Lambert, C.; Riedel, S.; Negese, T.; Biesalski, H.K. Feeding Practices and Undernutrition in 6–23-Month-Old Children of Orthodox Christian Mothers in Rural Tigray, Ethiopia: Longitudinal Study. Nutrients 2019, 11, 138. [Google Scholar] [CrossRef] [PubMed] [Green Version]


| Variables | Urban (n = 2284) | Rural (n = 6531) | χ2 | p |
|---|---|---|---|---|
| Individual-level | ||||
| Age of child | ||||
| 0–11 | 520 (22.77) | 1450 (22.20) | 24.65 | 0.04 |
| 12–23 | 573 (25.09) | 1481 (22.68) | ||
| 24–35 | 424 (18.56) | 1264 (19.35) | ||
| 36–47 | 411 (17.99) | 1169 (17.90) | ||
| 48–59 | 355 (15.54) | 1166 (17.85) | ||
| Missing | 1 (0.04) | 1 (0.02) | ||
| Sex of child | ||||
| Male | 1179 (51.62) | 3291 (50.39) | 1.96 | 0.31 |
| Female | 1105 (48.38) | 3240 (49.61) | ||
| Birth weight | ||||
| Low | 277 (12.13) | 432 (6.61) | 2.16 | 0.34 |
| Normal or high | 1760 (77.06) | 3099 (47.45) | ||
| Missing | 247 (10.81) | 3000 (45.93) | ||
| Month of breastfeeding | ||||
| <6 | 263 (11.51) | 699 (10.70) | 3.6 | 0.06 |
| 6–12 | 280 (12.26) | 834 (12.77) | ||
| 13–24 | 336 (14.71) | 945 (14.47) | ||
| >24 | 22 (0.96) | 89 (1.36) | ||
| Never breastfed | 29 (1.27) | 39 (0.60) | ||
| Missing | 1354 (59.28) | 3925 (60.10) | ||
| Place of delivery | ||||
| Home | 267 (11.69) | 2977 (45.58) | 861.88 | <0.001 |
| Medical institutions | 2017 (88.31) | 3554 (54.42) | ||
| Household-level | ||||
| Mother’s age at first birth (Y) | ||||
| 0–14 | 31 (1.36) | 189 (2.89) | 246.99 | <0.001 |
| 15–19 | 1149 (50.31) | 4083 (62.52) | ||
| 20–24 | 807 (35.33) | 1935 (29.63) | ||
| ≥25 | 297 (13.00) | 324 (4.96) | ||
| Total number of children ever born | ||||
| 1–2 | 1154 (50.53) | 2060 (31.54) | 419.44 | <0.001 |
| 3–4 | 707 (30.95) | 1873 (28.68) | ||
| ≥5 | 423 (18.52) | 2598 (39.78) | ||
| Mother’s body mass index | ||||
| Underweight | 126 (5.52) | 485 (7.43) | 690.05 | <0.001 |
| Normal | 1240 (54.29) | 4817 (73.76) | ||
| Overweight | 501 (21.94) | 970 (14.85) | ||
| Obese | 417 (18.26) | 259 (3.97) | ||
| Mother’s current marital status | ||||
| Married | 1444 (63.22) | 4090 (62.62) | 2.49 | 0.35 |
| Living together | 464 (20.32) | 1398 (21.41) | ||
| Widowed/divorced/live apart | 247 (10.81) | 725 (11.10) | ||
| Never married | 129 (5.65) | 317 (4.85) | ||
| Missing | 0 (0.00) | 1 (0.02) | ||
| Mother’s highest education level | ||||
| No education | 208 (9.11) | 1683 (25.77) | 880.1 | <0.001 |
| Primary | 1389 (60.81) | 4297 (65.79) | ||
| Secondary | 625 (27.36) | 536 (8.21) | ||
| Higher | 62 (2.71) | 15 (0.23) | ||
| Mother’s occupation | ||||
| Non-agricultural worker | 1296 (56.74) | 992 (15.19) | 2547.8 | <0.001 |
| Agricultural worker | 351 (15.37) | 4755 (72.81) | ||
| Not working | 637 (27.89) | 783 (11.99) | ||
| Missing | 0 (0.00) | 1 (0.02) | ||
| Sex of household head | ||||
| Male | 1817 (79.55) | 5531 (84.69) | 40.57 | <0.001 |
| Female | 467 (20.45) | 1000 (15.31) | ||
| Source of drinking water | ||||
| Piped water | 776 (33.98) | 2383 (36.49) | 34.24 | <0.001 |
| Well/spring | 658 (28.81) | 1568 (24.01) | ||
| Open source water | 725 (31.74) | 2240 (34.30) | ||
| Others | 125 (5.47) | 340 (5.21) | ||
| Type of toilet | ||||
| Flush toilet | 887 (38.84) | 179 (2.74) | 2301.57 | <0.001 |
| Pit latrine | 1231 (53.90) | 5011 (76.73) | ||
| No facility/bush/field | 79 (3.46) | 1056 (16.17) | ||
| Others | 86 (3.77) | 284 (4.35) | ||
| Missing | 1 (0.04) | 1 (0.02) | ||
| Variables | Reference | B | SE | Wald χ2 | OR (95% CI) | p |
|---|---|---|---|---|---|---|
| Phase * | 1991–1992 | 43.85 | 1 | <0.001 | ||
| 1996 | −0.32 | 0.10 | 9.57 | 0.73 (0.59,0.89) | ||
| 2004–2005 | −0.49 | 0.10 | 25.98 | 0.61 (0.51,0.74) | ||
| 2009–2010 | −0.43 | 0.10 | 17.48 | 0.65 (0.54,0.80) | ||
| 2015–2016 | −0.74 | 0.13 | 33.38 | 0.48 (0.37,0.61) | ||
| Individual-level | ||||||
| Age of child (M) | 0–11 | 37.89 | 1 | <0.001 | ||
| 12–23 | 0.60 | 0.15 | 16.69 | 1.82 (1.36,2.42) | ||
| 24–35 | 0.71 | 0.16 | 20.48 | 2.04 (1.50,2.77) | ||
| 36–47 | 0.50 | 0.16 | 9.76 | 1.65 (1.20,2.25) | ||
| 48–59 | 0.18 | 0.16 | 1.25 | 1.20 (0.87,1.66) | ||
| Sex of child | Male | 1 | <0.001 | |||
| Female | −0.46 | 0.07 | 49.10 | 0.63 (0.55,0.72) | ||
| Birth weight | Low | 1 | <0.001 | |||
| Normal or high | −0.77 | 0.09 | 79.19 | 0.46 (0.39,0.55) | ||
| Place of delivery | Home | 1 | 0.002 | |||
| Medical institutions | −0.49 | 0.16 | 9.65 | 0.61 (0.45,0.83) | ||
| Month of breastfeeding | <6 | 29.20 | 1 | <0.001 | ||
| 6–12 | 0.56 | 0.14 | 16.83 | 1.75 (1.34,2.28) | ||
| 13–24 | 0.69 | 0.17 | 16.16 | 2.00 (1.43,2.80) | ||
| >24 | 0.97 | 0.21 | 21.73 | 2.65 (1.76,3.99) | ||
| Never breastfed | 1.28 | 0.34 | 14.23 | 3.60 (1.85,7.00) | ||
| Household-level | ||||||
| Mother’s total number of children | ≥5 | 7.90 | 1 | 0.019 | ||
| 3–4 | −0.22 | 0.09 | 5.75 | 0.80 (0.67,0.96) | ||
| 1–2 | −0.03 | 0.09 | 0.15 | 0.97 (0.81,1.15) | ||
| Mother’s BMI | Underweight | 19.54 | 1 | <0.001 | ||
| Normal | 0.08 | 0.13 | 0.41 | 1.09 (0.84,1.40) | ||
| Overweight | −0.17 | 0.15 | 1.41 | 0.84 (0.63,1.12) | ||
| Obese | −0.40 | 0.17 | 5.40 | 0.67 (0.47,0.94) | ||
| Mother’s highest education level | No education | 27.48 | 1 | <0.001 | ||
| Primary | −0.27 | 0.11 | 5.97 | 0.76 (0.61,0.95) | ||
| Secondary | −0.74 | 0.15 | 24.55 | 0.48 (0.36,0.64) | ||
| Higher | −0.79 | 0.34 | 5.47 | 0.46 (0.24,0.88) | ||
| Mother’s occupation | Not working | 14.01 | 1 | 0.003 | ||
| Non-agricultural worker | −0.02 | 0.22 | 0.01 | 0.98 (0.64,1.50) | ||
| Agricultural worker | 0.29 | 0.09 | 10.26 | 1.34 (1.12,1.60) | ||
| Others | −0.01 | 0.08 | 0.02 | 0.99 (0.85,1.16) | ||
| Sex of household head | Female | 1 | <0.001 | |||
| Male | −0.43 | 0.08 | 26.69 | 0.65 (0.55,0.76) | ||
| Source of drinking water | Piped water | 9.16 | 1 | 0.027 | ||
| Open source water | −0.07 | 0.08 | 0.76 | 0.93 (0.79,1.10) | ||
| Well/Spring | −0.23 | 0.08 | 8.12 | 0.80 (0.68,0.93) | ||
| Others | −0.27 | 0.19 | 1.88 | 0.77 (0.52,1.12) | ||
| Type of toilet | Flush toilet | 18.51 | 1 | <0.001 | ||
| Pit latrine | 0.35 | 0.11 | 10.43 | 1.41 (1.15,1.75) | ||
| No facility/bush/field | 0.35 | 0.29 | 1.52 | 1.42 (0.81,2.50) | ||
| Others | −0.33 | 0.23 | 2.03 | 0.72 (0.46,1.13) | ||
| Constant | 2.24 | 0.44 | 26.35 | |||
| Variables | Reference | B | SE | Wald χ2 | OR (95% CI) | p |
|---|---|---|---|---|---|---|
| Phase * | 1991–1992 | 44.78 | 1 | <0.001 | ||
| 1996 | 0.01 | 0.07 | 0.01 | 1.01 (0.88,1.15) | ||
| 2004–2005 | −0.19 | 0.07 | 8.38 | 0.83 (0.73,0.94) | ||
| 2009–2010 | −0.22 | 0.06 | 11.41 | 0.80 (0.71,0.91) | ||
| 2015–2016 | −0.48 | 0.08 | 34.68 | 0.62 (0.53,0.72) | ||
| Individual-level | ||||||
| Age of child (M) | 0–11 | 179.07 | 1 | <0.001 | ||
| 12–23 | 0.93 | 0.10 | 90.59 | 2.53 (2.09,3.06) | ||
| 24–35 | 1.26 | 0.11 | 142.75 | 3.53 (2.87,4.35) | ||
| 36–47 | 1.04 | 0.11 | 95.46 | 2.83 (2.29,3.48) | ||
| 48–59 | 0.65 | 0.11 | 37.36 | 1.92 (1.56,2.37) | ||
| Sex of child | Male | 1 | <0.001 | |||
| Female | −0.33 | 0.04 | 58.60 | 0.72 (0.66,0.78) | ||
| Birth weight | Low | 1 | <0.001 | |||
| Normal or high | −0.60 | 0.06 | 102.19 | 0.55 (0.49,0.62) | ||
| Place of delivery | Home | 1 | 0.001 | |||
| Medical institutions | −0.21 | 0.06 | 10.57 | 0.81 (0.71,0.92) | ||
| Month of breastfeeding | <6 | 33.42 | 1 | <0.001 | ||
| 6–12 | 0.28 | 0.09 | 9.87 | 1.32 (1.11,1.57) | ||
| 13–24 | 0.36 | 0.11 | 10.15 | 1.44 (1.15,1.80) | ||
| >24 | 0.71 | 0.13 | 28.55 | 2.03 (1.56,2.63) | ||
| Never breastfed | 0.31 | 0.21 | 2.19 | 1.36 (0.90,2.06) | ||
| Household-level | ||||||
| Mother’s BMI | Underweight | 69.62 | 1 | <0.001 | ||
| Normal | −0.30 | 0.08 | 13.74 | 0.74 (0.64,0.87) | ||
| Overweight | −0.70 | 0.10 | 49.78 | 0.50 (0.41,0.60) | ||
| Obese | −0.89 | 0.16 | 30.52 | 0.41 (0.30,0.56) | ||
| Mother’s occupation | Not working | 19.32 | 1 | <0.001 | ||
| Non-agricultural worker | −0.47 | 0.20 | 5.49 | 0.62 (0.42,0.93) | ||
| Agricultural worker | 0.12 | 0.06 | 4.03 | 1.13 (1.00,1.27) | ||
| Others | −0.10 | 0.08 | 1.53 | 0.90 (0.77,1.06) | ||
| Sex of household head | Female | 1 | 0.016 | |||
| Male | −0.14 | 0.06 | 5.84 | 0.87 (0.78,0.97) | ||
| Type of toilet | Flush toilet | 19.66 | 1 | <0.001 | ||
| Pit latrine | 0.83 | 0.20 | 16.61 | 2.29 (1.54,3.40) | ||
| No facility/bush/field | 0.76 | 0.21 | 12.95 | 2.13 (1.41,3.22) | ||
| Others | 0.61 | 0.24 | 6.46 | 1.84 (1.15,2.94) | ||
| Constant | 0.41 | 0.30 | 1.87 | |||
| Variables | Categories | Urban | Rural | RERI (95% CI) | p * | ||
|---|---|---|---|---|---|---|---|
| N with/without Stunting | OR (95% CI) | N with/without Stunting | OR (95% CI) | ||||
| Sex | Female | 266/839 | 1 | 1119/2121 | 1.71 (1.16,2.52) | ||
| Male | 308/870 | 1.32 (0.84,2.08) | 1343/1947 | 2.19 (1.48,3.24) | 0.16 (−1.08,1.40) | 0.798 | |
| Birth weight | Normal or high | 471/1536 | 1 | 2256/3843 | 1.60 (1.20,2.14) | ||
| Low | 104/173 | 1.67 (0.85,3.27) | 206/225 | 4.11 (2.59,6.53) | 1.84 (−0.41,4.10) | 0.109 | |
| Place of delivery | Medical institutions | 484/1516 | 1 | 1239/2237 | 1.76 (1.30,2.37) | ||
| Home | 84/181 | 1.34 (0.68,2.63) | 1172/1739 | 1.87 (1.34,2.60) | −0.23 (−1.45,0.99) | 0.711 | |
| Mother’s age at first birth (Y) | ≥25 | 41/256 | 1 | 137/188 | 3.53 (1.57,7.92) | ||
| 20–24 | 208/599 | 1.80 (0.84,3.86) | 740/1195 | 2.97 (1.43,6.17) | −1.36 (−5.19,2.48) | 0.489 | |
| 15–19 | 316/833 | 1.38 (0.65,2.93) | 1505/2577 | 2.03 (0.98,4.20) | −1.88 (−5.25,1.50) | 0.276 | |
| 0–14 | 9/22 | 1.09 (0.15,7.81) | 80/109 | 3.39 (1.34,8.59) | −0.23 (−4.99,4.53) | 0.925 | |
| Total number of children ever born | 1–2 | 287/867 | 1 | 776/1284 | 1.51 (1.05,2.19) | ||
| 3–4 | 157/550 | 0.65 (0.37,1.15) | 685/1188 | 1.37 (0.91,2.06) | 0.21 (−0.67,1.08) | 0.644 | |
| ≥5 | 130/292 | 0.96 (0.51,1.81) | 1001/1597 | 1.53 (1.03,2.27) | 0.05 (−0.98,1.07) | 0.928 | |
| Mother’s current marital status | Married | 355/1088 | 1 | 1550/2541 | 1.77 (1.27,2.47) | ||
| Living together | 128/337 | 1.36 (0.76,2.44) | 493/905 | 1.65 (1.13,2.42) | −0.48 (−1.65,0.69) | 0.425 | |
| Widowed/divorced/live apart | 59/187 | 0.67 (0.31,1.45) | 295/430 | 1.65 (1.07,2.56) | 0.21 (−0.85,1.28) | 0.693 | |
| Never married | 32/97 | 1.09 (0.42,2.84) | 125/193 | 2.25 (1.21,4.18) | 0.39 (−1.45,2.23) | 0.679 | |
| Mother’s occupation | Non-agricultural worker | 305/991 | 1 | 322/670 | 1.49 (0.96,2.32) | ||
| Agricultural worker | 121/230 | 0.78 (0.43,1.43) | 1857/2898 | 1.57 (1.06,2.31) | 0.30 (−0.71,1.31) | 0.563 | |
| Not working | 148/488 | 0.87 (0.52,1.45) | 282/501 | 1.51 (0.96,2.37) | 0.15 (−0.90,1.20) | 0.780 | |
| Sex of household head | Male | 426/1391 | 1 | 2063/3467 | 1.86 (1.36,2.53) | ||
| Female | 148/319 | 1.55 (0.90,2.64) | 398/601 | 1.87 (1.28,2.74) | −0.54 (−1.77,0.70) | 0.396 | |
| Source of drinking water | Others | 27/99 | 1 | 120/220 | 2.03 (0.67,6.13) | ||
| Open source water | 177/548 | 1.81 (0.63,5.14) | 850/1390 | 2.86 (1.06,7.74) | 0.03 (−4.06,4.11) | 0.990 | |
| Well/spring | 183/475 | 1.64 (0.57,4.70) | 568/1000 | 3.14 (1.16,8.51) | 0.47 (−3.75,4.69) | 0.828 | |
| Piped water | 187/588 | 1.79 (0.64,5.04) | 924/1459 | 2.80 (1.04,7.57) | −0.03 (−4.05,4.00) | 0.999 | |
| Type of toilet | Flush toilet | 180/707 | 1 | 45/134 | 0.93 (0.44,1.95) | ||
| No facility/bush/field | 28/52 | 1.10 (0.19,6.47) | 390/666 | 1.98 (1.24,3.16) | 0.94 (−1.33,3.21) | 0.416 | |
| Pit latrine | 343/888 | 1.17 (0.73,1.87) | 1933/3078 | 2.00 (1.34,2.98) | 0.90 (−0.30,2.09) | 0.141 | |
| Others | 23/63 | 0.94 (0.30,3.00) | 94/191 | 1.08 (0.58,2.03) | 0.21 (−1.25,1.67) | 0.781 | |
| Age of Child (M) | 0–11 | 67/454 | 1 | 258/1192 | 1.40 (0.94,2.10) | ||
| 12–23 | 160/413 | 1.49 (0.88,2.53) | 626/855 | 3.04 (1.89,4.89) | 1.15 (−0.59,2.89) | 0.195 | |
| 24–35 | 145/279 | 10.24 (2.56,40.88) | 629/635 | 3.59 (1.73,7.46) | −7.05 (−21.48,7.38) | 0.338 | |
| 36–47 | 127/285 | 0.48 (0.04,5.38) | 521/648 | 1.43 (0.43,4.74) | 0.54 (−1.60,2.69) | 0.619 | |
| 48–59 | 75/280 | 0.70 (0.10,5.22) | 427/739 | 1.71 (0.48,6.03) | 0.60 (−2.04,3.23) | 0.658 | |
| Month of breastfeeding | <6 | 25/238 | 1 | 102/597 | 1.62 (0.91,2.85) | ||
| 6–12 | 47/233 | 2.17 (1.12,4.20) | 170/664 | 2.49 (1.43,4.34) | −0.30 (−2.49,1.90) | 0.791 | |
| 13–24 | 83/254 | 3.20 (1.64,6.25) | 404/541 | 6.82 (3.70,12.58) | 3.00 (−1.78,7.78) | 0.218 | |
| >24 | 11/11 | 6.76 (1.43,32.05) | 46/43 | 8.67 (3.42,21.94) | 1.29 (−11.99,14.57) | 0.849 | |
| Never breastfed | 8/15 | 4.34 (1.07,17.68) | 13/22 | 3.95 (1.35,11.53) | −1.01 (−8.49,6.47) | 0.792 | |
| Mother’s body mass index | Obese | 69/348 | 1 | 66/193 | 1.10 (0.47,2.56) | ||
| Overweight | 115/386 | 0.78 (0.36,1.70) | 333/636 | 1.59 (0.81,3.11) | 0.70 (−0.84,2.24) | 0.371 | |
| Normal | 348/886 | 1.22 (0.64,2.33) | 1857/2948 | 2.07 (1.13,3.80) | 0.75 (−1.00,2.50) | 0.401 | |
| Underweight | 41/84 | 1.47 (0.50,4.32) | 204/282 | 2.30 (1.17,4.52) | 0.73 (−1.68,3.14) | 0.553 | |
| Mother’s highest education level | Higher | 6/56 | 1 | 1/13 | 0.12 (0.01,1.52) | ||
| Secondary | 119/506 | 0.75 (0.19,2.97) | 167/370 | 1.72 (0.44,6.73) | 1.85 (−0.73,4.43) | 0.159 | |
| Primary | 380/1009 | 0.98 (0.25,3.85) | 1617/2679 | 1.65 (0.43,6.43) | 1.56 (−1.08,4.19) | 0.247 | |
| No education | 69/138 | 1.77 (0.37,8.46) | 677/1006 | 2.00 (0.50,7.92) | 1.11 (−2.80,5.03) | 0.578 | |
Publisher’s Note: MDPI stays neutral with regard to jurisdictional claims in published maps and institutional affiliations. |
© 2021 by the authors. Licensee MDPI, Basel, Switzerland. This article is an open access article distributed under the terms and conditions of the Creative Commons Attribution (CC BY) license (https://creativecommons.org/licenses/by/4.0/).
Share and Cite
Zhu, W.; Zhu, S.; Sunguya, B.F.; Huang, J. Urban–Rural Disparities in the Magnitude and Determinants of Stunting among Children under Five in Tanzania: Based on Tanzania Demographic and Health Surveys 1991–2016. Int. J. Environ. Res. Public Health 2021, 18, 5184. https://0-doi-org.brum.beds.ac.uk/10.3390/ijerph18105184
Zhu W, Zhu S, Sunguya BF, Huang J. Urban–Rural Disparities in the Magnitude and Determinants of Stunting among Children under Five in Tanzania: Based on Tanzania Demographic and Health Surveys 1991–2016. International Journal of Environmental Research and Public Health. 2021; 18(10):5184. https://0-doi-org.brum.beds.ac.uk/10.3390/ijerph18105184
Chicago/Turabian StyleZhu, Wenjun, Si Zhu, Bruno F. Sunguya, and Jiayan Huang. 2021. "Urban–Rural Disparities in the Magnitude and Determinants of Stunting among Children under Five in Tanzania: Based on Tanzania Demographic and Health Surveys 1991–2016" International Journal of Environmental Research and Public Health 18, no. 10: 5184. https://0-doi-org.brum.beds.ac.uk/10.3390/ijerph18105184