
Mapping the Burden of Hypertension in South Africa: A Comparative Analysis of the National 2012 SANHANES and the 2016 Demographic and Health Survey


 , ,
, ,
Abstract
:1. Introduction
2. Materials and Methods
2.1. Study Population
2.2. Outcome Measure
2.3. Covariates
2.4. Statistical Analysis
3. Results
3.1. Descriptive Analyses
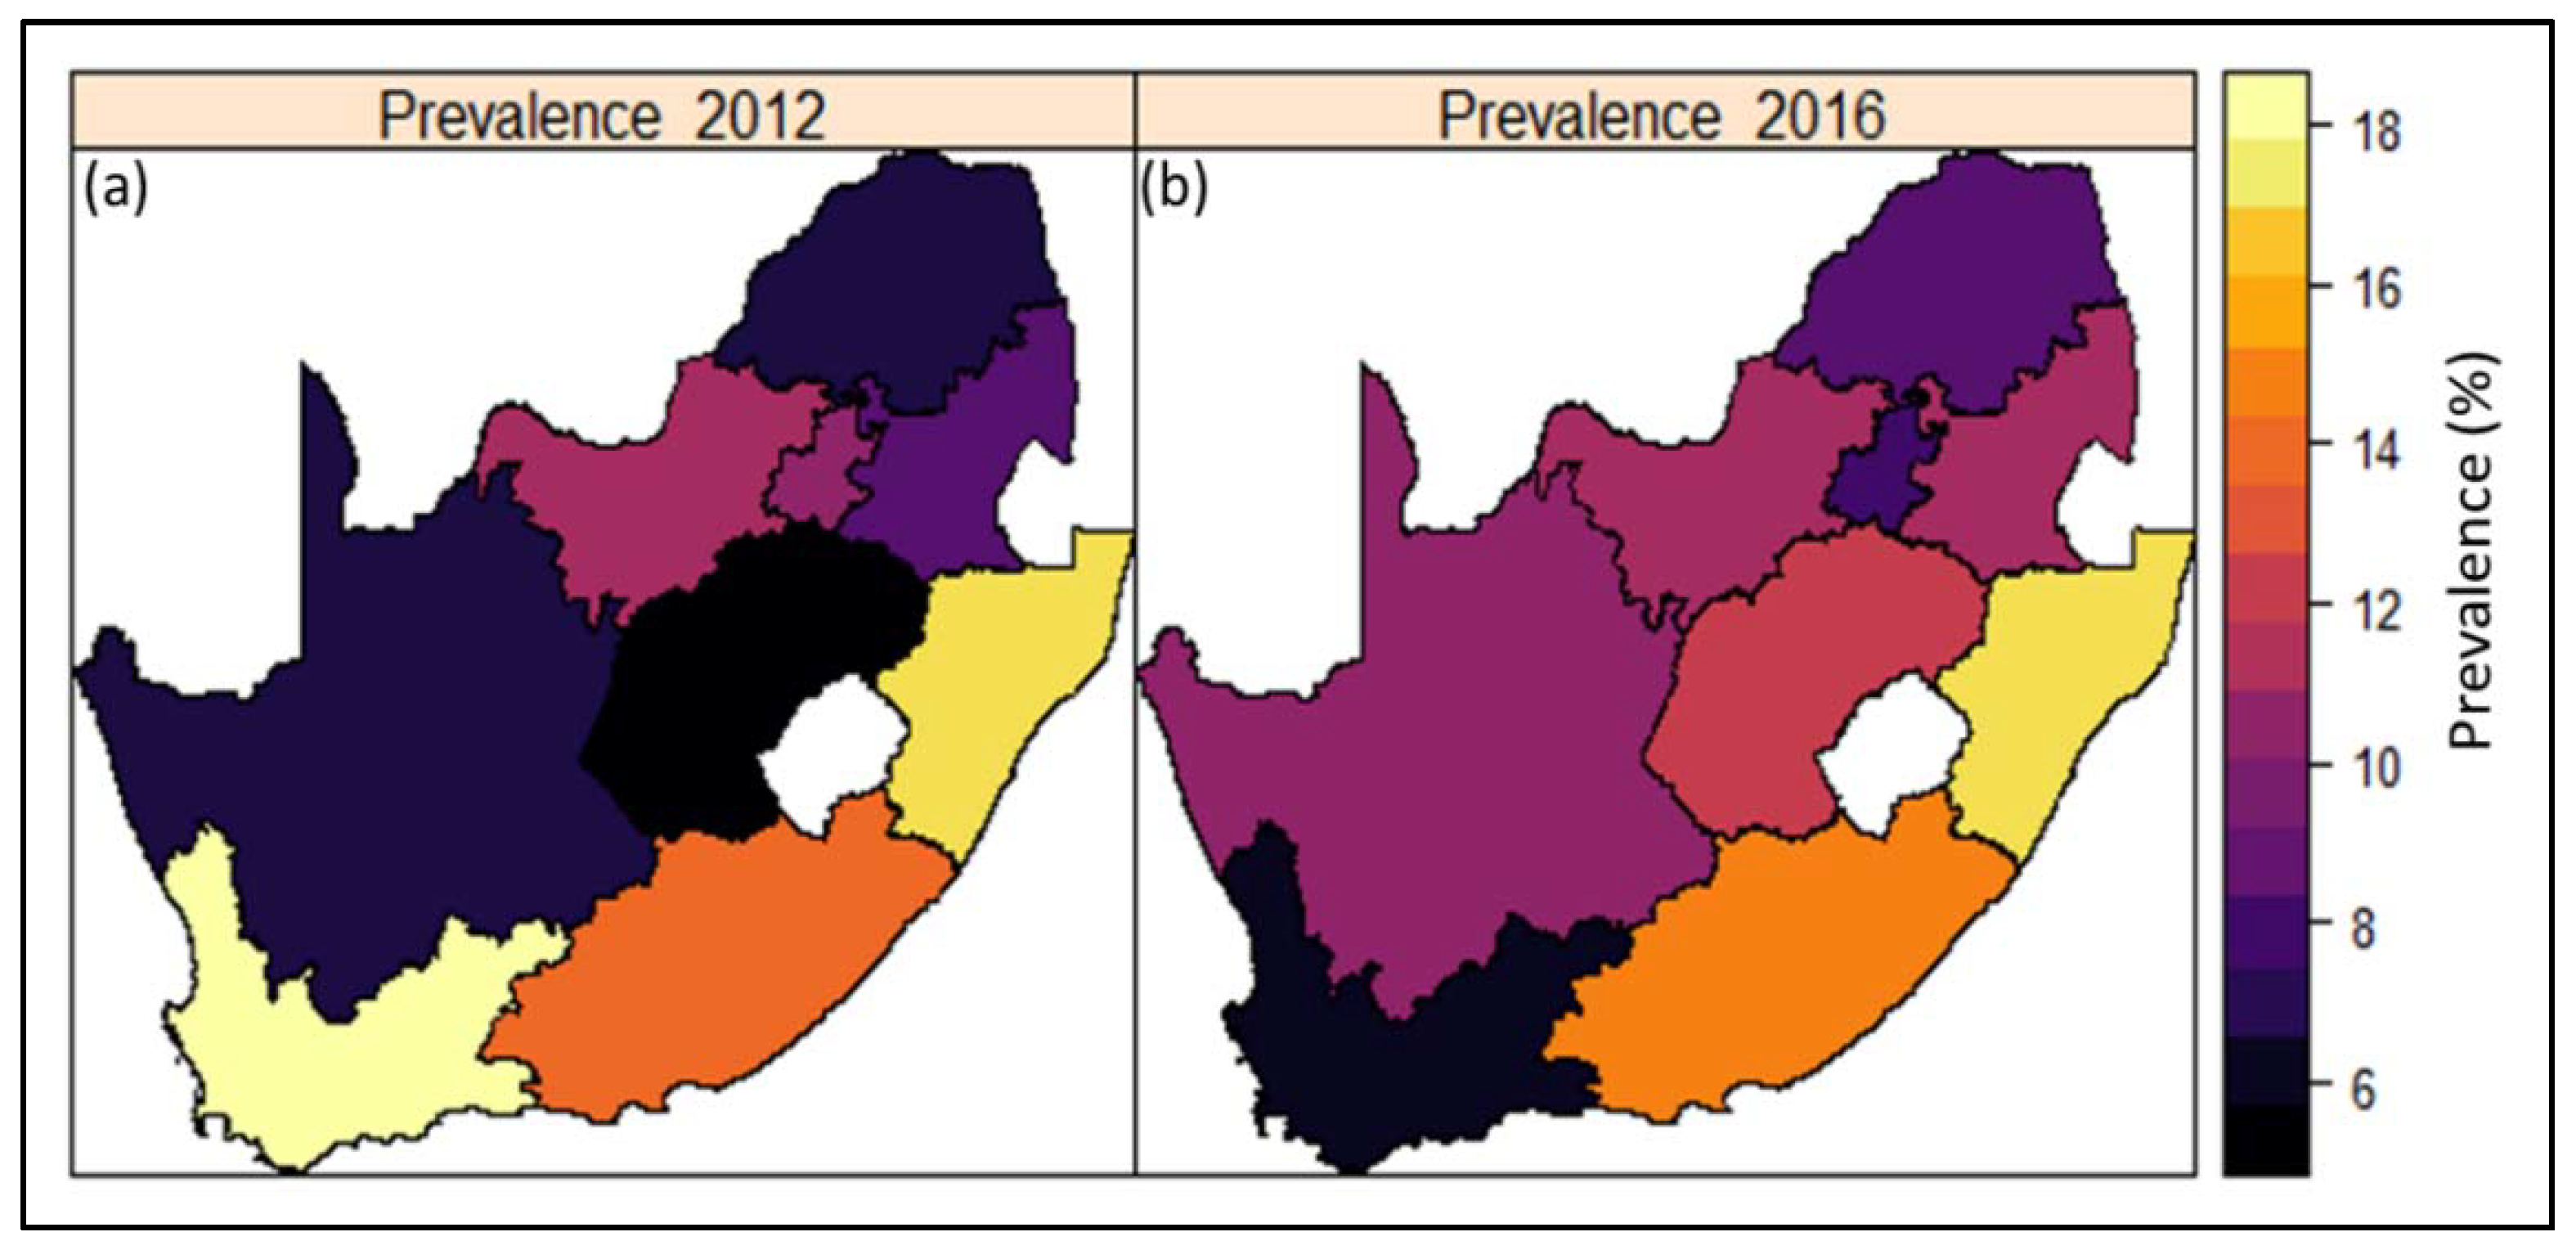
3.2. Geographic Variation in Hypertension
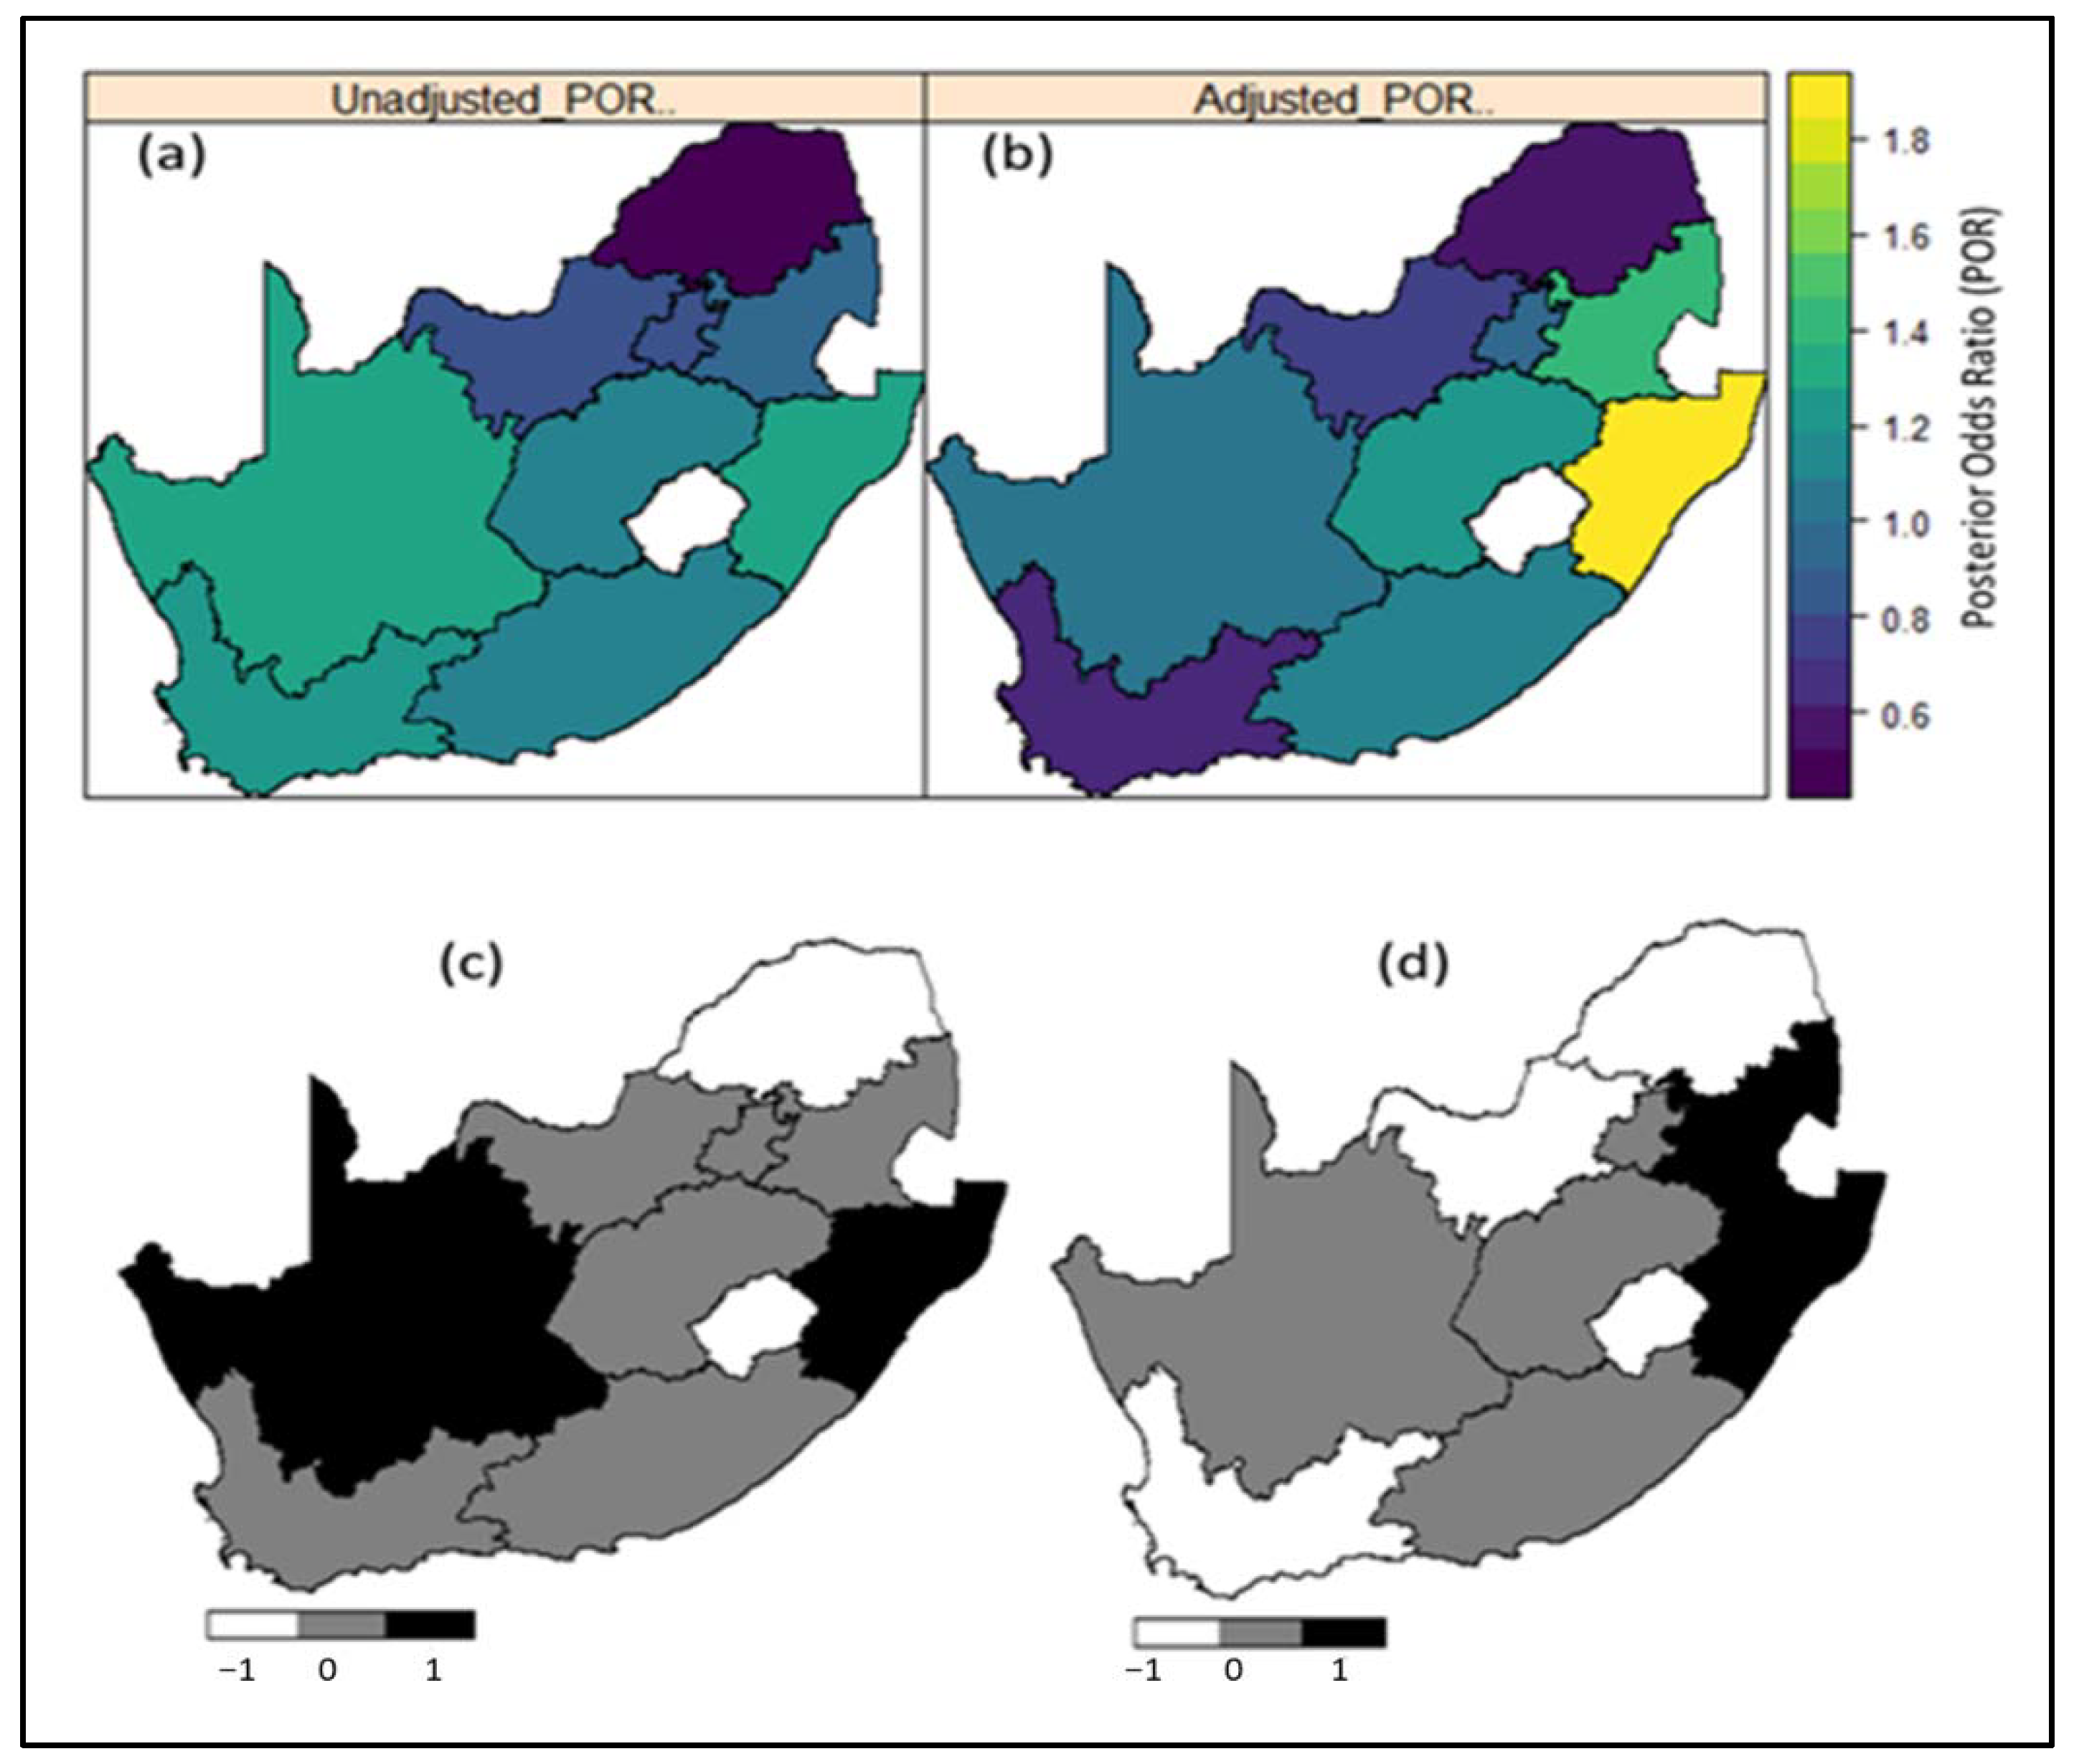
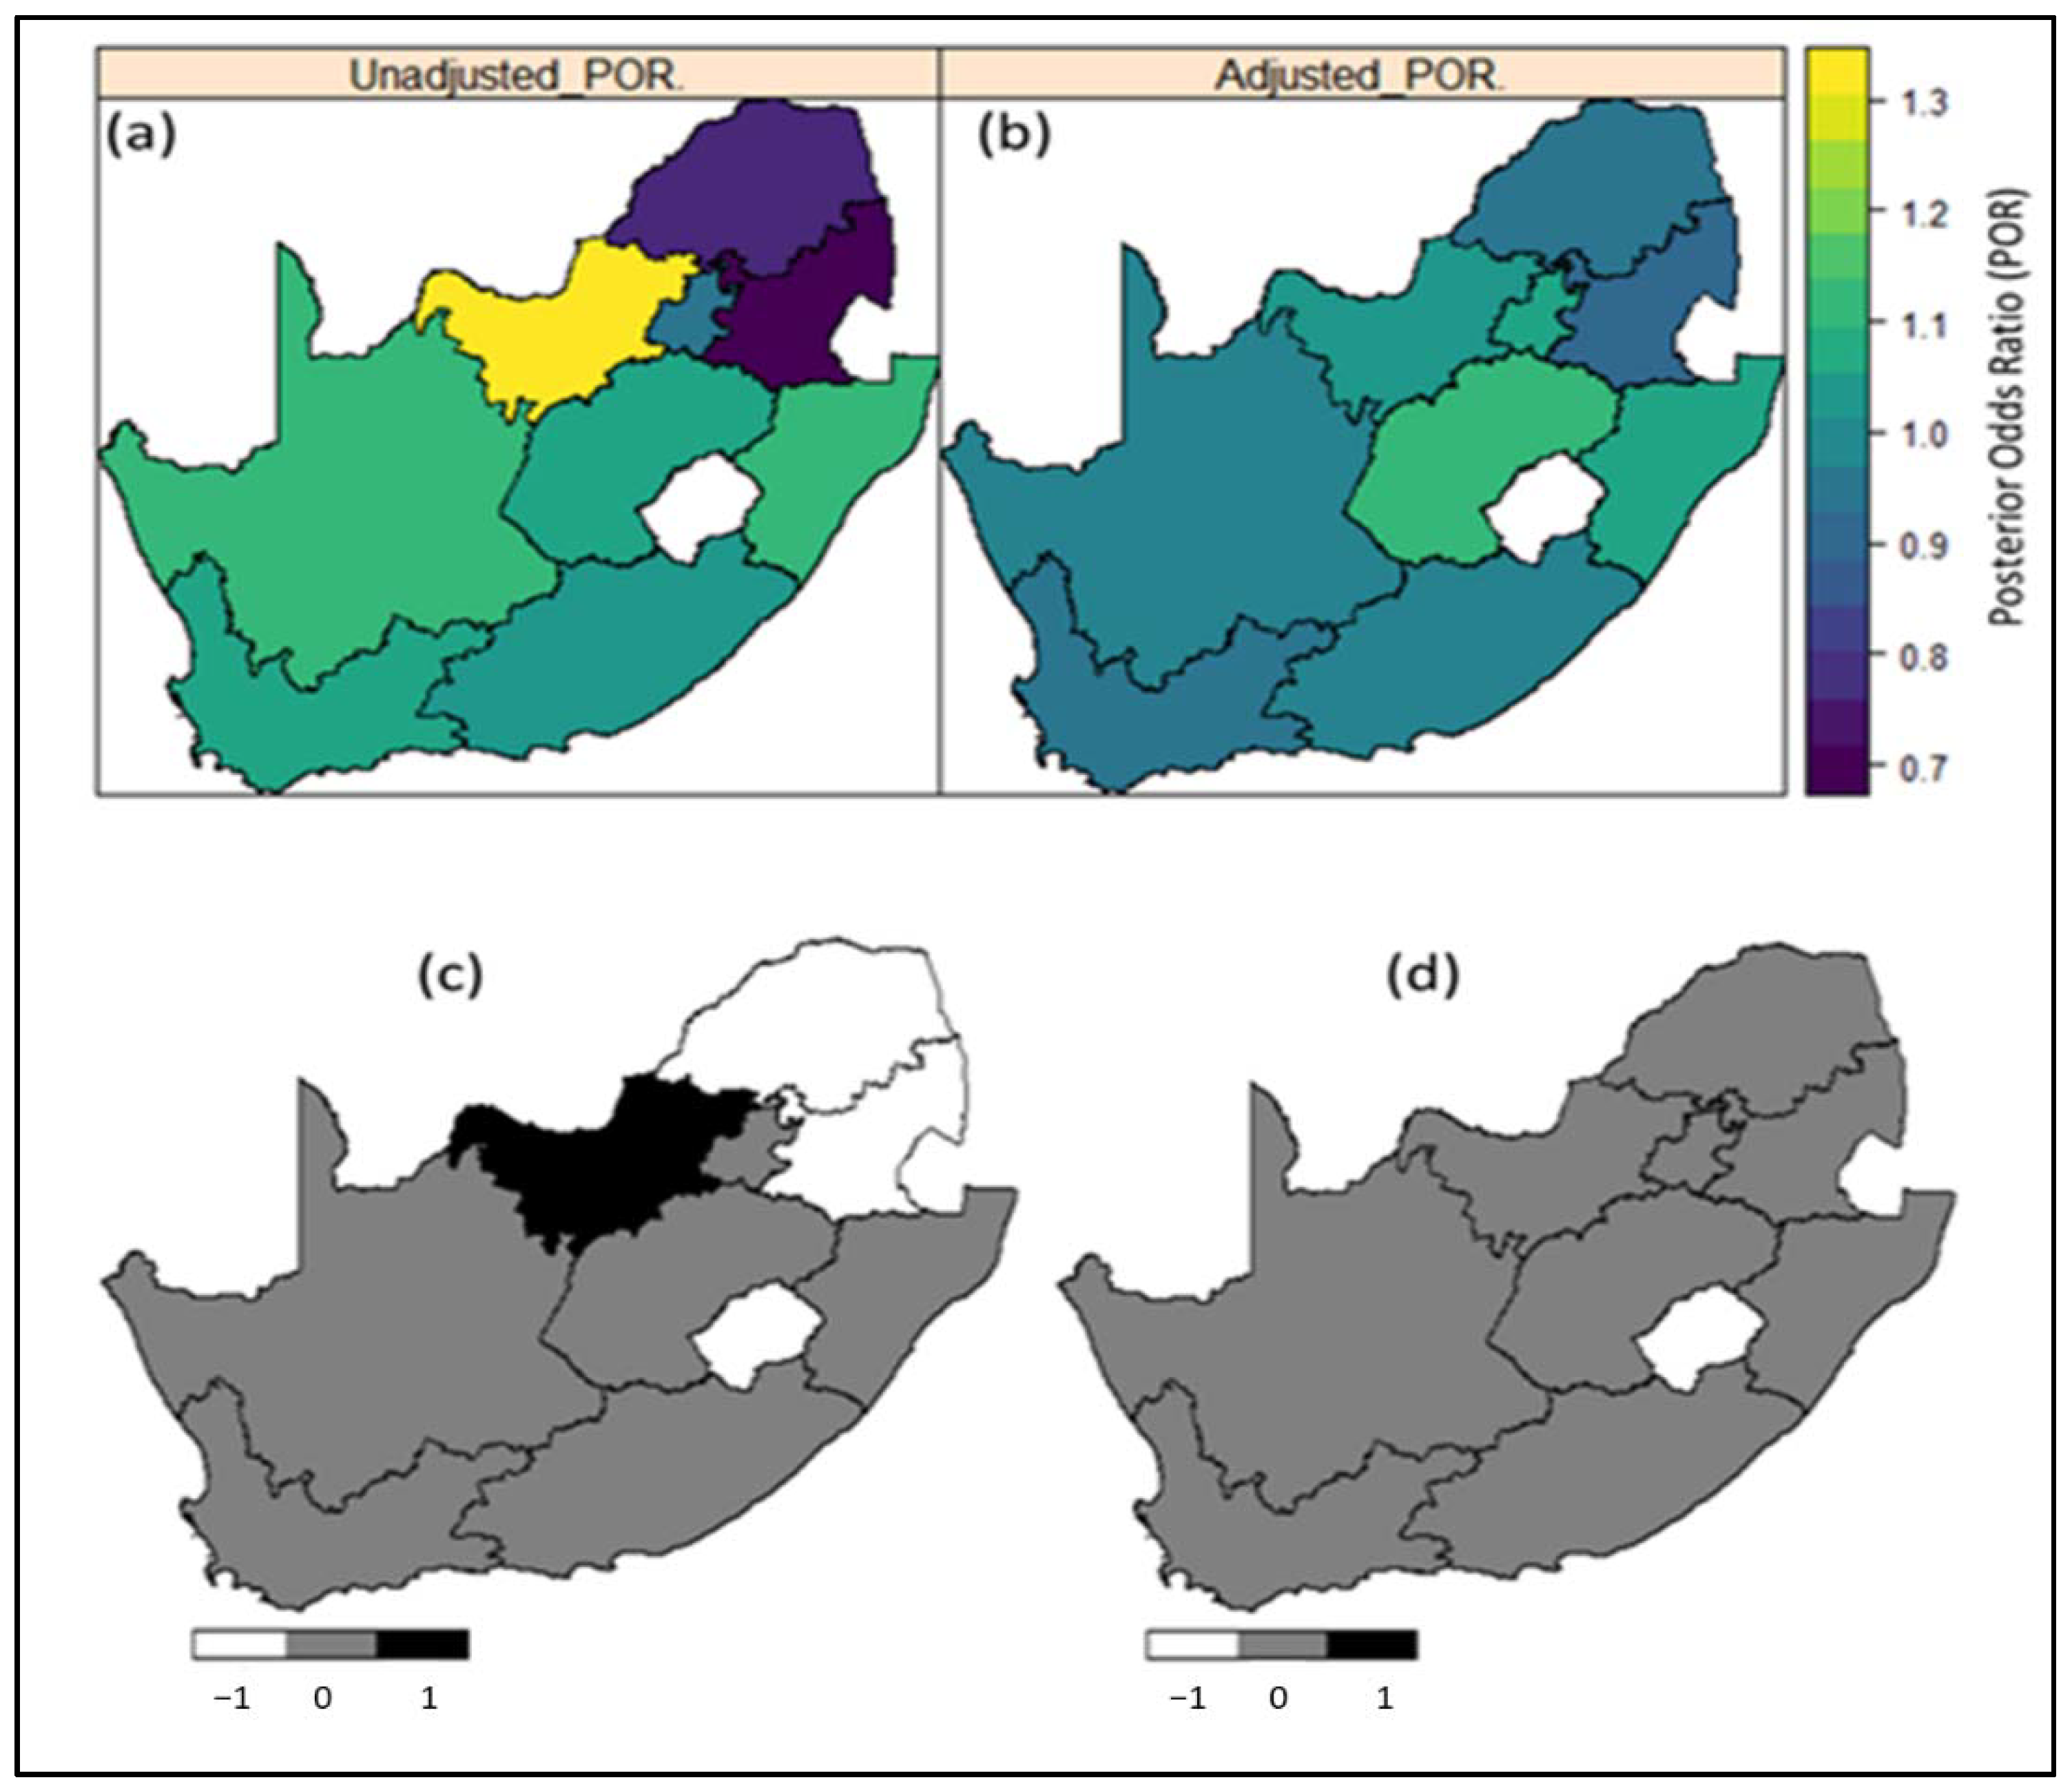
3.3. Bayesian Geo-Additive Regression Results
4. Discussion
5. Conclusions
Author Contributions
Funding
Institutional Review Board Statement
Informed Consent Statement
Data Availability Statement
Acknowledgments
Conflicts of Interest
References
- Salomon, J.A.; Murray, C.J.L. The Epidemiologic transition revisited: Compositional models for causes of death by age and sex. Popul. Dev. Rev. 2002, 28, 205–228. [Google Scholar] [CrossRef]
- Mathers, C.D.; Loncar, D. Projections of global mortality and burden of disease from 2002 to 2030. PLoS Med. 2006, 3, e442. [Google Scholar] [CrossRef] [PubMed] [Green Version]
- Gaziano, T.A. Reducing the growing burden of cardiovascular disease in the developing world. Health Aff. 2007, 26, 13–24. [Google Scholar] [CrossRef] [Green Version]
- World Health Organization Factsheet on Hypertension. Available online: https://www.who.int/news-room/fact-sheets/detail/hypertension (accessed on 25 September 2020).
- Bradshaw, D.; Nannan, N.; Groenewald, P.; Joubert, J.; Laubscher, R.; Nojilana, B.; Norman, R.; Pieterse, D.; Schneider, M. Provincial mortality in South Africa, 2000--priority-setting for now and a benchmark for the future. South Afr. Med, J. 2005, 95, 496–503. [Google Scholar]
- Shisana, O.; Labadarios, D.; Rehle, T.; Simbayi, L.; Zuma, K.; Dhansay, A.; Reddy, P.; Parker, W.; Hoosain, E.; Naidoo, P.; et al. South African National Health and Nutrition Examination Survey (SANHANES-1); HSRC Press: Cape Town, South Africa, 2014. [Google Scholar]
- National Department of Health (NDoH); Statistics South Africa (Stats SA); South African Medical Research Council (SAMRC); ICF. South Africa Demographic and Health Survey 2016: Key Indicator Report; NDoH: Port Moresby, Papua New Guinea; Stats SA: KwaDukuza, South Africa; SAMRC: Cape Town, South Africa; ICF: Lexington, KY, USA, 2017.
- Adeloye, D.; Basquill, C. Estimating the Prevalence and Awareness Rates of Hypertension in Africa: A Systematic Analysis. PLoS ONE 2014, 9, e104300. [Google Scholar] [CrossRef] [PubMed] [Green Version]
- Kandala, N.-B.; Tigbe, W.; Manda, S.O.; Stranges, S. Geographic Variation of Hypertension in Sub-Saharan Africa: A Case Study of South Africa. Am. J. Hypertens. 2013, 26, 382–391. [Google Scholar] [CrossRef] [PubMed] [Green Version]
- Barker, L.E.; Kirtland, K.A.; Gregg, E.W.; Geiss, L.S.; Thompson, T.J. Geographic Distribution of Diagnosed Diabetes in the U.S.: A Diabetes Belt. Am. J. Prev. Med. 2011, 40, 434–439. [Google Scholar] [CrossRef] [PubMed]
- Shrestha, S.; Kirtland, A.; Thompson, T.; Barker, L.; Gregg, E.; Geiss, L. Spatial clusters of county-level diagnosed diabetes and associated risk factors in the United States. Open Diabetes J. 2012, 5, 29–37. [Google Scholar] [CrossRef]
- Liu, L.; Núñez, A.E.; Yu, X.; Yin, X.; Eisen, H.J. Multilevel and Spatial–Time Trend Analyses of the Prevalence of Hypertension in a Large Urban City in the USA. J. Hered. 2013, 90, 1053–1063. [Google Scholar] [CrossRef] [PubMed] [Green Version]
- Kershaw, K.N.; Roux, A.V.D.; Carnethon, M.; Darwin, C.; Goff, D.C.; Post, W.; Schreiner, P.J.; Watson, K. Geographic Variation in Hypertension Prevalence Among Blacks and Whites: The Multi-Ethnic Study of Atherosclerosis. Am. J. Hypertens. 2010, 23, 46–53. [Google Scholar] [CrossRef]
- Pedigo, A.; Aldrich, T.; Odoi, A. Neighborhood disparities in stroke and myocardial infarction mortality: A GIS and spatial scan statistics approach. BMC Public Health 2011, 11, 644. [Google Scholar] [CrossRef] [Green Version]
- Stevens, C.D.; Schriger, D.L.; Raffetto, B.; Davis, A.C.; Zingmond, D.; Roby, D.H. Geographic Clustering of Diabetic Lower-Extremity Amputations in Low-Income Regions Of California. Health Aff. 2014, 33, 1383–1390. [Google Scholar] [CrossRef] [PubMed] [Green Version]
- Seedat, Y.K.; Rayner, B.L.; Veriava, Y. South African hypertension practice guideline 2014: Review article. Cardiovasc. J. Afr. 2014, 25, 288–294. [Google Scholar] [CrossRef] [PubMed] [Green Version]
- Kandala, N.-B.; Ghilagaber, G. A Geo-Additive Bayesian Discrete-Time Survival Model and its Application to Spatial Analysis of Childhood Mortality in Malawi. Qual. Quant. 2006, 40, 935–957. [Google Scholar] [CrossRef]
- Ibrahim, M.M.; Damasceno, A. Hypertension in developing countries. Lancet 2012, 380, 611–619. [Google Scholar] [CrossRef]
- Boateng, D.; Wekesah, F.; Browne, J.L.; Agyemang, C.; Agyei-Baffour, P.; Aikins, A.D.-G.; Smit, H.A.; Grobbee, D.E.; Klipstein-Grobusch, K. Knowledge and awareness of and perception towards cardiovascular disease risk in sub-Saharan Africa: A systematic review. PLoS ONE 2017, 12, e0189264. [Google Scholar] [CrossRef] [PubMed] [Green Version]
- Busari, O.A.; Olusegun, T.; Olufemi, O.; Desalu, O.; Opadijo, O.G.; Jimoh, A.K.; Agboola, S.M.; Busari, O.E.; Olalekan, O. Impact of patients’ knowledge, attitude and practices on hypertension on compliance with antihypertensive drugs in a resource-poor setting. TAF Prev. Med. Bull. 2010, 9, 87–92. [Google Scholar]
- Massyn, N.; Peer, N.; English, R.; Padarath, A.; Barron, P.; Day, C. (Eds.) District Health Barometer 2015/16. Health Systems Trust: Durban. 2016. Available online: https://www.hst.org.za/publications/District%20Health%20Barometers/District%20Health%20Barometer%202015_16.pdf (accessed on 12 December 2020).
- Goldstein, H. Multilevel Statistical Models, 1st ed.; John Wiley & Sons, Inc.: Hoboken, NJ, USA, 1999; Available online: http://multilevel.ioe.ac.uk/index.html (accessed on 1 December 2020).
- Nnanatu, C.C.; Atilola, G.; Komba, P.; Mavatikua, L.; Moore, Z.; Matanda, D.; Obianwu, O.; Kandala, N.-B. Evaluating changes in the prevalence of female genital mutilation/cutting among 0–14 years old girls in Nigeria using data from multiple surveys: A novel Bayesian hierarchical spatio-temporal model. PLoS ONE 2021, 16, e0246661. [Google Scholar] [CrossRef]
- Langford, I.H.; Leyland, A.H.; Rasbash, J.; Goldstein, H. Multilevel modelling of the geographical distributions of diseases. J. R. Stat. Soc. Ser. C Appl. Stat. 1999, 48, 253–268. [Google Scholar] [CrossRef] [PubMed]
- Borgoni, R.; Billardi, F.C. Bayesian spatial analysis of demographic survey data: An application to contraceptive use at first sexual intercourse. Demogr. Res. 2003, 8, 61–92. [Google Scholar] [CrossRef]
- Lachenbruch, P.A.; Rabe-Hesketh, S.; Everitt, B. A Handbook of Statistical Analyses Using Stata. Am. Stat. 2000, 54, 153. [Google Scholar] [CrossRef]
- Bolstad, M.W.; Manda, O.S. Investigating Child Mortality in Malawi Using Family and Community Random Effects: A Bayesian Analysis. J. Am. Stat. Assoc. 2001, 96, 12–19. [Google Scholar] [CrossRef]


| DHS 2016 | SANHANES 2012 | |||||
|---|---|---|---|---|---|---|
| % Hypertensive: 48.2% (n = 8230) | % Hypertensive: 38.4% (n = 6867) | |||||
| Variable | Normotensive (n = 4227) | Hypertensive (n = 4003) | p-Value 1 | Normotensive (n = 3827) | Hypertensive (n = 3040) | p-Value 1 |
| Total | 4227 (100) | 4003 (100) | ||||
| Mean age (S.E) | 31.6 (0.28) | 47.9 (0.53) | <0.001 | 30.5 (0.35) | 46.8 (0.73) | <0.001 |
| Sex (%) | ||||||
| Male | 1719 (40.7) | 1527 (37.8) | 1367 (44.2) | 991 (41) | ||
| Female | 2508 (59.3) | 2476 (62.2) | 0.04 | 2460 (55.8) | 2048 (59) | 0.128 |
| Ethnicity (%) | ||||||
| Black/African | 3793 (89.9) | 3335 (83) | 2765 (80.8) | 2005 (73.5) | ||
| White | 98 (3) | 201 (6.6) | 60 (5.9) | 71 (11) | ||
| Coloured | 284 (5.3) | 414 (8.5) | 829 (9.8) | 774 (12.6) | ||
| Indian/Asian | 51 (1.8) | 50 (2) | <0.001 | 162 (3.4) | 181 (3) | 0.021 |
| Education (%) | ||||||
| No education | 195 (4.3) | 561 (12.3) | 187 (4.7) | 412 (9.2) | ||
| Primary education | 701 (14.6) | 960 (22.7) | 614 (15.3) | 782 (22.4) | ||
| Secondary education | 2975 (72.1) | 2123 (55.9) | 2317 (71.8) | 1217 (56.8) | ||
| Higher education | 324 (9) | 314 (9.1) | <0.001 | 176 (8.3) | 145 (11.6) | <0.001 |
| Place of residence (%) | ||||||
| Urban | 2090 (61.1) | 2229 (65) | 2263 (60) | 1860 (64.7) | ||
| Rural | 2137 (38.9) | 1774 (35) | 0.037 | 1564 (40) | 1180 (35.3) | 0.029 |
| Wealth index | ||||||
| Poorest | 957 (21.2) | 814 (19.8) | 764 (22.1) | 550 (19.6) | ||
| Poorer | 995 (21.7) | 808 (18.1) | 632 (20.6) | 496 (17.9) | ||
| Middle | 1025 (22) | 907 (21.1) | 698 (22) | 525 (19.5) | ||
| Richer | 760 (18.9) | 858 (20.4) | 677 (20.5) | 569 (21.8) | ||
| Richest | 490 (16.1) | 616 (20.6) | 0.002 | 395 (14.8) | 344 (21.2) | 0.003 |
| Body Mass Index (kg/m2) (%) | ||||||
| <25 kg/m2 | 2385 (56) | 1478 (35.5) | 2169 (58.7) | 1052 (37.6) | ||
| 25–29.9 kg/m2 | 974 (23.6) | 997 (26.1) | 770 (21.4) | 698 (24.2) | ||
| ≥30 kg/m2 | 824 (20.4) | 1457 (38.4) | <0.001 | 754 (19.9) | 1134 (38.3) | <0.001 |
| Waist circumference (tertile) (%) | ||||||
| 1 (lowest) | 1840 (43.9) | 841 (21.2) | 1554 (42.9) | 583 (20.3) | ||
| 2 (middle) | 1419 (35) | 1258 (31.4) | 1291 (34.8) | 974 (35.1) | ||
| 3 (highest) | 885 (21.1) | 1829 (47.3) | <0.001 | 835 (22.4) | 1337 (44.6) | <0.001 |
| Smoking status (%) | ||||||
| Noncurrent smoker | 3439 (80.9) | 3208 (80.6) | 2809 (83.5) | 2218 (79.4) | ||
| Current smoker | 788 (19.1) | 795 (19.4) | 0.829 | 619 (16.5) | 568 (20.6) | 0.058 |
| Drinking status (past 12 months) (%) | ||||||
| Noncurrent drinker | 340 (17) | 323 (20.2) | 2616 (74.1) | 2157 (71.4) | ||
| Current drinker | 1394 (83) | 1199 (79.8) | 0.095 | 796 (25.9) | 629 (28.6) | 0.236 |
| Diabetes (%) | ||||||
| No | 4152 (98.5) | 3669 (91.8) | 3327 (98.1) | 2350 (86.9) | ||
| Yes | 60 (1.5) | 314 (8.2) | <0.001 | 76 (1.9) | 411 (13.1) | <0.001 |
| High blood cholesterol (%) | ||||||
| No | 4172 (99) | 3783 (93.5) | 3246 (98.3) | 2452 (88.5) | ||
| Yes | 36 (1) | 195 (6.5) | <0.001 | 49 (1.7) | 238 (11.5) | <0.001 |
| Heart attack or angina (%) | ||||||
| No | 4134 (98) | 3764 (94.6) | 3333 (96.6) | 2532 (92.5) | ||
| Yes | 83 (2) | 227 (5.4) | <0.001 | 101 (3.4) | 248 (7.5) | <0.001 |
| Stroke (%) | ||||||
| No | 4186 (99.5) | 3903 (97.6) | 3398 (99.2) | 2641 (95) | ||
| Yes | 29 (0.5) | 92 (2.4) | <0.001 | 30 (0.8) | 152 (5) | <0.001 |
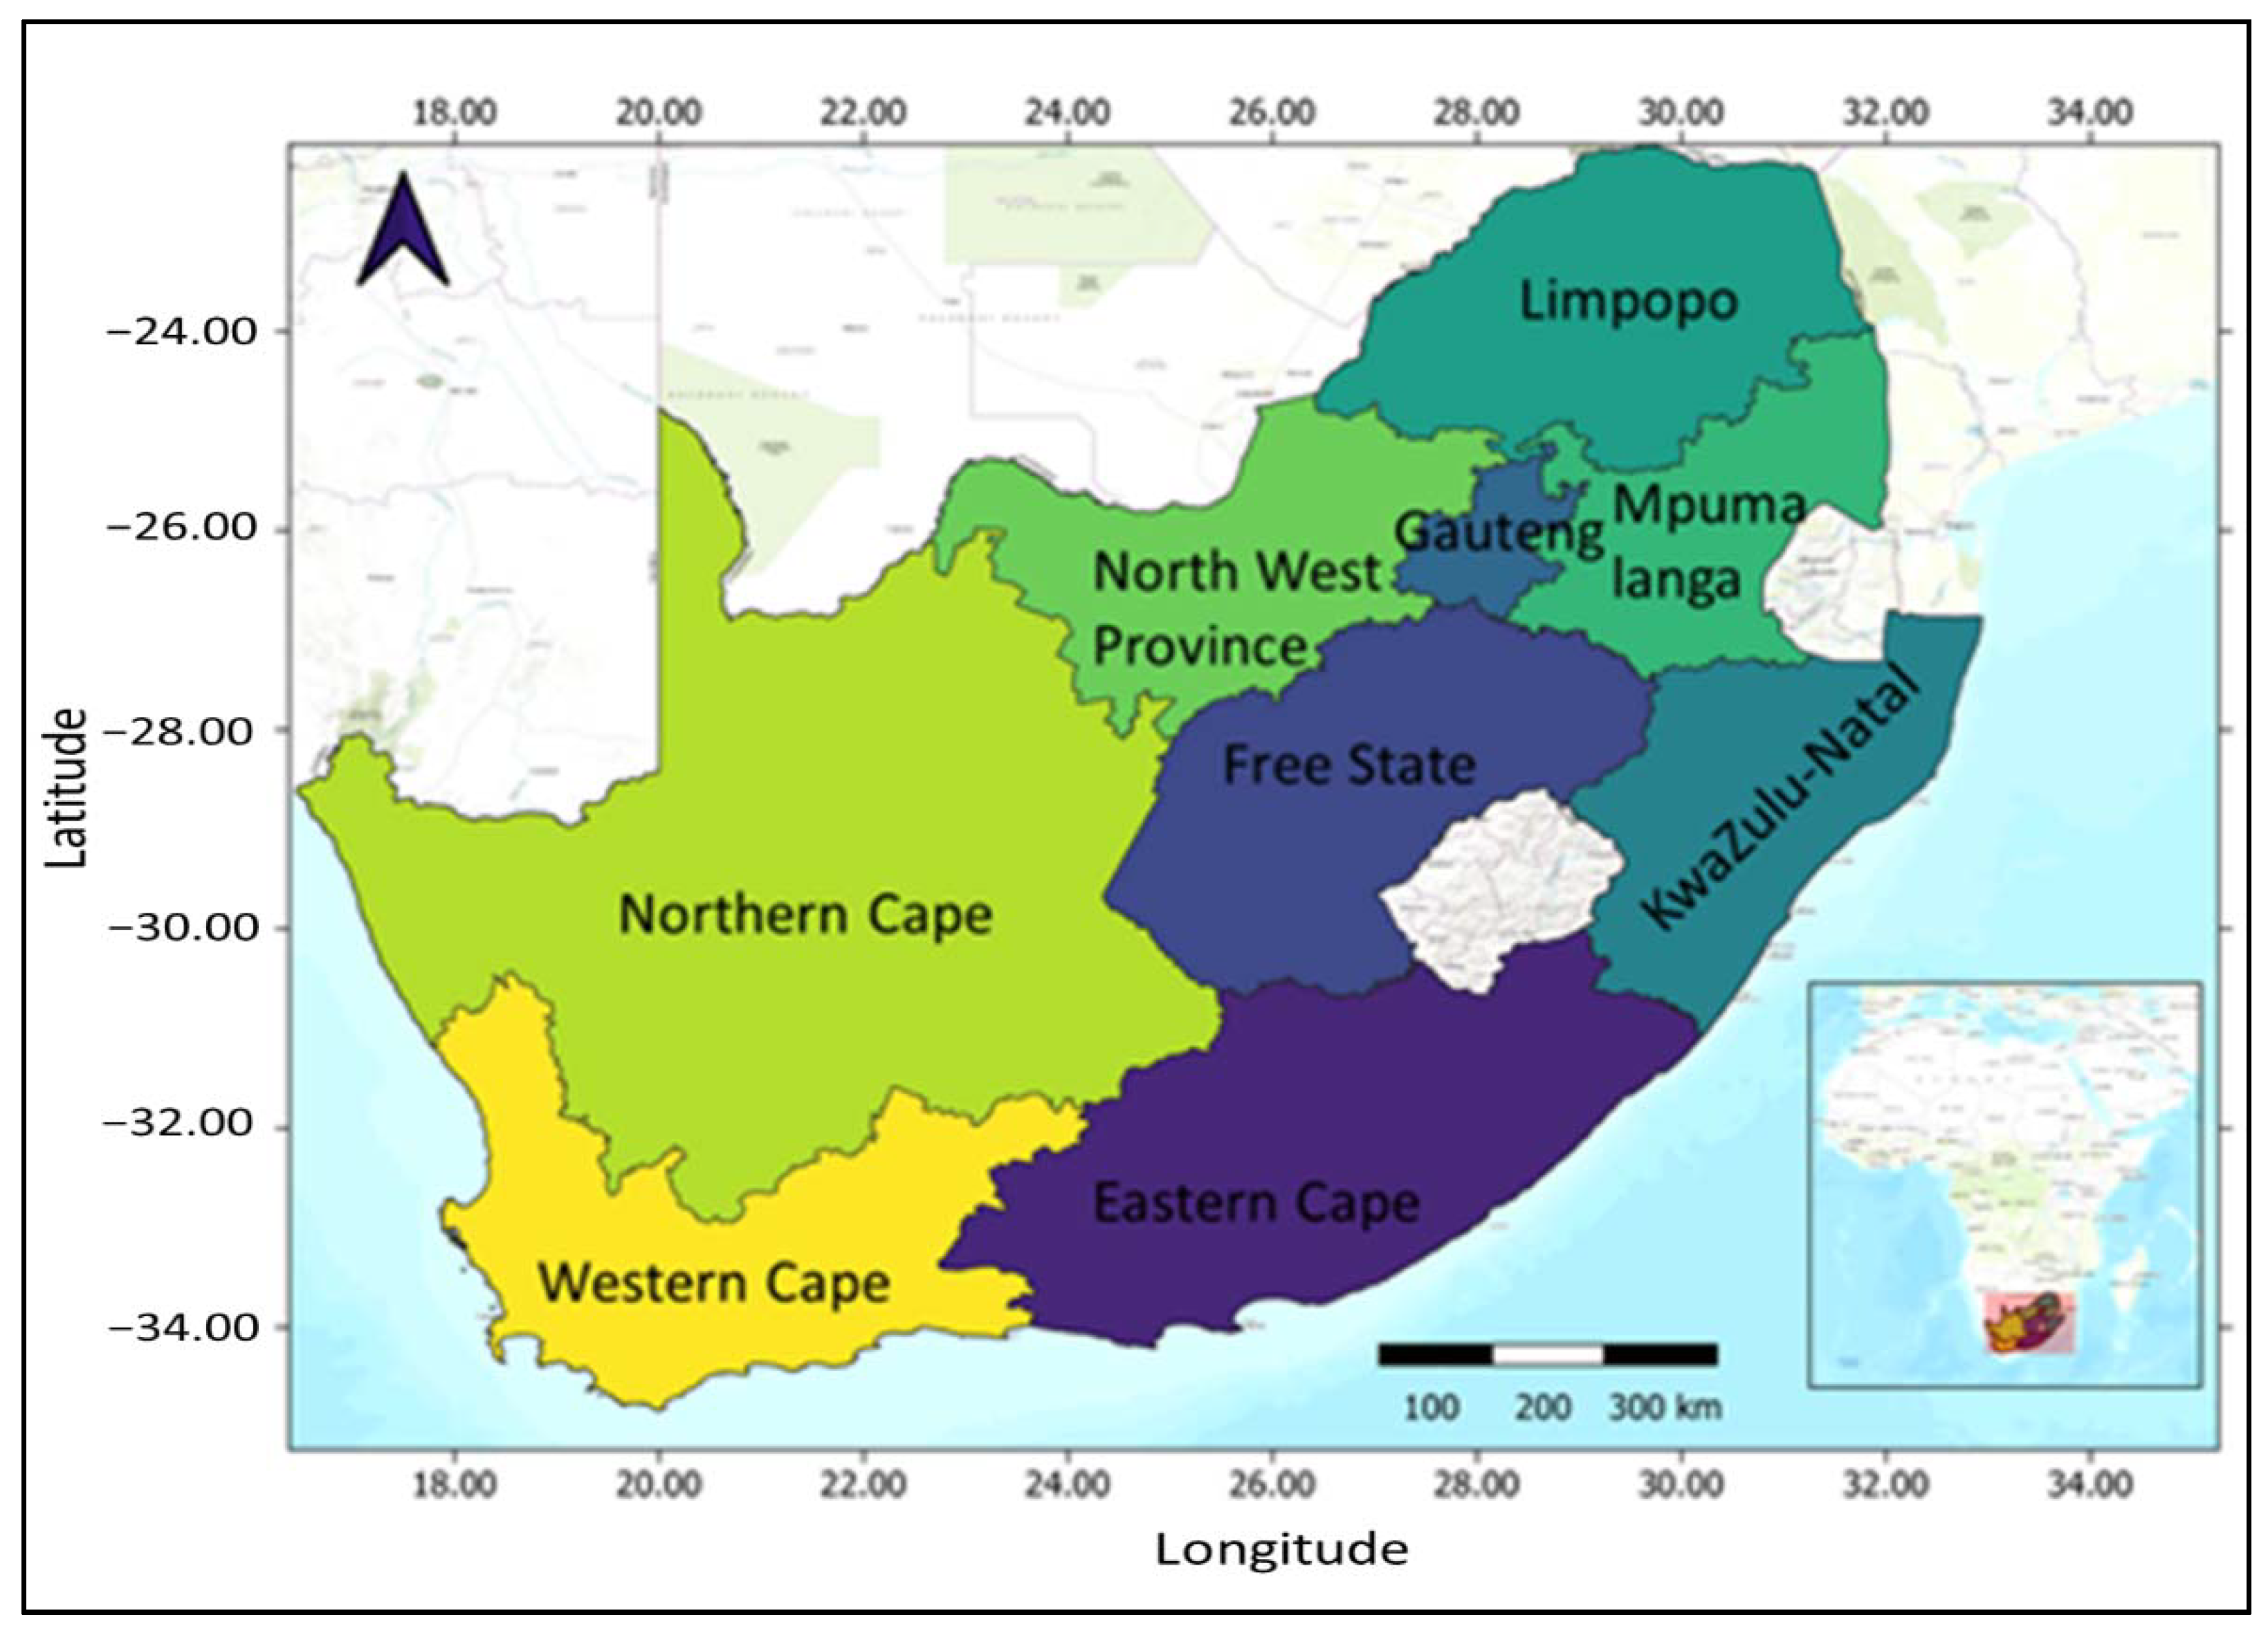
| Region of residence (province) | ||||||
| Western Cape | 204 (7.4) | 244 (10.4) | 621 (11.9) | 549 (15.4) | ||
| Eastern Cape | 569 (12.5) | 593 (14.4) | 534 (12.8) | 436 (12.9) | ||
| Northern cape | 323 (2) | 407 (2.5) | 238 (2.5) | 209 (2.2) | ||
| Free state | 401 (5.2) | 464 (6.3) | 191 (3.5) | 177 (3.5) | ||
| Kwazulu-Natal | 553 (16.1) | 710 (21.9) | 570 (19.9) | 507 (20.8) | ||
| Northwest | 530 (9.2) | 439 (6.9) | 327 (5.4) | 337 (6.5) | ||
| Gauteng | 391 (26) | 328 (22.3) | 440 (22.1) | 329 (25.1) | ||
| Mpumalanga | 534 (8.5) | 465 (8.3) | 518 (9) | 292 (6.1) | ||
| Limpopo | 722 (13.1) | 353 (6.9) | <0.001 | 388 (12.9) | 204 (7.5) | 0.001 |
| DHS 2016 | SANHANES 2012 | |||
|---|---|---|---|---|
| POR | POR | |||
| Variable | Unadjusted Mean (95% CI) DIC = 11,849.05 | Adjusted Mean (95% CI) DIC = 3586.07 | Unadjusted Mean (95% CI) DIC = 9248.18 | Adjusted Mean (95% CI) DIC = 2580.84 |
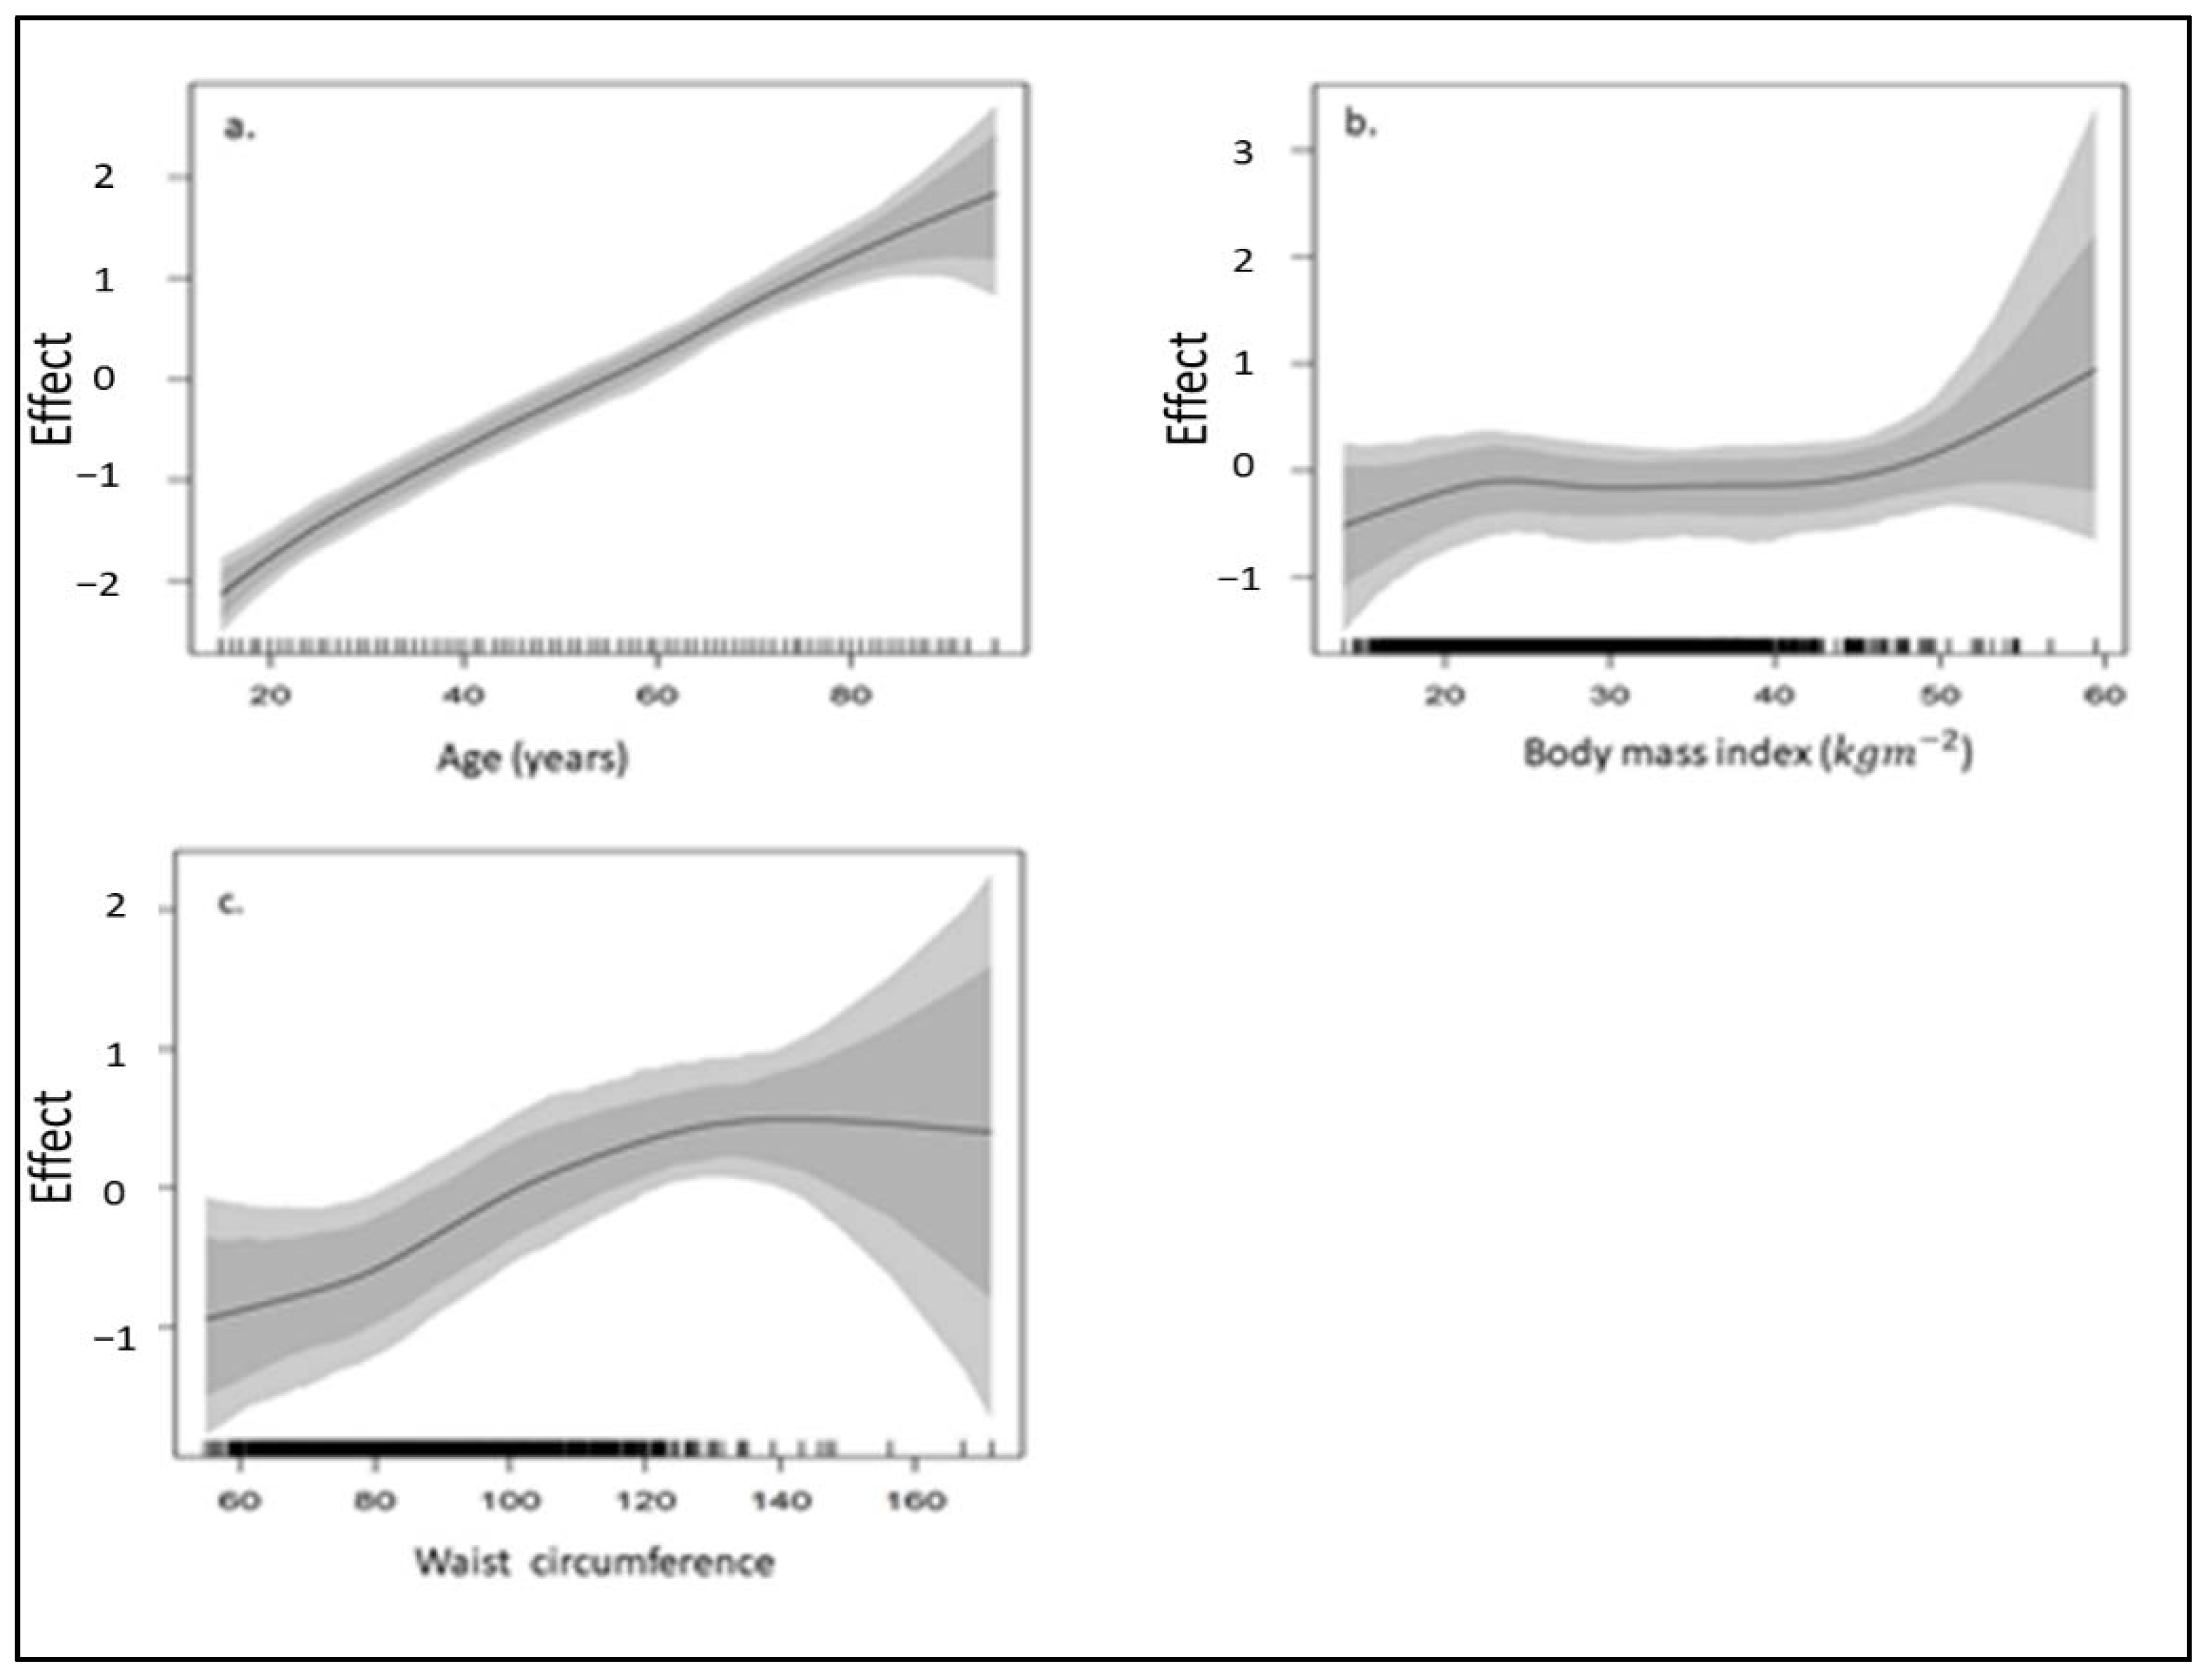
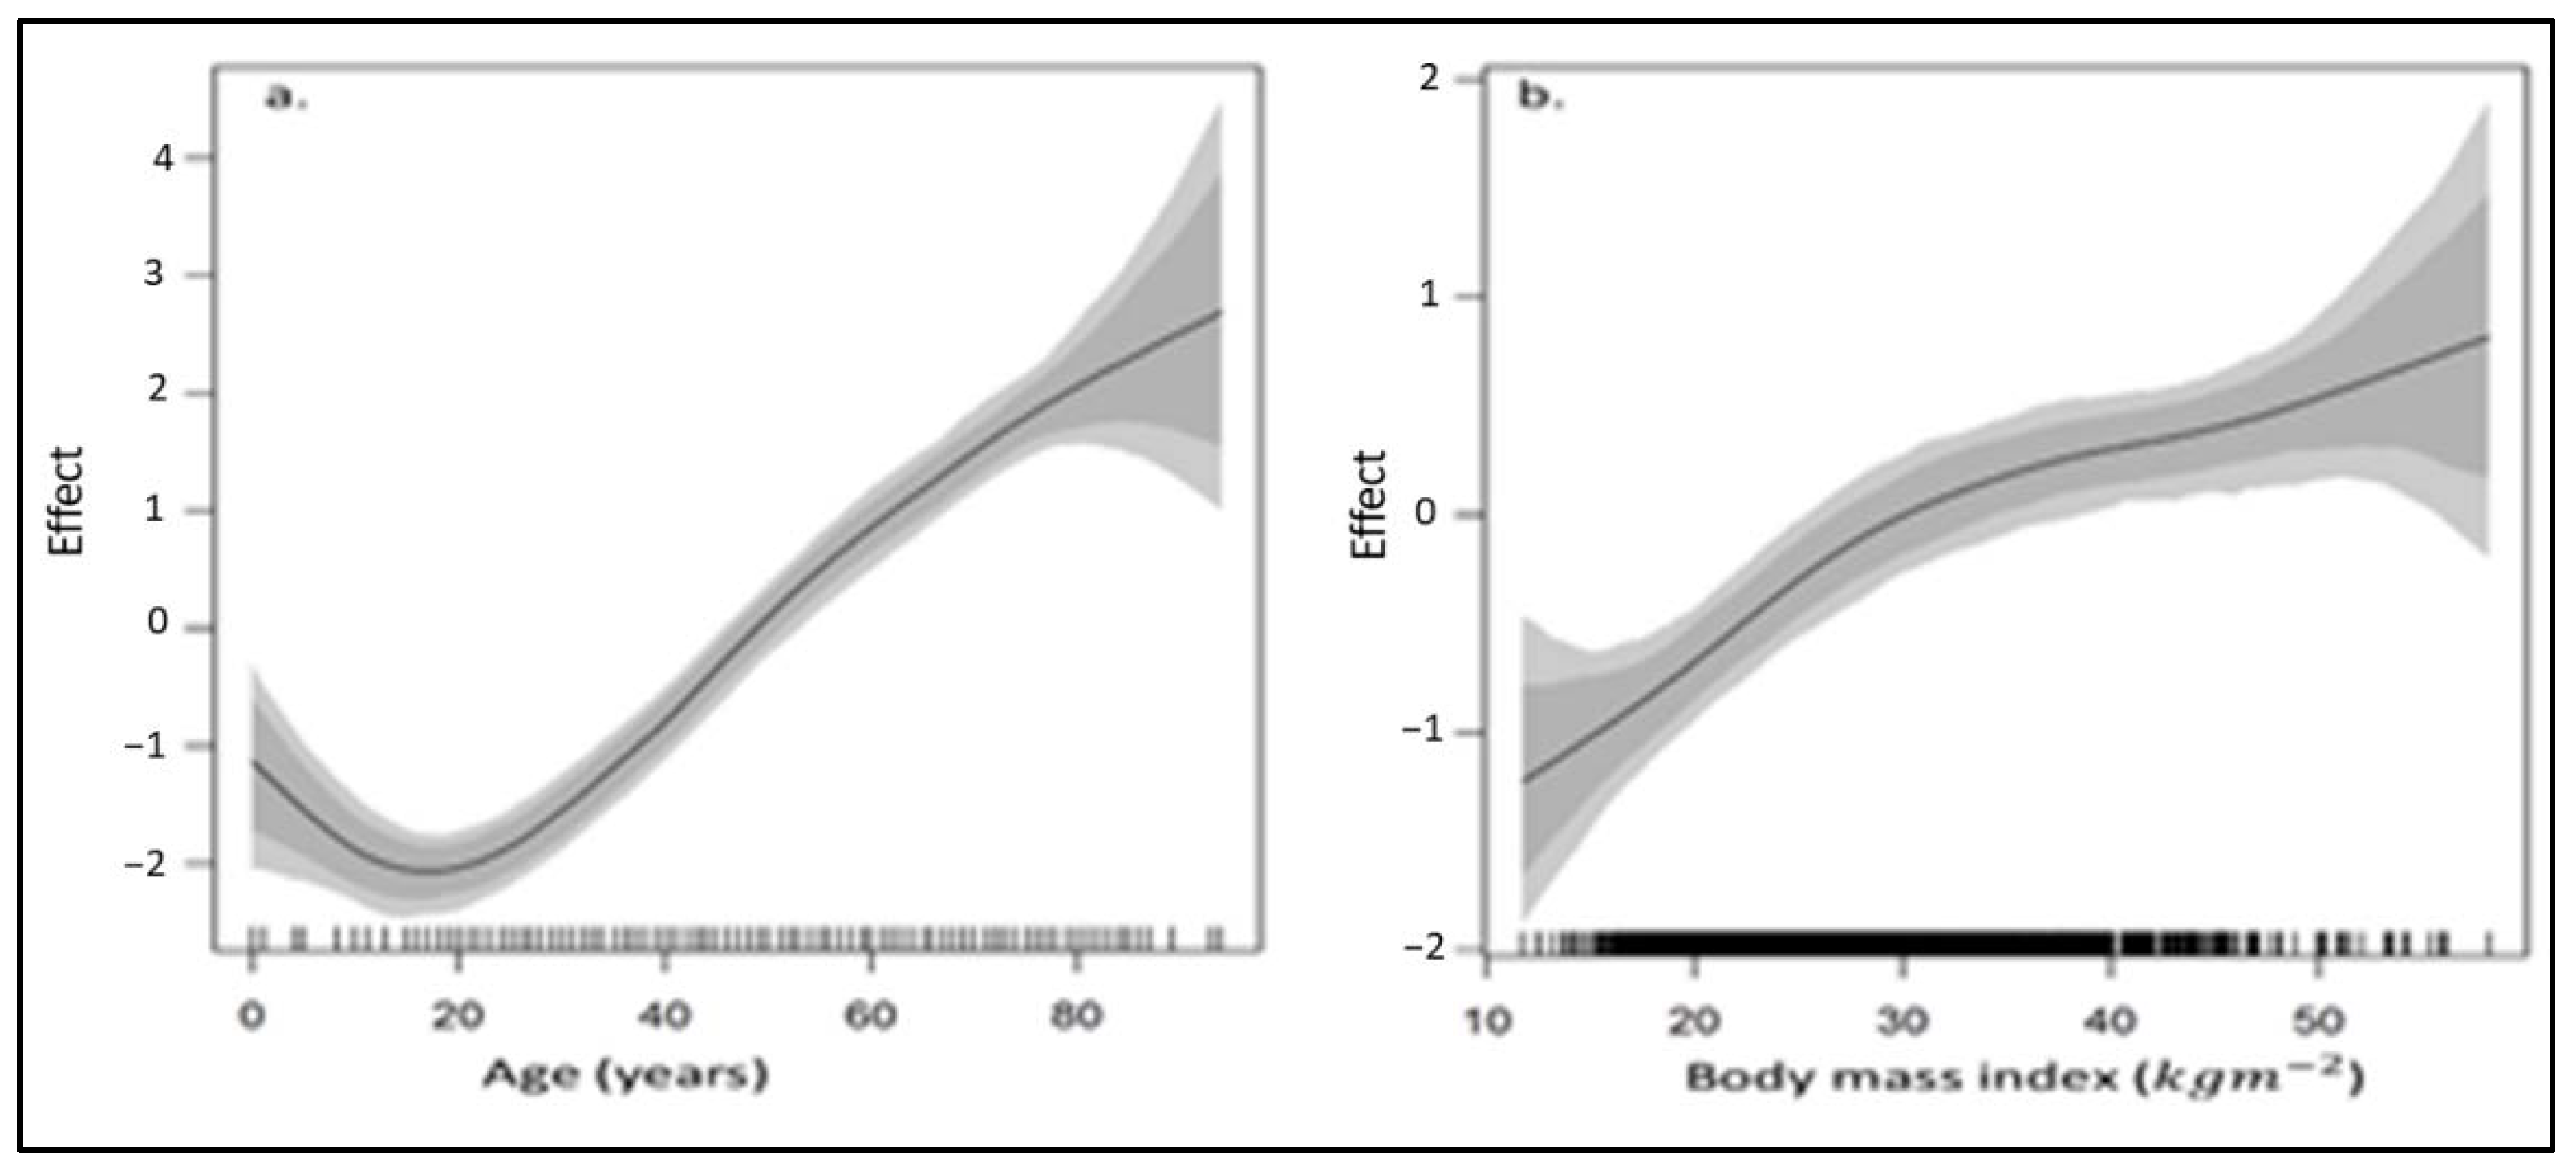
| Age | See graph (Figure 5) | See graph (Figure 6) | ||
| Sex | ||||
| Male | 1.289 (1.071, 1.569) | 1.279 (1.036, 1.563) | 1.264 (1.027, 1.560) | 1.317 (1.069, 1.625) |
| Female (ref) | 1.000 | 1.000 | 1.000 | 1.000 |
| Ethnicity | ||||
| Black/African (ref) | 1.000 | 1.000 | 1.000 | 1.000 |
| White | 1.201 (0.789, 1.728) | 1.136 (0.742, 1.716) | 0.746 (0.363, 1.442) | 0.683 (0.348, 1.323) |
| Coloured | 1.703 (1.206, 2.428) | 1.672 (1.216, 2.412) | 1.305 (0.984, 1.748) | 1.278 (0.962, 1.694) |
| Indian/Asian | 0.630 (0.251, 1.615) | 0.675 (0.263, 1.753) | 0.705 (0.423, 1.174) | 0.776 (0.484, 1.211) |
| Education | ||||
| No education | 1.235 (0.797, 1.962) | 1.312 (0.846, 2.022) | 8.917 (0.726, 747.901) | 9.241 (0.817, 328.448) |
| Primary education | 1.198 (0.849, 1.695) | 1.236 (0.879, 1.772) | 0.939 (0.603, 1.408) | 0.944 (0.611, 1.409) |
| Secondary education | 1.186 (0.906, 1.582) | 1.196 (0.886, 1.637) | 0.998 (0.679, 1.527) | 1.014 (0.671, 1.496) |
| Higher education (ref) | 1.000 | 1.000 | 1.000 | 1.000 |
| Place of residence | ||||
| Urban | 1.217 (1.005, 1.485) | 1.229 (1.016, 1.475) | 0.991 (0.789, 1.239) | 0.986 (0.786, 1.226) |
| Rural (ref) | 1.000 | 1.000 | 1.000 | 1.000 |
| Body Mass Index (kg/m2) | See graph Figure 5 | See graph (Figure 6) | ||
| <25 kg/m2 (ref) | 1.000 | |||
| 25–29.9 kg/m2 | 1.002 (0.780, 1.268) | 1.595 (1.236, 2.035) | ||
| ≥30 kg/m2 | 1.200 (0.883, 1.691) | 2.067 (1.568, 2.693) | ||
| Waist circumference (tertile) | See graph (Figure 5) | |||
| 1 (lowest) (ref) | 1.000 | 1.000 | ||
| 2 (middle) | 1.190 (0.973, 1.466) | |||
| 3 (highest) | 1.807 (1.314, 2.485) | |||
| Smoking status | ||||
| Noncurrent smoker (ref) | 1.000 | 1.000 | 1.000 | 1.000 |
| Current smoker | 1.022 (0.845, 1.232) | 1.059 (0.887, 1.279) | 1.128 (0.879, 1.447) | 1.134 (0.878, 1.461) |
| Drinking status (past 12 months) | ||||
| Noncurrent drinker (ref) | 1.000 | 1.000 | 1.000 | 1.000 |
| Current drinker | 1.148 (0.909, 1.415) | 1.148 (0.936, 1.420) | ||
| Diabetes/High sugar | ||||
| No (ref) | 1.000 | 1.000 | 1.000 | 1.000 |
| Yes | 1.407 (0.827, 2.409) | 1.309 (0.790, 2.287) | 2.097 (1.523, 2.861) | 2.066 (1.503, 2.894) |
| High blood cholesterol | ||||
| No (ref) | 1.000 | 1.000 | 1.000 | 1.000 |
| Yes | 2.113 (1.118, 4.063) | 2.017 (1.104, 4.054) | 1.650 (1.331, 2.040) | 1.634 (1.270, 2.025) |
| Heart attack or angina | ||||
| No (ref) | 1.000 | 1.000 | 1.000 | 1.000 |
| Yes | 1.202 (0.761, 2.060) | 1.198 (0.740, 1.899) | 1.121 (0.737, 1.720) | 1.226 (0.768, 1.882) |
| Stroke | ||||
| No (ref) | 1.000 | 1.000 | 1.000 | 1.000 |
| Yes | 1.021 (0.467, 2.141) | 1.070 (0.513, 2.242) | 1.739 (0.932, 3.587) | 1.744 (0.925, 3.295) |
| Region of residence (province) | See maps (Figure 3) | See maps (Figure 4) | ||
| Western cape | 1.212 (0.723, 2.011) | 1.086 (0.623, 2.108) | ||
| Eastern cape | 2.078 (1.473, 2.928) | 1.283 (0.753, 2.373) | ||
| Northern cape | 1.942 (1.333, 2.947) | 1.269 (0.689, 2.596) | ||
| Free state | 2.351 (1.591, 3.511) | 1.900 (1.040, 3.944) | ||
| KwaZulu-Natal | 3.621 (2.495, 5.318) | 1.547 (0.842, 3.028) | ||
| Northwest | 1.241 (0.890, 1.761) | 1.547 (0.852, 3.047) | ||
| Gauteng | 1.688 (1.182, 2.445) | 1.624 (0.884, 3.340) | ||
| Mpumalanga | 2.623 (1.818, 3.699) | 0.826 (0.433, 1.580) | ||
| Limpopo (Ref) | 1.00 | 1.00 | ||
Publisher’s Note: MDPI stays neutral with regard to jurisdictional claims in published maps and institutional affiliations. |
© 2021 by the authors. Licensee MDPI, Basel, Switzerland. This article is an open access article distributed under the terms and conditions of the Creative Commons Attribution (CC BY) license (https://creativecommons.org/licenses/by/4.0/).
Share and Cite
Kandala, N.-B.; Nnanatu, C.C.; Dukhi, N.; Sewpaul, R.; Davids, A.; Reddy, S.P. Mapping the Burden of Hypertension in South Africa: A Comparative Analysis of the National 2012 SANHANES and the 2016 Demographic and Health Survey. Int. J. Environ. Res. Public Health 2021, 18, 5445. https://0-doi-org.brum.beds.ac.uk/10.3390/ijerph18105445
Kandala N-B, Nnanatu CC, Dukhi N, Sewpaul R, Davids A, Reddy SP. Mapping the Burden of Hypertension in South Africa: A Comparative Analysis of the National 2012 SANHANES and the 2016 Demographic and Health Survey. International Journal of Environmental Research and Public Health. 2021; 18(10):5445. https://0-doi-org.brum.beds.ac.uk/10.3390/ijerph18105445
Chicago/Turabian StyleKandala, Ngianga-Bakwin, Chibuzor Christopher Nnanatu, Natisha Dukhi, Ronel Sewpaul, Adlai Davids, and Sasiragha Priscilla Reddy. 2021. "Mapping the Burden of Hypertension in South Africa: A Comparative Analysis of the National 2012 SANHANES and the 2016 Demographic and Health Survey" International Journal of Environmental Research and Public Health 18, no. 10: 5445. https://0-doi-org.brum.beds.ac.uk/10.3390/ijerph18105445