
Is There a Temporal Relationship between COVID-19 Infections among Prison Staff, Incarcerated Persons and the Larger Community in the United States?

 ,
,
Abstract
:1. Introduction
2. Materials and Methods
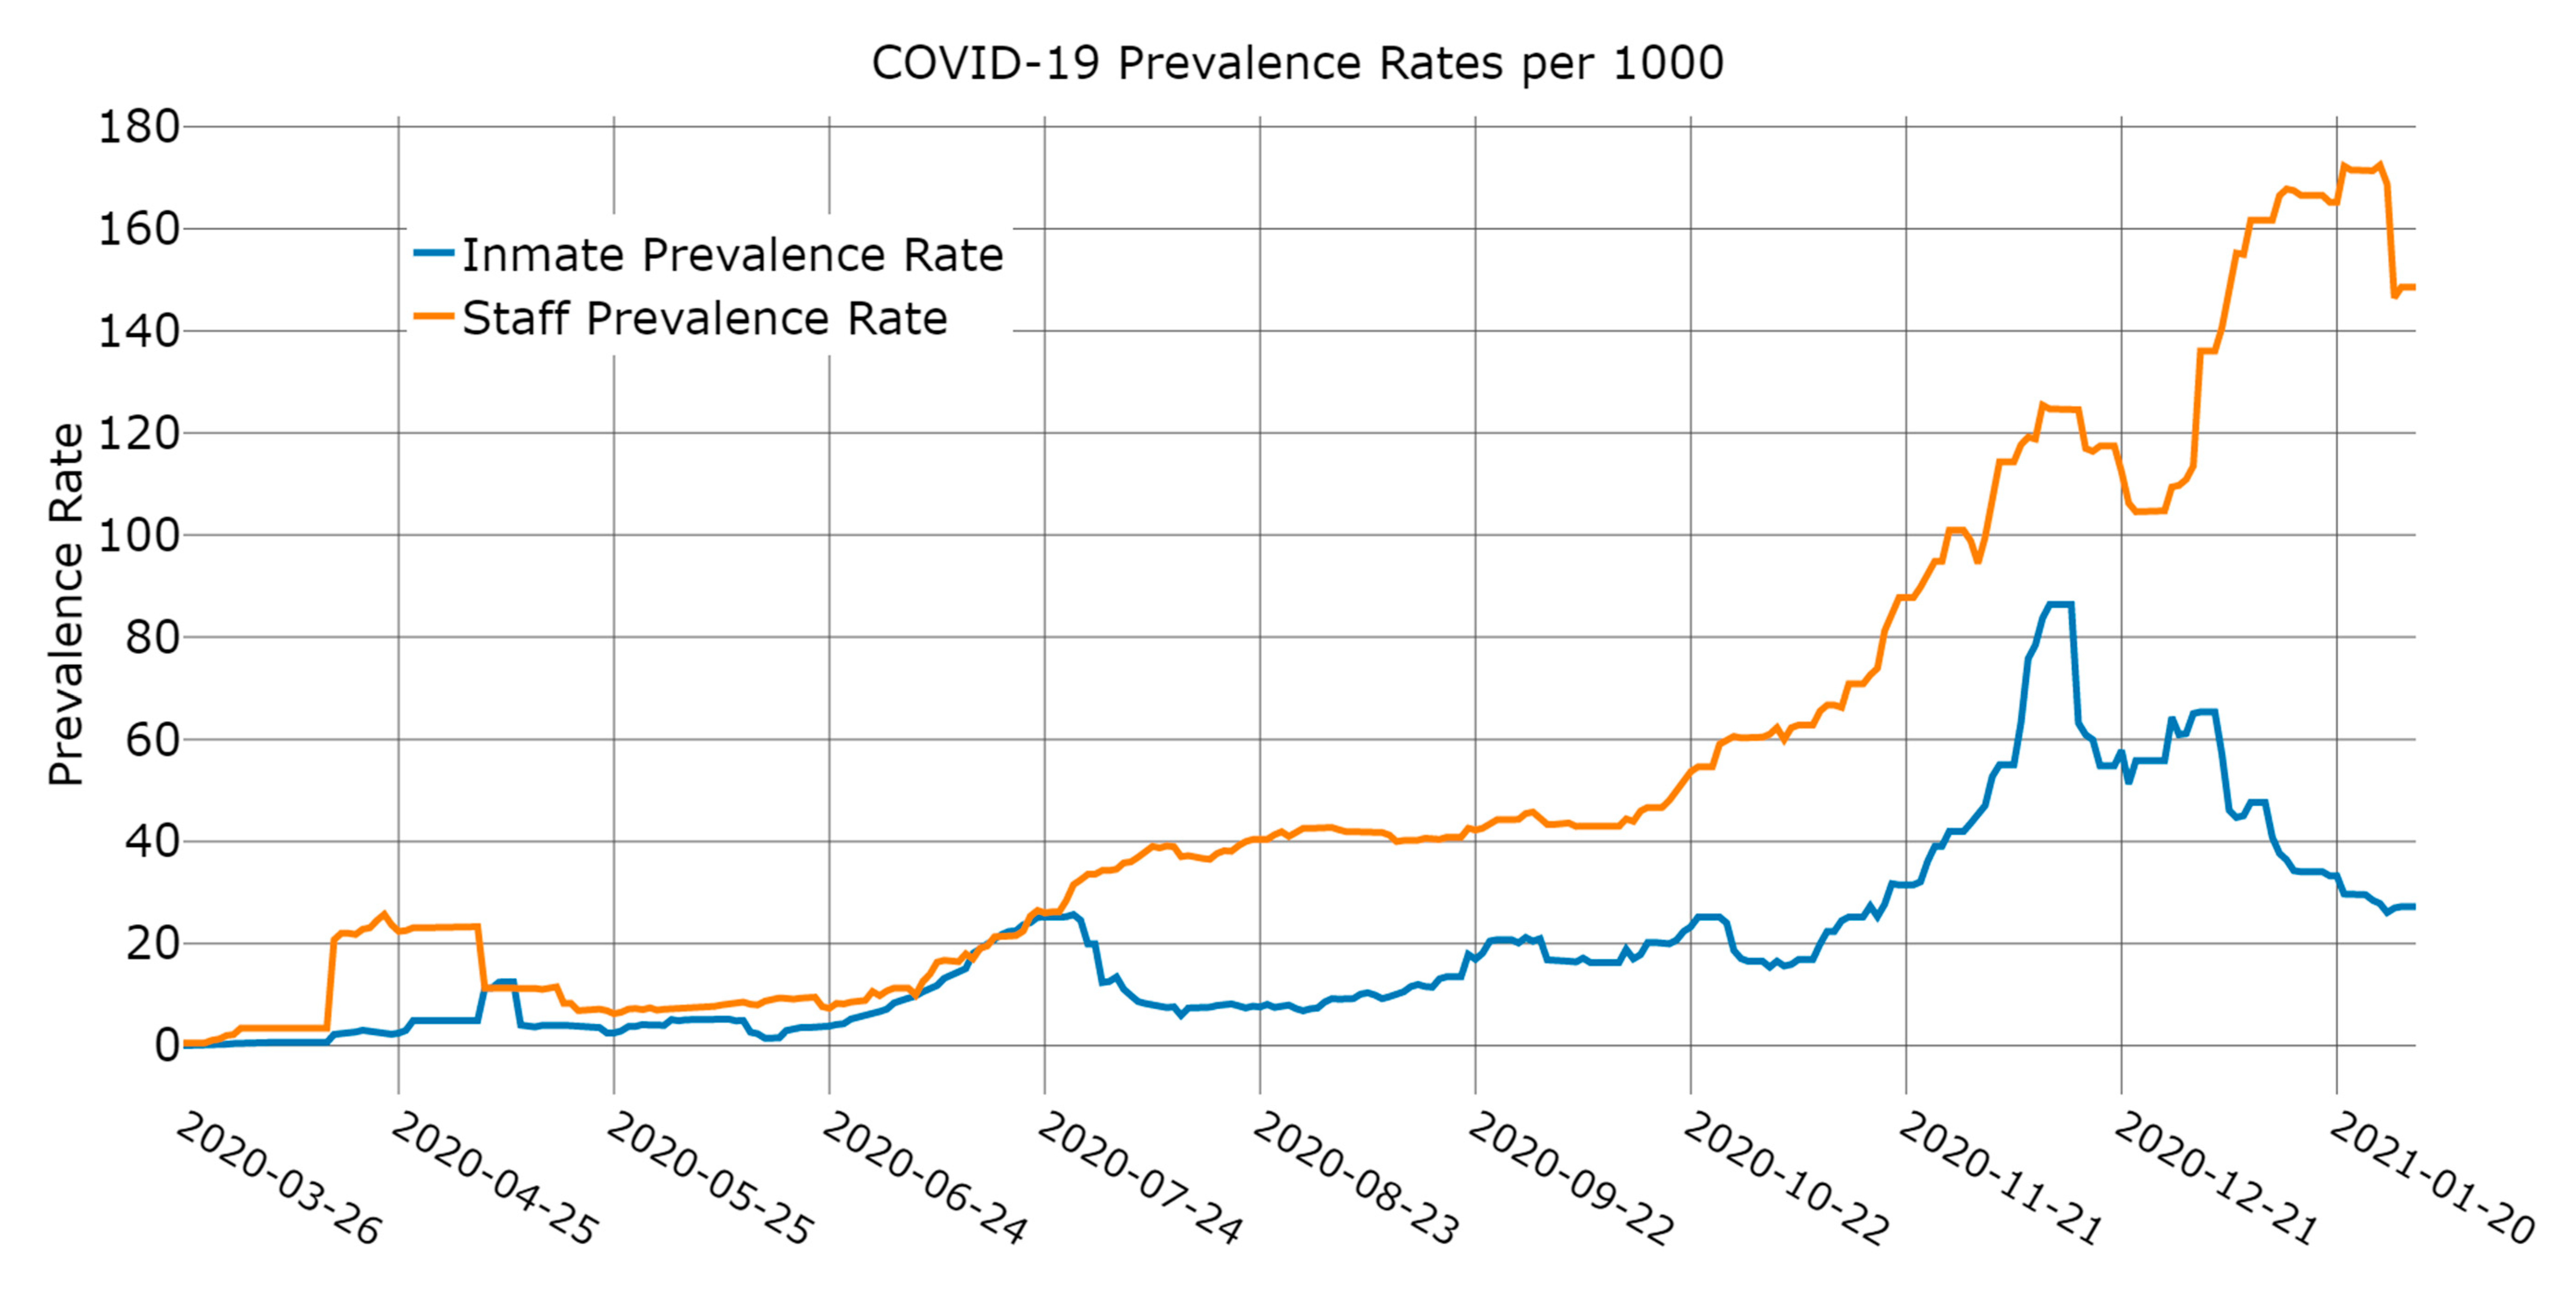
2.1. Data
2.2. Variables
2.3. Analysis Plan
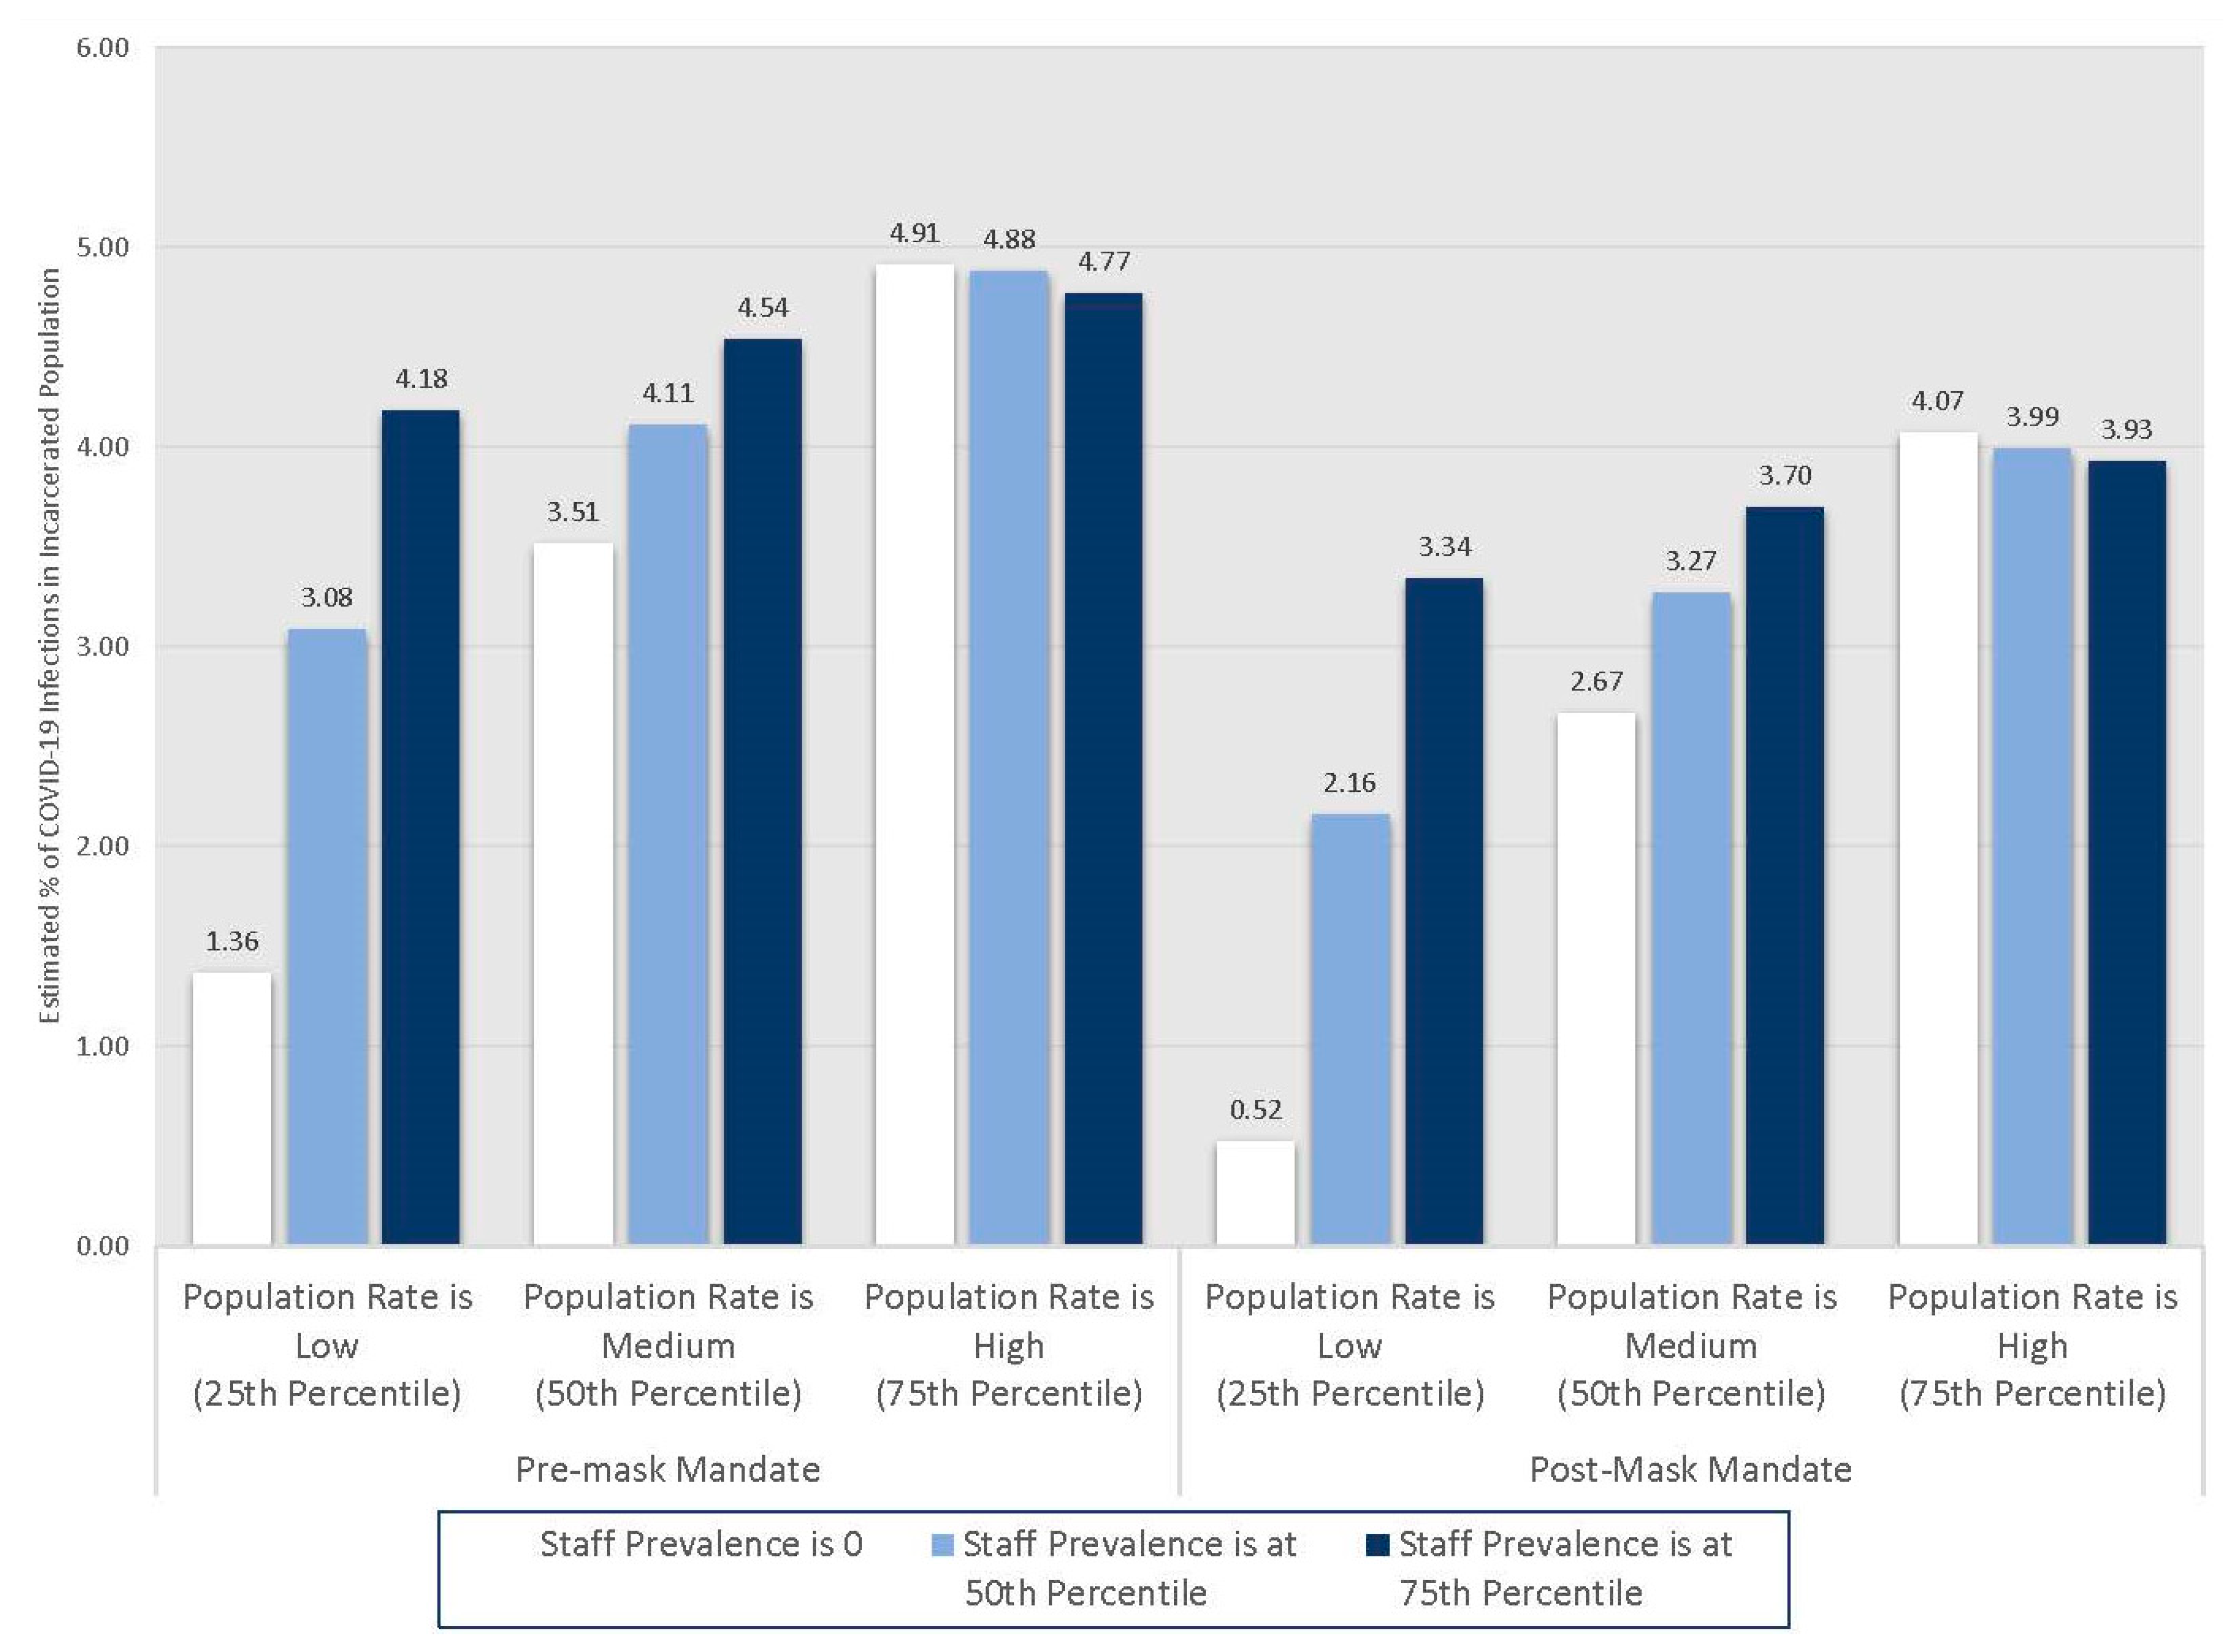
3. Results
4. Discussion
5. Conclusions
Author Contributions
Funding
Institutional Review Board Statement
Informed Consent Statement
Data Availability Statement
Conflicts of Interest
Appendix A. Population Standardized Regressions with Prison Fixed Effects Predicting the Active Cases of COVID-19 among Incarcerated Persons

| Model 1 | Model 2 | |||
| B | SE | B | SE | |
| Lagged active positive COVID-19 cases among incarcerated persons | 0.006 ** | (0.002) | 0.007 ** | (0.002) |
| Lagged and logged prevalence rate of staff COVID-19 infections (per 1000) | 0.238 ** | (0.053) | 0.776 ** | (0.097) |
| Lagged and logged incidence rate of COVID-19 cases in the county population (per 1000) | 0.656 ** | (0.185) | 1.158 ** | (0.194) |
| Lagged and logged rate of active staff COVID-19 cases per 1000 × lagged and logged rate of COVID-19 cases in the county population per 1000 | −0.240 ** | (0.034) | ||
| Homogenous policies, system-wide | −0.607 ** | (0.266) | −1.123 ** | (0.282) |
| Mask mandate instituted (24 August 2020 and beyond) | −0.469 | (0.242) | −0.842 ** | (0.244) |
| Linear time in every fourteenth day | 0.185 ** | (0.037) | 0.233 ** | (0.036) |
| Aliceville FCI | 0.541 | (0.781) | 0.511 | (0.787) |
| Ashland FCI | 0.774 | (0.704) | 0.625 | (0.725) |
| Atlanta USP | 0.793 | (0.760) | 0.370 | (0.766) |
| Atwater USP | −0.063 | (0.751) | −0.102 | (0.765) |
| Bastrop FCI | 0.692 | (0.724) | 0.823 | (0.735) |
| Beckley FCI | 1.097 | (0.687) | 0.764 | (0.713) |
| Bennettsville FCI | 0.810 | (0.761) | 0.852 | (0.770) |
| Berlin FCI | 0.716 | (0.776) | 1.173 | (0.803) |
| Big Spring FCI | 1.954 ** | (0.714) | 1.742 ** | (0.730) |
| Byran FPC | −1.269 | (0.830) | −0.830 | (0.812) |
| Big Sandy USP | −0.202 | (0.738) | −0.371 | (0.764) |
| Canaan USP | 0.965 | (0.693) | 0.748 | (0.715) |
| Cumberland FCI | 0.422 | (0.737) | 0.352 | (0.759) |
| Danbury FCI | 2.383 ** | (0.786) | 1.865 ** | (0.802) |
| Duluth FPC | 2.022 ** | (0.703) | 1.766 ** | (0.732) |
| Dublin FCI | 0.681 | (0.708) | 0.152 | (0.737) |
| Edgefield FCI | 0.673 | (0.746) | 0.385 | (0.761) |
| Elkton FCI | 3.139 ** | (0.754) | 2.600 ** | (0.765) |
| Englewood FCI | 1.197 | (0.727) | 1.188 | (0.734) |
| El Reno FCI | 0.667 | (0.725) | 0.766 | (0.737) |
| Fairton FCI | 1.900 ** | (0.805) | 1.659 ** | (0.808) |
| Fort Dix FCI | 1.518 ** | (0.754) | 1.186 | (0.754) |
| Gilmer FCI | 1.496 ** | (0.694) | 1.604 ** | (0.727) |
| Greenville FCI | 1.581 ** | (0.708) | 1.568 ** | (0.726) |
| Herlong FCI | 0.313 | (0.749) | 0.156 | (0.762) |
| Jesup FCI | 2.986 ** | (0.707) | 3.026 ** | (0.717) |
| La Tuna FCI | 0.666 | (0.763) | 1.150 | (0.771) |
| Lee USP | −0.188 | (0.729) | −0.276 | (0.750) |
| Lewisburg USP | 1.380 | (0.707) | 1.580 ** | (0.720) |
| Loretto FCI | 1.978 ** | (0.700) | 2.015 ** | (0.718) |
| Leavenworth USP | 1.035 | (0.734) | 0.997 | (0.740) |
| Manchester FCI | 1.797 ** | (0.713) | 1.605 ** | (0.730) |
| Marion USP | 2.164 ** | (0.701) | 2.199 ** | (0.713) |
| McDowell FCI | 0.189 | (0.717) | 0.052 | (0.741) |
| McKean FCI | 1.735 ** | (0.690) | 1.438 ** | (0.721) |
| McCreary USP | 0.257 | (0.716) | 0.097 | (0.741) |
| Memphis FCI | 0.475 | (0.752) | 0.478 | (0.755) |
| Mendota FCI | −1.157 | (0.799) | −1.283 | (0.808) |
| Miami FCI | 1.549 | (0.795) | 1.829 ** | (0.805) |
| Milan FCI | 1.934 ** | (0.757) | 1.455 | (0.772) |
| Montgomery FPC | −0.554 | (0.775) | −0.086 | (0.770) |
| Morgantown FCI | 0.685 | (0.726) | 0.534 | (0.741) |
| Otisville FCI | 0.984 | (0.862) | 0.691 | (0.863) |
| Oxford FCI | 2.052 ** | (0.692) | 1.906 ** | (0.710) |
| Pekin FCI | 1.255 | (0.707) | 1.330 | (0.727) |
| Pensacola FPC | −2.740 ** | (0.943) | −2.196 ** | (0.936) |
| Phoenix FCI | 0.448 | (0.753) | 0.420 | (0.761) |
| Ray Brook FCI | 1.818 ** | (0.712) | 1.742 ** | (0.742) |
| Safford FCI | 0.023 | (0.759) | 0.674 | (0.766) |
| Schuylkill FCI | 0.629 | (0.722) | −0.014 | (0.748) |
| Seagoville FCI | 2.637 ** | (0.750) | 2.186 ** | (0.758) |
| Sheridan FCI | 0.234 | (0.737) | 0.328 | (0.760) |
| Sandstone FCI | 2.144 ** | (0.686) | 2.065 ** | (0.699) |
| Tallahassee FCI | 0.588 | (0.753) | 0.855 | (0.759) |
| Talladega FCI | 1.157 | (0.743) | 1.072 | (0.751) |
| Texarkana FCI | 0.415 | (0.725) | 0.588 | (0.736) |
| Thomson USP | 1.765 ** | (0.698) | 1.879 ** | (0.712) |
| Terminal Island FCI | 4.046 ** | (0.757) | 3.550 ** | (0.765) |
| Three Rivers FCI | 2.407 ** | (0.730) | 2.174 ** | (0.735) |
| Waseca FCI | 2.178 ** | (0.715) | 2.041 ** | (0.728) |
| Williamsburg FCI | −1.032 | (0.791) | −0.772 | (0.787) |
| Yankton FPC | −0.685 | (0.829) | 0.527 | (0.811) |
| lnalpha | 1.105 ** | (0.050) | 1.056 ** | (0.050) |
| Constant | −9.579 ** | (0.621) | −10.156 ** | (0.648) |
| Observations | 1260 | 1260 | ||
References
- Kaplan, K. Super-spreading wedding party demonstrates COVID-19 risk posed by holiday gatherings. Los Angeles Times. 2 November 2020. Available online: https://www.latimes.com/science/story/2020-11-12/covid-19-spread-at-thanksgiving-holiday-gatherings-could-be-like-maine-wedding (accessed on 13 November 2020).
- Stockford, G. York County Jail Says Maine CDC Has Released the Jail from COVID-19 Outbreak Status. News Center Maine. 23 October 2020. Available online: https://www.newscentermaine.com/article/news/health/coronavirus/york-county-jail-says-maine-cdc-has-released-the-jail-from-covid-19-outbreak-status/97-54e8c050-f031-4581-a7fe-85cc8a4676ad (accessed on 13 November 2020).
- Lambert, L.A.; Armstrong, L.R.; Lobato, M.N.; Ho, C.; France, A.M.; Haddad, M.B. Tuberculosis in jails and prisons: United States, 2002–2013. Am. J. Public Health 2016, 106, 2231–2237. [Google Scholar] [CrossRef]
- Beckman, A.L.; Bilinski, A.; Boyko, R.; Camp, G.M.; Wall, A.T.; Lim, J.K.; Wang, E.A.; Bruce, R.D.; Gonsalves, G.S. New hepatitis C drugs are very costly and unavailable to many state prisoners. Health Aff. 2016, 35, 1893–1901. [Google Scholar] [CrossRef]
- Spaulding, A.C.; Adee, M.G.; Lawrence, R.T.; Chhatwal, J.; von Oehsen, W. Five Questions Concerning Managing Hepatitis C in the Justice System: Finding Practical Solutions for Hepatitis C Virus Elimination. Infect. Dis. Clin. N. Am. 2018, 32, 323–345. [Google Scholar] [CrossRef] [PubMed]
- Fifield, J. Many States Face Dire Shortage of Prison Guards. Stateline. 2016. Available online: https://www.pewtrusts.org/en/research-and-analysis/blogs/stateline/2016/03/01/many-states-face-dire-shortage-of-prison-guards (accessed on 28 November 2020).
- U.S. Department of Justice Office of the Inspector General. Remote Inspection of Federal Correctional Complex Lompoc; U.S. Department of Justice Office of the Inspector General: Washington, DC, USA, 2020.
- Cloud, D.H.; Ahalt, C.; Augustine, D.; Sears, D.; Williams, B. Medical Isolation and Solitary Confinement: Balancing Health and Humanity in US Jails and Prisons During COVID-19. J. Gen. Intern. Med. 2020, 35, 2738–2742. [Google Scholar] [CrossRef]
- Brown v. Plata; Supreme Court of the United States; 563 U.S.; 2011. Available online: https://www.supremecourt.gov/opinions/10pdf/09-1233.pdf (accessed on 28 November 2020).
- Sabol, W.J.; West, H.C.; Cooper, M. Prisoners in 2008; Bureau of Justice Statistics: Washington, DC, USA, 2009. [Google Scholar]
- Thomas, E.G.; Spittal, M.J.; Taxman, F.S.; Kinner, S.A. Health-related factors predict return to custody in a large cohort of ex-prisoners: New approaches to predicting re-incarceration. Health Justice 2011, 3, 10. [Google Scholar] [CrossRef] [Green Version]
- Wallace, D.; Wang, X. Does in-prison physical and mental health impact recidivism? SSM Popul. Health 2020, 11, 100569. [Google Scholar] [CrossRef]
- Link, N.W.; Ward, J.T.; Stansfield, R. Consequences of mental and physical health for reentry and recidivism: Toward a health-based model of desistance*. Criminology 2019, 57, 544–573. [Google Scholar] [CrossRef]
- Wallace, D.; Fahmy, C.; Cotton, L.; Jimmons, C.; McKay, R.; Stoffer, S.; Syed, S. Examining the Role of Familial Support During Prison and After Release on Post-Incarceration Mental Health. Int. J. Offender Ther. Comp. Criminol. 2016, 60, 3–20. [Google Scholar] [CrossRef] [Green Version]
- Massoglia, M.; Pridemore, W.A. Incarceration and health. Annu. Rev. Sociol. 2015, 41, 291–310. [Google Scholar] [CrossRef] [PubMed]
- Massoglia, M. Incarceration as exposure: The prison, infectious disease, and other stress-related illnesses. J. Health Soc. Behav. 2008, 49, 56–71. [Google Scholar] [CrossRef]
- Rosen, D.L.; Wohl, D.A.; Schoenbach, V.J. All-cause and cause-specific mortality among Black and White North Carolina state prisoners, 1995–2005. Ann. Epidemiol. 2011, 21, 719–726. [Google Scholar] [CrossRef] [Green Version]
- Schnittker, J.; John, A. Enduring stigma: The long-term effects of incarceration on health. J. Health Soc. Behav. 2007, 48, 115–130. [Google Scholar] [CrossRef]
- Kinner, S.A.; Young, J.T.; Snow, K.; Southalan, L.; Lopez-AcuÃ, D.; Ferreira-Borges, C. Prisons and custodial settings are part of a comprehensive response to COVID-19. Lancet Public Health 2020, 5, e188–e189. [Google Scholar] [CrossRef]
- Wallace, M.; Hagan, L.; Curran, K.G.; Williams, S.P.; Handanagic, S.; Bjork, A.; Davidson, S.L.; Lawrence, R.T.; McLaughlin, J.; Butterfield, M.; et al. COVID-19 in Correctional and Detention Facilities—United States, February–April 2020. MMWR. Morb. Mortal. Wkly. Rep. 2020, 69, 587–590. [Google Scholar] [CrossRef]
- Federal Bureau of Prisons COVID-19 Operating Plan. Available online: https://www.bop.gov/coronavirus/covid19_status.jsp (accessed on 28 November 2020).
- Matevousian, A.; Griffith, L. Mandatory Use of Face Coverings for BOP Staff; US Department of Justice, Federal Bureau of Prisons: Washington, DC, USA, 2020.
- Osgood, D.W. Poisson-Based Regression Analysis of Aggregate Crime Rates. J. Quant. Criminol. 2000, 16, 21–43. [Google Scholar] [CrossRef]
- Byrne, A.W.; McEvoy, D.; Collins, A.B.; Hunt, K.; Casey, M.; Barber, A.; Butler, F.; Griffin, J.; Lane, E.A.; McAloon, C.; et al. Inferred duration of infectious period of SARS-CoV-2: Rapid scoping review and analysis of available evidence for asymptomatic and symptomatic COVID-19 cases. BMJ Open 2020, 10, e39856. [Google Scholar] [CrossRef] [PubMed]
- Geys, H.; Molenberghs, G.; Ryan, L.M. Generalized estimating equations. In Topics in Modelling of Clustered Data; CRC Press: Boca Raton, FL, USA, 2002; Volume 49, pp. 77–87. ISBN 9781420035889. [Google Scholar]
- Allison, P.D.; Waterman, R.P. Fixed-effects negative binomial regression models. Sociol. Methodol. 2002, 32, 247–265. [Google Scholar] [CrossRef] [Green Version]
- Allison, P.D. Beware of Software for Fixed Effects Negative Binomial Regression. Available online: https://statisticalhorizons.com/fe-nbreg (accessed on 2 February 2021).
- Allison, P.D. Fixed Effect Regression Models; Sage Publications: Thousand Oaks, CA, USA, 2009. [Google Scholar]
- Phillips, P.C.B.; Park, J.Y. On the Formulation of Wald Tests of Nonlinear Restrictions. Econometrica 1988, 56, 1065. [Google Scholar] [CrossRef]
- Lofgren, E.; Lum, K.; Horowitz, A.; Madubuonwu, B.; Myers, K.; Fefferman, N.H. The Epidemiological Implications of Incarceration Dynamics in Jails for Community, Corrections Officer, and Incarcerated Population Risks from COVID-19. MedRxiv 2020. [Google Scholar] [CrossRef] [Green Version]
- Bick, J.A. Infection Control in Jails and Prisons. Clin. Infect. Dis. 2007, 45, 1047–1055. [Google Scholar] [CrossRef] [Green Version]
- Montoya-Barthelemy, A.G.; Lee, C.D.; Cundiff, D.R.; Smith, E.B. COVID-19 and the Correctional Environment: The American Prison as a Focal Point for Public Health. Am. J. Prev. Med. 2020, 58, 888–891. [Google Scholar] [CrossRef]
- Rowe, M. Prison Food Service Programs Juggle Inmate Feeding in the Coronavirus Era. Food Manage. 30 July 2020. Available online: https://www.food-management.com/business-industry/prison-food-service-programs-juggle-inmate-feeding-coronavirus-era (accessed on 28 November 2020).
- Akiyama, M.J.; Spaulding, A.C.; Rich, J.D. Flattening the Curve for Incarcerated Populations—Covid-19 in Jails and Prisons. N. Engl. J. Med. 2020, 382, 2075–2077. [Google Scholar] [CrossRef]
- Novisky, M.A.; Narvey, C.S.; Semenza, D.C. Institutional Responses to the COVID-19 Pandemic in American Prisons. Vict. Offenders 2020, 15, 1244–1261. [Google Scholar] [CrossRef]
- Surprenant, C. COVID-19 and Pretrial Detention. SSRN Electron. J. 2020. [Google Scholar] [CrossRef]
- Hummer, D. United States Bureau of Prisons’ Response to the COVID-19 Pandemic. Vict. Offenders 2020, 15, 1262–1276. [Google Scholar] [CrossRef]
- Liang, M.; Gao, L.; Cheng, C.; Zhou, Q.; Uy, J.P.; Heiner, K.; Sun, C. Efficacy of face mask in preventing respiratory virus transmission: A systematic review and meta-analysis. Travel Med. Infect. Dis. 2020, 36, 101751. [Google Scholar] [CrossRef] [PubMed]
- Jayaweera, M.; Perera, H.; Gunawardana, B.; Manatunge, J. Transmission of COVID-19 virus by droplets and aerosols: A critical review on the unresolved dichotomy. Environ. Res. 2020, 188, 109819. [Google Scholar] [CrossRef]
- Widra, E.; Herring, T. Half of states fail to require mask use by correctional staff. Prison Policy Initiative. 14 August 2020. Available online: https://www.prisonpolicy.org/blog/2020/08/14/masks-in-prisons/ (accessed on 28 November 2020).
- South Dakota Department of Corrections. SDDOC Coronavirus Information; South Dakota Department of Corrections: Pierre, SD, USA, 2021. [Google Scholar]
- State of Nevada Department of Corrections. NDOC COVID-19 UPDATES; State of Nevada Department of Corrections: Carson City, NV, USA, 2021. [Google Scholar]
- Pyrooz, D.C.; Labrecque, R.M.; Tostlebe, J.J.; Useem, B. Views on COVID-19 from Inside Prison: Perspectives of High-security Prisoners. Justice Eval. J. 2020, 3, 294–306. [Google Scholar] [CrossRef]
- Vaughan, D. THE DARK SIDE OF ORGANIZATIONS: Mistake, Misconduct, and Disaster. Annu. Rev. Sociol. 1999, 25, 271–305. [Google Scholar] [CrossRef]
- Vaughan, D. The Challenger Launch Decision: Risky Technology, Culture, and Deviance at NASA; University of Chicago Press: Chicago, IL, USA, 1996. [Google Scholar]
- Burruss, G.W.; Jaynes, C.M.; Moule, R.K.; Fairchild, R.E. Modeling Individual Defiance of COVID-19 Pandemic Mitigation Strategies: Insights From the Expanded Model of Deterrence and Protection Motivation Theory. Crim. Justice Behav. 2021, 1–22. [Google Scholar] [CrossRef]


| Mean | Median | Standard Deviation | Minimum | Maximum | |
|---|---|---|---|---|---|
| Active positive COVID-19 cases among incarcerated persons | 17.82 | 1.00 | 63.71 | 0 | 1039 |
| Population of incarcerated persons | 968.27 | 929.00 | 373.02 | 177 | 2762 |
| Prevalence rate of staff COVID-19 infections (per 1000) | 41.49 | 10.32 | 68.20 | 0.00 | 461.29 |
| Incidence rate of COVID-19 cases in the county population (per 1000) | 18.45 | 8.74 | 22.24 | 0.00 | 153.44 |
| Homogenous policies, system-wide | 0.81 | - | - | 0 | 1 |
| mask mandate instituted (24 August 2020 and beyond) | 0.52 | - | - | 0 | 1 |
| Linear time in every fourteenth day | 10.00 | 10.00 | 6.06 | 0 | 20 |
| Model 1 | Model 2 | |
|---|---|---|
| Lagged active positive COVID-19 cases among incarcerated persons | 0.006 ** | 0.007 ** |
| (0.002) | (0.002) | |
| Lagged and logged prevalence rate of staff COVID-19 infections (per 1000) | 0.238 ** | 0.776 ** |
| (0.053) | (0.097) | |
| Lagged and logged incidence rate of COVID-19 cases in the county population (per 1000) | 0.656 ** | 1.158 ** |
| (0.185) | (0.194) | |
| Lagged and logged rate of active staff COVID-19 cases per 1000 × lagged and logged rate of COVID-19 cases in the county population per 1000 | - | −0.240 ** |
| - | (0.034) | |
| Homogenous policies, system-wide | −0.607 ** | −1.123 ** |
| (0.266) | (0.282) | |
| Mask mandate instituted (24 August 2020 and beyond) | −0.469 | −0.842 ** |
| (0.242) | (0.244) | |
| Linear time in every fourteenth day | 0.185 ** | 0.233 ** |
| (0.037) | (0.036) | |
| Lnalpha | 1.105 ** | 1.056 ** |
| (0.050) | (0.050) | |
| Constant | −9.579 ** | −10.156 ** |
| (0.621) | (0.648) | |
| Observations | 1260 | 1260 |
Publisher’s Note: MDPI stays neutral with regard to jurisdictional claims in published maps and institutional affiliations. |
© 2021 by the authors. Licensee MDPI, Basel, Switzerland. This article is an open access article distributed under the terms and conditions of the Creative Commons Attribution (CC BY) license (https://creativecommons.org/licenses/by/4.0/).
Share and Cite
Wallace, D.; Eason, J.M.; Walker, J.; Towers, S.; Grubesic, T.H.; Nelson, J.R. Is There a Temporal Relationship between COVID-19 Infections among Prison Staff, Incarcerated Persons and the Larger Community in the United States? Int. J. Environ. Res. Public Health 2021, 18, 6873. https://0-doi-org.brum.beds.ac.uk/10.3390/ijerph18136873
Wallace D, Eason JM, Walker J, Towers S, Grubesic TH, Nelson JR. Is There a Temporal Relationship between COVID-19 Infections among Prison Staff, Incarcerated Persons and the Larger Community in the United States? International Journal of Environmental Research and Public Health. 2021; 18(13):6873. https://0-doi-org.brum.beds.ac.uk/10.3390/ijerph18136873
Chicago/Turabian StyleWallace, Danielle, John M. Eason, Jason Walker, Sherry Towers, Tony H. Grubesic, and Jake R. Nelson. 2021. "Is There a Temporal Relationship between COVID-19 Infections among Prison Staff, Incarcerated Persons and the Larger Community in the United States?" International Journal of Environmental Research and Public Health 18, no. 13: 6873. https://0-doi-org.brum.beds.ac.uk/10.3390/ijerph18136873