
Myostatin/Appendicular Skeletal Muscle Mass (ASM) Ratio, Not Myostatin, Is Associated with Low Handgrip Strength in Community-Dwelling Older Women

 , , and
Abstract
:1. Introduction
2. Materials and Methods
2.1. Study Design and Data Collection
2.2. GFR Estimation
- (1)
- By serum creatinine:
- (2)
- By serum cystatin C:
2.3. Body Composition Measurements
2.4. Muscle Strength Measurement
2.5. Physical Performance
2.6. Definition of Sarcopenia
2.7. Myostatin/ASM Ratio
2.8. Statistical Analyses
3. Results
3.1. Baseline Characteristics of the Participants
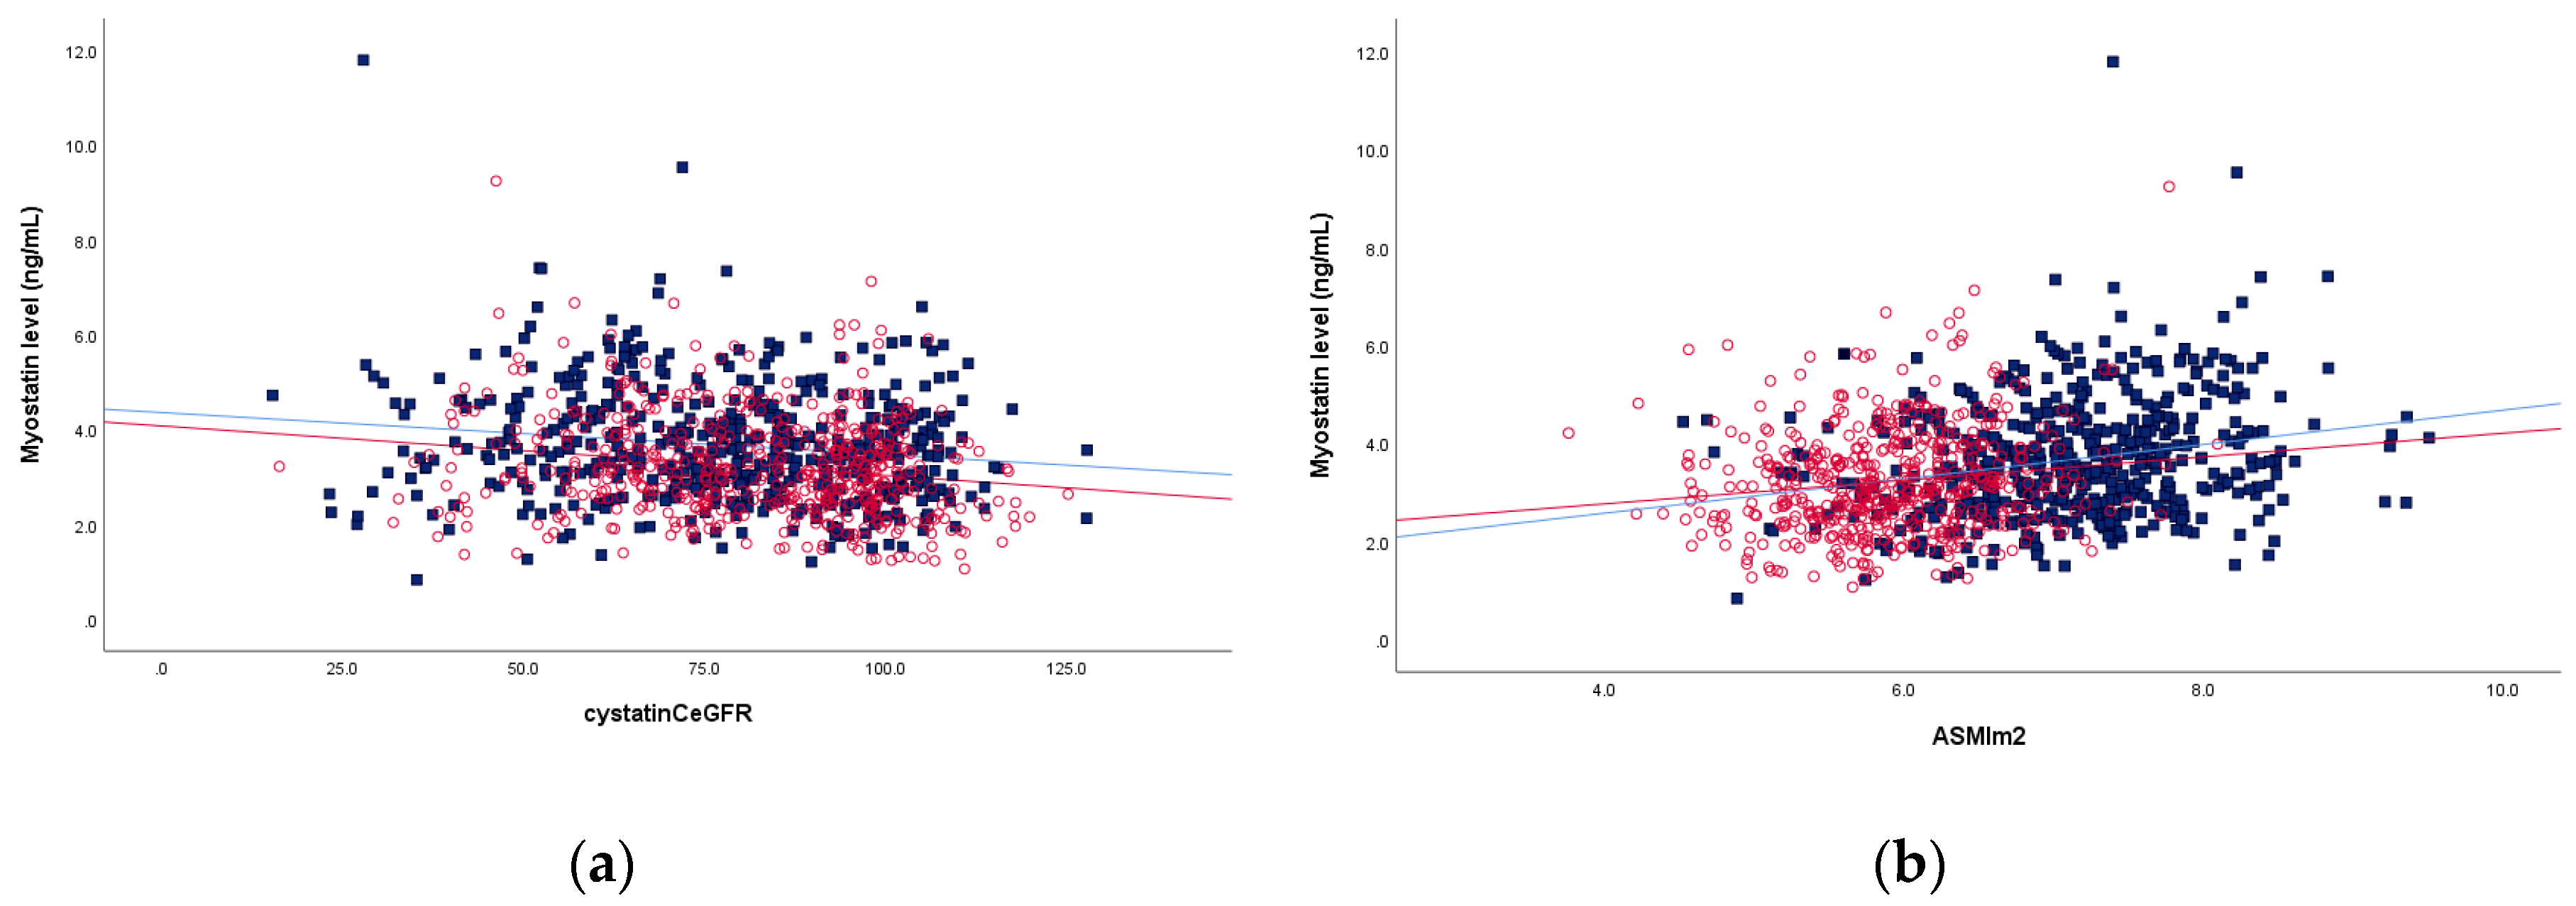
3.2. Related Factors of Serum Myostatin Level
3.3. Comparison of Sarcopenia According to Myostatin Level
3.4. Comparison of Characteristics According to Myostatin/ASM Ratio Quartile
4. Discussion
5. Conclusions
Supplementary Materials
Author Contributions
Funding
Institutional Review Board Statement
Informed Consent Statement
Data Availability Statement
Acknowledgments
Conflicts of Interest
References
- Verzola, D.; Milanesi, S.; Bertolotto, M.; Garibaldi, S.; Villaggio, B.; Brunelli, C.; Balbi, M.; Ameri, P.; Montecucco, F.; Palombo, D.; et al. Myostatin mediates abdominal aortic atherosclerosis progression by inducing vascular smooth muscle cell dysfunction and monocyte recruitment. Sci. Rep. 2017, 7, 46362. [Google Scholar] [CrossRef] [PubMed]
- Hu, S.L.; Chang, A.C.; Huang, C.C.; Tsai, C.H.; Lin, C.C.; Tang, C.H. Myostatin promotes interleukin-1beta expression in rheumatoid arthritis synovial fibroblasts through inhibition of miR-21-5p. Front. Immunol. 2017, 8, 1747. [Google Scholar] [CrossRef] [Green Version]
- McPherron, A.C.; Lawler, A.M.; Lee, S.J. Regulation of skeletal muscle mass in mice by a new TGF-beta superfamily member. Nature 1997, 387, 83–90. [Google Scholar] [CrossRef] [PubMed]
- Verzola, D.; Procopio, V.; Sofia, A.; Villaggio, B.; Tarroni, A.; Bonanni, A.; Mannucci, I.; De Cian, F.; Gianetta, E.; Saffioti, S.; et al. Apoptosis and myostatin mRNA are upregulated in the skeletal muscle of patients with chronic kidney disease. Kidney Int. 2011, 79, 773–782. [Google Scholar] [CrossRef] [PubMed] [Green Version]
- Breitbart, A.; Auger-Messier, M.; Molkentin, J.; Heineke, J. Myostatin from the heart: Local and systemic actions in cardiac failure and muscle wasting. Am. J. Physiol. Heart Circ. Physiol. 2011, 300, H1973–H1982. [Google Scholar] [CrossRef] [PubMed]
- White, T.A.; LeBrasseur, N.K. Myostatin and sarcopenia: Opportunities and challenges—A mini-review. Gerontology 2014, 60, 289–293. [Google Scholar] [CrossRef]
- Arrieta, H.; Hervás, G.; Pardo, C.R.; Ruiz-Litago, F.; Iturburu, M.; Yanguas, J.J.; Gil, S.M.; Rodriguez-Larrad, A.; Irazusta, J. Serum myostatin levels are higher in fitter, more active, and non-frail long-term nursing home residents and increase after a physical exercise intervention. Gerontology 2019, 65, 229–239. [Google Scholar] [CrossRef]
- Zhou, Y.; Hellberg, M.; Hellmark, T.; Höglund, P.; Clyne, N. Muscle mass and plasma myostatin after exercise training: A substudy of Renal Exercise (RENEXC)-a randomized controlled trial. Nephrol. Dial. Transplant. 2021, 36, 95–103. [Google Scholar] [CrossRef] [Green Version]
- Bergen, H.R., 3rd; Farr, J.N.; Vanderboom, P.M.; Atkinson, E.J.; White, T.A.; Singh, R.J.; Khosla, S.; LeBrasseur, N.K. Myostatin as a mediator of sarcopenia versus homeostatic regulator of muscle mass: Insights using a new mass spectrometry-based assay. Skelet. Muscle 2015, 5, 21. [Google Scholar] [CrossRef] [Green Version]
- Yamada, S.; Tsuruya, K.; Yoshida, H.; Tokumoto, M.; Ueki, K.; Ooboshi, H.; Kitazono, T. Factors associated with the serum myostatin level in patients undergoing peritoneal dialysis: Potential effects of skeletal muscle mass and Vitamin D receptor activator use. Calcif. Tissue Int. 2016, 99, 13–22. [Google Scholar] [CrossRef]
- Peng, L.N.; Lee, W.J.; Liu, L.K.; Lin, M.H.; Chen, L.K. Healthy community-living older men differ from women in associations between myostatin levels and skeletal muscle mass. J. Cachexia Sarcopenia Muscle 2018, 9, 635–642. [Google Scholar] [CrossRef]
- Schafer, M.J.; Atkinson, E.J.; Vanderboom, P.M.; Kotajarvi, B.; White, T.A.; Moore, M.M.; Bruce, C.J.; Greason, K.L.; Suri, R.M.; Khosla, S.; et al. Quantification of GDF11 and myostatin in human aging and cardiovascular disease. Cell Metab. 2016, 23, 1207–1215. [Google Scholar] [CrossRef] [Green Version]
- Seo, M.-W.; Jung, S.-W.; Kim, S.-W.; Jung, H.C.; Kim, D.-Y.; Song, J.K. Comparisons of muscle quality and muscle growth factor between sarcopenic and non-sarcopenic older women. Int. J. Environ. Res. Public Health 2020, 17, 6581. [Google Scholar] [CrossRef] [PubMed]
- Won, C.W.; Lee, S.; Kim, J.; Chon, D.; Kim, S.; Kim, C.-O.; Kim, M.K.; Cho, B.; Choi, K.M.; Roh, E.; et al. Korean frailty and aging cohort study (KFACS): Cohort profile. BMJ Open 2020, 10, e035573. [Google Scholar] [CrossRef] [Green Version]
- Won, C.W.; Lee, Y.; Choi, J.; Kim, K.W.; Park, Y.; Park, H.; Oh, I.-H.; Ga, H.; Kim, Y.S.; Jang, H.C.; et al. Starting Construction of Frailty Cohort for Elderly and Intervention Study. Ann. Geriatr. Med. Res. 2016, 20, 114–117. [Google Scholar] [CrossRef]
- Levey, A.S.; Stevens, L.A.; Schmid, C.H.; Zhang, Y.L.; Castro, A.F., 3rd; Feldman, H.I.; Kusek, J.W.; Eggers, P.; Van Lente, F.; Greene, T.; et al. A new equation to estimate glomerular filtration rate. Ann. Intern. Med. 2009, 150, 604–612. [Google Scholar] [CrossRef] [PubMed]
- Inker, L.A.; Schmid, C.; Tighiouart, H.; Eckfeldt, J.H.; Feldman, H.I.; Greene, T.; Kusek, J.W.; Manzi, J.; Van Lente, F.; Zhang, Y.L.; et al. Estimating glomerular filtration rate from serum creatinine and cystatin C. N. Engl. J. Med. 2012, 367, 20–29. [Google Scholar] [CrossRef] [PubMed] [Green Version]
- Cawthon, P.M.; Peters, K.W.; Shardell, M.D.; McLean, R.R.; Dam, T.-T.L.; Kenny, A.M.; Fragala, M.S.; Harris, T.B.; Kiel, D.; Guralnik, J.M.; et al. Cutpoints for low appendicular lean mass that identify older adults with clinically significant weakness. J. Gerontol. A Biol. Sci. Med. Sci. 2014, 69, 567–575. [Google Scholar] [CrossRef] [PubMed] [Green Version]
- Baumgartner, R.N.; Koehler, K.M.; Gallagher, D.; Romero, L.; Heymsfield, S.B.; Ross, R.R.; Garry, P.J.; Lindeman, R.D. Epidemiology of sarcopenia among the elderly in New Mexico. Am. J. Epidemiol. 1998, 147, 755–763. [Google Scholar] [CrossRef]
- Kim, M.; Jeong, M.J.; Yoo, J.; Song, D.Y.; Won, C.W. Calf circumference as a screening tool for cognitive frailty in community-dwelling older adults: The Korean Frailty and Aging Cohort Study (KFACS). J. Clin. Med. 2018, 7, 332. [Google Scholar] [CrossRef] [PubMed] [Green Version]
- Lauretani, F.; Russo, C.R.; Bandinelli, S.; Bartali, B.; Cavazzini, C.; Di Iorio, A.; Corsi, A.M.; Rantanen, T.; Guralnik, J.M.; Ferrucci, L. Age-associated changes in skeletal muscles and their effect on mobility: An operational diagnosis of sarcopenia. J. Appl. Physiol. 2003, 95, 1851–1860. [Google Scholar] [CrossRef] [PubMed]
- Chen, L.-K.; Woo, J.; Assantachai, P.; Auyeung, T.-W.; Chou, M.-Y.; Iijima, K.; Jang, H.C.; Kang, L.; Kim, M.; Kim, S.; et al. Asian working group for sarcopenia: 2019 consensus update on sarcopenia diagnosis and treatment. J. Am. Med. Dir. Assoc. 2020, 21, 300–307.e2. [Google Scholar] [CrossRef] [PubMed]
- Yano, S.; Nagai, A.; Isomura, M.; Yamasaki, M.; Kijima, T.; Takeda, M.; Hamano, T.; Nabika, T. Relationship between blood myostatin levels and kidney function:shimane CoHRE study. PLoS ONE 2015, 10, e0141035. [Google Scholar] [CrossRef] [PubMed]
- Lee, S.M.; Kim, S.E.; Lee, J.Y.; Jeong, H.J.; Son, Y.K.; An, W.S. Serum myostatin levels are associated with abdominal aortic calcification in dialysis patients. Kidney Res. Clin. Pract. 2019, 38, 481–489. [Google Scholar] [CrossRef] [Green Version]
- Delanaye, P.; Bataille, S.; Quinonez, K.; Buckinx, F.; Warling, X.; Krzesinski, J.-M.; Pottel, H.; Burtey, S.; Bruyère, O.; Cavalier, E. Myostatin and insulin-like growth factor 1 are biomarkers of muscle strength, muscle mass, and mortality in patients on hemodialysis. J. Ren. Nutr. 2019, 29, 511–520. [Google Scholar] [CrossRef] [PubMed]
- Fife, E.; Kostka, J.; Kroc, Ł.; Guligowska, A.; Pigłowska, M.; Sołtysik, B.; Kaufman-Szymczyk, A.; Fabianowska-Majewska, K.; Kostka, T. Relationship of muscle function to circulating myostatin, follistatin and GDF11 in older women and men. BMC Geriatr. 2018, 18, 200. [Google Scholar] [CrossRef]
- Verzola, D.; Barisione, C.; Picciotto, D.; Garibotto, G.; Koppe, L. Emerging role of myostatin and its inhibition in the setting of chronic kidney disease. Kidney Int. 2019, 95, 506–517. [Google Scholar] [CrossRef]
- Koyun, D.; Nergizoglu, G.; Kir, K.M. Evaluation of the relationship between muscle mass and serum myostatin levels in chronic hemodialysis patients. Saudi. J. Kidney Dis. Transpl. 2018, 29, 809–815. [Google Scholar] [CrossRef]
- Han, D.S.; Chen, Y.M.; Lin, S.Y.; Chang, H.H.; Huang, T.M.; Chi, Y.C.; Yang, W.S. Serum myostatin levels and grip strength in normal subjects and patients on maintenance haemodialysis. Clin. Endocrinol. 2011, 75, 857–863. [Google Scholar] [CrossRef]
- Shad, B.J.; Thompson, J.; Holwerda, A.M.; Stocks, B.; Elhassan, Y.; Philp, A.; van Loon, L.J.; Wallis, G.A. One week of step reduction lowers myofibrillar protein synthesis rates in young men. Med. Sci. Sports Exerc. 2019, 51, 2125–2134. [Google Scholar] [CrossRef]
- Zhang, L.; Pan, J.; Dong, Y.; Tweardy, D.J.; Dong, Y.; Garibotto, G.; Mitch, W.E. Stat3 activation links a C/EBPdelta to myostatin pathway to stimulate loss of muscle mass. Cell Metab. 2013, 18, 368–379. [Google Scholar] [CrossRef] [PubMed] [Green Version]
- Wang, D.-T.; Yang, Y.-J.; Huang, R.-H.; Zhang, Z.-H.; Lin, X. Myostatin activates the ubiquitin-proteasome and autophagy-lysosome systems contributing to muscle wasting in chronic kidney disease. Oxid. Med. Cell. Longev. 2015, 2015, 684965. [Google Scholar] [CrossRef] [Green Version]
- Wang, B.-W.; Chang, H.; Kuan, P.; Shyu, K.-G. Angiotensin II activates myostatin expression in cultured rat neonatal cardiomyocytes via p38 MAP kinase and myocyte enhance factor 2 pathway. J. Endocrinol. 2008, 197, 85–93. [Google Scholar] [CrossRef] [PubMed]
- Wang, R.; Jiao, H.; Zhao, J.; Wang, X.; Lin, H. Glucocorticoids enhance muscle proteolysis through a myostatin-dependent pathway at the early stage. PLoS ONE 2016, 11, e0156225. [Google Scholar] [CrossRef] [PubMed]
- Kang, S.H.; Lee, H.S.; Lee, S.; Cho, J.-H.; Kim, J.C. Comparison of muscle mass indices using computed tomography or dual X-ray absorptiometry for predicting physical performance in hemodialysis patients. Kidney Blood Press. Res. 2017, 42, 1119–1127. [Google Scholar] [CrossRef] [PubMed]
- Skladany, L.; Koller, T.; Molcan, P.; Vnencakova, J.; Zilincan, M.; Jancekova, D.; Kukla, M.; Skladany, L.; Koller, T.; Molcan, P.; et al. Prognostic usefulness of serum myostatin in advanced chronic liver disease: Its relation to gender and correlation with inflammatory status. J. Physiol. Pharmacol. 2019, 70, 3. [Google Scholar]
- Wallner, C.; Wagner, J.M.; Dittfeld, S.; Drysch, M.; Lehnhardt, M.; Behr, B. Myostatin serum concentration as an indicator for deviated muscle metabolism in severe burn injuries. Scand. J. Surg. 2019, 108, 297–304. [Google Scholar] [CrossRef]
- Åkerfeldt, T.; Helmersson-Karlqvist, J.; Gunningberg, L.; Swenne, C.L.; Larsson, A. Postsurgical acute phase reaction is associated with decreased levels of circulating myostatin. Inflammation 2015, 38, 1727–1730. [Google Scholar] [CrossRef]
- Zhao, C.; Shao, Y.; Lin, C.; Zeng, C.; Fang, H.; Pan, J.; Cai, D. Myostatin serum concentrations are correlated with the severity of knee osteoarthritis. J. Clin. Lab. Anal. 2017, 31, e22094. [Google Scholar] [CrossRef]
- Baczek, J.; Silkiewicz, M.; Wojszel, Z.B. Myostatin as a biomarker of muscle wasting and other pathologies-state of the art and knowledge gaps. Nutrients 2020, 12, 2401. [Google Scholar] [CrossRef]
- Arrieta, H.; Rodriguez-Larrad, A.; Irazusta, J. Myostatin as a biomarker for diagnosis or prognosis of frailty and sarcopenia: Current knowledge. Gerontology 2019, 65, 385–386. [Google Scholar] [CrossRef] [PubMed]


| Variables | Men | p-Value | Women | p-Value | ||||||
|---|---|---|---|---|---|---|---|---|---|---|
| Q1 (<2.6 ng/mL) | Q2 (2.6–3.3 ng/mL) | Q3 (3.3–4.1 ng/mL) | Q4 (>4.1 ng/mL) | Q1 (<2.6 ng/mL) | Q2 (2.6–3.3 ng/mL) | Q3 (3.3–4.1 ng/mL) | Q4 (>4.1 ng/mL) | |||
| (n = 100) | (n = 117) | (n = 137) | (n = 165) | (n = 163) | (n = 146) | (n = 127) | (n = 98) | |||
| Age, years | 76.3 ± 3.6 | 76.2 ± 3.8 | 76 ± 3.9 | 76.4 ± 3.8 | 0.820 | 75.1 ± 3.9 | 75.6 ± 3.8 | 75 ± 3.9 | 75.9 ± 4.2 | 0.343 |
| BMI, kg/m2 | 22.9 ± 2.8 | 23.9 ± 2.9 | 23.5 ± 2.7 | 23.9 ± 2.9 | 0.024 | 24.8 ± 3.1 | 24.9 ± 2.8 | 24.6 ± 3 | 25 ± 2.7 | 0.835 |
| Smoker, n (%) | 79 (79.0) | 93 (79.5) | 105 (76.6) | 119 (72.1) | 0.447 | 7 (4.3) | 1 (0.7) | 7 (5.5) | 3 (3.1) | 0.140 |
| Drinker, n (%) | 93 (93.0) | 8 (6.8) | 13 (9.5) | 15 (9.1) | 0.815 | 100 (61.6) | 86 (58.9) | 81 (63.8) | 65 (66.3) | 0.667 |
| Diabetes mellitus, n (%) | 25 (25.0) | 27 (231) | 33 (24.1) | 35 (21.2) | 0.894 | 45 (27.6) | 31 (21.2) | 20 (15.7) | 18 (18.4) | 0.082 |
| Hypertension, n (%) | 48 (48) | 65 (55.6) | 67 (48.9) | 75 (45.5) | 0.411 | 95 (58.3) | 82 (56.2) | 72 (56.7) | 56 (57.1) | 0.985 |
| Osteoporosis, n (%) | 2 (2) | 3 (2.56) | 4 (2.92) | 6 (3.64) | 0.884 | 31 (19.0) | 39 (26.7) | 31 (24.4) | 15 (15.3) | 0.124 |
| At least one medication, n (%) | 80 (80) | 98 (83.76) | 116 (84.67) | 124 (75.15) | 0.148 | 141 (86.5) | 123 (84.25) | 105 (82.68) | 83 (84.69) | 0.842 |
| Albumin, g/dL | 4.3 ± 0.3 | 4.3 ± 0.2 | 4.3 ± 0.2 | 4.3 ± 0.2 | 0.741 | 4.3 ± 0.3 | 4.3 ± 0.2 | 4.3 ± 0.2 | 4.3 ± 0.2 | 0.373 |
| Creatinine, mg/dL | 0.92 ± 0.21 | 0.93 ± 0.22 | 0.95 ± 0.20 | 1.02 ± 0.31 | 0.003 | 0.71 ± 0.19 | 0.71 ± 0.17 | 0.70 ± 0.17 | 0.75 ± 0.16 | 0.195 |
| Cystatin C, ng/mL | 0.98 ± 0.31 | 0.98 ± 0.28 | 0.97 ± 0.23 | 1.05 ± 0.33 | 0.023 | 0.85 ± 0.24 | 0.89 ± 0.26 | 0.87 ± 0.20 | 0.95 ± 0.21 | 0.003 |
| Hemoglobin, g/dL | 14.1 ± 1.4 | 14.1 ± 1.3 | 14.1 ± 1.2 | 13.9 ± 1.4 | 0.316 | 12.8 ± 1.2 | 12.7 ± 1.1 | 12.8 ± 1.1 | 12.7 ± 1.3 | 0.777 |
| 25-hydroxy vitamin D, ng/mL | 24.8 ± 8.5 | 24.6 ± 7.4 | 25.6 ± 8.5 | 24 ± 8.5 | 0.382 | 20.7 ± 10.2 | 20.3 ± 9.4 | 22.9 ± 10.9 | 22 ± 8.7 | 0.107 |
| Free T4, ng/dL | 1.30 ± 0.21 | 1.27 ± 0.24 | 1.27± 0.25 | 1.21 ± 0.24 | 0.019 | 1.27 ± 0.18 | 1.19 ± 0.19 | 1.20 ± 0.19 | 1.17 ± 0.21 | <0.001 |
| Free testosterone, pg/mL | 9.2 ± 3.8 | 9.5 ± 3.3 | 9.6 ± 3.5 | 9.1 ± 3.2 | 0.321 | 0.8 ± 0.9 | 0.9 ± 1.1 | 0.9 ± 0.7 | 0.8 ± 0.5 | 0.781 |
| Hs-CRP,(mg/dL) | 1.94 ± 3.30 | 1.39 ± 1.88 | 1.20 ± 1.35 | 1.03 ± 1.20 | 0.015 | 1.4 ± 1.5 | 1.3 ± 1.7 | 1.1 ± 1.3 | 1.2 ± 1.5 | 0.416 |
| eGFR by CKD-EPI sCr, mL/min/m2 | 78.4 ± 12.2 | 78.2 ± 13.4 | 76.7 ± 13.7 | 72.8 ± 16.5 | 0.016 | 81.1 ± 13.9 | 80.6 ± 12.6 | 81 ± 13 | 77.1 ± 13.9 | 0.082 |
| eGFR by CKD-EPI sCystC, mL/min/m2 | 80.8 ± 21.8 | 79.9 ± 20.1 | 79.3 ± 19.5 | 74.1 ± 21.3 | 0.025 | 85.5 ± 19.8 | 81.2 ± 18.3 | 82.6 ± 17.6 | 75.1 ± 18.3 | <0.001 |
| Total ASM, kg | 18.7 ± 2.4 | 19.4 ± 2.5 | 19.3 ± 2.4 | 20.1 ± 2.5 | <0.001 | 13.4 ± 1.7 | 13.7 ± 1.7 | 13.6 ± 1.7 | 13.9 ± 1.8 | 0.206 |
| ASM index, kg/m2 | 6.9 ± 0.8 | 7.1 ± 0.8 | 7.1 ± 0.8 | 7.3 ± 0.8 | <0.001 | 5.8 ± 0.6 | 6.0 ± 0.6 | 5.9 ± 0.6 | 6.0 ± 0.7 | 0.038 |
| Walking speed, m/s | 1.27± 0.30 | 1.28 ± 0.30 | 1.27 ± 0.33 | 1.31 ± 0.31 | 0.594 | 1.15 ± 0.23 | 1.15 ± 0.25 | 1.20 ± 0.31 | 1.19 ± 0.29 | 0.338 |
| Handgrip strength, kg | 30.5 ± 5.6 | 31.8 ± 5.6 | 31.8 ± 5.2 | 32.1 ± 5.6 | 0.111 | 20.2 ± 4 | 20.3 ± 3.8 | 20.7 ± 3.9 | 20.4 ± 4.3 | 0.790 |
| Univariate | Multivariate | |||||||
|---|---|---|---|---|---|---|---|---|
| B | 95% CI | p-Value | B | 95% CI | p-Value | |||
| Men a | ||||||||
| Age (years) | −0.003 | −0.031 | 0.024 | 0.817 | ||||
| Non-smoker | 0.207 | −0.038 | 0.452 | 0.098 | ||||
| Never drinker | 0.072 | −0.308 | 0.451 | 0.711 | ||||
| Diabetes mellitus | −0.074 | −0.301 | 0.153 | 0.521 | ||||
| Hs-CRP | −0.104 | −0.156 | −0.052 | <0.001 | −0.101 | −0.152 | −0.051 | <0.001 |
| 25-hydroxy vitamin D | −0.007 | −0.020 | 0.006 | 0.282 | ||||
| Free testosterone | −0.014 | −0.045 | 0.017 | 0.372 | ||||
| eGFR by CKD-EPI sCystC | −0.012 | −0.018 | −0.005 | 0.001 | −0.013 | −0.018 | −0.008 | <0.001 |
| Walking speed (m/sec) | 0.269 | −0.066 | 0.604 | 0.116 | ||||
| Handgrip strength (kg) | 0.025 | 0.006 | 0.044 | 0.009 | 0.016 | −0.004 | 0.036 | 0.126 |
| ASM index (kg/m2) | 0.350 | 0.222 | 0.478 | <0.001 | 0.312 | 0.178 | 0.447 | <0.001 |
| Women b | ||||||||
| Age (years) | 0.013 | −0.010 | 0.036 | 0.266 | ||||
| Non-smoking | 0.019 | −0.485 | 0.523 | 0.941 | ||||
| never drinker | −0.067 | −0.254 | 0.121 | 0.485 | ||||
| Diabetes mellitus | −0.257 | −0.478 | −0.037 | 0.022 | −0.309 | −0.527 | −0.092 | 0.005 |
| Hs-CRP | −0.019 | −0.078 | 0.040 | 0.531 | ||||
| 25-hydroxy vitamin D | 0.007 | −0.002 | 0.016 | 0.147 | ||||
| eGFR by CKD-EPI sCystC | −0.010 | −0.015 | −0.006 | <0.001 | −0.013 | −0.019 | −0.008 | <0.001 |
| Walking speed (m/sec) | 0.210 | −0.126 | 0.547 | 0.220 | ||||
| Handgrip strength (kg) | 0.005 | −0.017 | 0.028 | 0.640 | ||||
| ASM index (kg/m2) | 0.240 | 0.098 | 0.382 | 0.001 | 0.229 | 0.084 | 0.373 | 0.002 |
| Men | Women | |||||||||
|---|---|---|---|---|---|---|---|---|---|---|
| Q1 (<184) (n = 179) | Q2 (184–226) (n = 151) | Q3 (226–289) (n = 116) | Q4 (>289) (n = 73) | p-Value | Q1 (<184) (n = 84) | Q2 (184–226) (n = 112) | Q3 (226–289) (n = 148) | Q4 (>289) (n = 190) | p-Value | |
| Age, years | 74.3 ± 4.0 | 75.5 ± 3.5 | 75.7 ± 3.9 | 75.6 ± 3.9 | 0.054 | 74.7 ± 3.9 | 75.3 ± 3.7 | 75.2 ± 3.8 | 76.2 ± 4.2 | 0.014 |
| BMI, kg/m2 | 23.9 ± 2.9 | 23.9 ± 2.7 | 23.3 ± 2.6 | 23.2 ± 3.0 | 0.084 | 25.5 ± 3.3 | 24.9 ± 2.8 | 24.5 ± 2.5 | 24.4 ± 3.0 | 0.012 |
| Smoker, (%) | 143 (79.9) | 114 (75.5) | 90 (77.6) | 49 (67.1) | 0.184 | 3 (3.6) | 2 (1.8) | 8 (5.4) | 5 (2.6) | 0.38 |
| Drinker, (%) | 170 (95.0) | 137 (90.7) | 106 (91.4) | 63 (86.3) | 0.137 | 49 (58.3) | 70 (62.5) | 88 (59.5) | 125 (65.8) | 0.56 |
| Diabetes, (%) | 40 (22.3) | 45 (29.8) | 17 (14.7) | 18 (24.7) | 0.035 | 30 (35.7) | 17 (15.2) | 35 (23.6) | 32 (16.8) | 0.001 |
| Hypertension, (%), | 93 (52.0) | 78 (51.7) | 55 (47.4) | 29 (39.7) | 0.299 | 50 (59.5) | 61 (54.5) | 88 (59.5) | 106 (55.8) | 0.804 |
| Osteoporosis, (%) | 3 (1.7) | 6 (4.0) | 3 (2.6) | 3 (4.1) | 0.573 | 14 (16.7) | 23.0 (20.5) | 42 (28.4) | 37 (19.5) | 0.123 |
| At least one medication, (%) | 147 (82.1) | 127 (84.1) | 87 (75.0) | 57 (78.1) | 0.255 | 75 (89.3) | 90.0 (80.4) | 127 (85.8) | 160 (84.2) | 0.368 |
| Albumin, g/dL | 4.32 ± 0.28 | 4.34 ± 0.23 | 4.31 ± 0.23 | 4.32 ± 0.25 | 0.734 | 4.33 ± 0.25 | 4.31 ± 0.20 | 4.35 ± 0.24 | 4.32 ± 0.24 | 0.519 |
| Creatinine, mg/dL | 0.92 ± 0.19 | 0.94 ± 0.21 | 0.99 ± 0.28 | 1.02 ± 0.28 | 0.005 | 0.71 ± 0.20 | 0.70 ± 0.15 | 0.73 ± 0.19 | 0.73 ± 0.16 | 0.427 |
| Cystatin C, ng/mL | 0.96 ± 0.29 | 0.97 ± 0.24 | 0.99 ± 0.33 | 1.07 ± 0.29 | 0.006 | 0.85 ± 0.24 | 0.87 ± 0.22 | 0.89 ± 0.26 | 0.94 ± 0.20 | 0.015 |
| Hemoglobin | 14.2 ± 1.3 | 14.1 ± 1.2 | 13.9 ± 1.3 | 13.7 ± 1.4 | 0.034 | 13.0 ± 1.2 | 12.6 ± 1.1 | 12.8 ± 1.1 | 12.7 ± 1.2 | 0.176 |
| 25-hydroxy vitamin D, ng/mL | 24.8 ± 8.0 | 25.2 ± 8.3 | 25.3 ± 8.6 | 23.6 ± 7.9 | 0.351 | 20.3 ± 8.2 | 19.7 ± 10.8 | 21.9 ± 10.6 | 22.3 ± 9.5 | 0.094 |
| Free T4, ng/dL | 1.3 ± 0.2 | 1.3 ± 0.2 | 1.3 ± 0.2 | 1.2 ± 0.3 | 0.157 | 1.3 ± 0.2 | 1.2 ± 0.2 | 1.2 ± 0.2 | 1.2 ± 0.2 | <0.001 |
| Hs-CRP, mg/dL | 1.8 ± 3.0 | 1.3 ± 1.8 | 1.2 ± 1.3 | 1.0 ± 1.2 | 0.016 | 1.3 ± 1.3 | 1.2 ± 1.7 | 1.3 ± 1.8 | 1.1 ± 1.4 | 0.854 |
| eGFR by CKD_EPI sCr, ml/min/m2 | 79.2 ± 11.7 | 76.1 ± 15.0 | 74.4 ± 16.0 | 71.3 ± 15.5 | 0.001 | 79.7 ± 14.9 | 82.2 ± 12.5 | 80.3 ± 13.6 | 79.1 ± 13.0 | 0.27 |
| eGFR by EKD_EPI sCystC, ml/min/m2 | 81.1 ± 20.0 | 80.2 ± 21.0 | 74.9 ± 20.5 | 71.0 ± 20.8 | 0.001 | 85.7 ± 20.3 | 83.2 ± 18.8 | 81.7 ± 17.9 | 76.4 ± 17.6 | 0.013 |
| Myostatin, ng/ml | 2.4 ± 0.5 | 3.2 ± 0.5 | 3.9 ± 0.6 | 5.1 ± 1.1 | <0.001 | 2.1 ± 0.4 | 2.8 ± 0.3 | 3.5 ± 0.5 | 4.5 ± 0.9 | <0.001 |
| Total ASM, kg | 19.8 ± 2.5 | 19.7 ± 2.3 | 19.1 ± 2.6 | 18.6 ± 2.5 | 0.001 | 14.2 ± 1.7 | 13.8 ± 1.6 | 13.6 ± 1.6 | 13.0 ± 1.7 | <0.001 |
| ASM Index, Kg/m2 | 7.2 ± 0.8 | 7.2 ± 0.8 | 7.1 ± 0.7 | 6.9 ± 0.8 | 0.001 | 6.0 ± 0.6 | 5.9 ± 0.6 | 5.9 ± 0.6 | 5.7 ± 0.7 | 0.001 |
| Walking speed m/s | 1.28 ± 0.30 | 1.29 ± 0.33 | 1.28 ± 0.31 | 1.28 ± 0.33 | 0.945 | 1.19 ± 0.25 | 1.15 ± 0.24 | 1.15 ± 0.26 | 1.18 ± 0.31 | 0.621 |
| Handgrip strength, kg | 32.0 ± 5.7 | 31.8 ± 5.7 | 31.1 ± 4.7 | 31.2 ± 6.0 | 0.459 | 21.7 ± 4.0 | 20.3 ± 3.7 | 20.2 ± 4.0 | 20.1 ± 4.0 | 0.013 |
| Variables | Univariate | Multivariate | ||||||
|---|---|---|---|---|---|---|---|---|
| B | 95% CI | p-Value | B | 95% CI | p-Value | |||
| Men a | ||||||||
| Age (years) | 1.254 | −0.142 | 2.650 | 0.078 | ||||
| Non-smoker | 0.116 | −8.604 | 8.837 | 0.979 | ||||
| Never drinker | −5.996 | −16.190 | 4.197 | 0.248 | ||||
| Diabetes mellitus | −0.717 | −13.263 | 11.828 | 0.911 | ||||
| Hs-CRP | −4.842 | −7.483 | −2.201 | <0.001 | −5.450 | −8.045 | −0.350 | <0.001 |
| 25-hydroxy vitamin D | −0.452 | −1.094 | 0.190 | 0.168 | ||||
| Free testosterone | −0.809 | −2.361 | 0.743 | 0.306 | ||||
| eGFR by CKD-EPI sCystC | −0.909 | −1.266 | −0.552 | <0.0001 | −0.984 | −1.342 | −0.627 | <0.001 |
| Walking speed (m/sec) | 1.629 | −15.362 | 18.620 | 0.851 | ||||
| Handgrip strength (kg) | −0.668 | −1.625 | 0.290 | 0.171 | ||||
| Women b | ||||||||
| Age (years) | 2.891 | 1.145 | 4.636 | 0.001 | 1.674 | −0.322 | 3.669 | 0.100 |
| Non-smoker | −2.969 | −23.875 | 17.937 | 0.780 | ||||
| Never drinker | 5.335 | −6.602 | 17.271 | 0.380 | ||||
| Diabetes mellitus | −17.396 | −34.246 | −0.547 | 0.043 | −25.377 | −39.748 | −6.642 | 0.006 |
| Hs-CRP | −0.804 | −5.310 | 3.702 | 0.726 | ||||
| 25-hydroxy vitamin D | 0.811 | 0.117 | 1.505 | 0.022 | 0.878 | 0.197 | 1.558 | 0.012 |
| Free testosterone | −1.026 | −9.126 | 7.074 | 0.804 | ||||
| eGFR by CKD-EPI sCystC | −0.886 | −1.245 | −0.527 | <0.001 | −0.982 | −1.366 | −0.0598 | <0.001 |
| Walking speed (m/sec) | −7.277 | −32.956 | 18.403 | 0.578 | ||||
| Handgrip strength (kg) | −2.879 | −4.610 | −1.148 | 0.001 | −2.785 | −4.608 | −0.9630 | <0.001 |
Publisher’s Note: MDPI stays neutral with regard to jurisdictional claims in published maps and institutional affiliations. |
© 2021 by the authors. Licensee MDPI, Basel, Switzerland. This article is an open access article distributed under the terms and conditions of the Creative Commons Attribution (CC BY) license (https://creativecommons.org/licenses/by/4.0/).
Share and Cite
Choi, S.J.; Lee, M.S.; Kang, D.-H.; Ko, G.J.; Lim, H.-S.; Yu, B.C.; Park, M.Y.; Kim, J.K.; Kim, C.-H.; Hwang, S.D.; et al. Myostatin/Appendicular Skeletal Muscle Mass (ASM) Ratio, Not Myostatin, Is Associated with Low Handgrip Strength in Community-Dwelling Older Women. Int. J. Environ. Res. Public Health 2021, 18, 7344. https://0-doi-org.brum.beds.ac.uk/10.3390/ijerph18147344
Choi SJ, Lee MS, Kang D-H, Ko GJ, Lim H-S, Yu BC, Park MY, Kim JK, Kim C-H, Hwang SD, et al. Myostatin/Appendicular Skeletal Muscle Mass (ASM) Ratio, Not Myostatin, Is Associated with Low Handgrip Strength in Community-Dwelling Older Women. International Journal of Environmental Research and Public Health. 2021; 18(14):7344. https://0-doi-org.brum.beds.ac.uk/10.3390/ijerph18147344
Chicago/Turabian StyleChoi, Soo Jeong, Min Sung Lee, Duk-Hee Kang, Gang Jee Ko, Hee-Sook Lim, Byung Chul Yu, Moo Yong Park, Jin Kuk Kim, Chul-Hee Kim, Seung Duk Hwang, and et al. 2021. "Myostatin/Appendicular Skeletal Muscle Mass (ASM) Ratio, Not Myostatin, Is Associated with Low Handgrip Strength in Community-Dwelling Older Women" International Journal of Environmental Research and Public Health 18, no. 14: 7344. https://0-doi-org.brum.beds.ac.uk/10.3390/ijerph18147344