
Estimated Artificial Neural Network Modeling of Maximal Oxygen Uptake Based on Multistage 10-m Shuttle Run Test in Healthy Adults

 , ,
, ,
Abstract
:1. Introduction
2. Materials and Methods
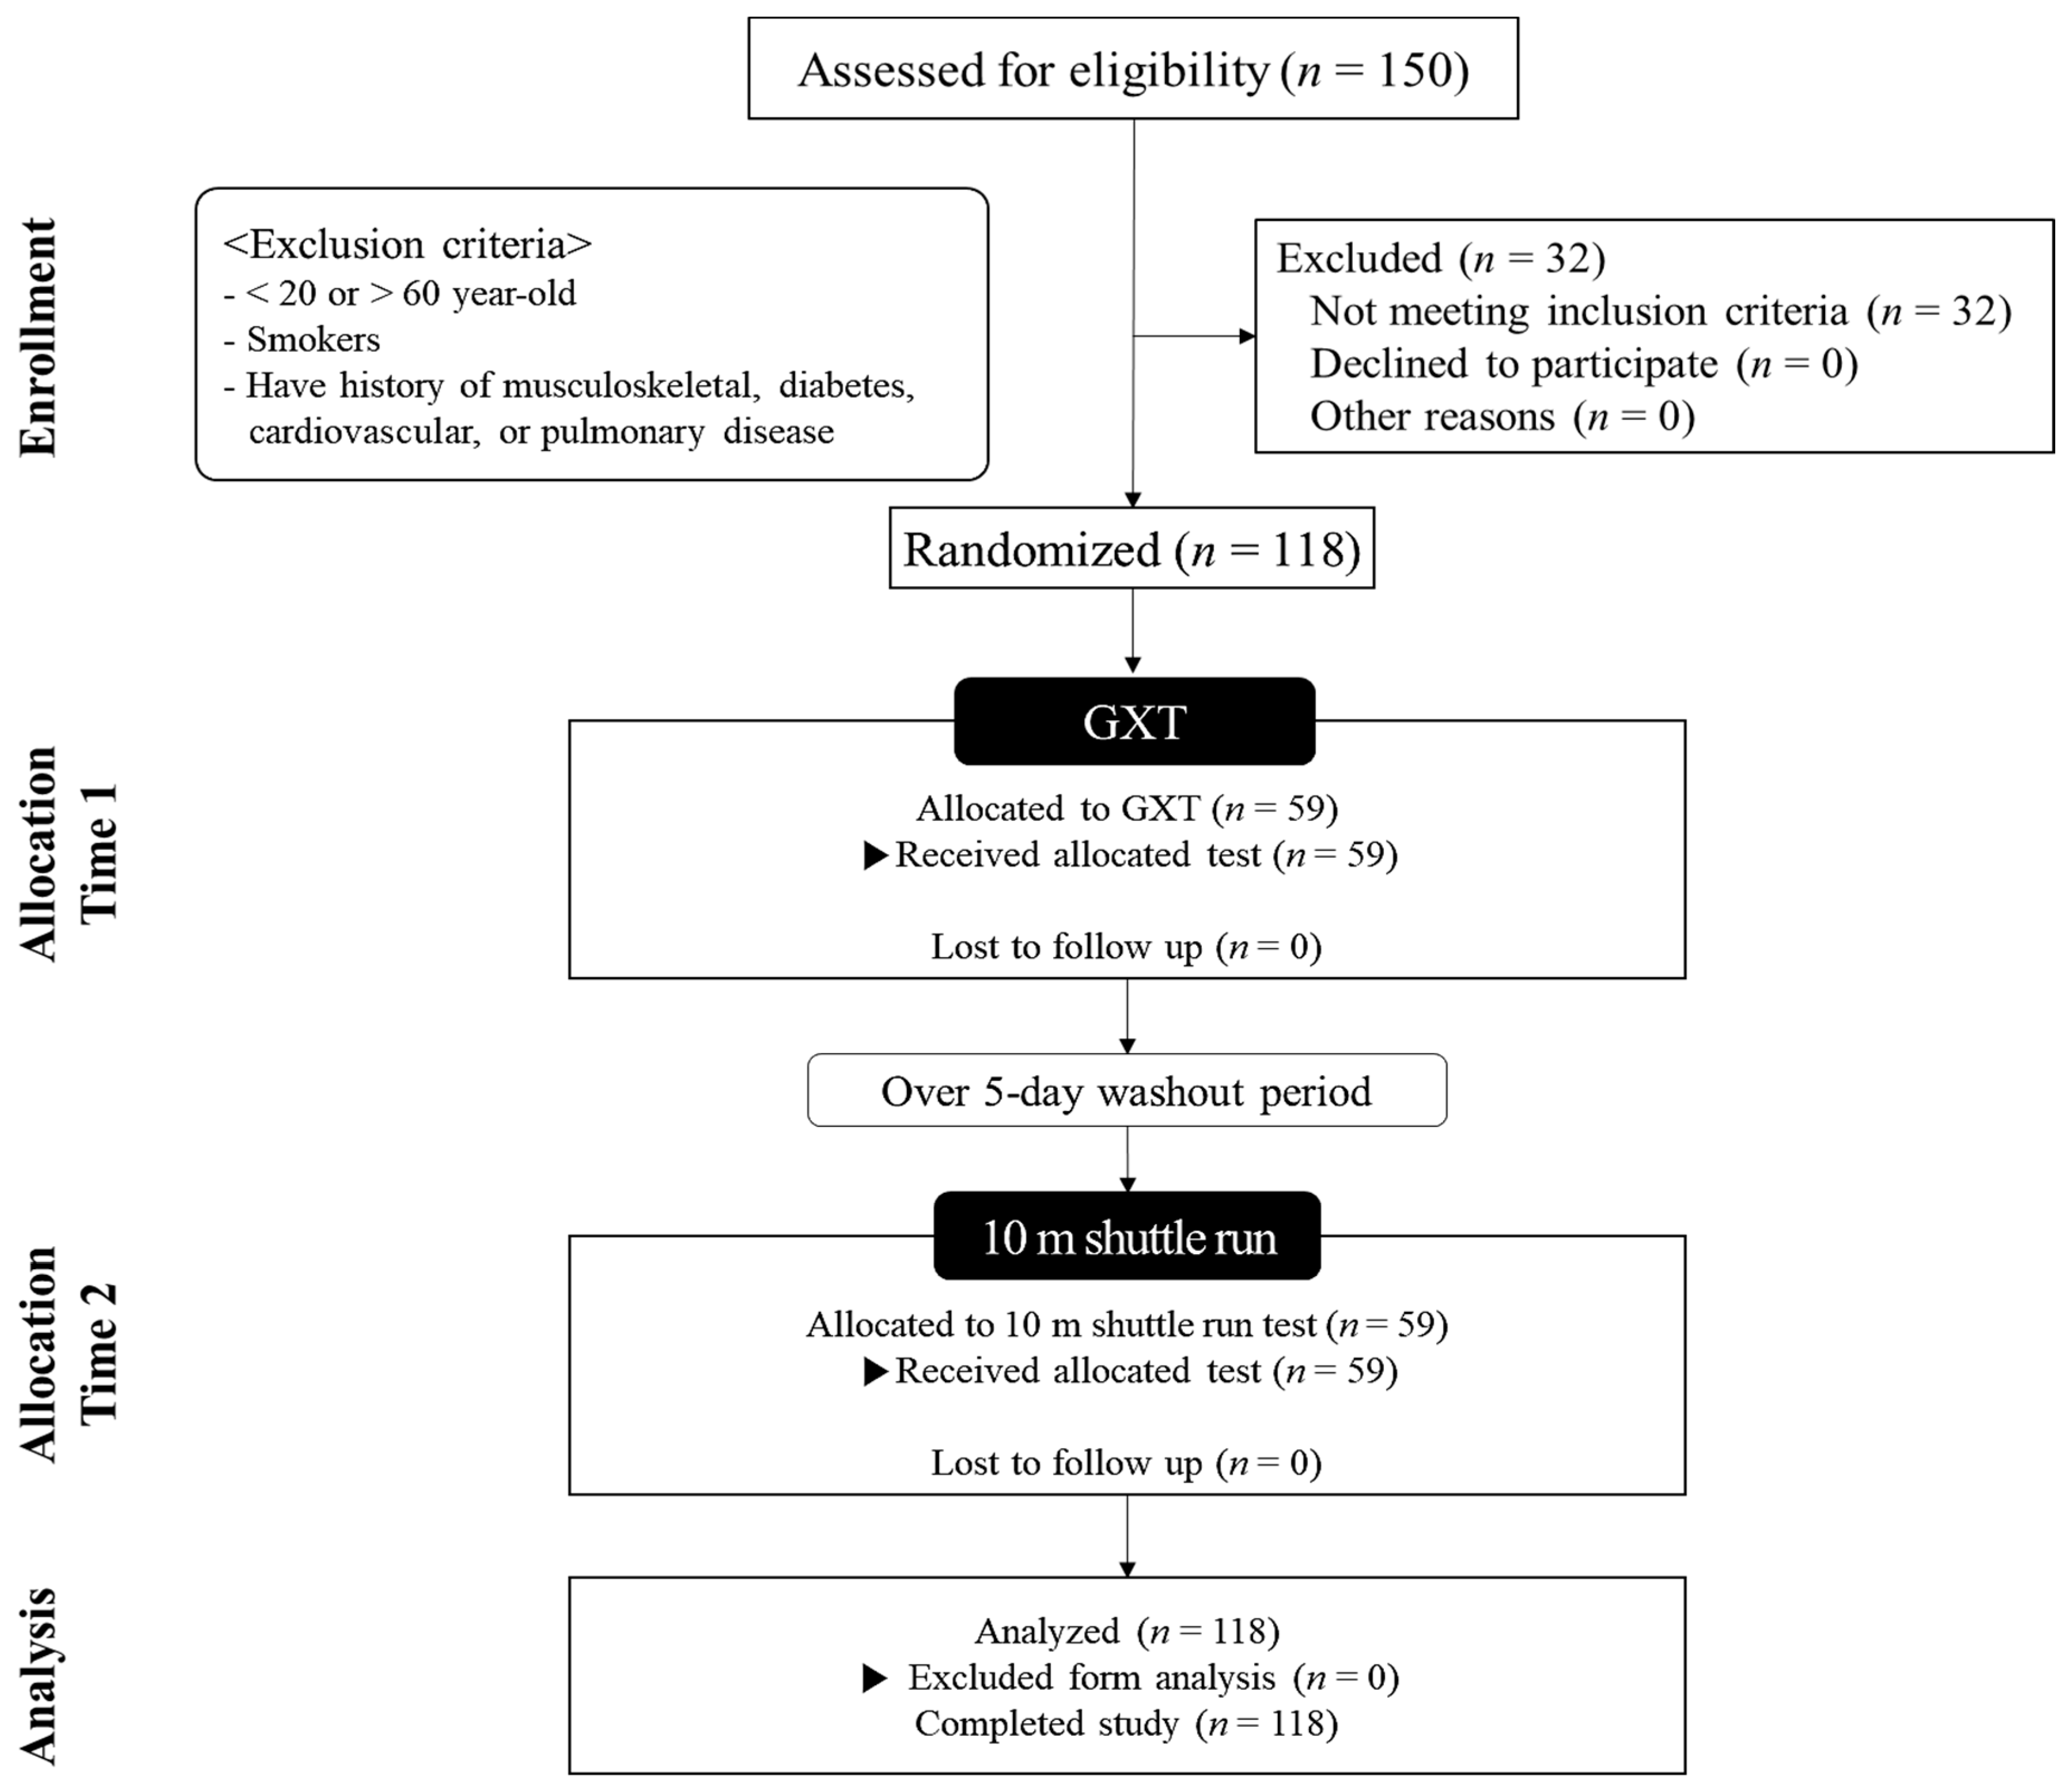
2.1. Participants
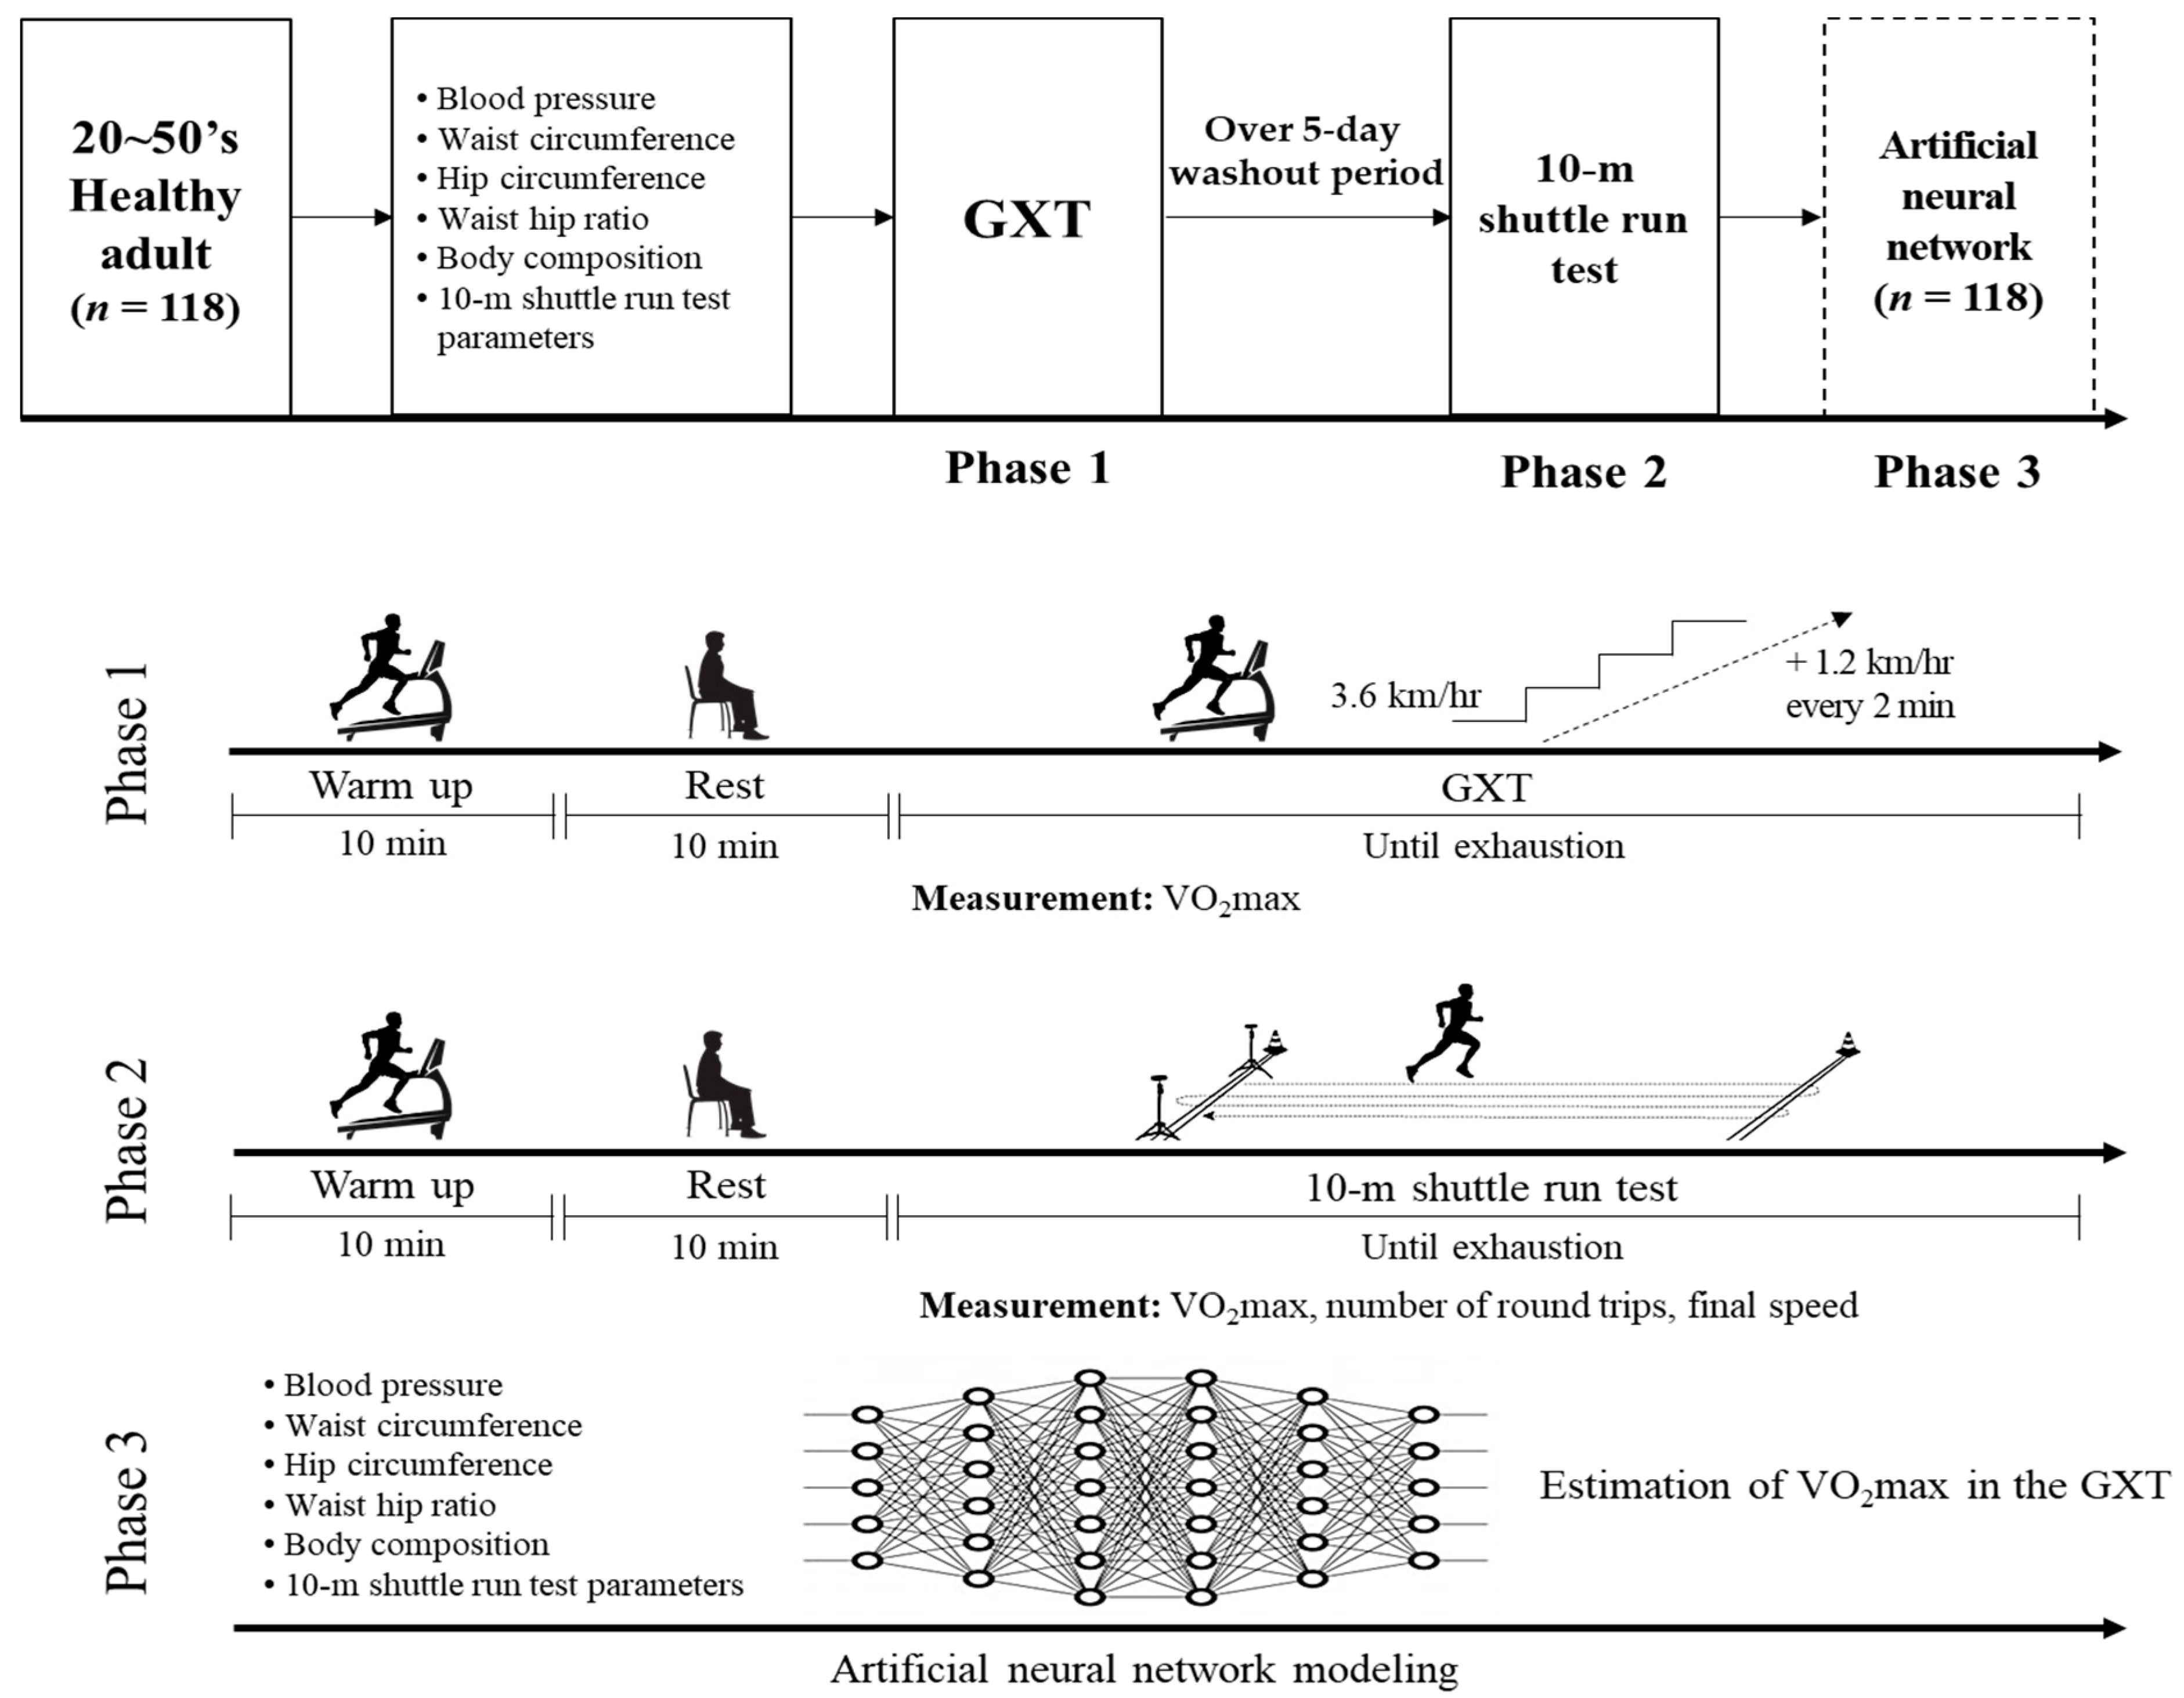
2.2. Study Design
2.3. Blood Pressure
2.4. Waist Circumference, Hip Circumference, and WHR
2.5. Body Composition
2.6. Graded Exercise Test
2.7. Ten-Meter Shuttle Run Test
2.8. Statistical Analysis
2.9. Artificial Neural Network-Based Prediction Model
3. Results
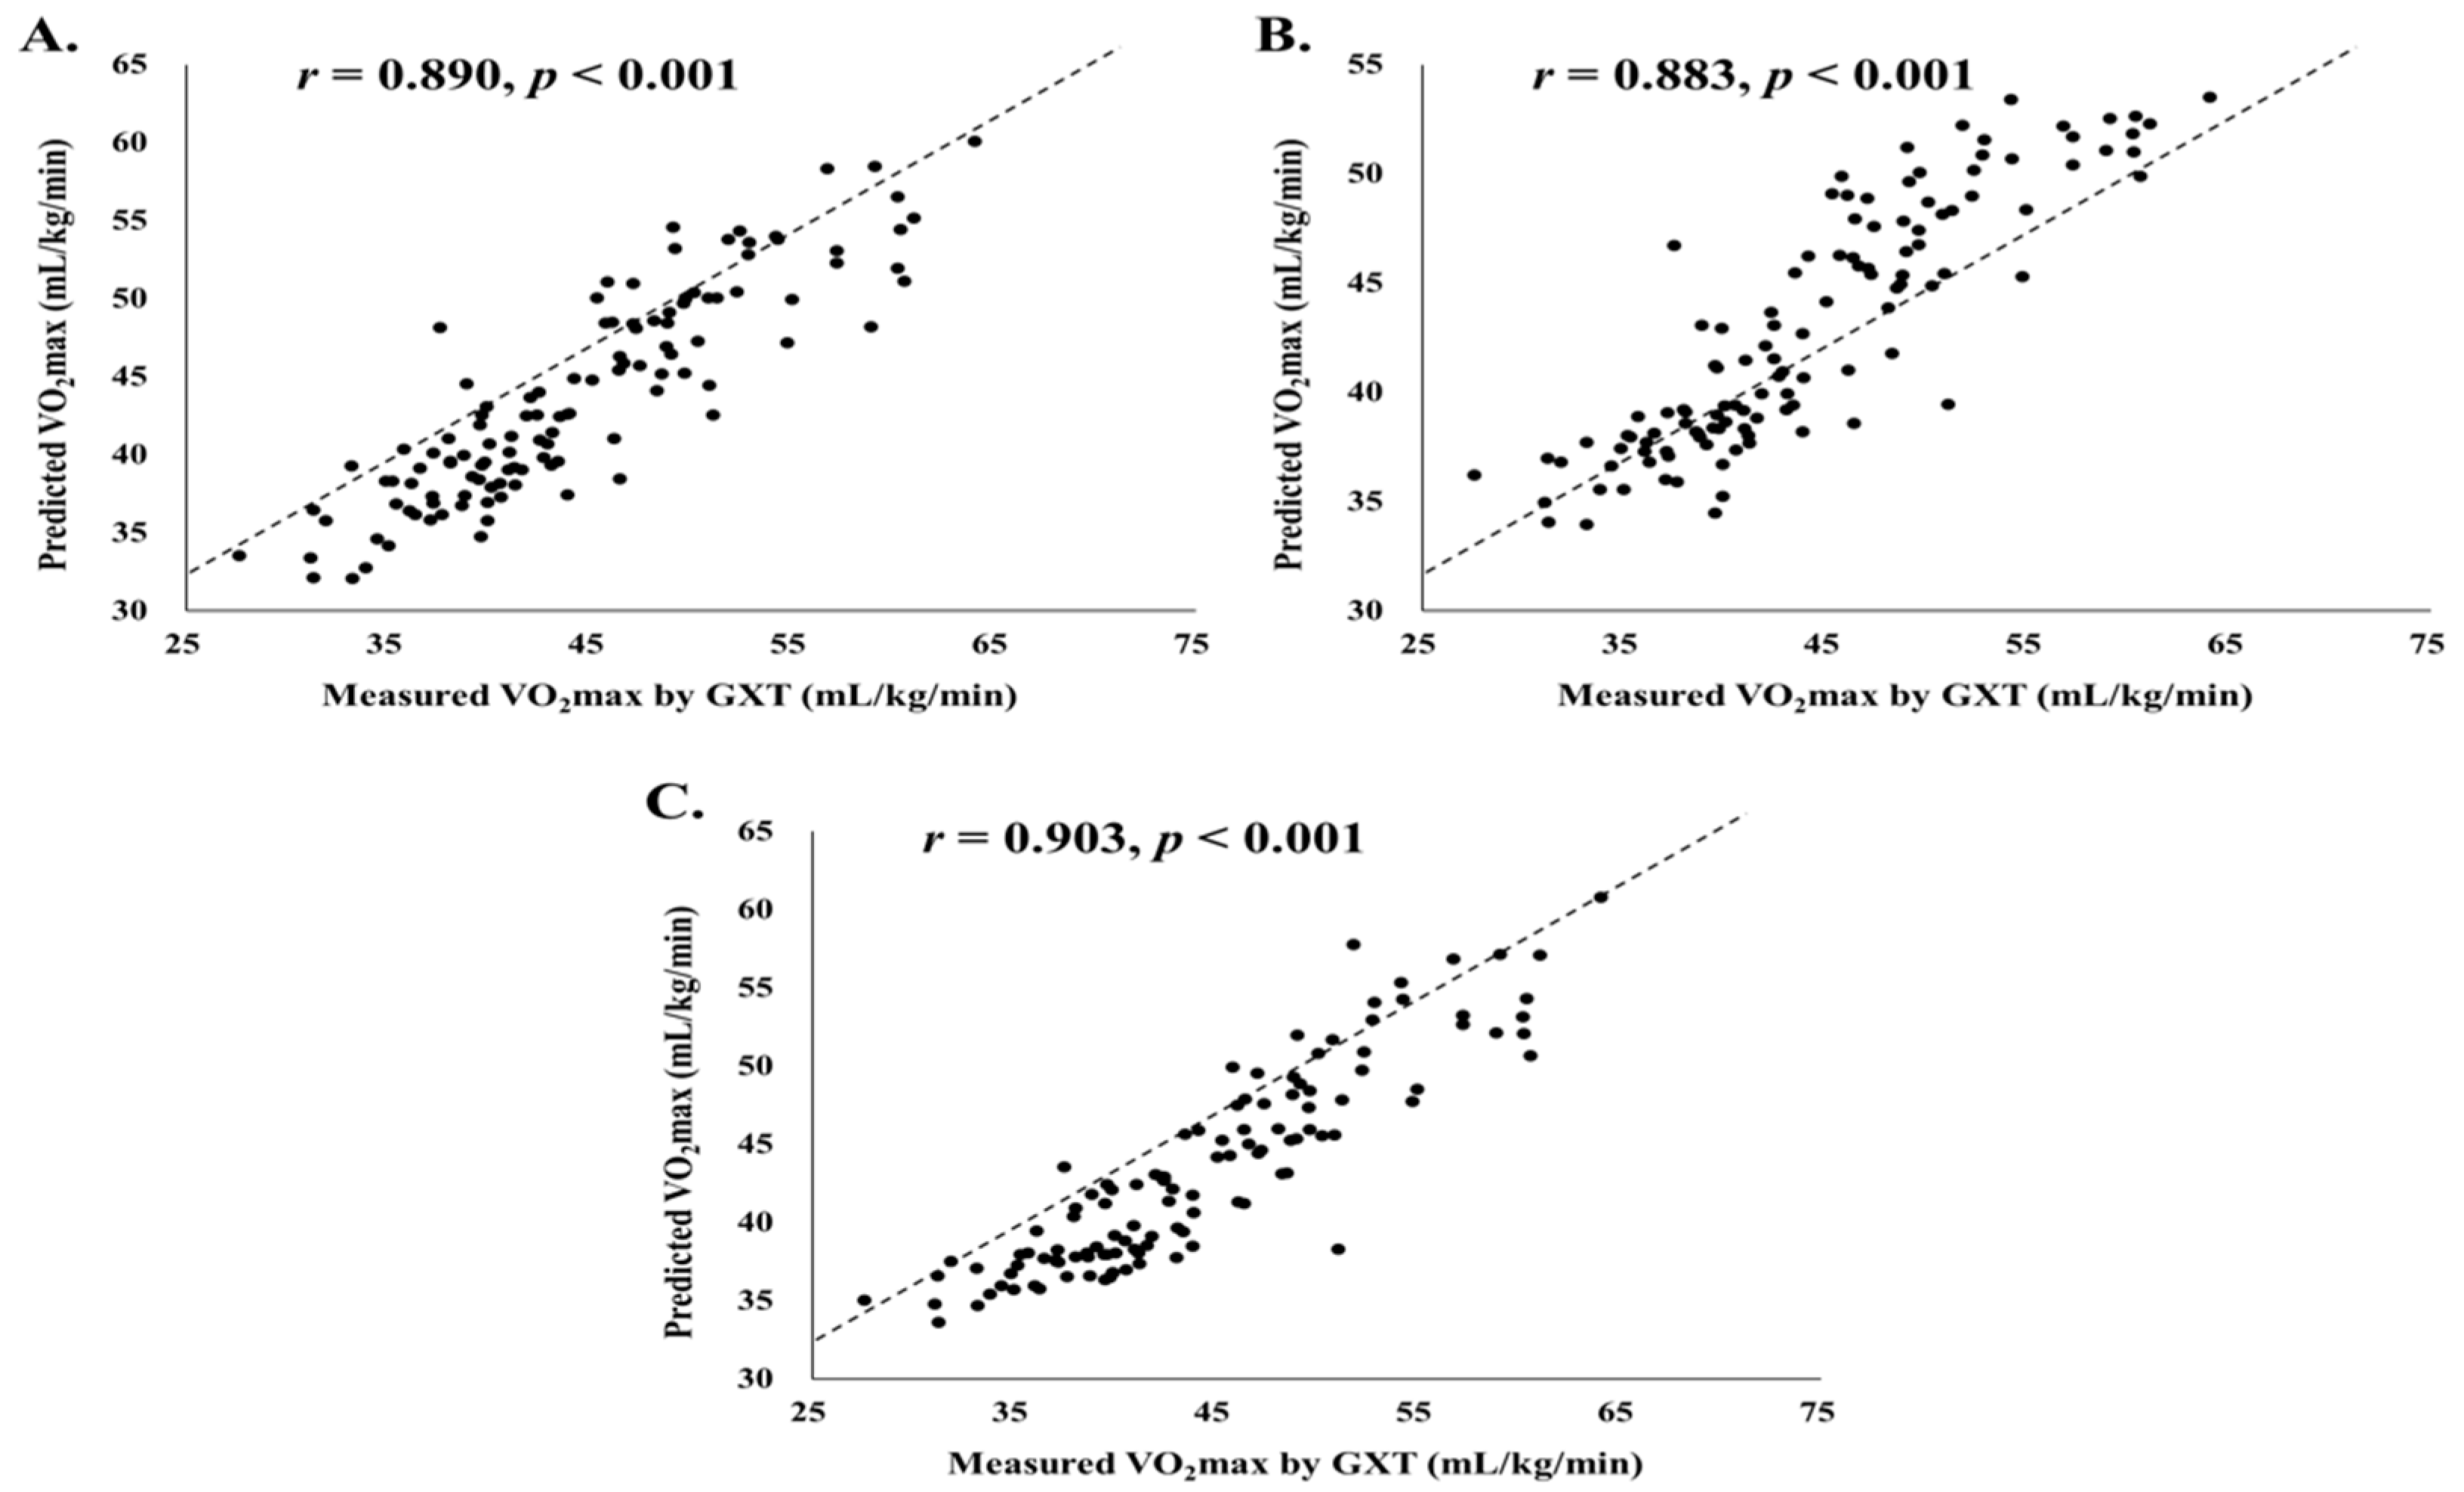
3.1. Estimation Accuracy of Artificial Neural Network-Based Maximal Oxygen Uptake Prediction Model
3.2. Difference between Measured Maximal Oxygen Uptake and Artificial Neural Network-Based Predicted Maximal Oxygen Uptake
4. Discussion
5. Conclusions
Author Contributions
Funding
Institutional Review Board Statement
Informed Consent Statement
Data Availability Statement
Conflicts of Interest
References
- Przednowek, K.; Barabasz, Z.; Zadarko-Domaradzka, M.; Przednowek, K.H.; Nizioł-Babiarz, E.; Huzarski, M.; Sibiga, K.; Dziadek, B.; Zadarko, E. Predictive Modeling of VO2max Based on 20 m Shuttle Run Test for Young Healthy People. Appl. Sci. 2018, 8, 2213. [Google Scholar] [CrossRef] [Green Version]
- Ross, R.; Blair, S.N.; Arena, R.; Church, T.S.; Després, J.-P.; Franklin, B.A.; Haskell, W.L.; Kaminsky, L.A.; Levine, B.D.; Lavie, C.J. Importance of assessing cardiorespiratory fitness in clinical practice: A case for fitness as a clinical vital sign: A scientific statement from the American Heart Association. Circulation 2016, 134, e653–e699. [Google Scholar] [CrossRef]
- Chu, D.J.; Al Rifai, M.; Virani, S.S.; Brawner, C.A.; Nasir, K.; Al-Mallah, M.H. The relationship between cardiorespiratory fitness, cardiovascular risk factors and atherosclerosis. Atherosclerosis 2020, 304, 44–52. [Google Scholar] [CrossRef] [PubMed]
- Barlow, C.E.; LaMonte, M.J.; Fitzgerald, S.J.; Kampert, J.B.; Perrin, J.L.; Blair, S.N. Cardiorespiratory fitness is an independent predictor of hypertension incidence among initially normotensive healthy women. Am. J. Epidemiol. 2006, 163, 142–150. [Google Scholar] [CrossRef] [PubMed]
- Joyner, M.J.; Green, D.J. Exercise protects the cardiovascular system: Effects beyond traditional risk factors. J. Physiol. 2009, 587, 5551–5558. [Google Scholar] [CrossRef]
- Walsh, N.P.; Gleeson, M.; Shephard, R.J.; Gleeson, M.; Woods, J.A.; Bishop, N.C.; Fleshner, M.; Green, C.; Pedersen, B.K.; Hoffman-Goetz, L.; et al. Position statement. Part one: Immune function and exercise. Exerc. Immunol. Rev. 2011, 17, 6–63. [Google Scholar]
- Wilson, M.G.; Ellison, G.M.; Cable, N.T. Basic science behind the cardiovascular benefits of exercise. Postgrad. Med. J. 2015, 91, 704–711. [Google Scholar] [CrossRef]
- Kodama, S.; Saito, K.; Tanaka, S.; Maki, M.; Yachi, Y.; Asumi, M.; Sugawara, A.; Totsuka, K.; Shimano, H.; Ohashi, Y.; et al. Cardiorespiratory fitness as a quantitative predictor of all-cause mortality and cardiovascular events in healthy men and women: A meta-analysis. JAMA 2009, 301, 2024–2035. [Google Scholar] [CrossRef] [PubMed] [Green Version]
- Gray, B.J.; Stephens, J.W.; Williams, S.P.; Davies, C.A.; Turner, D.; Bracken, R.M. Cardiorespiratory fitness is a stronger indicator of cardiometabolic risk factors and risk prediction than self-reported physical activity levels. Diabetes Vasc. Dis. Res. 2015, 12, 428–435. [Google Scholar] [CrossRef] [Green Version]
- Ling, J.C.; Mohamed, M.N.; Jalaludin, M.Y.; Rampal, S.; Zaharan, N.L.; Mohamed, Z. Determinants of High Fasting Insulin and Insulin Resistance among Overweight/Obese Adolescents. Sci. Rep. 2016, 6, 36270. [Google Scholar] [CrossRef] [PubMed] [Green Version]
- Silva, D.R.; Werneck, A.O.; Collings, P.J.; Ohara, D.; Fernandes, R.A.; Barbosa, D.S.; Ronque, E.R.V.; Sardinha, L.B.; Cyrino, E.S. Cardiorespiratory fitness effect may be under-estimated in ‘fat but fit’ hypothesis studies. Ann. Hum. Biol. 2017, 44, 237–242. [Google Scholar] [CrossRef] [Green Version]
- Cao, Z.B.; Miyatake, N.; Higuchi, M.; Miyachi, M.; Ishikawa-Takata, K.; Tabata, I. Predicting VO2max with an objectively measured physical activity in Japanese women. Med. Sci. Sports Exerc. 2010, 42, 179–186. [Google Scholar] [CrossRef]
- Strasser, B.; Burtscher, M. Survival of the fittest: VO2max, a key predictor of longevity? Front. Biosci. 2018, 23, 1505–1516. [Google Scholar] [CrossRef]
- Wier, L.T.; Jackson, A.S.; Ayers, G.W.; Arenare, B. Nonexercise models for estimating VO2max with waist girth, percent fat, or BMI. Med. Sci. Sports Exerc. 2006, 38, 555–561. [Google Scholar] [CrossRef]
- Cao, Z.B.; Miyatake, N.; Higuchi, M.; Ishikawa-Takata, K.; Miyachi, M.; Tabata, I. Prediction of VO2max with daily step counts for Japanese adult women. Eur. J. Appl. Physiol. 2009, 105, 289–296. [Google Scholar] [CrossRef]
- Léger, L.A.; Lambert, J. A maximal multistage 20-m shuttle run test to predict VO2max. Eur. J. Appl. Physiol. Occup. Physiol. 1982, 49, 1–12. [Google Scholar] [CrossRef]
- Mahar, M.T.; Guerieri, A.M.; Hanna, M.S.; Kemble, C.D. Estimation of aerobic fitness from 20-m multistage shuttle run test performance. Am. J. Prev. Med. 2011, 41, S117–S123. [Google Scholar] [CrossRef] [PubMed]
- Paradisis, G.P.; Zacharogiannis, E.; Mandila, D.; Smirtiotou, A.; Argeitaki, P.; Cooke, C.B. Multi-Stage 20-m Shuttle Run Fitness Test, Maximal Oxygen Uptake and Velocity at Maximal Oxygen Uptake. J. Hum. Kinet. 2014, 41, 81–87. [Google Scholar] [CrossRef] [PubMed] [Green Version]
- Mikawa, K.; Senjyu, H. Development of a field test for evaluating aerobic fitness in middle-aged adults: Validity of a 15-m incremental shuttle walk and run test. J. Sports Sci. Med. 2011, 10, 712–717. [Google Scholar] [PubMed]
- Matsuzaka, A.; Takahashi, Y.; Yamazoe, M.; Kumakura, N.; Ikeda, A.; Wilk, B.; Bar-Or, O. Validity of the multistage 20-m shuttle-run test for Japanese children, adolescents, and adults. Pediatr. Exerc. Sci. 2004, 16, 113–125. [Google Scholar] [CrossRef]
- Andersen, L.B.; Andersen, T.E.; Andersen, E.; Anderssen, S.A. An intermittent running test to estimate maximal oxygen uptake: The Andersen test. J. Sports Med. Phys. Fitness 2008, 48, 434–437. [Google Scholar] [PubMed]
- Cho, H.-L.; Park, H.-Y.; Nam, S.-S. Development of multistage 10-m shuttle run test for VO2max estimation in healthy adults. J. Men’s Health 2021, 17, 1–8. [Google Scholar] [CrossRef]
- Akay, M.; Özsert, G.; George, J. Prediction of maximal oxygen uptake using support vector machines from submaximal data. DEÜ Eng. Fac. Eng. Sci. J. 2014, 16, 42–48. [Google Scholar]
- Aktürk, E.; Akay, M. Prediction of maximal oxygen uptake using multilayer perceptron combined with feature selection. In Proceedings of the 7th Engineering and Technology Symposium, Ankara, Turkey, 15–16 May 2014; pp. 3–6. [Google Scholar]
- Abut, F.; Akay, M.F.; George, J. Developing new VO2max prediction models from maximal, submaximal and questionnaire variables using support vector machines combined with feature selection. Comput. Biol. Med. 2016, 79, 182–192. [Google Scholar] [CrossRef] [PubMed]
- Ham, J.H.; Park, H.Y.; Kim, Y.H.; Bae, S.K.; Ko, B.H.; Nam, S.S. Development of an anaerobic threshold (HRLT, HRVT) estimation equation using the heart rate threshold (HRT) during the treadmill incremental exercise test. J. Exerc. Nutr. Biochem. 2017, 21, 43–49. [Google Scholar] [CrossRef] [PubMed]
- Sark, S.; Elshawi, R.; Ahmed, A.; Qureshi, W.T.; Brawner, C.; Keteyian, S.; Blaha, M.J.; Al-Mallah, M.H. Using machine learning on cardiorespiratory fitness data for predicting hypertension: The Henry Ford ExercIse Testing (FIT) Project. PLoS ONE 2018, 13, e0195344. [Google Scholar] [CrossRef] [Green Version]
- Sakr, S.; Elshawi, R.; Ahmed, A.M.; Qureshi, W.T.; Brawner, C.A.; Keteyian, S.J.; Blaha, M.J.; Al-Mallah, M.H. Comparison of machine learning techniques to predict all-cause mortality using fitness data: The Henry ford exercIse testing (FIT) project. BMC Med. Inform. Decis. Mak. 2017, 17, 174. [Google Scholar] [CrossRef] [Green Version]
- Silva, G.; Oliveira, N.L.; Aires, L.; Mota, J.; Oliveira, J.; Ribeiro, J.C. Calculation and validation of models for estimating VO2max from the 20-m shuttle run test in children and adolescents. Arch. Exerc. Health Dis. 2012, 3, 145–152. [Google Scholar] [CrossRef]
- Takuro, K.; Kohei, S.; Kotarō, M.; Yoshiyasu, Y. The Reproducibility of the 15-m Shuttle Run Test, a Modified 20-m Shuttle Run Test, for the Assessment of Exercise Capacity. Rigakuryoho Kagaku 2015, 30, 81–84. [Google Scholar] [CrossRef] [Green Version]


| Both (n = 118) | Men (n = 59) | Women (n = 59) | |
|---|---|---|---|
| Age (yrs) | 38.29 ± 11.82 | 37.75 ± 12.09 | 38.83 ± 11.62 |
| Height (cm) | 166.69 ± 8.16 | 172.69 ± 6.19 | 160.69 ± 4.77 |
| Weight (kg) | 65.36 ± 10.72 | 72.99 ± 8.61 | 57.73 ± 6.26 |
| BMI (kg/m2) | 23.41 ± 2.54 | 24.44 ± 2.24 | 22.37 ± 2.40 |
| Percent skeletal muscle (%) | 29.86 ± 3.76 | 32.89 ± 2.42 | 26.84 ± 2.01 |
| Percent body fat (%) | 24.42 ± 5.56 | 20.97 ± 4.51 | 27.87 ± 4.22 |
| SBP (mmHg) | 121.89 ± 9.99 | 126.61 ± 7.07 | 117.17 ± 10.30 |
| DBP (mmHg) | 79.14 ± 10.05 | 82.85 ± 9.32 | 75.44 ± 9.43 |
| Waist circumference (cm) | 81.32 ± 7.66 | 84.38 ± 7.70 | 78.26 ± 6.33 |
| Hip circumference (cm) | 96.04 ± 5.16 | 96.62 ± 5.52 | 95.47 ± 4.75 |
| WHR | 0.85 ± 0.05 | 0.87 ± 0.05 | 0.82 ± 0.04 |
| Numbers of round trips in 10 m SRT (n) | 115.61 ± 26.19 | 131.49 ± 24.08 | 99.73 ± 17.06 |
| Final speed in 10 m SRT (km/h) | 10.03 ± 0.94 | 10.56 ± 0.89 | 9.50 ± 0.64 |
| VO2max by GXT (mL/kg/min) | 44.27 ± 7.70 | 49.08 ± 6.70 | 39.46 ± 5.26 |
| Start Time (min) | Finish Time (min) | Speed (km/h) | Moving Time Per 10 m (s) | Beats Per min | Number of Shuttles |
|---|---|---|---|---|---|
| 0:00:00 | 0:01:00 | 3.6 | 10.00 | 54 | 6 |
| 0:01:00 | 0:02:00 | 4.8 | 7.50 | 72 | 8 |
| 0:02:00 | 0:03:00 | 6.0 | 6.00 | 90 | 10 |
| 0:03:00 | 0:04:00 | 6.0 | 6.00 | 90 | 10 |
| 0:04:00 | 0:05:00 | 7.2 | 5.00 | 108 | 12 |
| 0:05:00 | 0:06:00 | 7.2 | 5.00 | 108 | 12 |
| 0:06:00 | 0:07:00 | 8.4 | 4.29 | 126 | 14 |
| 0:07:00 | 0:08:00 | 8.4 | 4.29 | 126 | 14 |
| 0:08:00 | 0:09:00 | 9.6 | 3.75 | 144 | 16 |
| 0:09:00 | 0:10:00 | 9.6 | 3.75 | 144 | 16 |
| 0:10:00 | 0:11:00 | 10.8 | 3.33 | 162 | 18 |
| 0:11:00 | 0:12:00 | 10.8 | 3.33 | 162 | 18 |
| 0:12:00 | 0:13:00 | 12.0 | 3.00 | 180 | 20 |
| 0:13:00 | 0:14:00 | 12.0 | 3.00 | 180 | 20 |
| 0:14:00 | 0:15:00 | 13.2 | 2.73 | 198 | 22 |
| 0:15:00 | 0:16:00 | 13.2 | 2.73 | 198 | 22 |
| 0:16:00 | 0:17:00 | 14.4 | 2.50 | 216 | 24 |
| 0:17:00 | 0:18:00 | 14.4 | 2.50 | 216 | 24 |
| 0:18:00 | 0:19:00 | 15.6 | 2.31 | 234 | 26 |
| 0:19:00 | 0:20:00 | 15.6 | 2.31 | 234 | 26 |
| 0:20:00 | 0:21:00 | 16.8 | 2.14 | 252 | 28 |
| 0:21:00 | 0:22:00 | 16.8 | 2.14 | 252 | 28 |
| VO2max by GXT | ||||
|---|---|---|---|---|
| Total | Men | Women | ||
| Age (yrs) | Correlation | −0.339 * | −0.391 * | −0.412 * |
| p-value | 0.000 | 0.002 | 0.001 | |
| Height (cm) | Correlation | 0.412 * | −0.182 | 0.047 |
| p-value | 0.000 | 0.167 | 0.724 | |
| Weight (kg) | Correlation | 0.215 * | −0.440 * | −0.409 * |
| p-value | 0.019 | 0.000 | 0.001 | |
| BMI (kg/m2) | Correlation | −0.047 | −0.431 * | −0.437 * |
| p-value | 0.617 | 0.001 | 0.001 | |
| Percent skeletal muscle (%) | Correlation | 0.767 * | 0.593 * | 0.526 * |
| p-value | 0.000 | 0.000 | 0.000 | |
| Percent body fat (%) | Correlation | −0.783 * | −0.697 * | −0.577 * |
| p-value | 0.000 | 0.000 | 0.000 | |
| SBP (mmHg) | Correlation | 0.194 * | −0.198 | −0.125 |
| p-value | 0.036 | 0.133 | 0.347 | |
| DBP (mmHg) | Correlation | 0.066 | −0.300 * | −0.145 |
| p-value | 0.477 | 0.021 | 0.275 | |
| Waist circumference (cm) | Correlation | −0.151 | −0.642 * | −0.441 * |
| p-value | 0.104 | 0.000 | 0.000 | |
| Hip circumference (cm) | Correlation | −0.272 * | −0.457 * | −0.419 * |
| p-value | 0.003 | 0.000 | 0.001 | |
| WHR | Correlation | 0.003 | −0.561 * | −0.277 * |
| p-value | 0.974 | 0.000 | 0.034 | |
| Numbers of round trips in 10 m SRT (n) | Correlation | 0.837 * | 0.764 * | 0.688 * |
| p-value | 0.000 | 0.000 | 0.000 | |
| Final speed in 10 m SRT (km/h) | Correlation | 0.777 * | 0.683 * | 0.611 * |
| p-value | 0.000 | 0.000 | 0.000 | |
| Measured VO2max by GXT | |||
|---|---|---|---|
| R2 | Adjust R2 | RMSE | |
| Case 1 ANN-based estimation | 0.7765 | 0.7206 | 3.4940 |
| Case 2 ANN-based estimation | 0.7909 | 0.7072 | 3.3798 |
| Case 3 ANN-based estimation | 0.8206 | 0.7010 | 3.1301 |
| Model | Mean ± S.D. | Bias | t-Value | p-Value | |
|---|---|---|---|---|---|
| Case1 | Predicted treadmill VO2max (mL/kg/min) | 43.73 ± 6.62 | −0.54 | 1.674 | 0.097 |
| Measured treadmill VO2max (mL/kg/min) | 44.27 ± 7.70 | ||||
| Case2 | Predicted treadmill VO2max (mL/kg/min) | 42.94 ± 5.55 | −1.32 | 3.753 | 0.000 |
| Measured treadmill VO2max (mL/kg/min) | 44.27 ± 7.70 | ||||
| Case3 | Predicted treadmill VO2max (mL/kg/min) | 43.33 ± 6.36 | −0.93 | 3.012 | 0.003 |
| Measured treadmill VO2max (mL/kg/min) | 44.27 ± 7.70 | ||||
Publisher’s Note: MDPI stays neutral with regard to jurisdictional claims in published maps and institutional affiliations. |
© 2021 by the authors. Licensee MDPI, Basel, Switzerland. This article is an open access article distributed under the terms and conditions of the Creative Commons Attribution (CC BY) license (https://creativecommons.org/licenses/by/4.0/).
Share and Cite
Park, H.-Y.; Jung, H.; Lee, S.; Kim, J.-W.; Cho, H.-L.; Nam, S.-S. Estimated Artificial Neural Network Modeling of Maximal Oxygen Uptake Based on Multistage 10-m Shuttle Run Test in Healthy Adults. Int. J. Environ. Res. Public Health 2021, 18, 8510. https://0-doi-org.brum.beds.ac.uk/10.3390/ijerph18168510
Park H-Y, Jung H, Lee S, Kim J-W, Cho H-L, Nam S-S. Estimated Artificial Neural Network Modeling of Maximal Oxygen Uptake Based on Multistage 10-m Shuttle Run Test in Healthy Adults. International Journal of Environmental Research and Public Health. 2021; 18(16):8510. https://0-doi-org.brum.beds.ac.uk/10.3390/ijerph18168510
Chicago/Turabian StylePark, Hun-Young, Hoeryoung Jung, Seunghun Lee, Jeong-Weon Kim, Hong-Lae Cho, and Sang-Seok Nam. 2021. "Estimated Artificial Neural Network Modeling of Maximal Oxygen Uptake Based on Multistage 10-m Shuttle Run Test in Healthy Adults" International Journal of Environmental Research and Public Health 18, no. 16: 8510. https://0-doi-org.brum.beds.ac.uk/10.3390/ijerph18168510