
Combined Multimorbidity and Polypharmacy Patterns in the Elderly: A Cross-Sectional Study in Primary Health Care


Abstract
:1. Introduction
2. Materials and Methods
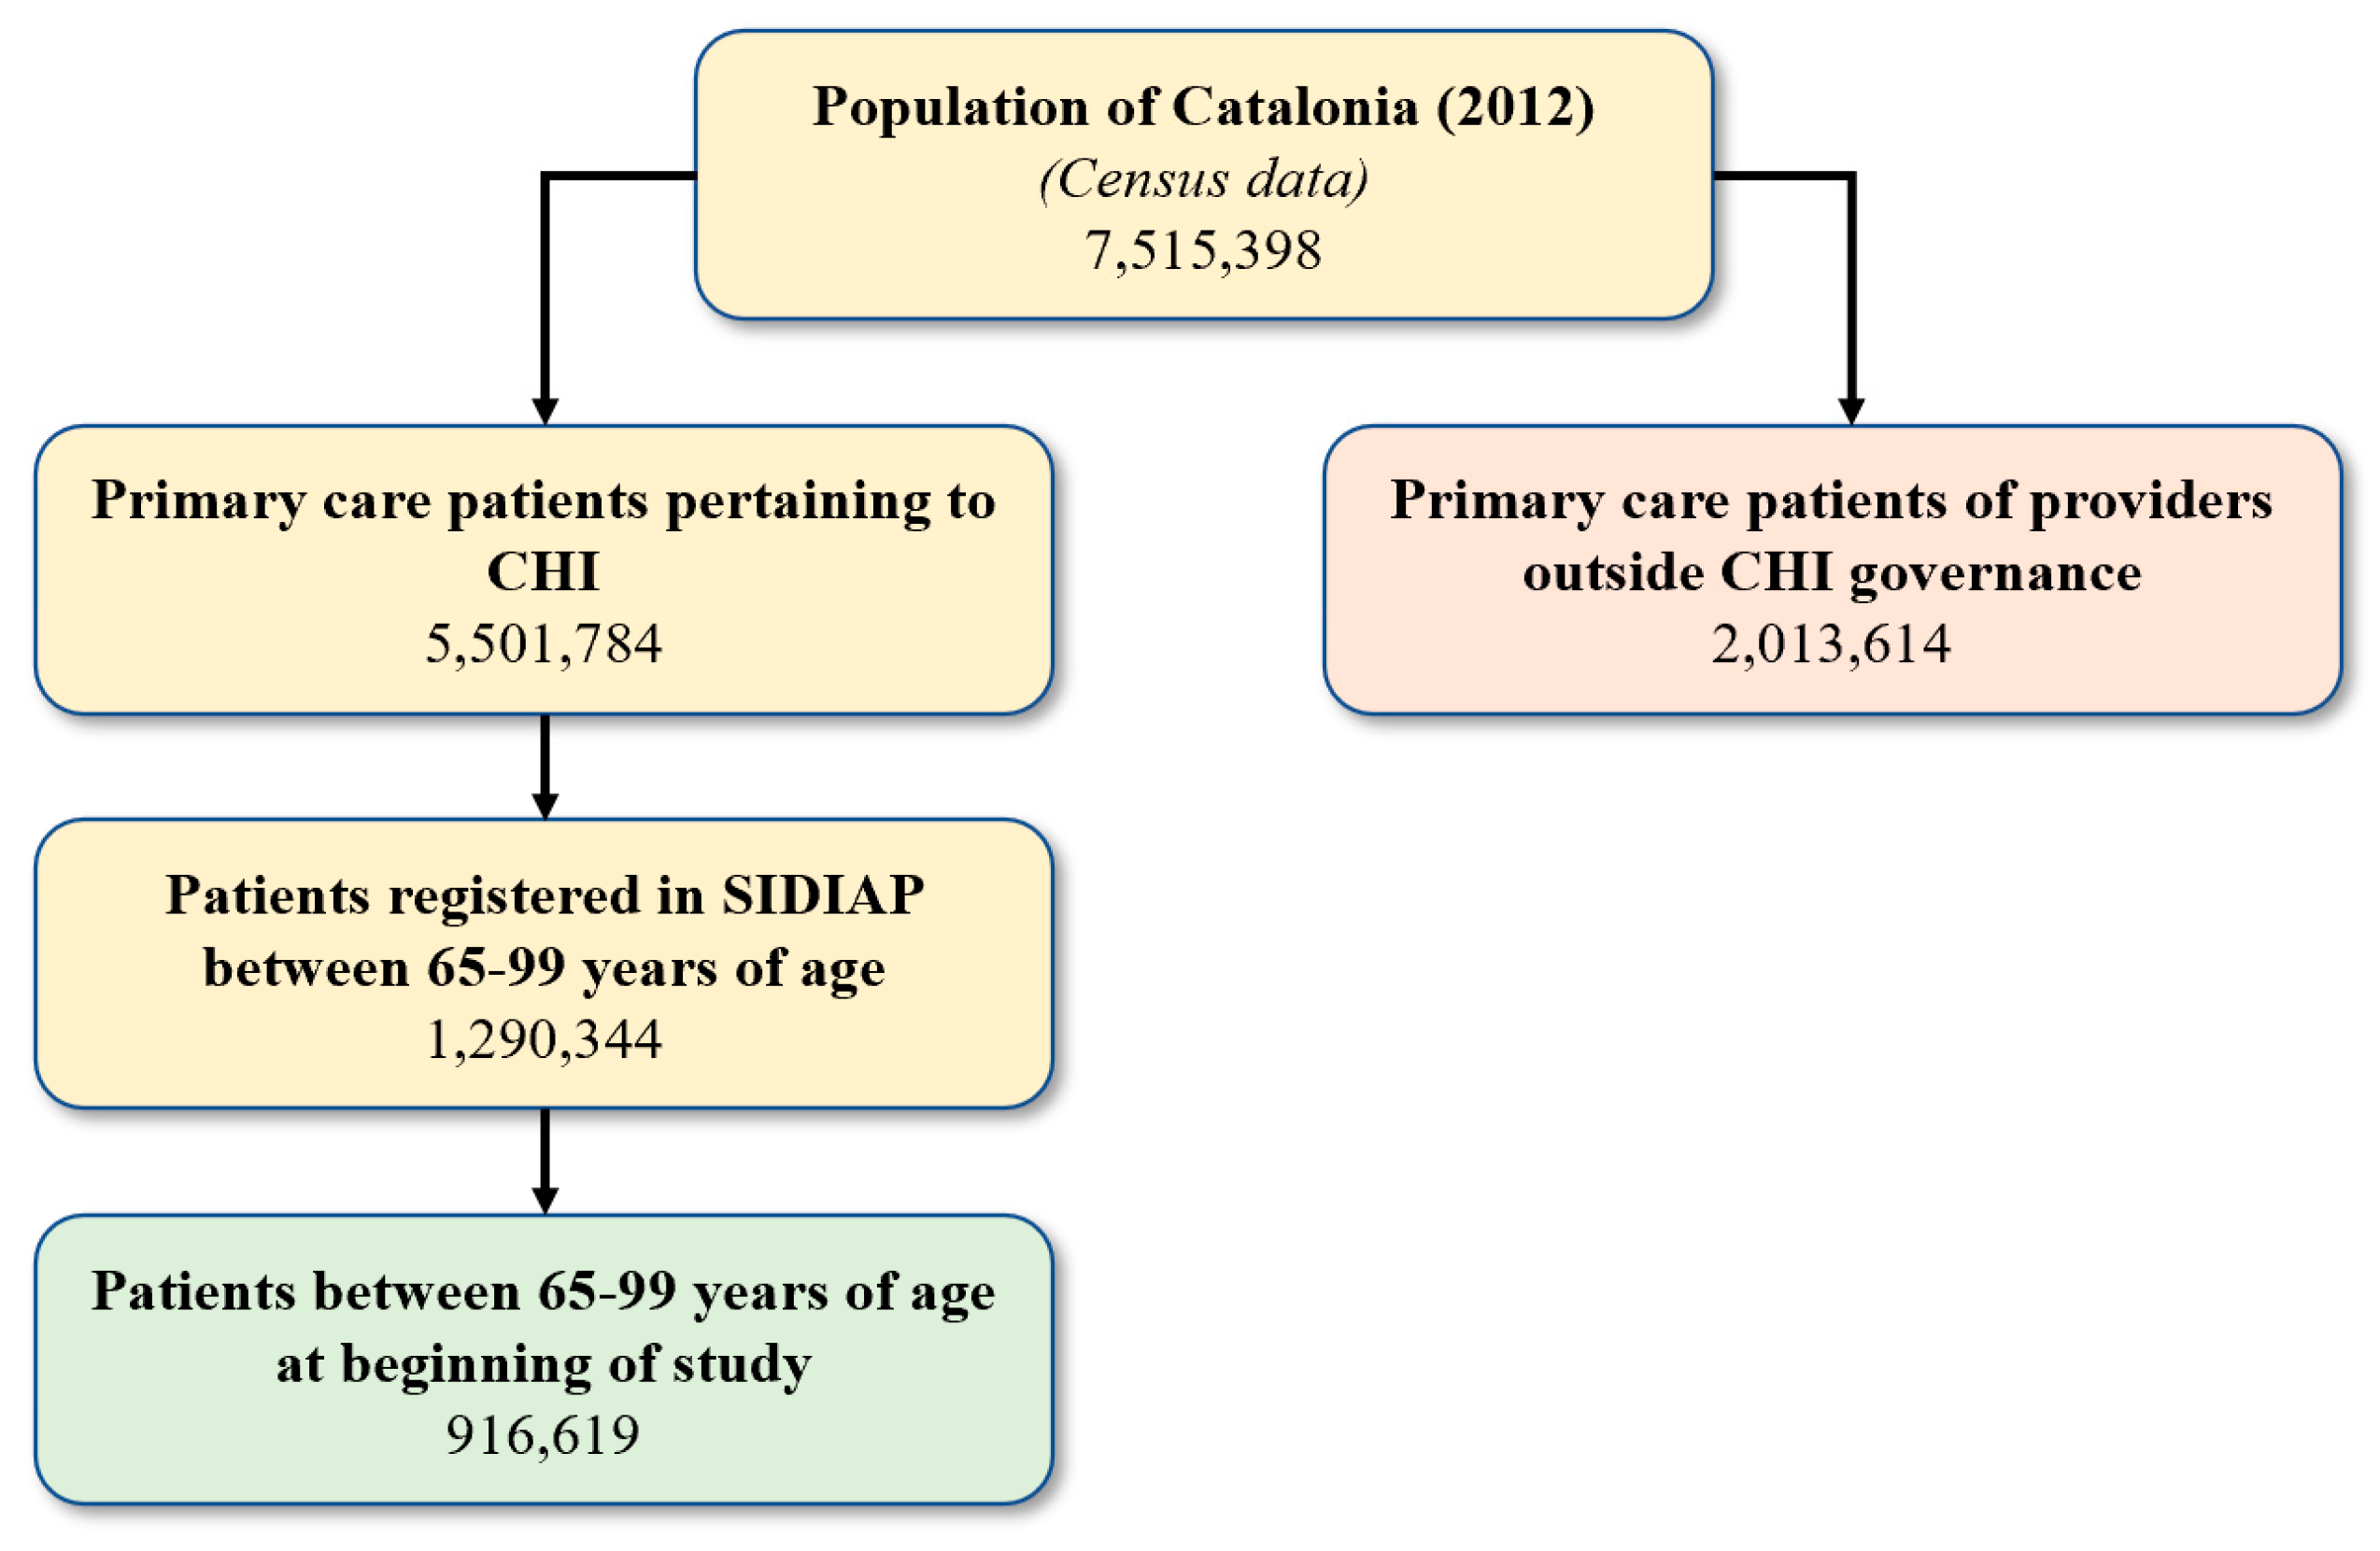
2.1. Setting, Design, and Population
2.2. Data Source
2.3. Variables
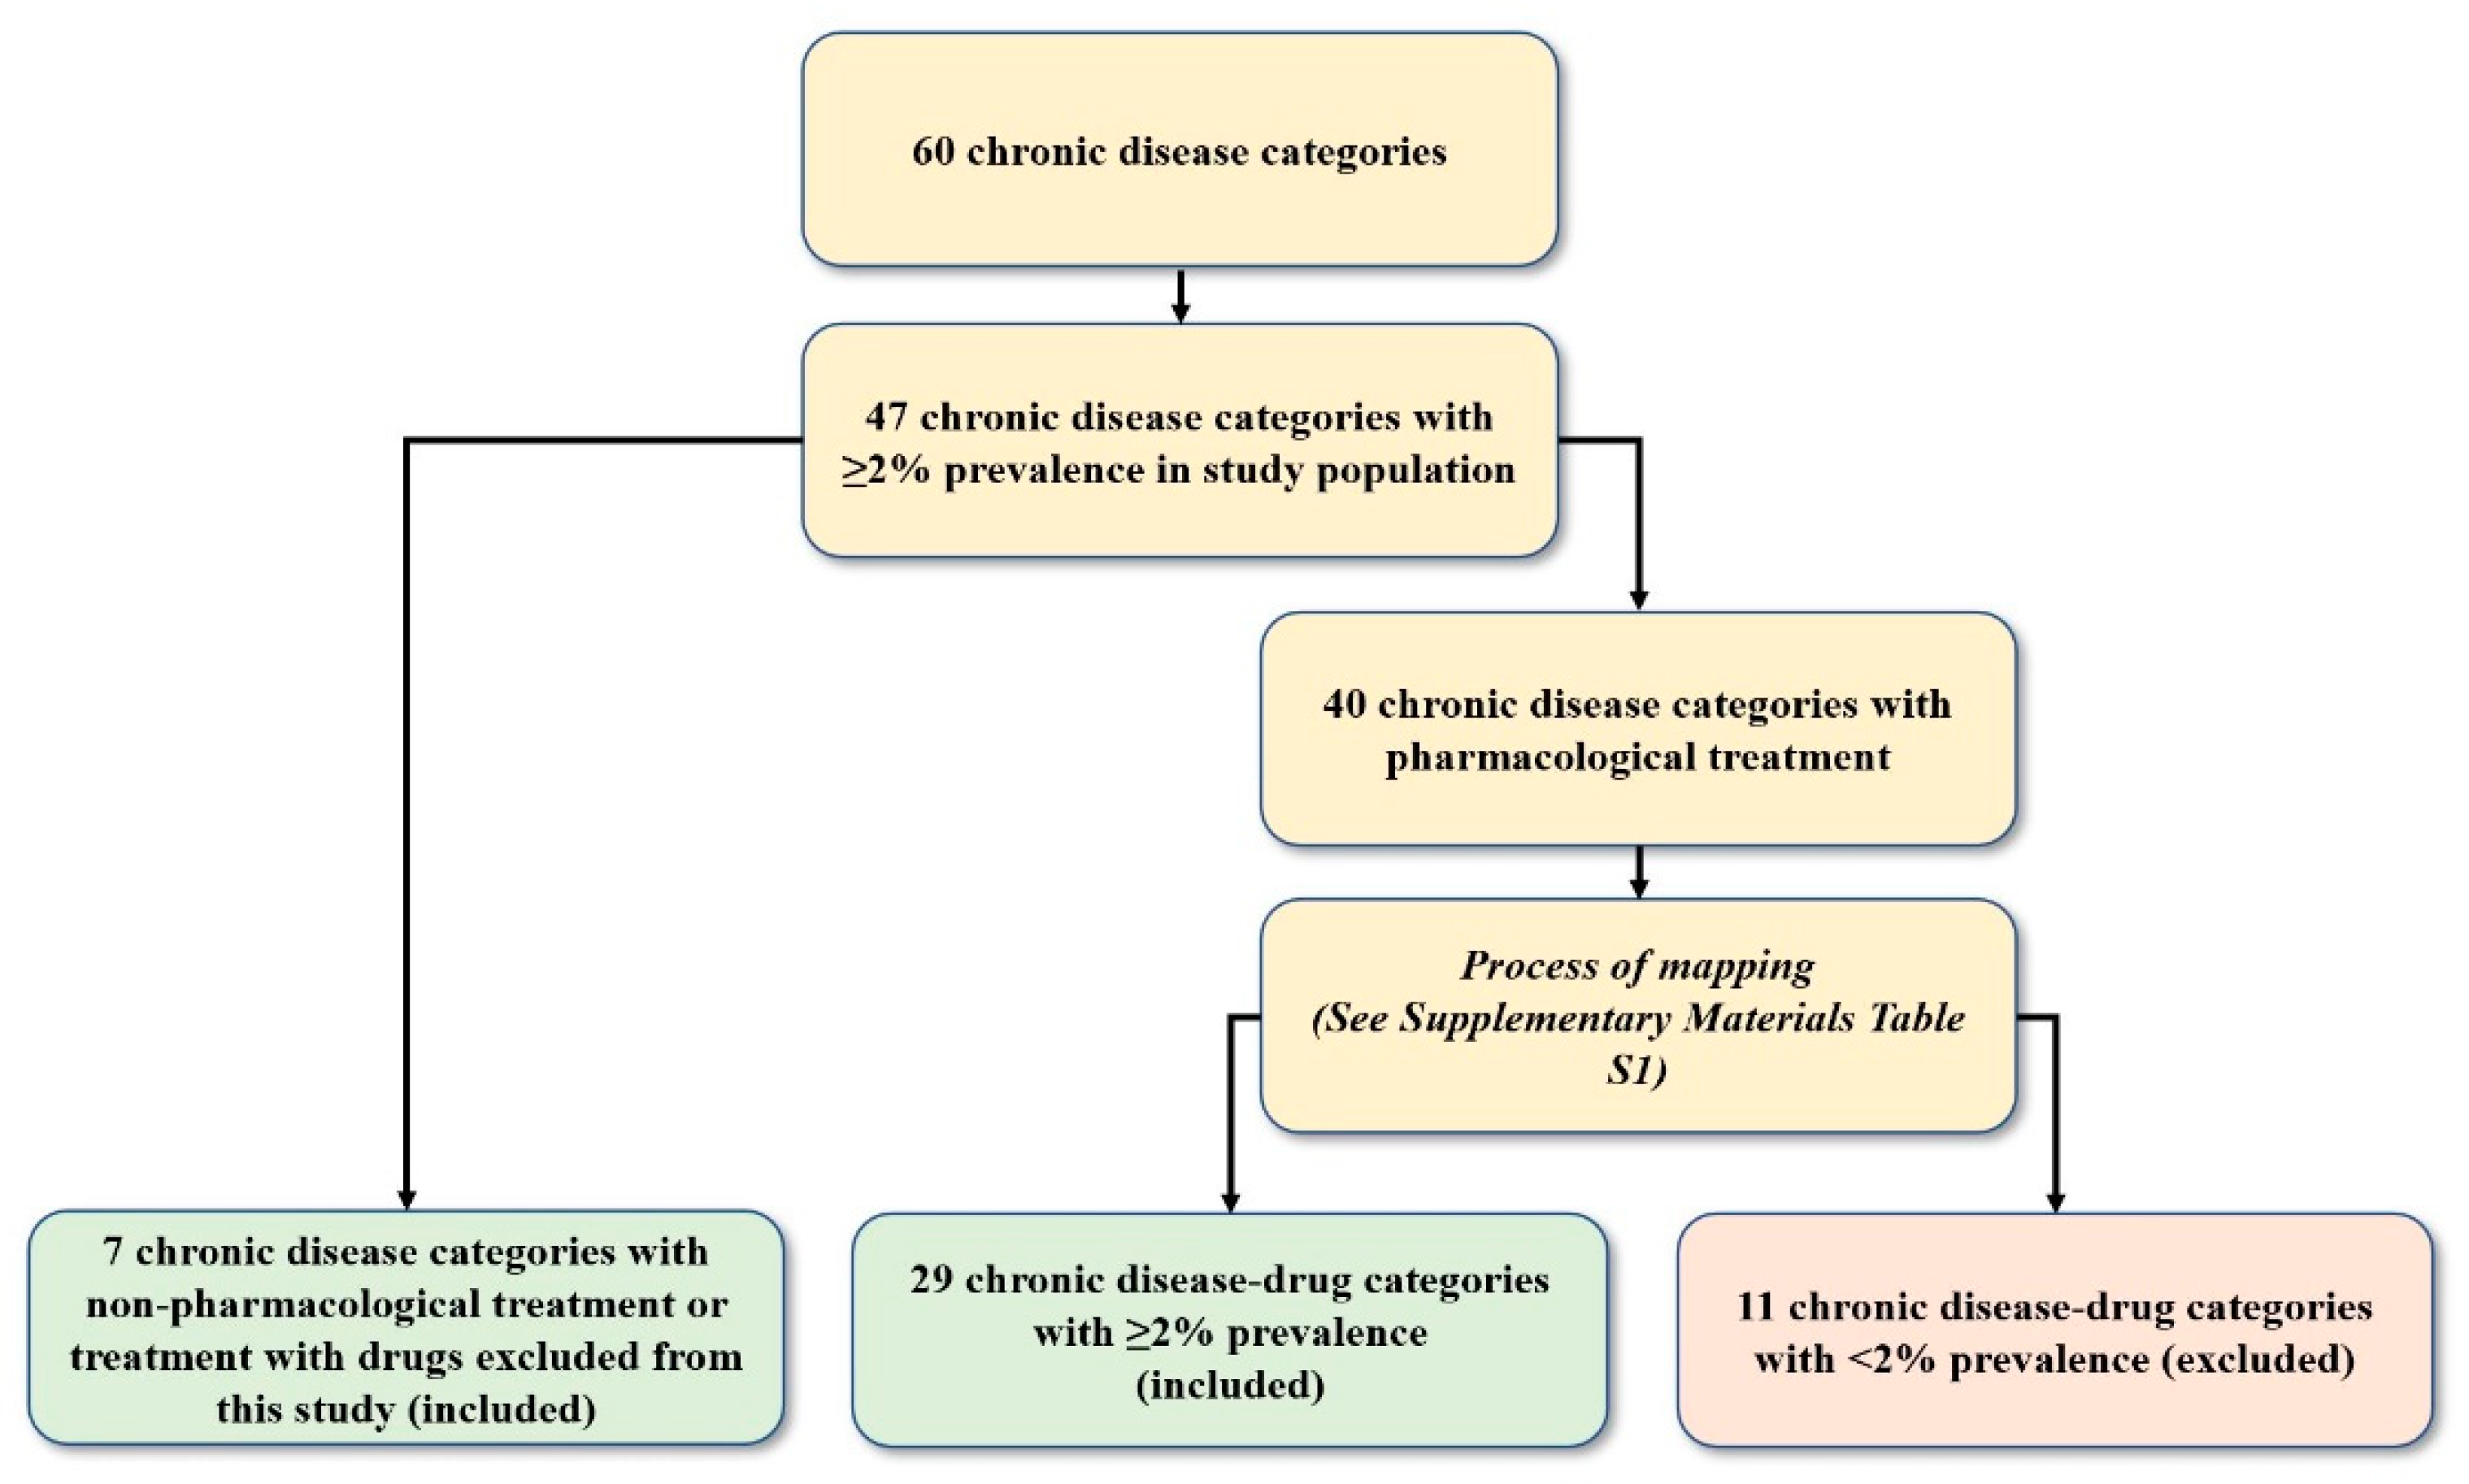
2.3.1. Chronic Diseases and Multimorbidity
2.3.2. Drugs and Classification
2.3.3. Grouping of Drugs and Mapping to Chronic Diseases
2.3.4. Other Variables
2.4. Statistical Analysis
3. Results
4. Discussion
4.1. Key Results
4.2. Comparison to the Literature
4.3. Strengths and Limitations
5. Conclusions
Supplementary Materials
Author Contributions
Funding
Institutional Review Board Statement
Informed Consent Statement
Data Availability Statement
Acknowledgments
Conflicts of Interest
Appendix A

| Rank | Chronic Conditions | Frequency | Percentage (%) | Cut Off of 2% |
|---|---|---|---|---|
| 1 | Hypertension | 650,899 | 71.0 | |
| 2 | Dyslipidemia | 466,585 | 50.9 | |
| 3 | Osteoarthritis and other degenerative joint diseases | 300,803 | 32.8 | |
| 4 | Obesity | 262,888 | 28.7 | |
| 5 | Diabetes | 230,460 | 25.1 | |
| 6 | Anemia | 167,577 | 18.3 | |
| 7 | Cataract and other lens diseases | 156,622 | 17.1 | |
| 8 | Chronic kidney diseases | 153,756 | 16.8 | |
| 9 | Prostate diseases | 153,635 | 16.8 | |
| 10 | Osteoporosis | 151,847 | 16.6 | |
| 11 | Depression and mood diseases | 148,751 | 16.2 | |
| 12 | Solid neoplasms | 137,045 | 15.0 | |
| 13 | Colitis and related diseases | 131,512 | 14.4 | |
| 14 | Venous and lymphatic diseases | 126,997 | 13.9 | |
| 15 | Other musculoskeletal and joint diseases | 124,765 | 13.6 | |
| 16 | Dorsopathies | 124,603 | 13.6 | |
| 17 | Neurotic, stress-related and somatoform diseases | 123,395 | 13.5 | |
| 18 | COPD, emphysema, chronic bronchitis | 109,603 | 12.0 | |
| 19 | Ischemic heart disease | 95,434 | 10.4 | |
| 20 | Deafness, hearing impairment | 90,261 | 9.9 | |
| 21 | Sleep disorders | 88,739 | 9.7 | |
| 22 | Thyroid diseases | 88,445 | 9.7 | |
| 23 | Other genitourinary diseases | 85,468 | 9.3 | |
| 24 | Cerebrovascular disease | 80,264 | 8.8 | |
| 25 | Atrial fibrillation | 80,247 | 8.8 | |
| 26 | Esophagus, stomach and duodenum diseases | 80,043 | 8.7 | |
| 27 | Heart failure | 74,077 | 8.1 | |
| 28 | Other eye diseases | 68,939 | 7.5 | |
| 29 | Glaucoma | 66,162 | 7.2 | |
| 30 | Inflammatory arthropathies | 62,450 | 6.8 | |
| 31 | Dementia | 59,213 | 6.5 | |
| 32 | Cardiac valve diseases | 52,100 | 5.7 | |
| 33 | Peripheral neuropathy | 49,127 | 5.4 | |
| 34 | Other psychiatric and behavioral diseases | 46,841 | 5.1 | |
| 35 | Asthma | 43,663 | 4.8 | |
| 36 | Allergy | 40,394 | 4.4 | |
| 37 | Autoimmune diseases | 39,350 | 4.3 | |
| 38 | Ear, nose, throat diseases | 38,752 | 4.2 | |
| 39 | Peripheral vascular disease | 30,674 | 3.4 | |
| 40 | Other neurological diseases | 28,541 | 3.1 | |
| 41 | Chronic pancreas, biliary tract and gallbladder diseases | 27,321 | 3.0 | |
| 42 | Migraine and facial pain syndromes | 25,999 | 2.8 | |
| 43 | Bradycardias and conduction diseases | 25,476 | 2.8 | |
| 44 | Chronic liver diseases | 22,633 | 2.5 | |
| 45 | Other digestive diseases | 22,022 | 2.4 | |
| 46 | Parkinson and parkinsonism | 20,833 | 2.3 | |
| 47 | Other metabolic diseases | 18,997 | 2.1 | |
| 48 | Other cardiovascular diseases | 16,833 | 1.8 | |
| 49 | Other skin diseases | 15,363 | 1.7 | |
| 50 | Chronic ulcer of the skin | 13,869 | 1.5 | |
| 51 | Blood and blood forming organ diseases | 13,575 | 1.5 | |
| 52 | Other respiratory diseases | 9974 | 1.1 | |
| 53 | Epilepsy | 8981 | 1.0 | |
| 54 | Hematological neoplasms | 8174 | 0.9 | |
| 55 | Chronic infectious diseases | 6647 | 0.7 | |
| 56 | Inflammatory bowel diseases | 5549 | 0.6 | |
| 57 | Schizophrenia and delusional diseases | 4792 | 0.5 | |
| 58 | Blindness, visual impairment | 4772 | 0.5 | |
| 59 | Multiple sclerosis | 576 | 0.1 | |
| 60 | Chromosomal abnormalities | 77 | 0.0 |
| Rank | ATC-5 Code | Medication Categories | Frequency | Percentage (%) |
|---|---|---|---|---|
| 1 | A02BC | Proton pump inhibitors | 405,942 | 44.29 |
| 2 | C10AA | HMG CoA reductase inhibitors | 349,676 | 38.15 |
| 3 | N02BE | Anilides | 260,018 | 28.37 |
| 4 | B01AC | Platelet aggregation inhibitors excl. heparin | 234,306 | 25.56 |
| 5 | N05BA | Benzodiazepine derivatives | 191,870 | 20.93 |
| 6 | C09AA | ACE inhibitors, plain | 182,906 | 19.95 |
| 7 | A10BA | Biguanides | 119,955 | 13.09 |
| 8 | C08CA | Dihydropyridine derivatives | 116,713 | 12.73 |
| 9 | N06AB | Selective serotonin reuptake inhibitors | 116,497 | 12.71 |
| 10 | C07AB | Beta blocking agents, selective | 102,442 | 11.18 |
| 11 | C03CA | Sulfonamides, plain | 101,933 | 11.12 |
| 12 | C09CA | Angiotensin II antagonists, plain | 99,742 | 10.88 |
| 13 | A12AX | Calcium, combinations with vitamin D and/or other drugs | 93,581 | 10.21 |
| 14 | C03AA | Thiazides, plain | 86,414 | 9.43 |
| 15 | C09DA | Angiotensin II antagonists and diuretics | 80,115 | 8.74 |
| 16 | M01AE | Propionic acid derivatives | 79,393 | 8.66 |
| 17 | C09BA | ACE inhibitors and diuretics | 74,494 | 8.13 |
| 18 | G04CA | Alpha-adrenoreceptor antagonists | 71,028 | 7.75 |
| 19 | B01AA | Vitamin K antagonists | 62,331 | 6.80 |
| 20 | M05BA | Bisphosphonates | 62,313 | 6.80 |
| 21 | R03BB | Anticholinergics | 53,159 | 5.80 |
| 22 | N05CD | Benzodiazepine derivatives | 52,859 | 5.77 |
| 23 | A10BB | Sulfonylureas | 50,812 | 5.54 |
| 24 | H03AA | Thyroid hormones | 50,699 | 5.53 |
| 25 | R03AK | Adrenergics in combination with corticosteroids or other drugs, excl. anticholinergics | 50,644 | 5.53 |
| 26 | N02AX | Other opioids | 48,388 | 5.28 |
| 27 | M04AA | Preparations inhibiting uric acid production | 47,629 | 5.20 |
| 28 | N06AX | Other antidepressants | 45,357 | 4.95 |
| 29 | R03AC | Selective beta-2-adrenoreceptor agonists | 43,972 | 4.80 |
| 30 | S01ED | Beta blocking agents | 42,513 | 4.64 |
| 31 | C01DA | Organic nitrates | 41,674 | 4.55 |
| 32 | S01EE | Prostaglandin analogues | 40,643 | 4.43 |
| 33 | N03AX | Other antiepileptics | 37,873 | 4.13 |
| 34 | B03AA | Iron bivalent, oral preparations | 35,13 | 3.83 |
| 35 | M01AX | Other anti-inflammatory and antirheumatic agents, non-steroids | 34,490 | 3.76 |
| 36 | M01AB | Acetic acid derivatives and related substances | 30,848 | 3.37 |
| 37 | N02BB | Pyrazolones | 30,600 | 3.34 |
| 38 | C02CA | Alpha-adrenoreceptor antagonists | 26,333 | 2.87 |
| 39 | N07CA | Antivertigo preparations | 25,290 | 2.76 |
| 40 | C01EB | Other cardiac preparations | 24,272 | 2.65 |
| 41 | G04BD | Drugs for urinary frequency and incontinence | 23,646 | 2.58 |
| 42 | D01AC | Imidazole and triazole derivatives | 23,459 | 2.56 |
| 43 | A03FA | Propulsives | 22,461 | 2.45 |
| 44 | A10AE | Insulins and analogues for injection, long-acting | 21,678 | 2.36 |
| 45 | H02AB | Glucocorticoids | 21,493 | 2.34 |
| 46 | C01AA | Digitalis glycosides | 21,190 | 2.31 |
| 47 | D07AC | Corticosteroids, potent (Group III) | 20,599 | 2.25 |
| 48 | G04CB | Testosterone-5-alpha reductase inhibitors | 19,379 | 2.11 |
| 49 | N06DA | Anticholinesterases | 19,366 | 2.11 |
| 50 | C08DB | Benzothiazepine derivatives | 19,211 | 2.10 |
| 51 | R03BA | Glucocorticoids | 19,143 | 2.09 |
| 52 | R06AX | Other antihistamines for systemic use | 18,609 | 2.03 |
| 53 | C07AG | Alpha and beta blocking agents | 18,198 | 1.99 |
| 54 | A02BA | H2-receptor antagonists | 18,158 | 1.98 |
| 55 | C03BA | Sulfonamides, plain | 17,998 | 1.96 |
| 56 | C10AB | Fibrates | 17,874 | 1.95 |
| 57 | N05CF | Benzodiazepine related drugs | 17,914 | 1.95 |
| 58 | G03CA | Natural and semisynthetic estrogens, plain | 16,513 | 1.80 |
| 59 | C03DA | Aldosterone antagonists | 16,367 | 1.79 |
| 60 | N06DX | Other anti-dementia drugs | 16,292 | 1.78 |
| 61 | A10BD | Combinations of oral blood glucose lowering drugs | 15,397 | 1.68 |
| 62 | N06AA | Non-selective monoamine reuptake inhibitors | 15,364 | 1.68 |
| 63 | N05AH | Diazepines, oxazepines, thiazepines and oxepines | 14,249 | 1.55 |
| 64 | R01AD | Corticosteroids | 13,880 | 1.51 |
| 65 | G04CX | Other drugs used in benign prostatic hypertrophy | 13,684 | 1.49 |
| 66 | J01MA | Fluoroquinolones | 13,610 | 1.48 |
| 67 | C03EA | Low-ceiling diuretics and potassium-sparing agents | 13,179 | 1.44 |
| 68 | A10BX | Other blood glucose lowering drugs, excl. insulins | 12,933 | 1.41 |
| 69 | A12AA | Calcium | 12,809 | 1.40 |
| 70 | C09DB | Angiotensin II antagonists and calcium channel blockers | 12,698 | 1.39 |
| 71 | A12BA | Potassium | 12,625 | 1.38 |
| 72 | J01CR | Combinations of penicillins, incl. beta-lactamase inhibitors | 12,658 | 1.38 |
| 73 | C04AD | Purine derivatives | 12,589 | 1.37 |
| 74 | C10AX | Other lipid modifying agents | 12,579 | 1.37 |
| 75 | M01AH | Coxibs | 12,537 | 1.37 |
| 76 | N04BA | Dopa and dopa derivatives | 12,280 | 1.34 |
| 77 | D01AE | Other antifungals for topical use | 11,514 | 1.26 |
| 78 | A11CC | Vitamin D and analogues | 11,262 | 1.23 |
| 79 | A10AD | Insulins and analogues for injection, intermediate- or long-acting combined with fast-acting | 11,056 | 1.21 |
| 80 | A10AC | Insulins and analogues for injection, intermediate-acting | 10,925 | 1.19 |
| 81 | N02AB | Phenylpiperidine derivatives | 10,802 | 1.18 |
| 82 | B03BA | Vitamin B12 (cyanocobalamin and analogues) | 10,613 | 1.16 |
| 83 | C01BD | Antiarrhythmics, class III | 10,511 | 1.15 |
| 84 | N05AX | Other antipsychotics | 10,404 | 1.14 |
| 85 | C07AA | Beta blocking agents, non-selective | 10,231 | 1.12 |
| 86 | S01EC | Carbonic anhydrase inhibitors | 9737 | 1.06 |
| 87 | B03AB | Iron trivalent, oral preparations | 9504 | 1.04 |
| 88 | N03AE | Benzodiazepine derivatives | 9211 | 1.00 |
| 89 | M05BX | Other drugs affecting bone structure and mineralization | 7652 | 0.83 |
| ALLERGY | |||
|---|---|---|---|
| ICD-10 codes and labels included in chronic disease category | ATC-5 codes and labels for drugs associated to chronic disease category. Includes none or any of the following: | ||
| J301 | Allergic rhinitis due to pollen | R01AD | Corticosteroids (nasal use) |
| J302 | Other seasonal allergic rhinitis | R03AC | Selective beta-2-adrenoreceptor agonists |
| J303 | Other allergic rhinitis | R03AK | Adrenergics in combination with corticosteroids or other drugs, excl. anticholinergics |
| J304 | Allergic rhinitis, unspecified | R03BA | Glucocorticoids (inhalation) |
| J450 | Predominantly allergic asthma | R03BB | Anticholinergics |
| K522 | Allergic and dietetic gastroenteritis and colitis | R06AX | Other antihistamines for systemic use |
| L20 | Atopic dermatitis | D07AC | Corticosteroids, potent (Group III) (topical use) |
| L23 | Allergic contact dermatitis | ||
| L500 | Allergic urticaria | ||
| Z516 | Desensitization to allergens | ||
| ANEMIA | |||
| ICD-10 codes and labels included in chronic disease category | ATC-5 codes and labels for drugs associated to chronic disease category. Includes none or any of the following: | ||
| D50 | Iron deficiency anaemia | B03AA | Iron bivalent, oral preparations |
| D51 | Vitamin B12 deficiency anaemia | B03AB | Iron trivalent, oral preparations |
| D52 | Folate deficiency anaemia | B03BA | Vitamin B12 (cyanocobalamin and analogues) |
| D53 | Other nutritional anaemias | H02AB | Glucocorticoids (systemic use, plain) |
| D55 | Anaemia due to enzyme disorders | ||
| D56 | Thalassaemia | ||
| D57 | Sickle-cell disorders | ||
| D58 | Other hereditary haemolytic anaemias | ||
| D59 | Acquired haemolytic anaemia | ||
| D60 | Acquired pure red cell aplasia [erythroblastopenia] | ||
| D61 | Other aplastic anaemias | ||
| D63 | Anaemia in chronic diseases classified elsewhere | ||
| D64 | Other anaemias | ||
| 1. Non-Specific | 2. Diabetes | 3. Neurological and Musculoskeletal, Female Dominant | 4. Behavioral, Neurological, and Musculoskeletal, Female Dominant | 5. Cardio- Cerebrovascular and Renal | 6. Cardiovascular, Renal, Inflammatory, and Respiratory | 7. Multisystem | Study Population (All) | |
|---|---|---|---|---|---|---|---|---|
| Number of people, n | 344,958 | 178,457 | 102,750 | 90,287 | 80,855 | 69,720 | 49,592 | 916,619 |
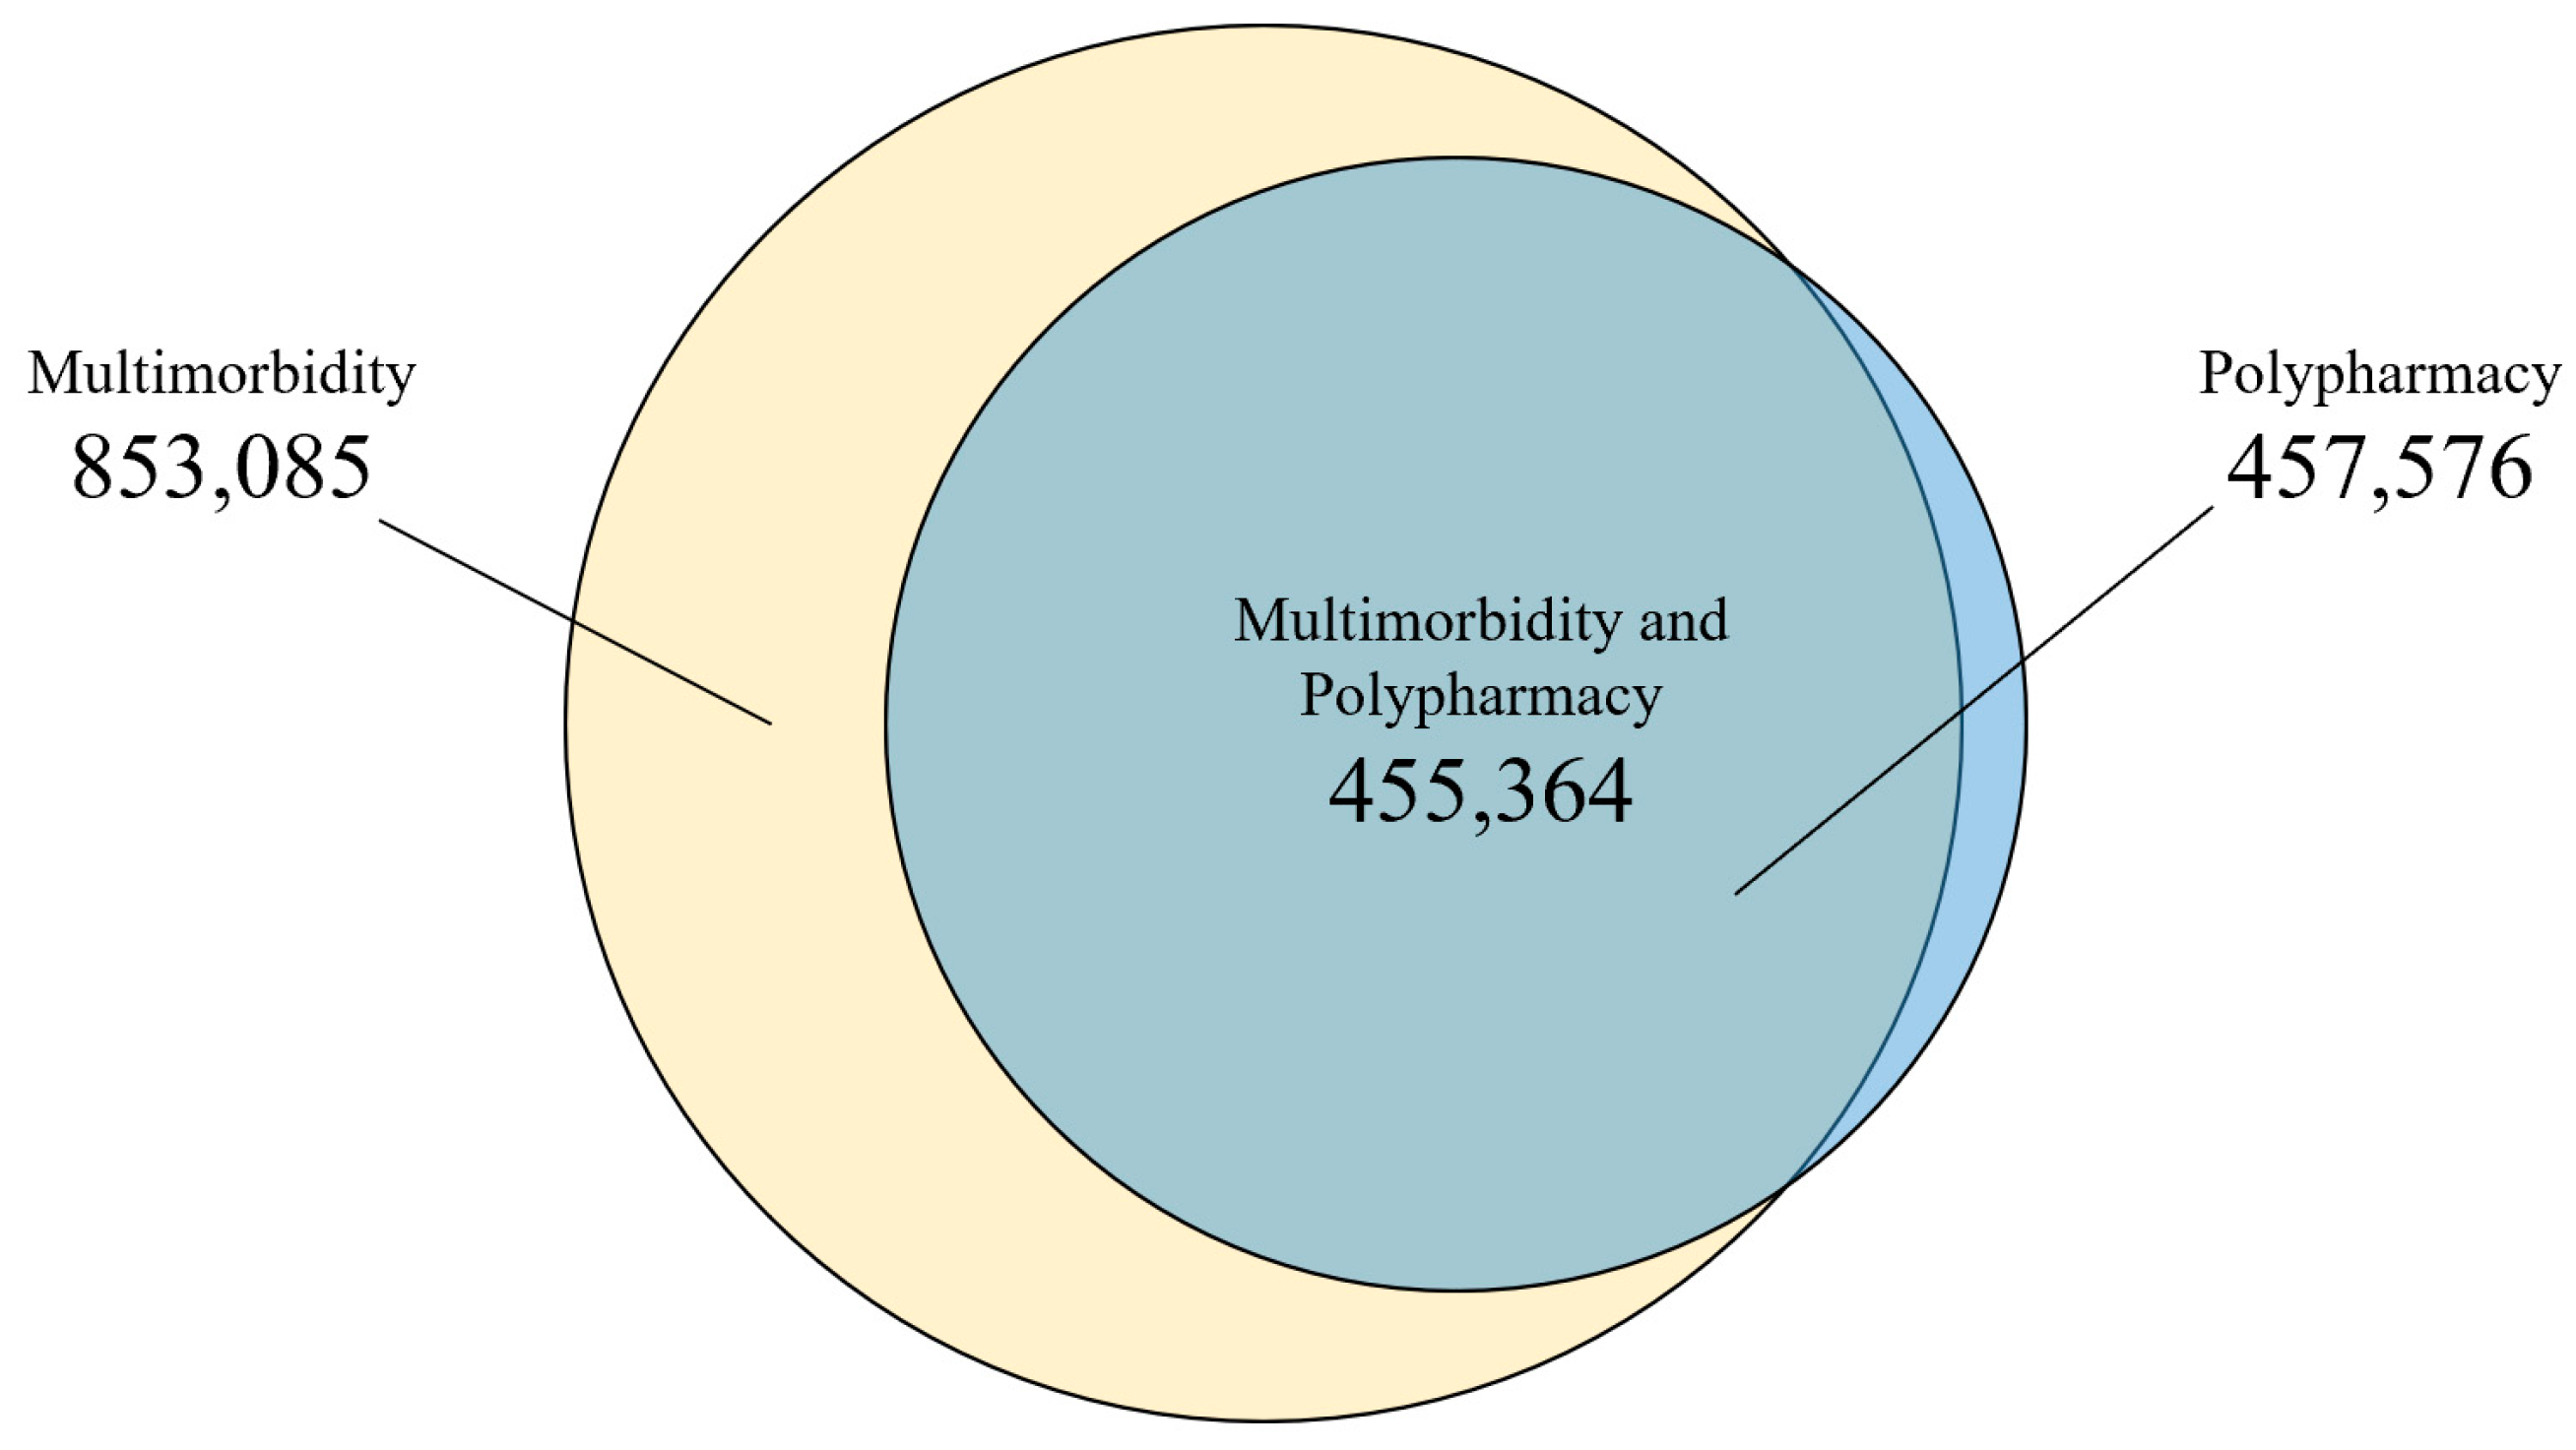
| Multimorbidity, n (%) | 281,952 (81.74) | 178,412 (99.97) | 102,629 (99.88) | 90,245 (99.95) | 80,819 (99.96) | 69,680 (99.94) | 49,347 (99.51) | 853,084 (93.07) |
| Polypharmacy, n (%) | 53,070 (15.38) | 105,323 (59.02) | 69,503 (67.64) | 68,276 (75.62) | 67,635 (83.65) | 58,245 (83.54) | 35,523 (71.63) | 457,575 (49.92) |
| Women, n (%) | 187,691 (54.41) | 98,251 (55.06) | 70,946 (69.05) | 67,785 (75.08) | 39,649 (49.04) | 35,130 (50.39) | 29,679 (59.85) | 529,131 (57.73) |
| Men, n (%) | 157,267 (45.59) | 80,206 (44.94) | 31,803 (30.95) | 22,502 (24.92) | 41,207 (50.96) | 34,590 (49.61) | 19,913 (40.15) | 387,488 (42.27) |
| Age, mean (SD) | 74.28 (7.47) | 74.61 (6.86) | 75.82 (7.07) | 75.43 (7.06) | 77.06 (7.34) | 78.47 (7.30) | 78.27 (7.52) | 75.41 (7.39) |
| Age (categories), n (%) | ||||||||
| [65,70) | 119,921 (34.76) | 51,741 (28.99) | 24,050 (23.41) | 23,121 (25.61) | 15,649 (19.35) | 9796 (14.05) | 7901 (15.93) | 252,178 (27.51) |
| [70,80) | 140,724 (40.79) | 83,142 (46.59) | 47,314 (46.05) | 41,082 (45.5) | 34,708 (42.93) | 28,197 (40.44) | 19,419 (39.16) | 394,586 (43.05) |
| [80,90) | 71,317 (20.67) | 39,345 (22.05) | 27,970 (27.22) | 23,398 (25.92) | 26,574 (32.87) | 27,204 (39.02) | 18,936 (38.18) | 234,744 (25.61) |
| [90,99] | 12,997 (3.77) | 4229 (2.37) | 3416 (3.32) | 2686 (2.97) | 3924 (4.85) | 4524 (6.49) | 3336 (6.73) | 35,111 (3.83) |
| MEDEA * index, n (%) | ||||||||
| R | 71,007 (21.98) | 35,761 (21.22) | 18,739 (19.54) | 16,239 (19.34) | 15,426 (21.01) | 14,514 (23.28) | 10,563 (23.83) | 182,249 (19.88) |
| U1 | 63,526 (19.67) | 25,114 (14.90) | 14,580 (15.20) | 13,131 (15.64) | 11,684 (15.91) | 9413 (15.10) | 7344 (16.57) | 144,792 (15.80) |
| U2 | 53,337 (16.51) | 26,606 (15.79) | 15,239 (15.89) | 13,307 (15.85) | 11,546 (15.72) | 9563 (15.34) | 6832 (15.41) | 136,430 (14.88) |
| U3 | 51,420 (15.92) | 28,004 (16.62) | 15,988 (16.67) | 13,976 (16.64) | 11,928 (16.24) | 9839 (15.78) | 7068 (15.94) | 138,223 (15.08) |
| U4 | 46,598 (14.43) | 28,059 (16.65) | 16,264 (16.96) | 14,066 (16.75) | 11,795 (16.06) | 9726 (15.60) | 6480 (14.62) | 132,988 (14.51) |
| U5 | 37,128 (11.49) | 24,998 (14.83) | 15,109 (15.75) | 13,264 (15.79) | 11,050 (15.05) | 9290 (14.90) | 6043 (13.63) | 116,882 (12.75) |
| Number of chronic diseases, median [IQR] | 3 [2–5] | 6 [4–7] | 7 [5–9] | 8 [6–10] | 8 [6–10] | 8 [6–10] | 7 [6–10] | 6 [4–8] |
| Number of chronic diseases (categories), n (%) | ||||||||
| 0 | 25,380 (7.36) | 0 (0) | 0 (0) | 0 (0) | 0 (0) | 0 (0) | 0 (0) | 25,380 (2.77) |
| 1 | 37,626 (10.91) | 45 (0.03) | 121 (0.12) | 42 (0.05) | 36 (0.04) | 40 (0.06) | 244 (0.49) | 38,154 (4.16) |
| [2,5) | 176,529 (51.17) | 50,912 (28.53) | 12,934 (12.59) | 7896 (8.75) | 7990 (9.88) | 6133 (8.8) | 6441 (12.99) | 268,836 (29.33) |
| [5,10) | 99,930 (28.97) | 114,840 (64.35) | 67,586 (65.78) | 58,154 (64.41) | 51,082 (63.18) | 42,058 (60.32) | 30,059 (60.61) | 463,709 (50.59) |
| ≥10 | 5493 (1.59) | 12,660 (7.09) | 22,109 (21.52) | 24,195 (26.8) | 21,747 (26.9) | 21,489 (30.82) | 12,847 (25.91) | 120,540 (13.15) |
| Number of medications, median [IQR] | 2 [0–3] | 5 [3–7] | 6 [4–8] | 6 [5–9] | 7 [5–9] | 7 [5–10] | 6 [4–9] | 4 [2–7] |
| Number of medications, (categories), n (%) | ||||||||
| 0 | 113,702 (32.96) | 536 (0.3) | 1414 (1.38) | 132 (0.15) | 24 (0.03) | 180 (0.26) | 1801 (3.63) | 117,789 (12.85) |
| 1 | 50,694 (14.7) | 5232 (2.93) | 3057 (2.97) | 1282 (1.42) | 581 (0.72) | 602 (0.86) | 1364 (2.75) | 62,812 (6.85) |
| [2,5) | 127,492 (36.96) | 67,366 (37.75) | 28,777 (28.01) | 20,597 (22.81) | 12,615 (15.6) | 10,692 (15.34) | 10,904 (21.99) | 278,442 (30.38) |
| [5,10) | 50,510 (14.64) | 90,914 (50.94) | 55,102 (53.63) | 52,401 (58.04) | 47,710 (59.01) | 38,927 (55.83) | 25,494 (51.41) | 361,058 (39.39) |
| ≥10 | 2560 (0.74) | 14,410 (8.07) | 14,401 (14.02) | 15,875 (17.58) | 19,924 (24.64) | 19,318 (27.71) | 10,029 (20.22) | 96,518 (10.53) |
| Number of visits 2012, median [IQR] | 6 [2–10] | 10 [6–16] | 12 [7–18] | 12 [7–19] | 14 [8–23] | 18 [10–29] | 13 [7–23] | 9 [5–16] |
| Number of visits 2012 (categories), n (%) | ||||||||
| 0 | 44,954 (13.03) | 825 (0.46) | 637 (0.62) | 317 (0.35) | 242 (0.3) | 204 (0.29) | 766 (1.54) | 47,945 (5.23) |
| 1 | 25,389 (7.36) | 3155 (1.77) | 1463 (1.42) | 1213 (1.34) | 1026 (1.27) | 683 (0.98) | 954 (1.92) | 33,884 (3.7) |
| [2,5) | 75,895 (22) | 20,685 (11.59) | 9889 (9.62) | 8168 (9.05) | 6708 (8.3) | 4336 (6.22) | 4759 (9.6) | 130,439 (14.23) |
| [5,10) | 101,438 (29.41) | 56,518 (31.67) | 27,564 (26.83) | 22,805 (25.26) | 18,077 (22.36) | 11,938 (17.12) | 11,008 (22.2) | 249,349 (27.2) |
| ≥10 | 97,283 (28.2) | 97,274 (54.51) | 63,197 (61.51) | 57,783 (64) | 54,802 (67.78) | 52,558 (75.38) | 32,105 (64.74) | 455,002 (49.64) |
References
- The World Bank. Life Expectancy at Birth, Total (Years). Available online: https://data.worldbank.org/indicator/SP.DYN.LE00.IN (accessed on 10 March 2021).
- Partridge, L.; Deelen, J.; Slagboom, P.E. Facing up to the global challenges of ageing. Nature 2018, 561, 45–56. [Google Scholar] [CrossRef] [PubMed]
- Murray, C.J.L.; Barber, R.M.; Foreman, K.J.; Ozgoren, A.A.; Abd-Allah, F.; Abera, S.F.; Aboyans, V.; Abraham, J.P.; Abubakar, I.; Abu-Raddad, L.J.; et al. Global, regional, and national disability-adjusted life years (DALYs) for 306 diseases and injuries and healthy life expectancy (HALE) for 188 countries, 1990–2013: Quantifying the epidemiological transition. Lancet 2015, 386, 2145–2191. [Google Scholar] [CrossRef] [Green Version]
- Strom, B.L.; Kimmel, S.E.; Hennessy, S. (Eds.) Basic principles of clinical pharmacology relevant to pharmacoepidemiologic studies. In Pharmacoepidemiology, 5th ed.; John Wiley & Sons: Hoboken, NJ, USA, 2011; pp. 23–37. [Google Scholar]
- MacMahon, S.; Calverley, P.; Chaturvedi, N.; Chen, Z.; Corner, L.; Davies, M.; Ezzati, M.; Guthrie, B.; Hanson, K.; Jha, V.; et al. Multimorbidity: A Priority for Global Health Research; The Academy of Medical Sciences: London, UK, 2018; p. 6. [Google Scholar]
- Cahir, C.; Fahey, T.; Teeling, M.; Teljeur, C.; Feely, J.; Bennett, K. Potentially inappropriate prescribing and cost outcomes for older people: A national population study. Br. J. Clin. Pharmacol. 2010, 69, 543–552. [Google Scholar] [CrossRef] [PubMed] [Green Version]
- Masnoon, N.; Shakib, S.; Kalisch-Ellett, L.; Caughey, G.E.; Masnoon, N.; Shakib, S.; Kalisch-Ellett, L.; Caughey, G.E. What is polypharmacy? A systematic review of definitions. BMC Geriatr. 2017, 17, 1–10. [Google Scholar] [CrossRef] [Green Version]
- Khezrian, M.; McNeil, C.J.; Murray, A.; Myint, P.K. An overview of prevalence, determinants and health outcomes of polypharmacy. Ther. Adv. Drug Saf. 2020, 11. [Google Scholar] [CrossRef]
- Thorell, K.; Midlöv, P.; Fastbom, J.; Halling, A. Use of potentially inappropriate medication and polypharmacy in older adults: A repeated cross-sectional study. BMC Geriatr. 2020, 20, 1–9. [Google Scholar] [CrossRef] [Green Version]
- Maher, R.L.; Hanlon, J.; Hajjar, E.R. Clinical consequences of polypharmacy in elderly. Expert Opin. Drug Saf. 2013, 13, 57–65. [Google Scholar] [CrossRef] [PubMed] [Green Version]
- Wastesson, J.W.; Morin, L.; Tan, E.; Johnell, K. An update on the clinical consequences of polypharmacy in older adults: A narrative review. Expert Opin. Drug Saf. 2018, 17, 1185–1196. [Google Scholar] [CrossRef] [PubMed] [Green Version]
- Cullinan, S.; O’Mahony, D.; O’Sullivan, D.; Byrne, S. Use of a frailty index to identify potentially inappropriate prescribing and adverse drug reaction risks in older patients. Age Ageing 2015, 45, 115–120. [Google Scholar] [CrossRef] [Green Version]
- Leelakanok, N.; Holcombe, A.L.; Lund, B.C.; Gu, X.; Schweizer, M. Association between polypharmacy and death: A systematic review and meta-analysis. J. Am. Pharm. Assoc. 2017, 57, 729–738. [Google Scholar] [CrossRef]
- Gutiérrez-Valencia, M.; Herce, P.A.; Lacalle-Fabo, E.; Escámez, B.C.; Veloz, B.A.C.; Martínez-Velilla, N. Prevalencia de polifarmacia y factores asociados en adultos mayores en España: Datos de la Encuesta Nacional de Salud 2017. Med. Clin. 2019, 153, 141–150. [Google Scholar] [CrossRef]
- Forslund, T.; Carlsson, A.C.; Ljunggren, G.; Ärnlöv, J.; Wachtler, C. Patterns of multimorbidity and pharmacotherapy: A total population cross-sectional study. Fam. Pr. 2020, 38, 132–139. [Google Scholar] [CrossRef] [PubMed]
- Villén, N.; Guisado-Clavero, M.; Fernández-Bertolín, S.; Troncoso-Mariño, A.; Foguet-Boreu, Q.; Amado, E.; Pons-Vigués, M.; Roso-Llorach, A.; Violán, C. Multimorbidity patterns, polypharmacy and their association with liver and kidney abnormalities in people over 65 years of age: A longitudinal study. BMC Geriatr. 2020, 20, 1–13. [Google Scholar] [CrossRef]
- Prados-Torres, A.; Calderón-Larrañaga, A.; Hancco-Saavedra, J.; Poblador-Plou, B.; Akker, M.V.D. Multimorbidity patterns: A systematic review. J. Clin. Epidemiol. 2014, 67, 254–266. [Google Scholar] [CrossRef]
- McCarthy, C.; Moriarty, F.; Wallace, E.; Smith, S.M.; Barbara Clyne for the SPPiRE Study Team. The evolution of an evidence based intervention designed to improve prescribing and reduce polypharmacy in older people with multimorbidity and significant polypharmacy in primary care (SPPiRE). J. Comorb. 2020, 10, 32974211. [Google Scholar] [CrossRef]
- Chang, T.I.; Park, H.; Kim, D.W.; Jeon, E.K.; Rhee, C.M.; Kalantar-Zadeh, K.; Kang, E.W.; Kang, S.-W.; Han, S.H. Polypharmacy, hospitalization, and mortality risk: A nationwide cohort study. Sci. Rep. 2020, 10, 1–9. [Google Scholar] [CrossRef]
- Wolfram. Fuzzy Clustering. Available online: https://reference.wolfram.com/legacy/applications/fuzzylogic/Manual/12.html (accessed on 31 July 2021).
- Statistical Institute of Catalonia. Population on 1 January. Provinces. Available online: https://www.idescat.cat/pub/?id=aec&n=245&lang=en (accessed on 3 March 2021).
- Royal Decree-Law 16/2012, of April 20th, Regarding Urgent Measures to Guarantee the Sustainability of the National Health System and to Improve the Quality and Security of its Provisions. Available online: https://www.boe.es/eli/es/rdl/2012/04/20/16 (accessed on 4 March 2021).
- Catalan Health Institute. The CHI. Available online: http://ics.gencat.cat/es/lics/ (accessed on 4 March 2021).
- García-Gil, M.D.M.; Hermosilla, E.; Prieto-Alhambra, D.; Fina, F.; Rosell, M.; Ramos, R.; Rodriguez, J.; Williams, T.; van Staa, T.; Bolibar, B. Construction and validation of a scoring system for the selection of high-quality data in a Spanish population primary care database (SIDIAP). J. Innov. Health Inform. 2011, 19, 135–145. [Google Scholar] [CrossRef]
- Calderón-Larrañaga, A.; Vetrano, D.L.; Onder, G.; Feliu, L.A.G.; Coscollar-Santaliestra, C.; Carfí, A.; Pisciotta, M.S.; Angleman, S.; Melis, R.J.; Santoni, G.; et al. Assessing and measuring chronic multimorbidity in the older population: A proposal for its operationalization. J. Gerontol. Ser. A 2016, 72, 1417–1423. [Google Scholar] [CrossRef]
- World Health Organization. The Anatomical Therapeutic Chemical Classification System with Defined Daily Doses (ATC/DDD). Available online: https://www.who.int/classifications/atcddd/en/ (accessed on 9 March 2021).
- UpToDate. Available online: https://www.uptodate.com/contents/search (accessed on 15 March 2021).
- BOT PLUS. Available online: https://botplusweb.portalfarma.com/botplus.aspx (accessed on 2 March 2021).
- CIMA. Available online: https://cima.aemps.es/cima/publico/home.html (accessed on 3 March 2021).
- Borrell, C.; Cano-Serral, G.; Esnaola, S.; Nolasco, A.; Pasarín, M.I.; Ramis, R.; Saurina, C.; Escolar-Pujolar, A. Constructing a deprivation index based on census data in large Spanish Cities. Gac. Sanit. 2008, 22, 179–187. [Google Scholar]
- Karlis, D.; Saporta, G.; Spinakis, A. A simple rule for the selection of principal components. Commun. Stat. Theory Methods 2003, 32, 643–666. [Google Scholar] [CrossRef]
- Bezdek, J.C.; Ehrlich, R.; Full, W. FCM: The fuzzy c-means clustering algorithm. Comput. Geosci. 1984, 10, 191–203. [Google Scholar] [CrossRef]
- Zhao, Q. Cluster Validity in Clustering Methods. Ph.D. Thesis, University of Eastern Finland, Joensuu, Finland, 25 June 2012. [Google Scholar]
- Violán, C.; Roso-Llorach, A.; Foguet-Boreu, Q.; Guisado-Clavero, M.; Pons-Vigués, M.; Pujol-Ribera, E.; Valderas, J.M. Multimorbidity patterns with K-means nonhierarchical cluster analysis. BMC Fam. Pr. 2018, 19, 1–11. [Google Scholar] [CrossRef]
- Violán, C.; Foguet-Boreu, Q.; Fernández-Bertolín, S.; Guisado-Clavero, M.; Cabrera-Bean, M.; Formiga, F.; Valderas, J.M.; Roso-Llorach, A. Soft clustering using real-world data for the identification of multimorbidity patterns in an elderly population: Cross-sectional study in a Mediterranean population. BMJ Open 2019, 9, e029594. [Google Scholar] [CrossRef] [Green Version]
- Vetrano, D.L.; Roso-Llorach, A.; Fernández, S.; Guisado-Clavero, M.; Violán, C.; Onder, G.; Fratiglioni, L.; Calderón-Larrañaga, A.; Marengoni, A. Twelve-year clinical trajectories of multimorbidity in a population of older adults. Nat. Commun. 2020, 11, 1–9. [Google Scholar] [CrossRef]
- Violán, C.; Foguet-Boreu, Q.; Flores-Mateo, G.; Salisbury, C.; Blom, J.; Freitag, M.; Glynn, L.; Muth, C.; Valderas, J.M. Prevalence, determinants and patterns of multimorbidity in primary care: A systematic review of observational studies. PLoS ONE 2014, 9, e102149. [Google Scholar] [CrossRef]
- Chobot, A.; Górowska-Kowolik, K.; Sokołowska, M.; Jarosz-Chobot, P. Obesity and diabetes—Not only a simple link between two epidemics. Diabetes Metab. Res. Rev. 2018, 34, e3042. [Google Scholar] [CrossRef] [Green Version]
- Becker, C.; Schneider, C.; Aballéa, S.; Bailey, C.; Bourne, R.; Jick, S.; Meier, C. Cataract in patients with diabetes mellitus—Incidence rates in the UK and risk factors. Eye 2018, 32, 1028–1035. [Google Scholar] [CrossRef] [PubMed] [Green Version]
- Giovannucci, E.; Harlan, D.M.; Archer, M.C.; Bergenstal, R.M.; Gapstur, S.M.; Habel, L.; Pollak, M.; Regensteiner, J.G.; Yee, D. Diabetes and cancer: A consensus report. Diabetes Care 2010, 33, 1674–1685. [Google Scholar] [CrossRef] [Green Version]
- Angum, F.; Khan, T.; Kaler, J.; Siddiqui, L.; Hussain, A. The prevalence of autoimmune disorders in women: A narrative review. Cureus 2020, 12, e8094. [Google Scholar] [CrossRef] [PubMed]
- Chen, W.; Thomas, J.; Sadatsafavi, M.; FitzGerald, J.M. Risk of cardiovascular comorbidity in patients with chronic obstructive pulmonary disease: A systematic review and meta-analysis. Lancet Respir. Med. 2015, 3, 631–639. [Google Scholar] [CrossRef]
- Iseme, R.; McEvoy, M.; Kelly, B.; Agnew, L.; Walker, F.R.; Handley, T.; Oldmeadow, C.; Attia, J.; Boyle, M. A role for autoantibodies in atherogenesis. Cardiovasc. Res. 2017, 113, 1102–1112. [Google Scholar] [CrossRef] [PubMed]
- Mathieu, S.; Couderc, M.; Tournadre, A.; Soubrier, M. Cardiovascular profile in osteoarthritis: A meta-analysis of cardiovascular events and risk factors. Jt. Bone Spine 2019, 86, 679–684. [Google Scholar] [CrossRef] [PubMed]
- Bora, D.J.; Gupta, A.K. A Comparative study between fuzzy clustering algorithm and hard clustering algorithm. Int. J. Comput. Trends Technol. 2014, 10, 108–113. [Google Scholar] [CrossRef] [Green Version]
- Everitt, B.; Landau, S.; Leese, M. Cluster Analysis, 5th ed.; Balding, D.J., Cressie, N.A., Fitzmaurice, G.M., Goldstein, H., Eds.; John Wiley & Sons: Hoboken, NJ, USA, 2011. [Google Scholar]
- Muth, C.; Blom, J.W.; Smith, S.; Johnell, K.; Gonzalez-Gonzalez, A.I.; Nguyen, T.S.; Brueckle, M.; Cesari, M.; Tinetti, M.E.; Valderas, J.M. Evidence supporting the best clinical management of patients with multimorbidity and polypharmacy: A systematic guideline review and expert consensus. J. Intern. Med. 2018, 285, 272–288. [Google Scholar] [CrossRef] [Green Version]
- Ng, S.K.; Tawiah, R.; Sawyer, M.; Scuffham, P. Patterns of multimorbid health conditions: A systematic review of analytical methods and comparison analysis. Int. J. Epidemiol. 2018, 47, 1687–1704. [Google Scholar] [CrossRef] [Green Version]


| Pattern | Disease or Disease-Medication Category | O | O/E Ratio | EX |
|---|---|---|---|---|
| 1 Non-Specific (n = 344,958: 37.63%) | Chronic disease group for solid neoplasms | 12.86 | 0.86 | 32.37 |
| Chronic disease-drug group for prostate diseases | 7.82 | 0.77 | 29.11 | |
| Chronic disease-drug group for osteoporosis | 7.74 | 0.74 | 27.74 | |
| Chronic disease group for deafness and hearing loss | 5.91 | 0.60 | 22.58 | |
| Chronic disease-drug group for COPD, emphysema, and chronic bronchitis | 4.26 | 0.53 | 20.03 | |
| Chronic disease-drug group for esophagus, stomach, and duodenum diseases | 3.77 | 0.52 | 19.54 | |
| Chronic disease-drug group for thyroid diseases | 2.84 | 0.51 | 19.34 | |
| Chronic disease group for cataract and lens diseases | 8.47 | 0.50 | 18.65 | |
| Chronic disease-drug group for dementia | 1.56 | 0.47 | 17.61 | |
| Chronic disease-drug group for hypertension | 26.41 | 0.46 | 17.48 | |
| Chronic disease group for bradycardias and conduction diseases | 1.12 | 0.40 | 15.13 | |
| Chronic disease-drug group for sleep disorders | 2.22 | 0.39 | 14.64 | |
| Chronic disease group for obesity | 11.29 | 0.39 | 14.82 | |
| Chronic disease-drug group for dyslipidemia | 12.32 | 0.38 | 14.40 | |
| Chronic disease group for chronic pancreas, biliary tract, and gallbladder diseases | 1.09 | 0.37 | 13.78 | |
| 2 Diabetes (n = 178,457: 19.47%) | Chronic disease-drug group for diabetes | 39.52 | 2.15 | 41.93 |
| Chronic disease-drug group for glaucoma | 10.75 | 1.78 | 34.65 | |
| Chronic disease group for obesity | 49.61 | 1.73 | 33.68 | |
| Chronic disease-drug group for dyslipidemia | 55.12 | 1.71 | 33.33 | |
| Chronic disease-drug group for hypertension | 84.37 | 1.48 | 28.89 | |
| Chronic disease-drug group for thyroid diseases | 7.44 | 1.34 | 26.17 | |
| Chronic disease-drug group for chronic kidney diseases | 13.92 | 1.32 | 25.69 | |
| Chronic disease-drug group for ischemic heart disease | 8.52 | 1.11 | 21.61 | |
| Chronic disease-drug group for cerebrovascular diseases | 6.54 | 1.01 | 19.69 | |
| Chronic disease group for cataract and lens diseases | 17.15 | 1.00 | 19.54 | |
| Chronic disease-drug group for peripheral vascular disease | 2.55 | 1.00 | 19.47 | |
| Chronic disease-drug group for prostate diseases | 9.58 | 0.95 | 18.46 | |
| Chronic disease group for solid neoplasms | 14.06 | 0.94 | 18.31 | |
| Chronic disease group for deafness and hearing loss | 8.42 | 0.85 | 16.64 | |
| Chronic disease group for chronic pancreas, biliary tract, and gallbladder diseases | 2.40 | 0.80 | 15.67 | |
| 3 Neurological and Musculoskeletal, Female Dominant (n = 102,750: 11.21%) | Chronic disease-drug group for peripheral neuropathy | 9.73 | 3.08 | 34.56 |
| Chronic disease-drug group for dorsopathies | 24.05 | 2.88 | 32.24 | |
| Chronic disease-drug group for other musculoskeletal and joint diseases | 22.42 | 2.73 | 30.64 | |
| Chronic disease-drug group for other genitourinary diseases | 8.68 | 2.44 | 27.32 | |
| Chronic disease-drug group for glaucoma | 14.68 | 2.43 | 27.25 | |
| Chronic disease-drug group for osteoarthritis and other degenerative joint diseases | 41.87 | 2.16 | 24.19 | |
| Chronic disease group for deafness and hearing loss | 19.68 | 2.00 | 22.40 | |
| Chronic disease-drug group for neurotic, stress-related, and somatoform diseases | 20.38 | 1.99 | 22.36 | |
| Chronic disease group for cataract and lens diseases | 33.75 | 1.98 | 22.14 | |
| Chronic disease-drug group for depression and mood diseases | 23.16 | 1.86 | 20.90 | |
| Chronic disease-drug group for osteoporosis | 18.91 | 1.80 | 20.17 | |
| Chronic disease-drug group for colitis and related diseases | 18.22 | 1.79 | 20.09 | |
| Chronic disease-drug group for sleep disorders | 9.93 | 1.74 | 19.51 | |
| Chronic disease-drug group for other psychiatric and behavioral diseases | 3.18 | 1.58 | 17.71 | |
| Chronic disease-drug group for esophagus, stomach, and duodenum diseases | 11.29 | 1.55 | 17.41 | |
| 4 Behavioral, Neurological, and Musculoskeletal, Female Dominant (n = 90,287: 9.85%) | Chronic disease-drug group for other psychiatric and behavioral diseases | 7.42 | 3.69 | 36.34 |
| Chronic disease-drug group for neurotic, stress-related, and somatoform diseases | 37.33 | 3.65 | 36.00 | |
| Chronic disease-drug group for peripheral neuropathy | 10.93 | 3.46 | 34.09 | |
| Chronic disease-drug group for depression and mood diseases | 41.75 | 3.36 | 33.10 | |
| Chronic disease-drug group for dorsopathies | 27.22 | 3.25 | 32.06 | |
| Chronic disease-drug group for other musculoskeletal and joint diseases | 26.65 | 3.25 | 32.00 | |
| Chronic disease-drug group for other genitourinary diseases | 9.81 | 2.76 | 27.14 | |
| Chronic disease-drug group for sleep disorders | 15.07 | 2.64 | 26.02 | |
| Chronic disease-drug group for osteoarthritis and other degenerative joint diseases | 47.21 | 2.43 | 23.97 | |
| Chronic disease-drug group for colitis and related diseases | 22.46 | 2.21 | 21.76 | |
| Chronic disease-drug group for osteoporosis | 20.89 | 1.99 | 19.58 | |
| Chronic disease-drug group for esophagus, stomach, and duodenum diseases | 13.80 | 1.90 | 18.70 | |
| Chronic disease-drug group for thyroid diseases | 8.76 | 1.58 | 15.60 | |
| Chronic disease-drug group for autoimmune diseases | 3.12 | 1.43 | 14.13 | |
| Chronic disease group for deafness and hearing loss | 13.77 | 1.40 | 13.77 | |
| 5 Cardio-cerebrovascular and Renal (n = 80,855: 8.82%) | Chronic disease-drug group for peripheral vascular disease | 12.02 | 4.71 | 41.57 |
| Chronic disease-drug group for ischemic heart disease | 29.85 | 3.89 | 34.32 | |
| Chronic disease-drug group for cerebrovascular diseases | 19.34 | 2.99 | 26.37 | |
| Chronic disease-drug group for heart failure | 21.10 | 2.83 | 24.94 | |
| Chronic disease group for bradycardias and conduction diseases | 7.04 | 2.53 | 22.33 | |
| Chronic disease-drug group for atrial fibrillation | 15.98 | 2.39 | 21.06 | |
| Chronic disease-drug group for other psychiatric and behavioral diseases | 4.63 | 2.30 | 20.33 | |
| Chronic disease-drug group for chronic kidney diseases | 21.85 | 2.07 | 18.27 | |
| Chronic disease-drug group for COPD, emphysema, chronic bronchitis | 15.85 | 1.98 | 17.45 | |
| Chronic disease-drug group for colitis and related diseases | 19.64 | 1.93 | 17.04 | |
| Chronic disease-drug group for anemia | 11.32 | 1.93 | 17.00 | |
| Chronic disease-drug group for neurotic, stress-related, and somatoform diseases | 18.28 | 1.79 | 15.79 | |
| Chronic disease-drug group for prostate diseases | 17.96 | 1.78 | 15.67 | |
| Chronic disease-drug group for depression and mood diseases | 21.75 | 1.75 | 15.45 | |
| Chronic disease-drug group for sleep disorders | 9.50 | 1.67 | 14.69 | |
| 6 Cardiovascular, Renal, Inflammatory, and Respiratory (n = 69,720: 7.61%) | Chronic disease-drug group for atrial fibrillation | 40.07 | 5.99 | 45.54 |
| Chronic disease-drug group for heart failure | 42.57 | 5.70 | 43.38 | |
| Chronic disease group for bradycardias and conduction diseases | 11.50 | 4.14 | 31.48 | |
| Chronic disease-drug group for inflammatory arthropathies | 11.16 | 3.34 | 25.41 | |
| Chronic disease-drug group for autoimmune diseases | 7.07 | 3.25 | 24.69 | |
| Chronic disease-drug group for anemia | 17.61 | 3.00 | 22.81 | |
| Chronic disease-drug group for chronic kidney diseases | 31.24 | 2.96 | 22.52 | |
| Chronic disease-drug group for COPD, emphysema, chronic bronchitis | 20.53 | 2.56 | 19.49 | |
| Chronic disease-drug group for ischemic heart disease | 17.01 | 2.22 | 16.86 | |
| Chronic disease-drug group for peripheral vascular disease | 5.36 | 2.10 | 15.97 | |
| Chronic disease group for chronic pancreas, biliary tract, and gallbladder diseases | 4.88 | 1.64 | 12.45 | |
| Chronic disease-drug group for cerebrovascular diseases | 10.29 | 1.59 | 12.10 | |
| Chronic disease-drug group for colitis and related diseases | 15.91 | 1.56 | 11.90 | |
| Chronic disease-drug group for prostate diseases | 14.98 | 1.48 | 11.27 | |
| Chronic disease-drug group for hypertension | 83.43 | 1.47 | 11.16 | |
| 7 Multisystem (n = 49,592: 5.41%) | Chronic disease group for other digestive diseases | 23.29 | 9.70 | 52.46 |
| Chronic disease-drug group for dementia | 21.63 | 6.48 | 35.07 | |
| Chronic disease group for chronic pancreas, biliary tract, and gallbladder diseases | 16.95 | 5.69 | 30.77 | |
| Chronic disease-drug group for autoimmune diseases | 10.95 | 5.03 | 27.19 | |
| Chronic disease-drug group for inflammatory arthropathies | 14.80 | 4.43 | 23.97 | |
| Chronic disease-drug group for anemia | 19.82 | 3.37 | 18.25 | |
| Chronic disease-drug group for atrial fibrillation | 14.80 | 2.21 | 11.96 | |
| Chronic disease-drug group for heart failure | 16.37 | 2.19 | 11.87 | |
| Chronic disease-drug group for colitis and related diseases | 19.34 | 1.90 | 10.29 | |
| Chronic disease-drug group for chronic kidney diseases | 19.73 | 1.87 | 10.12 | |
| Chronic disease group for bradycardias and conduction diseases | 4.49 | 1.61 | 8.73 | |
| Chronic disease-drug group for COPD, emphysema, chronic bronchitis | 12.50 | 1.56 | 8.44 | |
| Chronic disease-drug group for cerebrovascular diseases | 10.06 | 1.55 | 8.41 | |
| Chronic disease-drug group for esophagus, stomach, and duodenum diseases | 9.95 | 1.37 | 7.41 | |
| Chronic disease-drug group for osteoarthritis and other degenerative joint diseases | 25.47 | 1.31 | 7.10 |
Publisher’s Note: MDPI stays neutral with regard to jurisdictional claims in published maps and institutional affiliations. |
© 2021 by the authors. Licensee MDPI, Basel, Switzerland. This article is an open access article distributed under the terms and conditions of the Creative Commons Attribution (CC BY) license (https://creativecommons.org/licenses/by/4.0/).
Share and Cite
Stafford, G.; Villén, N.; Roso-Llorach, A.; Troncoso-Mariño, A.; Monteagudo, M.; Violán, C. Combined Multimorbidity and Polypharmacy Patterns in the Elderly: A Cross-Sectional Study in Primary Health Care. Int. J. Environ. Res. Public Health 2021, 18, 9216. https://0-doi-org.brum.beds.ac.uk/10.3390/ijerph18179216
Stafford G, Villén N, Roso-Llorach A, Troncoso-Mariño A, Monteagudo M, Violán C. Combined Multimorbidity and Polypharmacy Patterns in the Elderly: A Cross-Sectional Study in Primary Health Care. International Journal of Environmental Research and Public Health. 2021; 18(17):9216. https://0-doi-org.brum.beds.ac.uk/10.3390/ijerph18179216
Chicago/Turabian StyleStafford, Grant, Noemí Villén, Albert Roso-Llorach, Amelia Troncoso-Mariño, Mònica Monteagudo, and Concepción Violán. 2021. "Combined Multimorbidity and Polypharmacy Patterns in the Elderly: A Cross-Sectional Study in Primary Health Care" International Journal of Environmental Research and Public Health 18, no. 17: 9216. https://0-doi-org.brum.beds.ac.uk/10.3390/ijerph18179216