1. Introduction
Oral health is indispensable for healthy aging because good nutrition cannot be sustained without healthy eating and digestion. This is particularly true for Japan, which boasts the world’s longest longevity (81.41 years for males and 87.45 years for females in 2019). To ensure healthy aging, dental health status must be improved in proportion to the prolonged lifespan [
1]. However, monitoring dental health on a population level may not be feasible in all countries. Japan has advantages, in that (1) it has universal health coverage including dental care, and it is feasible to grasp the utilization of dental care on a national level using health insurance claims data; and (2) it has conducted a national sampling survey to monitor the dental health of the entire nation periodically (Dental Hygiene Survey, DHS).
The research question of this article is two-fold: (1) how has dental health status improved despite population aging, and (2) how has the utilization of dental care services changed to accommodate the changing needs of the rapidly aging population?
In most countries, dental care is not covered by public insurance, or the coverage, if any, may not be universal. On the other hand, dental care is covered by Japan’s universal health insurance, with some exceptions (e.g., orthodontics). Under Japan’s universal health insurance, the prices of each procedure as well as of medicines are regulated by government as a form of national uniform fee schedule. Because of such generous coverage, it is technically feasible to grasp utilization of dental care services through national statistics. Dentists submit itemized claims every calendar month for each patient. The submitted claims data are stored in the national claims database (NDB), and the itemized statistics from a month (typically every May) are published as the “Social Insurance Claims Survey (SICS)”. Further, summary statistics of NDB also became available as “NDB open data (NDBOD)” after 2014. By combining NDB open data and the SICS, one can illustrate the utilization of dental care services.
2. Materials and Methods
In this study, the author relied on two kinds of data on dental health: a sampling survey on dental health status evaluated by dentists (the Dental Hygiene Survey, DHS) and administrative data of health insurance claims submitted by all dental offices. The latter is particularly unique to Japan’s dental care, because Japan has a universal health coverage and all dental care services are covered under a uniform fee schedule as well as a uniform claims format. Almost all insurance claims are submitted electronically and are accumulated in a large database known as the National Claims Database (NDB), from which aggregate data are publicly available either as (1) the Social Insurance Claims Survey (SICS) or (2) the NDB open data (NDBOD).
The time frame was inevitably limited by the data availability. Although the DHS and the SICS has been conducted since 1957, it is only recently that these data have been publicly available in Excel format (DHS was provided only after the 2006 survey, and SICS became a population survey only after 2012; NDBOD became available only after 2014, and dental data were not included or very limited in the initial few years).
The raw data used in tables and figures are provided as a
supplementary file in Excel format.
2.1. Dental Hygiene Survey
To survey the dental health status of the entire population, the DHS is conducted by the Ministry of Health, Labour and Welfare (MHLW) as a sampling survey at an interval of five to six years as part of the National Health and Nutrition Survey (the DHS had been conducted at the interval of six years since 1957, but the interval was shortened to five years after the 10th survey in 2011). The author analyzed tooth-specific and age-specific survival, comparing the latest 2016 results and 2005 results [
2].
The sample was selected to reflect the dental health status of the entire population. A total of 150 National Census districts were selected, and all residents were subjects of the survey. However, the sex and age distribution of the sample may not properly reflect Japan’s population structure, as shown in
Table 1 and
Table 2.
2.2. National Claims Database Open Data (NDBOD)
The National Claims Database (NDB) is arguably one the largest administrative databases in the world and started to accumulate the data of medical, dental, and pharmaceutical claims in 2009 [
3]. The dental data became publicly available as “open data” in 2014, and the data are aggregated by clinical diagnoses broken down by sex and five-year age groups. One limitation of the data is that it only provides the number of diagnoses, and one claim may contain more than one diagnoses. Another limitation of the NDB is a legal one: due to the strict privacy protection rule, data smaller than 10 are omitted (
one-digit suppression rule). Therefore, one should be cautioned that the data provided by the NDBOD may underestimate the real figures.
2.3. Social Insurance Claims Survey (SICS)
The SICS is another survey of claims data derived from the NDB. The differences from the NDBOD are that (1) SICS contains monthly data (typically for May in the survey year), while the NDBOD provides annual data, and (2) the one-digit suppression rule does not apply. SICS contains data on the number of claims, the number of office visits, and the monetary values for every clinical procedure.
3. Results
Analysis was conducted to answer the two research questions presented in the introduction section. Dental health status was evaluated using the DHS to illustrate how dental health status changed over the survey period, and the change in the utilization of dental care services was evaluated by health insurance claims data using SICS and NDBOD.
3.1. Change of Dental Health Status
3.1.1. Survival of Teeth of the Elderly
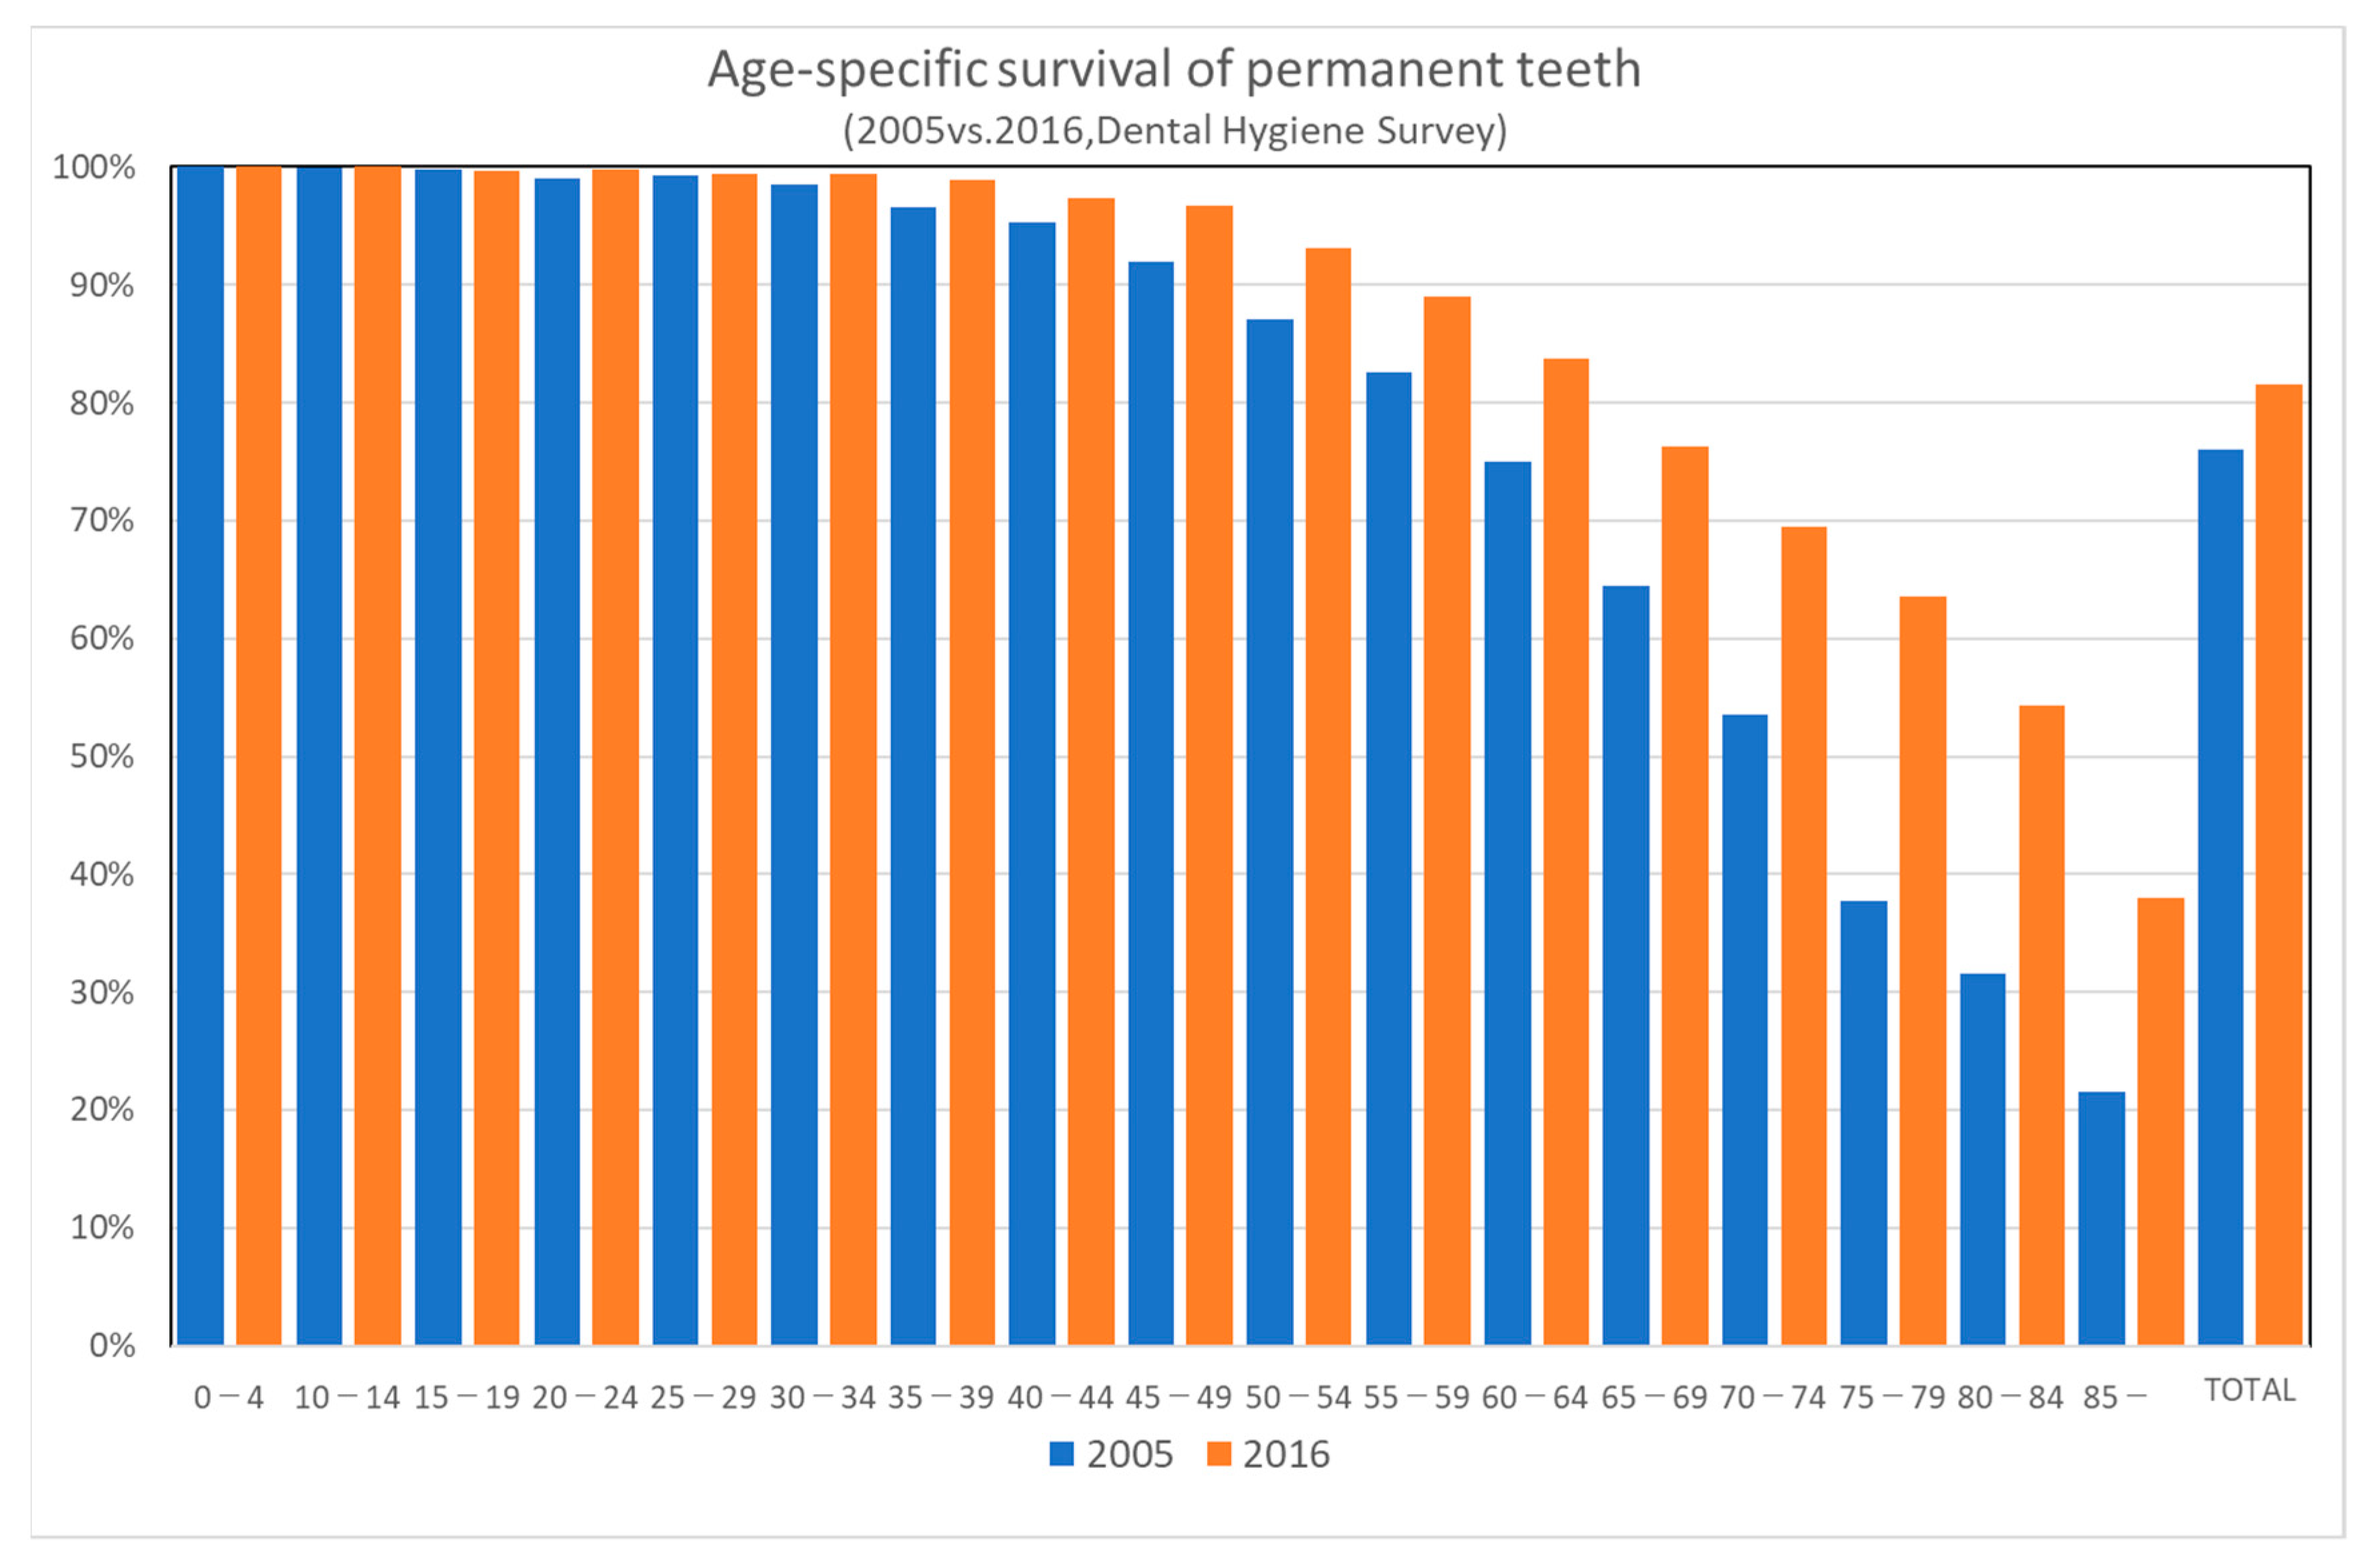
Survival of teeth of the elderly (65 years or older) has improved even during such a short period of 11 years. As shown in
Figure 1, age-specific survival of permanent teeth has improved markedly between the 2005 and 2016 surveys. The improvement is more prominent in the older age groups. Japan Dental Association launched the “80-20 campaign” in 1989, which means “maintaining at least 20 teeth at the age of 80” [
4]. According to the Dental Hygiene Survey in 1999, 80-year-old persons had an average of eight teeth remaining, and only 15% of them had 20 teeth or more remaining. According to the Dental Hygiene Survey in 2016, 51.2% of the elderly at age 80 had 20 teeth or more remaining.
3.1.2. Tooth-Specific Survival of the Elderly
The DHS surveys for each tooth. The following table [
Table 3] illustrates the tooth-specific improvement in survival for the elderly (≥65-year-old). The most improvement in survival was found in the left lower second molar, which showed 1.54-fold improvement in survival (48.4% survival in 2016 as opposed to 31.5% in 2005). On the other hand, the least improvement was in the right lower canine, which showed 1.16-fold improvement in survival over the 11-year interval. Lower canines have the highest survival rates of all teeth (82.5% for right and 84.1% for left remaining in the elderly in DHS 2016), and the improvement was inevitably limited.
3.1.3. Conditions of Teeth of the Elderly
Although the survival of teeth showed a marked improvement over the 11-year interval, the conditions of teeth of the elderly (≥65-year-old) did not show much difference over the same period. It is remarkable that the percent of complete dentures among the missing teeth declined from 50.7% in 2005 to 39.7% in 2016. Also remarkable was that the percent of implants increased from 0.3% of missing teeth in 2005 to 1.3% in 2016
Table 4.
3.2. Analysis of Diagnoses Contained in Health Insurance Claims
Health insurance claims contain diagnoses, which reflect the changing pattern of utilization of dental care services by different age groups. NDBOD provides diagnoses and was used for analysis. However, NDBOD does not include the data on the number of claims, and the data from another source (the Medical Care Benefit Survey, MCBS) was used as a supplement to calculate the number of diagnoses per claim. The MCBS is another survey on health insurance claims, providing only aggregate data on the number of claims or health care expenditures.
N of Diagnoses by Diagnostic Categories
The number of diagnoses contained in dental claims stored in NDB has increased steadily. However, one should be cautioned that the NDB stores only electronically submitted claims, and the computerization of claims was not well-developed in the early years. In addition, the latest 2018 data include approximately 213 million dental claims. There is an increasing trend in the number of diagnoses contained in a claim. The number of diagnoses per claim increased from 1.32 diagnoses per claim in 2014 to 1.63 in 2018 (
Table 5).
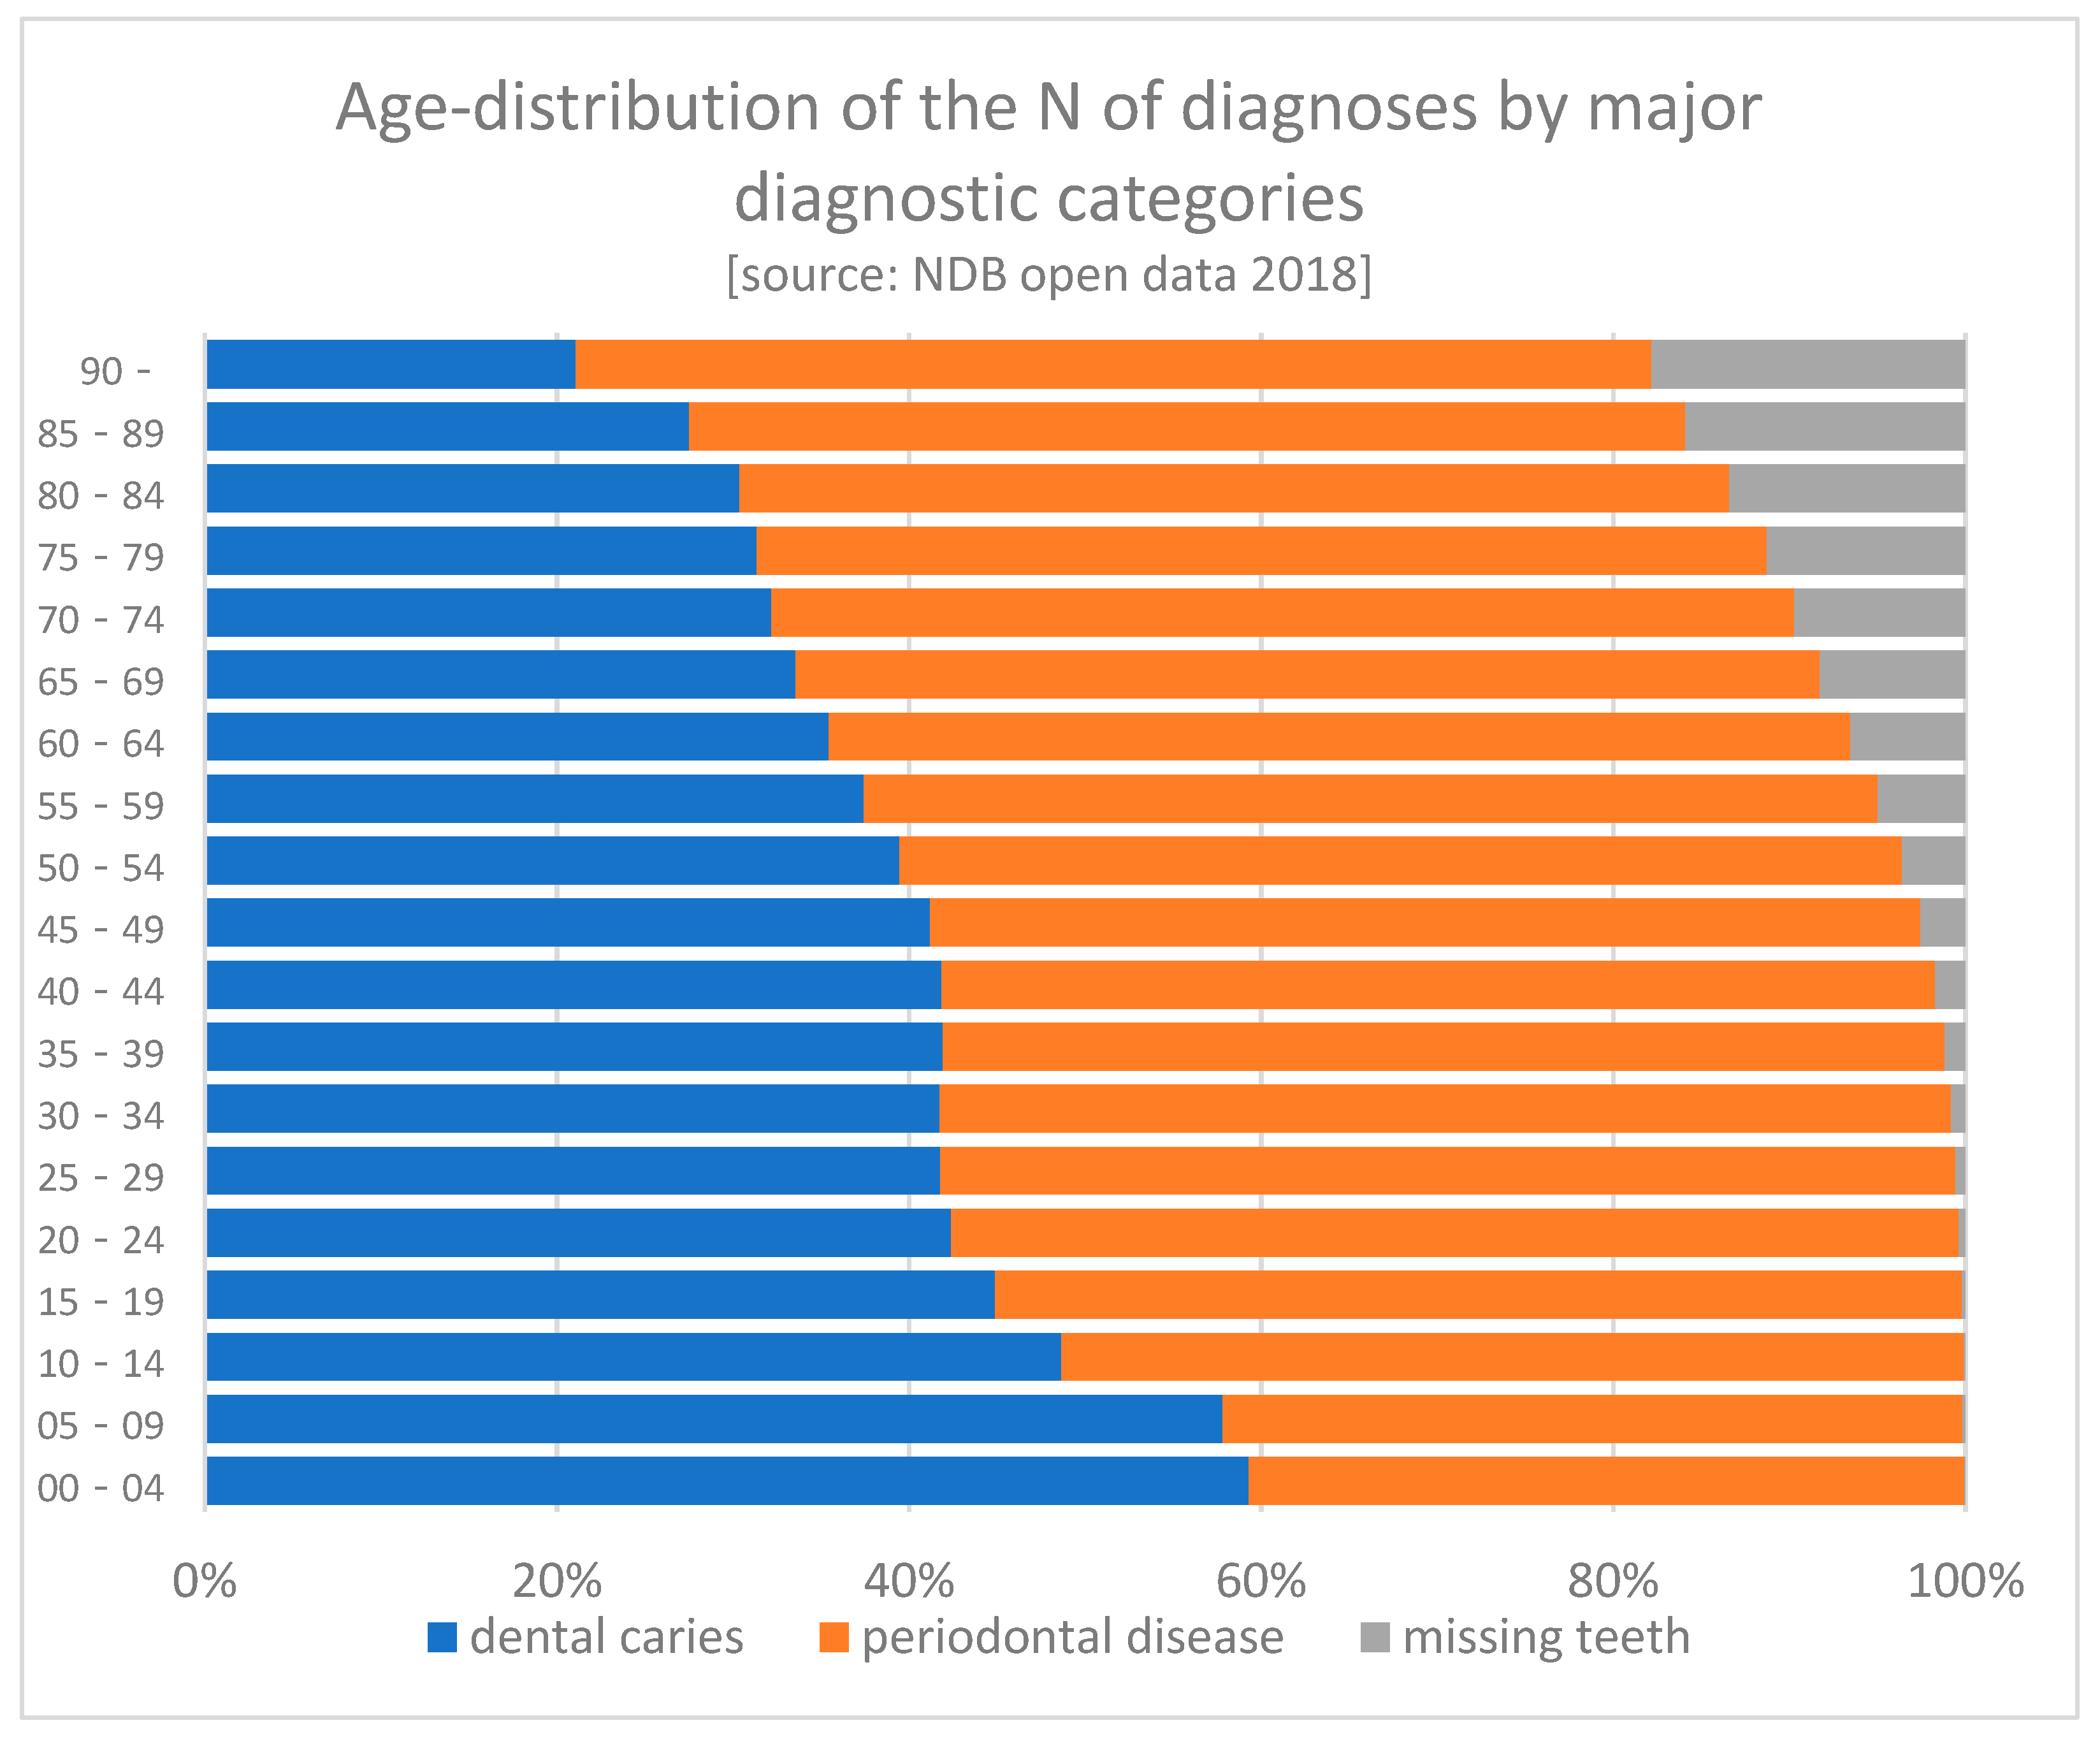
The following graph shows a declining share of dental caries with aging, possibly reflecting the declining number of remaining teeth. On the other hand, the share of periodontal diseases remains constant over aging. However, one should be cautioned in interpreting the NDB data. According to the “one-digit suppression (numbers less than 10 will not be displayed)”, the number of claims may be substantially underestimated (
Figure 2).
When broken down by ICD10-level diagnoses, two diagnoses (periodontitis and dental caries) account for 57.2% of the total number, and the top ten diagnoses account for 82.8% of the total diagnoses (
Table 6).
3.3. Analysis of the Change in Utilization of Dental Care Services
The SICS has been conducted every year since 1957. It was conducted as a sampling survey when health insurance claims were submitted in paper form. Since 2012, it started to extract data from NDB and became a population survey instead of a sampling survey.
The SICS data covers only a one-month period (May in the survey year) and is therefore affected by seasonal variation. In addition, one should be reminded that the latest data in 2020 are severely affected by the COVID19 epidemic.
The author focuses on home care because it reflects the population aging. As shown in
Table 7, home care is provided mainly to the elderly population. The rapid proliferation of home visits/home care management provided by dental offices is illustrated by the % increase between 2015 and 2019. In only four years, the utilization of home visits increased by 37.9% and home care management by 51.1%. The age distribution of home care services provision shows a sharp contrast to that of initial office visits, indicating that home care services are provided predominantly to the disabled elderly at home.
3.3.1. Dental Home Visits
Dental home visits are provided to patients who cannot visit dental clinics due to physical handicaps, and the number of dental home visits is increasing steadily (
Table 8). For the elderly who are living in nursing homes or long-term care facilities, dentists can visit more than one patient at a time. Considering the time saving in such cases, the fee for dental home visits is set considerably lower for multiple patients in a building [11,000 yen for one patient and 3610 yen for the second or more patients in a building. The fee is further reduced to 1850 yen for ten or more patients in a building].
3.3.2. Dental Home Care Management
Dental home care management (DHCM) is a surcharge to home visit fees. While home visit fees are reimbursed on every visit, dental home care management is considered to be a professional service by dentists, involving a planned, scheduled and long-term management of patients to maintain their oral health and nutrition. Therefore, DHCM is reimbursed once a month, and while home visits may be provided by any dental practitioners, dental home care management is expected to be provided by specially designated dental clinics called “home care supporting dental clinics” (HCSDC).
There are certain conditions for dental clinics to be designated HCSDCs. To qualify as HCSDC type 1, the clinic must provide 15 times or more home visits per year, and for type 2, 10 times or more.
In addition to the requirement for the number of home visits, the following conditions must be met [
5]:
must have at least one dentist who completed a training course on geriatric dentistry as well as risk management for emergencies;
must have at least one dental hygienist.
provide patients and/or family members information on home visits in writing;
must be affiliated with other HCSDCs for back-up;
must have provided at least five home visits in response to requests from long-term care facilities (nursing homes, care managers, visiting nursing stations, etc.).
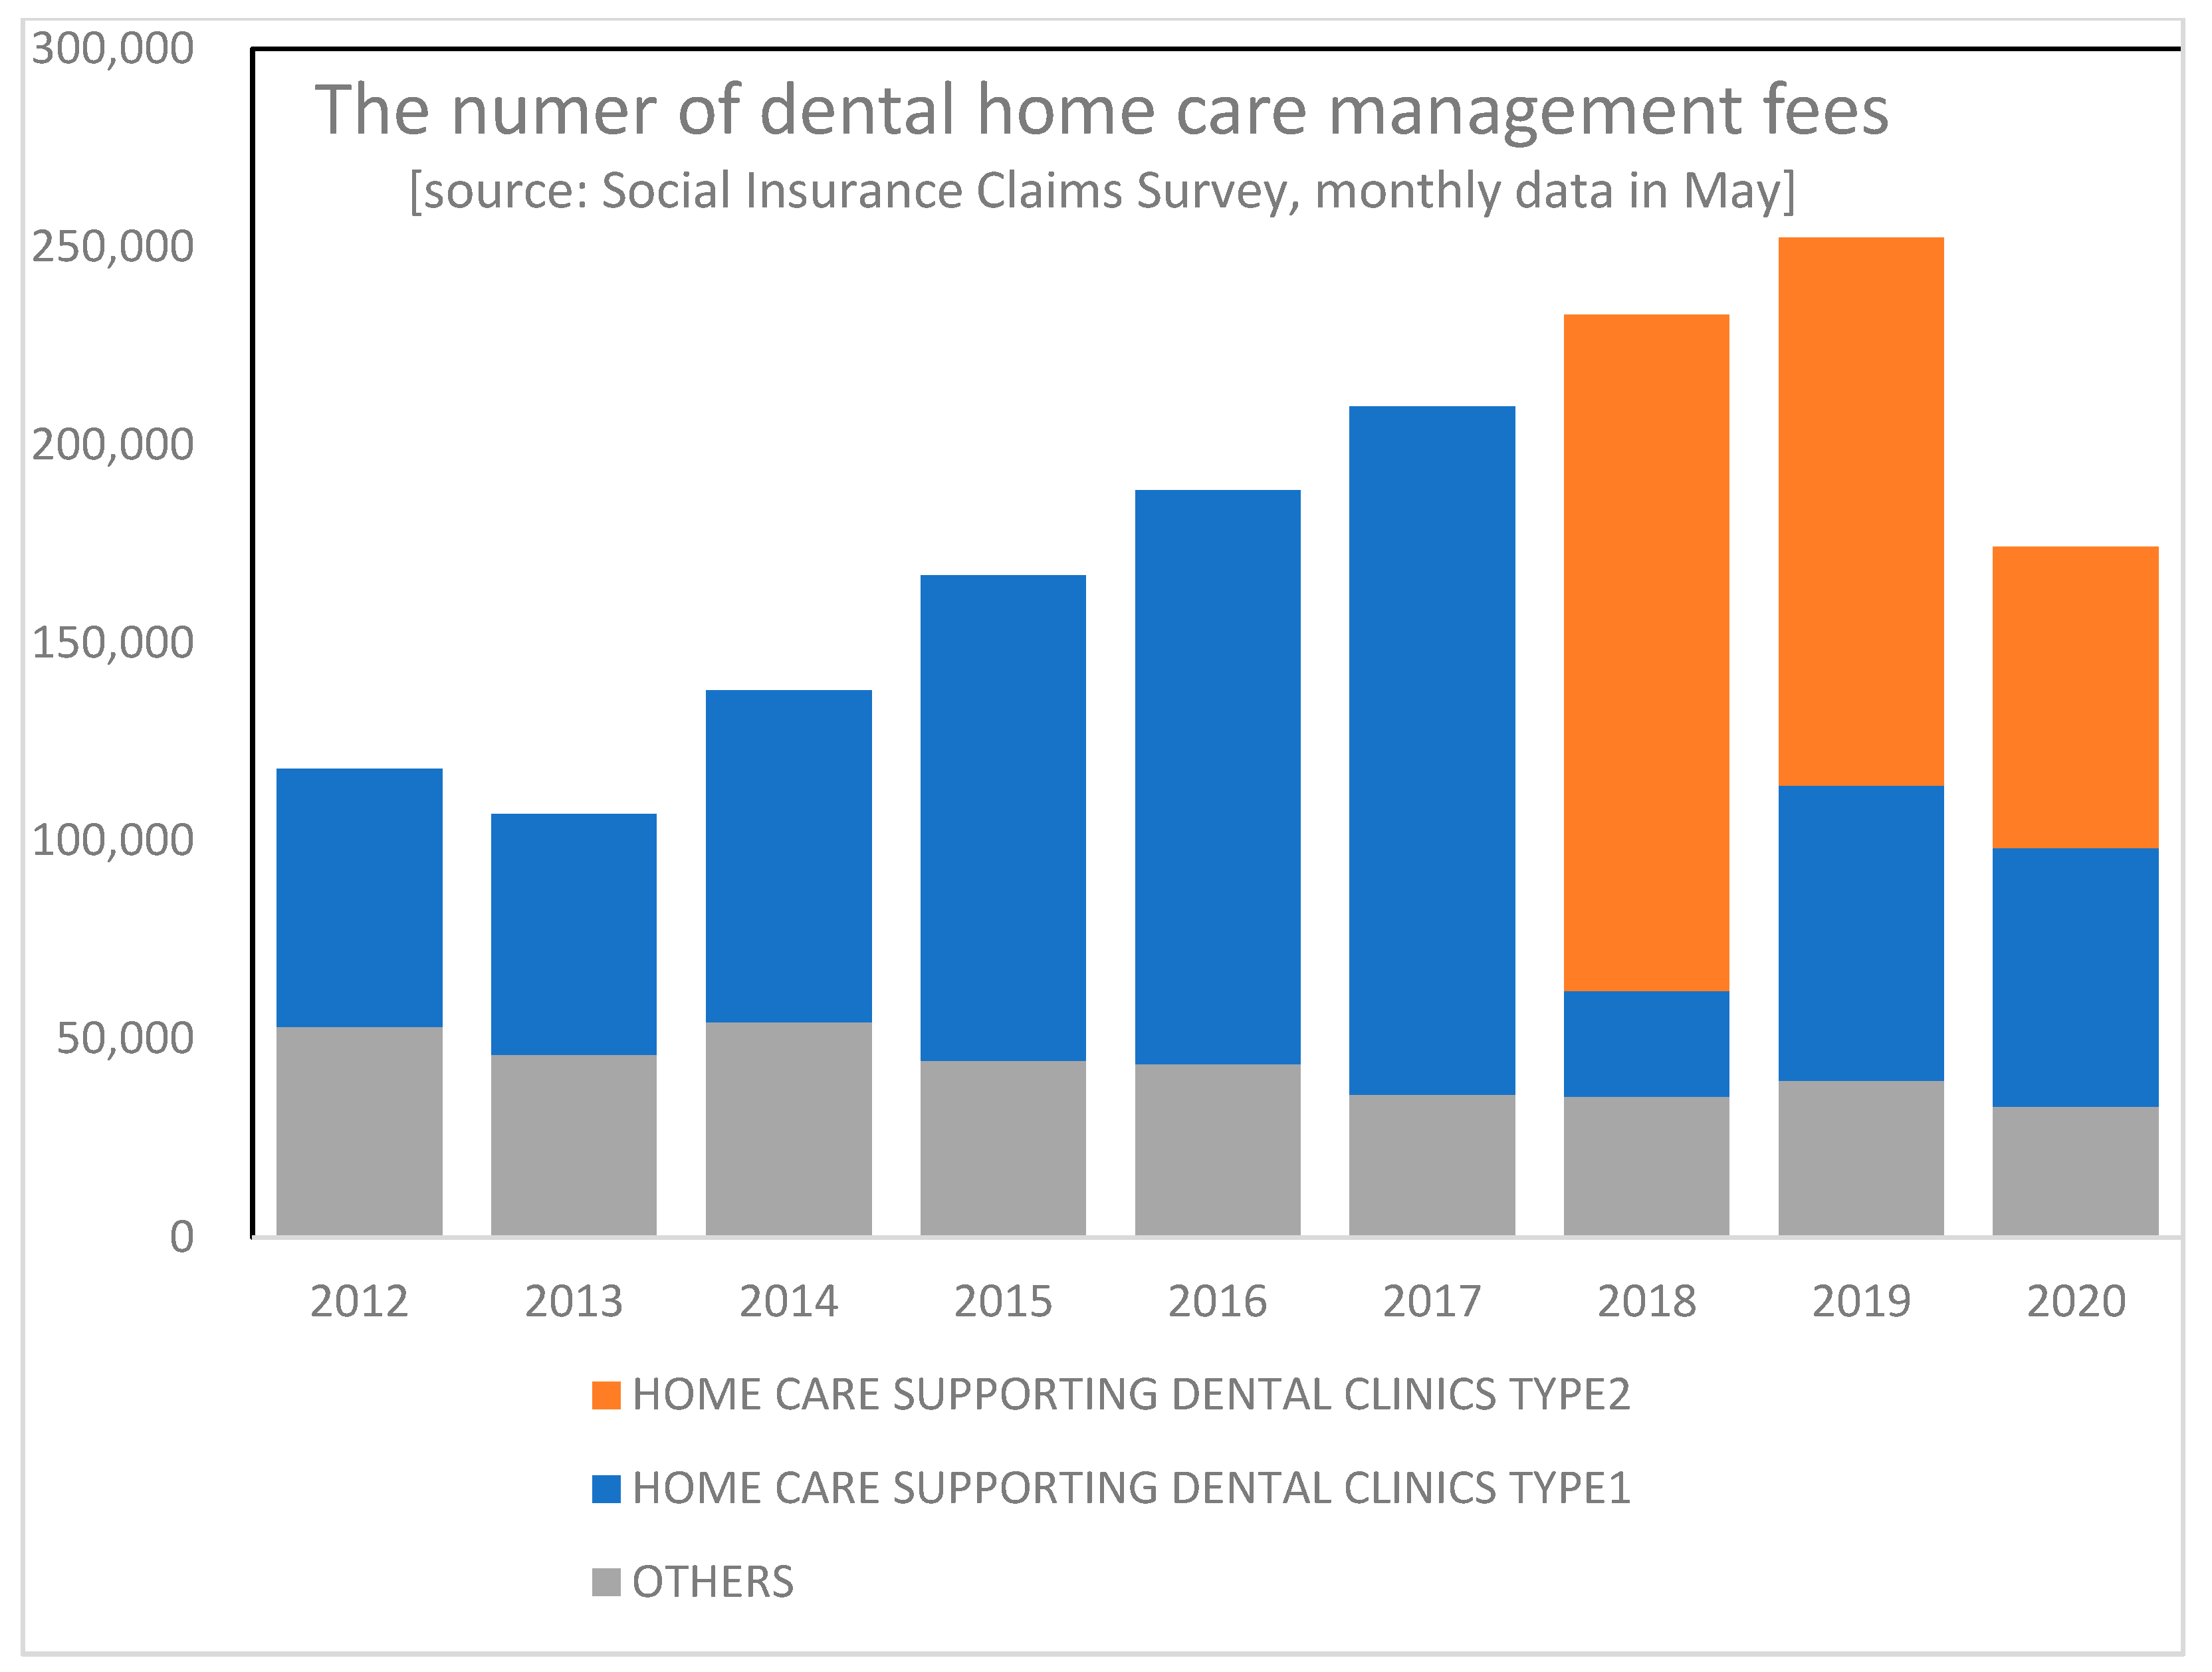
As shown in
Figure 3, the number of DHCMs has been increasing. Since 2018, HCSDCs have been divided into two categories: type 1 and 2. Type 1 HCSDCs are entitled to a higher management fee (3200 yen per month per patient) than type 2 (2500 yen) because they must meet the more stringent conditions than type 2 HCSDCs. There is no difference between the two types as to the function and role of the dental clinics, and the distinction is intended to provide economic incentives by way of a differential level of financial reimbursement to encourage more clinics to contribute to home care for the elderly.
3.3.3. Home Visits by Dental Hygienists
A study analyzing the data on dental clinics and patients’ behavior demonstrated the importance of dental hygienists in influencing the patients’ behavior [
6] and tooth loss [
4]. Home visits by dental hygienists are also covered by health insurance [
Table 9]. Conditions for reimbursement include: (1) dental hygienists must spend at least 20 min per visit, and (2) reimbursement is capped at four times per month.
There was a major revision in the fee schedule for dental hygienists in 2018. Until then, the fee for dental hygienists fell into two categories: simple (1200 yen) and complicated (3000 yen). However, from 2018 onward, the fee schedule was revised to the same structure used with dentists: 3600 yen for the 1st patient in a building, 3280 yen for the 2nd to 9th patient in a building, and 3000 yen for the 10th patient or more.
3.3.4. Home Oral Rehabilitation Services
Home oral rehabilitation was added to health insurance benefits in 2016 as a surcharge to dental home visits. The fee is reimbursed when dentists provide oral rehabilitation services to the patients who are charged for “dental home visits”. The conditions for reimbursement are (1) patients must have an eating disorder requiring a constant dental management, (2) dentists must develop a long-term dental management plan, and (3) dentists spend at least 20 min on site [
5].
Since this fee is a surcharge to dental home visits, the fee is categorized by the number of teeth under management, and not by the number of patients in a building [
Table 10].
4. Discussion
Oral health of the elderly population in Japan has improved considerably, as evidenced by the Dental Hygiene Surveys. The share of the elderly who maintain 20 or more teeth has increased from 15% in 1999 to 51.2% in 2016 [
7]. Tooth-specific survival has improved by 32% over the eleven-year interval. A non-systemic review of dental health of the elderly concluded that “the epidemiological literature on oral health in the elderly is not very encouraging, and it indicates profound imbalances among countries and regions” [
8]. If so, Japan may be viewed as one of the few successful countries [
9]. However, it is difficult to identify factors contributing to the improvement of dental health status. Improved dental care targeting the middle-aged population with periodontal diseases must have been a major factor [
10], but such measures alone will not accommodate the ever-increasing number of elderly patients who cannot visit dental clinics without assistance.
Japan is one of the rare examples of countries that not only cover dental care in their universal health insurance system but expand the coverage to home dental care to accommodate elderly patients at home. Since Japan has universal health coverage and dental care has been included in the benefit, it was possible to illustrate the utilization of dental services as well as the number of diagnoses contained in a claim, particularly after the full computerization was achieved and a national database accumulating the claims data was established. Previous studies analyzing home dental care services relied on questionnaire surveys of practicing dentists in limited areas [
11,
12,
13]. The present study has methodological advantages over preceding ones in that it used health insurance claims data, a more accurate and reliable data source than questionnaires, to illustrate the proliferation of home dental care services. Health insurance claims contain not only procedures but also diagnoses. This enables researchers to illustrate how the prevalence of diseases has shifted through the population’s aging. Reflecting the aging of the entire population, the prevalence of major diagnostic categories has shifted gradually, with an increasing share for periodontal diseases, while the share of missing teeth has decreased due to the improved survival of teeth of the elderly.
Japan’s uniform fee schedule is revised every two years and serves as a policy implementation tool for the government [
14]. The government has increased the coverage of home care services in both medical and dental care. Utilization of home care services has increased steadily in recent years and is expected to increase further, reflecting the aging population (there was a sharp drop in the year 2020; this reflects the impact of the COVID19 epidemic and may be viewed as a temporary phenomenon).
The author analyzed publicly available data source including sampling surveys on dental status as well as health insurance claims data. However, one should be cautioned concerning the limitations and drawbacks of the data. Although Japan’s claims data are uniform and comprehensive, they lack information on the socio-economic status of patients. For example, one recent study revealed “a pro-rich inequality for both income and wealth” in dental care use under universal public coverage [
15]. This is a research question the present study failed to answer.
Monitoring the socio-economic disparity in oral health status would be the future challenge for researchers.
5. Conclusions
Japan has covered dental care as benefit of its universal health coverage. Thanks to such generous coverage, people can receive dental care with a minimal copayment. The dental health status as measured by survival of teeth has improved considerably, particularly for the elderly population. In response to the rapidly aging population, an increasing trend of home dental care services for the elderly patients has been observed. Although the overall performance of Japan’s dental care for the elderly has been satisfactory, some matters such as socio-economic disparity remain unaddressed and leave room for future research.


