
Health-Related Quality of Life and Frequency of Physical Activity in Spanish Students Aged 8–14

 , , , , ,
  and
and
Abstract
:1. Introduction
2. Materials and Methods
2.1. Study Design
2.2. Participants
2.3. Procedures
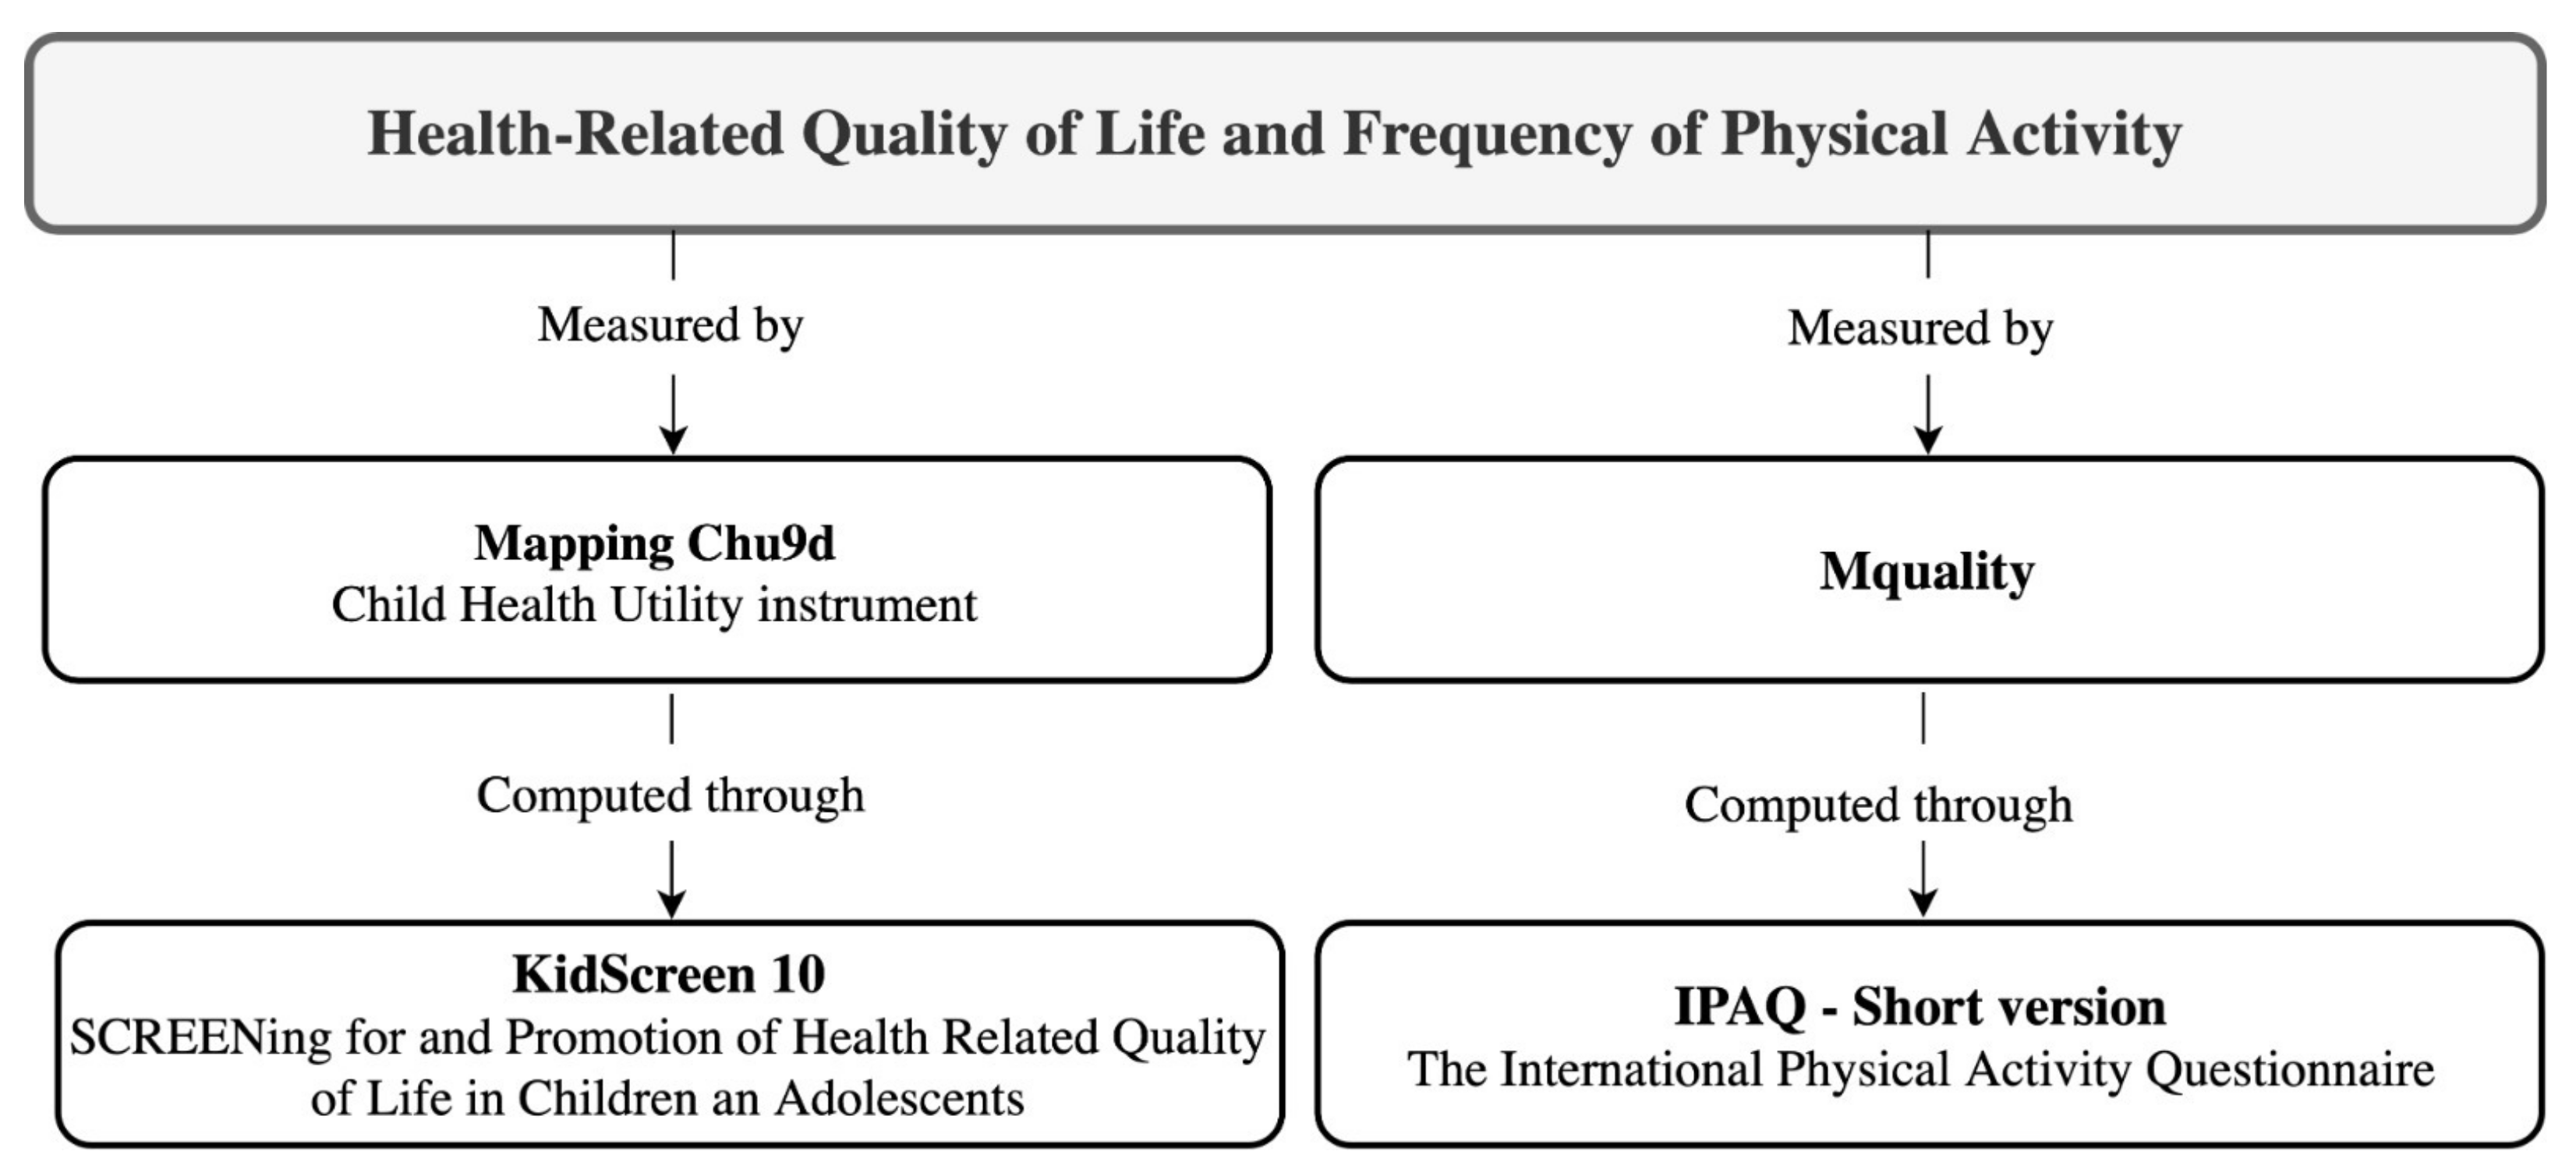
- “Module E: Quality of Life”. This evaluates children’s self-perception about their HRQoL, involving subjective physical, mental and social status. The Kidscreen-10 modified instrument was used, according to its parental version. Question 7 (“Have the parents of the child or adolescent treated him/her fairly?”) was specifically removed from the primary version. The questions included assess the frequency in which the child or adolescent had experienced the following situations over the last week: (1) has felt good and in good shape; (2) has been full of energy; (3) has felt sad; (4) has felt lonely; (5) has had enough time for him/herself; (6) has been able to do desired things in free time; (7) has had fun with friends; (8) has done well at school; and 9) has been able to pay attention. The possible response levels were: (1) “nothing”, (2) “a little”, (3) “moderately”, (4) “very much”, (5) “a lot”. Either the primary version of the instrument and its modified 9-item version have indicated good reliability in European children (Cronbach’s α = 0.82 and 0.75, respectively) [35,36]. Moreover, its Spanish version has proven to be valid and reliable (Cronbach’s α > 0.70) [37].
- “Module K: Rest and Physical Activity”. This was used for children’s physical activity frequency assessment. Only question 61, which is related to leisure-time physical activity, was considered. Thus, the primary objective was to quantify physical activity volume to appraise whether children met the WHO recommendations on PA. For that purpose, the short version of the adapted International Physical Activity Questionnaire (IPAQ) was used, which has shown good psychometric properties (Spearman’s p = 0.80 and Cronbach’s α > 0.80) [38]. Possible answers for question 61 were: (1)“no exercise” (free-time mainly occupied by sedentary activities such as reading, watching television, going to the cinema…); (2) “occasional physical activity or sport” (walking or cycling, gentle gymnastics, recreational activities that require a slight effort…); (3) “physical activity several times a month” (sports, gymnastics, running, swimming, cycling, team games…); and (4) “sports or physical training several times a week”.
2.4. Health-Related Quality of Life and Physical Activity Outcomes
- Mapping Child Health Utility instrument (Chu9d). This instrument evaluates HRQoL by processing the scores obtained from the questions included in “Module E: Quality of Life” (E14_1, E14_2, E14_3, E14_4, E14_8 and E14_9), extracted from the Kidscreen-10 instrument adapted for the Eurobarometer [36]. The variable is calculated according to Chen, Stevens, Rowen and Ratcliffe’s formula [39], appropriate for economic evaluations of health care since it transforms health status into social preferences. Moreover, it has been used in previous research on the same survey and database [40]. Results were collected on a scale of values of 0 to 1, being 0 the minimum and 1, the maximum values of HRQoL.
- Mquality. This variable is provided by the ENSE 2017 [33] and directly assesses children’s HRQoL. Calculations were implemented from the “Module E: Quality of Life” questions results, which correspond to the Kidscreen-10 Index modified proxy for the Eurobarometer. Nine questions presented a recall period of one week and five categories of responses as a Likert scale, with question number 10 the general perceived health question. The scores of the abovementioned instrument were transformed into a 0–100 scale that is used in the European Eurobarometer study: higher scores match higher HRQoL.
- Physical Activity (K61 in ENSE 2017). This instrument determines the PA done by the child in his/her free time, regarding the frequency of engagement. The final score was accomplished through the analysis of the response level in question 61 of “Block K: Rest and Physical Activity”. Possible values were: (1) “the child does not exercise”, (2) “the child does some occasional physical activity or sport”, (3) “the child does physical activity several times a month”, or (4) “the child does sports or physical training several times a week”.
2.5. Statistical Analysis
3. Results
4. Discussion
5. Conclusions
Author Contributions
Funding
Institutional Review Board Statement
Informed Consent Statement
Data Availability Statement
Conflicts of Interest
References
- Teoli, D.; Bhardwaj, A. Quality of Life; Updated 31 March 2021; StatPearls Publishing: Treasure Island, FL, USA, 2021. [Google Scholar]
- Shumaker, S.A. (Ed.) The International Assessment of Health Related Quality of Life: Theory, Translation, Measurement and Analysis; Rapid Communications: Oxford, UK, 1995; ISBN 978-1-85650-004-3. [Google Scholar]
- Zubritsky, C.; Abbott, K.M.; Hirschman, K.B.; Bowles, K.H.; Foust, J.B.; Naylor, M.D. Health-Related Quality of Life: Expanding a Conceptual Framework to Include Older Adults Who Receive Long-Term Services and Supports. Gerontologist 2013, 53, 205–210. [Google Scholar] [CrossRef] [Green Version]
- Solans, M.; Pane, S.; Estrada, M.D.; Serra-Sutton, V.; Berra, S.; Herdman, M.; Alonso, J.; Rajmil, L. Health-Related Quality of Life Measurement in Children and Adolescents: A Systematic Review of Generic and Disease-Specific Instruments. Value Health 2008, 11, 742–764. [Google Scholar] [CrossRef] [Green Version]
- Wallander, J.L.; Koot, H.M. Quality of Life in Children: A Critical Examination of Concepts, Approaches, Issues, and Future Directions. Clin. Psychol. Rev. 2016, 45, 131–143. [Google Scholar] [CrossRef] [Green Version]
- The LIVSFORSK Network; Haraldstad, K.; Wahl, A.; Andenæs, R.; Andersen, J.R.; Andersen, M.H.; Beisland, E.; Borge, C.R.; Engebretsen, E.; Eisemann, M.; et al. A Systematic Review of Quality of Life Research in Medicine and Health Sciences. Qual. Life Res. 2019, 28, 2641–2650. [Google Scholar] [CrossRef] [Green Version]
- Tsiros, M.D.; Olds, T.; Buckley, J.D.; Grimshaw, P.; Brennan, L.; Walkley, J.; Hills, A.P.; Howe, P.R.C.; Coates, A.M. Health-Related Quality of Life in Obese Children and Adolescents. Int. J. Obes. 2009, 33, 387–400. [Google Scholar] [CrossRef] [Green Version]
- Cordero, M.L. Calidad de Vida Relacionada a La Salud de Niños y Niñas Rurales de Tucumán, Argentina (2015). Poblac. Salud Mesoam. 2019, 16, 72–101. [Google Scholar] [CrossRef]
- Organización Mundial de la Salud. Obesidad y Sobrepeso. 2021. Available online: https://www.who.int/es/news-room/fact-sheets/detail/obesity-and-overweight (accessed on 1 June 2021).
- Pakpour, A.H.; Chen, C.-Y.; Lin, C.-Y.; Strong, C.; Tsai, M.-C.; Lin, Y.-C. The Relationship between Children’s Overweight and Quality of Life: A Comparison of Sizing Me Up, PedsQL and Kid-KINDL. Int. J. Clin. Health Psychol. 2019, 19, 49–56. [Google Scholar] [CrossRef] [PubMed]
- World Obesity Federation. Anual Review and Report. For the Year Ended 31 December 2020; World Obesity Federation: London, UK, 2021. [Google Scholar]
- Vaquera, E.; Jones, R.; Marí-Klose, P.; Marí-Klose, M.; Cunningham, S.A. Unhealthy Weight among Children in Spain and the Role of the Home Environment. BMC Res. Notes 2018, 11, 591. [Google Scholar] [CrossRef]
- Estudio Estudio de Vigilancia Del Crecimiento, Alimentación, Actividad Física, Desarrollo Infantil y Obesidad En España (ALADINO); Agencia Española de Consumo, Seguridad Alimentaria y Nutrición (AECOSAN): Madrid, Spain, 2015.
- Estudio Estudio de Vigilancia Del Crecimiento, Alimentación, Actividad Física, Desarrollo Infantil y Obesidad En España (ALADINO); Agencia Española de Consumo, Seguridad Alimentaria y Nutrición (AECOSAN): Madrid, Spain, 2019.
- Gomes, A.C.; Rebelo, M.A.B.; de Queiroz, A.C.; Herkrath, A.; Herkrath, F.J.; Vieira, J.M.R.; Pereira, J.V.; Vettore, M.V. Socioeconomic Status, Social Support, Oral Health Beliefs, Psychosocial Factors, Health Behaviours and Health-Related Quality of Life in Adolescents. Qual. Life Res. 2020, 29, 141–151. [Google Scholar] [CrossRef] [PubMed]
- Lacy, K.E.; Allender, S.E.; Kremer, P.J.; de Silva-Sanigorski, A.M.; Millar, L.M.; Moodie, M.L.; Mathews, L.B.; Malakellis, M.; Swinburn, B.A. Screen Time and Physical Activity Behaviours Are Associated with Health-Related Quality of Life in Australian Adolescents. Qual. Life Res. 2012, 21, 1085–1099. [Google Scholar] [CrossRef] [PubMed]
- Goldfield, G.S.; Cameron, J.D.; Murray, M.; Maras, D.; Wilson, A.L.; Phillips, P.; Kenny, G.P.; Hadjiyannakis, S.; Alberga, A.S.; Tulloch, H.; et al. Screen Time Is Independently Associated with Health-Related Quality of Life in Overweight and Obese Adolescents. Acta Paediatr. 2015, 104, E448–E454. [Google Scholar] [CrossRef] [PubMed]
- Saunders, T.J.; Vallance, J.K. Screen Time and Health Indicators among Children and Youth: Current Evidence, Limitations and Future Directions. Appl. Health Econ. Health Policy 2017, 15, 323–331. [Google Scholar] [CrossRef] [PubMed]
- Poitras, V.J.; Gray, C.E.; Borghese, M.M.; Carson, V.; Chaput, J.P.; Janssen, I.; Katzmarzyk, P.T.; Pate, R.R.; Gorber, S.C.; Kho, M.E.; et al. Systematic Review of the Relationships between Objectively Measured Physical Activity and Health Indicators in School-Aged Children and Youth. Appl. Physiol. Nutr. Metab. 2016, 41, S197–S239. [Google Scholar] [CrossRef]
- Ruiz, J.R.; Castro-Pinero, J.; Artero, E.G.; Ortega, F.B.; Sjostrom, M.; Suni, J.; Castillo, M.J. Predictive Validity of Health-Related Fitness in Youth: A Systematic Review. Br. J. Sports Med. 2009, 43, 909–923. [Google Scholar] [CrossRef] [PubMed]
- Bize, R.; Johnson, J.A.; Plotnikoff, R.C. Physical Activity Level and Health-Related Quality of Life in the General Adult Population: A Systematic Review. Prev. Med. 2007, 45, 401–415. [Google Scholar] [CrossRef]
- Granger, C.L.; McDonald, C.F.; Berney, S.; Chao, C.; Denehy, L. Exercise Intervention to Improve Exercise Capacity and Health Related Quality of Life for Patients with Non-Small Cell Lung Cancer: A Systematic Review. Lung Cancer 2011, 72, 139–153. [Google Scholar] [CrossRef]
- Hasenoehrl, T.; Keilani, M.; Komanadj, T.S.; Mickel, M.; Margreiter, M.; Marhold, M.; Crevenna, R. The Effects of Resistance Exercise on Physical Performance and Health-Related Quality of Life in Prostate Cancer Patients: A Systematic Review. Support Care Cancer 2015, 23, 2479–2497. [Google Scholar] [CrossRef]
- Latimer-Cheung, A.E.; Pilutti, L.A.; Hicks, A.L.; Ginis, K.A.M.; Fenuta, A.M.; MacKibbon, K.A.; Motl, R.W. Effects of Exercise Training on Fitness, Mobility, Fatigue, and Health-Related Quality of Life Among Adults With Multiple Sclerosis: A Systematic Review to Inform Guideline Development. Arch. Phys. Med. Rehabil. 2013, 94, 1800–1828. [Google Scholar] [CrossRef] [PubMed]
- Mishra, S.I.; Scherer, R.W.; Snyder, C.; Geigle, P.; Gotay, C. Are Exercise Programs Effective for Improving Health-Related Quality of Life Among Cancer Survivors? A Systematic Review and Meta-Analysis. Oncol. Nurs. Forum 2014, 41, E326–E342. [Google Scholar] [CrossRef] [Green Version]
- Neto, M.G.; de Lacerda, F.F.R.; Lopes, A.A.; Martinez, B.P.; Saquetto, M.B. Intradialytic Exercise Training Modalities on Physical Functioning and Health-Related Quality of Life in Patients Undergoing Maintenance Hemodialysis: Systematic Review and Meta-Analysis. Clin. Rehabil. 2018, 32, 1189–1202. [Google Scholar] [CrossRef]
- Parmenter, B.J.; Dieberg, G.; Phipps, G.; Smart, N.A. Exercise Training for Health-Related Quality of Life in Peripheral Artery Disease: A Systematic Review and Meta-Analysis. Vasc. Med. 2015, 20, 30–40. [Google Scholar] [CrossRef] [PubMed] [Green Version]
- Tanaka, R.; Ozawa, J.; Kito, N.; Moriyama, H. Does Exercise Therapy Improve the Health-Related Quality of Life of People with Knee Osteoarthritis? A Systematic Review and Meta-Analysis of Randomized Controlled Trials. J. Phys. Ther. Sci. 2015, 27, 3309–3314. [Google Scholar] [CrossRef] [Green Version]
- Tulloch, A.; Bombell, H.; Dean, C.; Tiedemann, A. Yoga-Based Exercise Improves Health-Related Quality of Life and Mental Well-Being in Older People: A Systematic Review of Randomised Controlled Trials. Age Ageing 2018, 47, 536–544. [Google Scholar] [CrossRef] [Green Version]
- Wu, W.B.; Liu, X.D.; Wang, L.B.; Wang, Z.W.; Hu, J.; Yan, J.T. Effects of Tai Chi on Exercise Capacity and Health-Related Quality of Life in Patients with Chronic Obstructive Pulmonary Disease: A Systematic Review and Meta-Analysis. Int. J. Chron. Obstruct. Pulmon. Dis. 2014, 9, 1253–1263. [Google Scholar] [CrossRef] [Green Version]
- Biddle, S.J.H.; Asare, M. Physical Activity and Mental Health in Children and Adolescents: A Review of Reviews. Br. J. Sports Med. 2011, 45, 886–895. [Google Scholar] [CrossRef] [Green Version]
- Lubans, D.; Richards, J.; Hillman, C.; Faulkner, G.; Beauchamp, M.; Nilsson, M.; Kelly, P.; Smith, J.; Raine, L.; Biddle, S. Physical Activity for Cognitive and Mental Health in Youth: A Systematic Review of Mechanisms. Pediatrics 2016, 138, 13. [Google Scholar] [CrossRef] [Green Version]
- Ministerio de Sanidad, Consumo y Bienestar Social, Gobierno de España Encuesta Nacional de Salud; The Ministry of Health, Consumption and Social Welfare: Madrid, Spain, 2017.
- The Gallup Organization, E. Parents’ Views on the Mental Health of Their Child. Analytical Report; Directorate General Health and Consumers: Budapest, Hungary, 2009. [Google Scholar]
- Ravens-Sieberer, U.; Erhart, M.; Rajmil, L.; Herdman, M.; Auquier, P.; Bruil, J.; Power, M.; Duer, W.; Abel, T.; Czemy, L.; et al. Reliability, Construct and Criterion Validity of the KIDSCREEN-10 Score: A Short Measure for Children and Adolescents’ Well-Being and Health-Related Quality of Life. Qual. Life Res. 2010, 19, 1487–1500. [Google Scholar] [CrossRef] [Green Version]
- The KidScreen Group Europe. The KIDSCREEN Questionnaires: Quality of Life Questionnaires for Children and Adolescents Handbook; Pabst Science Publ: Lengerich, Germany, 2006. [Google Scholar]
- Aymerich, M.; Berra, S.; Guillamón, I.; Herdman, M.; Alonso, J.; Ravens-Sieberer, U.; Rajmil, L. Development of the Spanish Version of the KIDSCREEN, a Questionnaire of Quality of Life for Child and Adolescent Population. Gac. Sanit. 2005, 19, 93–102. [Google Scholar] [CrossRef] [PubMed] [Green Version]
- Craig, C.L.; Marshall, A.L.; Sjöström, M.; Bauman, A.E.; Booth, M.L.; Ainsworth, B.E.; Pratt, M.; Ekelund, U.; Yngve, A.; Sallis, J.F.; et al. International Physical Activity Questionnaire: 12-Country Reliability and Validity. Med. Sci. Sports Exerc. 2003, 35, 1381–1395. [Google Scholar] [CrossRef] [Green Version]
- Chen, G.; Stevens, K.; Rowen, D.; Ratcliffe, J. From KIDSCREEN-10 to CHU9D: Creating a Unique Mapping Algorithm for Application in Economic Evaluation. Health Qual. Life Outcomes 2014, 12, 11. [Google Scholar] [CrossRef] [Green Version]
- Gallego-Méndez, J.; Perez-Gomez, J.; Calzada-Rodríguez, J.I.; Denche-Zamorano, Á.M.; Mendoza-Muñoz, M.; Carlos-Vivas, J.; Garcia-Gordillo, M.Á.; Adsuar, J.C. Relationship between Health-Related Quality of Life and Physical Activity in Children with Hyperactivity. Int. J. Environ. Res. Public Health 2020, 17, 2804. [Google Scholar] [CrossRef] [PubMed] [Green Version]
- Mondragón, M.A. Uso de La Correlación de Spearman En Un Estudio de Intervención En Fisioterapia. Mov. Científico 2014, 8, 98–104. [Google Scholar] [CrossRef]
- McMahon, E.M.; Corcoran, P.; O’Regan, G.; Keeley, H.; Cannon, M.; Carli, V.; Wasserman, C.; Hadlaczky, G.; Sarchiapone, M.; Apter, A.; et al. Physical Activity in European Adolescents and Associations with Anxiety, Depression and Well-Being. Eur. Child Adolesc. Psychiatry 2017, 26, 111–122. [Google Scholar] [CrossRef] [PubMed]
- Trost, S.G.; Pate, R.R.; Sallis, J.F.; Freedson, P.S.; Taylor, W.C.; Dowda, M.; Sirard, J. Age and Gender Differences in Objectively Measured Physical Activity in Youth. Med. Sci. Sports Exerc. 2002, 34, 350–355. [Google Scholar] [CrossRef] [PubMed]
- Pearce, M.S.; Basterfield, L.; Mann, K.D.; Parkinson, K.N.; Adamson, A.J.; Reilly, J.J.; Gateshead Millennium, S. Early Predictors of Objectively Measured Physical Activity and Sedentary Behaviour in 8–10 Year Old Children: The Gateshead Millennium Study. PLoS ONE 2012, 7, e37975. [Google Scholar] [CrossRef] [Green Version]
- Telford, R.M.; Telford, R.D.; Olive, L.S.; Cochrane, T.; Davey, R. Why Are Girls Less Physically Active than Boys? Findings from the LOOK Longitudinal Study. PLoS Med. 2016, 11, e0150041. [Google Scholar] [CrossRef]
- Eiser, C.; Morse, R. The Measurement of Quality of Life in Children: Past and Future Perspectives. J. Dev. Behav. Pediatr. 2001, 22, 248–256. [Google Scholar] [CrossRef]
- Ravens-Sieberer, U.; Ellert, U.; Erhart, M. Health-Related Quality of Life of Children and Adolescents in Germany. Norm Data from the German Health Interview and Examination Survey (KiGGS). Bundesgesundheitsblatt Gesundh. Gesundh. 2007, 50, 810–818. [Google Scholar] [CrossRef]
- Palacio-Vieira, J.A.; Villalonga-Olives, E.; Valderas, J.M.; Espallargues, M.; Herdman, M.; Berra, S.; Alonso, J.; Rajmil, L. Changes in Health-Related Quality of Life (HRQoL) in a Population-Based Sample of Children and Adolescents after 3 Years of Follow-Up. Qual. Life Res. 2008, 17, 1207–1215. [Google Scholar] [CrossRef] [PubMed]
- Ellert, U.; Ravens-Sieberer, U.; Erhart, M.; Kurth, B.M. Determinants of Agreement between Self-Reported and Parent-Assessed Quality of Life for Children in Germany-Results of the German Health Interview and Examination Survey for Children and Adolescents (KiGGS). Health Qual. Life Outcomes 2011, 9, 11. [Google Scholar] [CrossRef] [PubMed] [Green Version]
- Meyer, M.; Oberhoffer, R.; Hock, J.; Giegerich, T.; Muller, J. Health-Related Quality of Life in Children and Adolescents: Current Normative Data, Determinants and Reliability on Proxy-Report. J. Paediatr. Child Health 2016, 52, 628–631. [Google Scholar] [CrossRef]
- Ravens-Sieberer, U.; Erhart, M.; Wille, N.; Bullinger, M.; Grp, B.S. Health-Related Quality of Life in Children and Adolescents in Germany: Results of the BELLA Study. Eur. Child Adolesc. Psychiatry 2008, 17, 148–156. [Google Scholar] [CrossRef] [PubMed]
- Riddoch, C.J.; Andersen, L.B.; Wedderkopp, N.; Harro, M.; Klasson-Heggebo, L.; Sardinha, L.B.; Cooper, A.R.; Ekelund, U. Physical Activity Levels and Patterns of 9-and 15-Yr-Old European Children. Med. Sci. Sports Exerc. 2004, 36, 86–92. [Google Scholar] [CrossRef] [PubMed] [Green Version]
- Ridley, K.; Zabeen, S.; Lunnay, B.K. Children’s Physical Activity Levels during Organised Sports Practices. J. Sci. Med. Sport 2018, 21, 930–934. [Google Scholar] [CrossRef] [PubMed]
- Witt, P.A.; Dangi, T.B. Why Children/Youth Drop Out of Sports. J. Park Recreat. Adm. 2018, 36, 191–199. [Google Scholar] [CrossRef]
- Martinez, A.J.; Gallardo, A.M.; Garcia-Tascon, M.; Segarra, E. Analysis of Participation in the Schoolar Sports’ (9–18 Years) Promotion the Sport Program in the Region of Murcia. J. Sport Health Res. 2018, 10, 101–115. [Google Scholar]
- Rutten, C.; Boen, F.; Seghers, J. Changes in Physical Activity and Sedentary Behavior during the Transition from Elementary to Secondary School. J. Phys. Act. Health 2014, 11, 1607–1613. [Google Scholar] [CrossRef]
- Kim, M.; Cardinal, B.J.; Yun, J. Enhancing Student Motivation in College and University Physical Activity Courses Using Instructional Alignment Practices. J. Phys. Educ. Recreat. Danc. 2015, 86, 33–38. [Google Scholar] [CrossRef]
- Lamoneda-Prieto, J.; Huertas-Delgado, F.J. Sport Motivation in the Transition from Primary to Secondary School. Agora Para Educ. Fis. Deporte 2017, 19, 88–101. [Google Scholar]
- Finne, E.; Bucksch, J.; Lampert, T.; Kolip, P. Physical Activity and Screen-Based Media Use: Cross-Sectional Associations with Health-Related Quality of Life and the Role of Body Satisfaction in a Representative Sample of German Adolescents. Health Psychol. Behav. Med. 2013, 1, 15–30. [Google Scholar] [CrossRef] [PubMed]
- Galán, I.; Boix, R.; Medrano, M.J.; Ramos, P.; Rivera, F.; Pastor-Barriuso, R.; Moreno, C. Physical Activity and Self-Reported Health Status among Adolescents: A Cross-Sectional Population-Based Study. BMJ Open 2013, 3, e002644. [Google Scholar] [CrossRef] [Green Version]
- Chen, X.L.; Sekine, M.; Hamanishi, S.; Wang, H.B.; Gaina, A.; Yamagami, T.; Kagamimori, S. Lifestyles and Health-Related Quality of Life in Japanese School Children: A Cross-Sectional Study. Prev. Med. 2005, 40, 668–678. [Google Scholar] [CrossRef]
- Wu, X.Y.; Han, L.H.; Zhang, J.H.; Luo, S.; Hu, J.W.; Sun, K. The Influence of Physical Activity, Sedentary Behavior on Health-Related Quality of Life among the General Population of Children and Adolescents: A Systematic Review. PLoS ONE 2017, 12, e0187668. [Google Scholar] [CrossRef] [PubMed] [Green Version]
- Gopinath, B.; Hardy, L.L.; Baur, L.A.; Burlutsky, G.; Mitchell, P. Physical Activity and Sedentary Behaviors and Health-Related Quality of Life in Adolescents. Pediatrics 2012, 130, E167–E174. [Google Scholar] [CrossRef] [PubMed] [Green Version]
- World Health Organization. Global Recommendations on Physical Activity for Health; WHO: Genève, Switzerland, 2010; ISBN 978-92-4-159997-9. [Google Scholar]
- Morales, P.F.; Sanchez-Lopez, M.; Moya-Martinez, P.; Garcia-Prieto, J.C.; Martinez-Andres, M.; Garcia, N.L.; Martinez-Vizcaino, V. Health-Related Quality of Life, Obesity, and Fitness in Schoolchildren: The Cuenca Study. Qual. Life Res. 2013, 22, 1515–1523. [Google Scholar] [CrossRef]
- Donnelly, J.E.; Hillman, C.H.; Castelli, D.; Etnier, J.L.; Lee, S.; Tomporowski, P.; Lambourne, K.; Szabo-Reed, A.N. Physical Activity, Fitness, Cognitive Function, and Academic Achievement in Children: A Systematic Review. Med. Sci. Sports Exerc. 2016, 48, 1197–1222. [Google Scholar] [CrossRef] [PubMed] [Green Version]
- Tremblay, M.S.; LeBlanc, A.G.; Kho, M.E.; Saunders, T.J.; Larouche, R.; Colley, R.C.; Goldfield, G.; Gorber, S.C. Systematic Review of Sedentary Behaviour and Health Indicators in School-Aged Children and Youth. Int. J. Behav. Nutr. Phys. Act. 2011, 8, 22. [Google Scholar] [CrossRef] [Green Version]
- Costigan, S.A.; Barnett, L.; Plotnikoff, R.C.; Lubans, D.R. The Health Indicators Associated With Screen-Based Sedentary Behavior Among Adolescent Girls: A Systematic Review. J. Adolesc. Health 2013, 52, 382–392. [Google Scholar] [CrossRef]
- Hoare, E.; Milton, K.; Foster, C.; Allender, S. The Associations between Sedentary Behaviour and Mental Health among Adolescents: A Systematic Review. Int. J. Behav. Nutr. Phys. Act. 2016, 13, 22. [Google Scholar] [CrossRef] [PubMed] [Green Version]
- Herman, K.M.; Hopman, W.M.; Sabiston, C.M. Physical Activity, Screen Time and Self-Rated Health and Mental Health in Canadian Adolescents. Prev. Med. 2015, 73, 112–116. [Google Scholar] [CrossRef]
- Eime, R.M.; Young, J.A.; Harvey, J.T.; Charity, M.J.; Payne, W.R. A Systematic Review of the Psychological and Social Benefits of Participation in Sport for Children and Adolescents: Informing Development of a Conceptual Model of Health through Sport. Int. J. Behav. Nutr. Phys. Act. 2013, 10, 21. [Google Scholar] [CrossRef] [Green Version]
- Booth, F.W.; Roberts, C.K.; Laye, M.J. Lack of Exercise Is a Major Cause of Chronic Diseases. Compr. Physiol. 2012, 2, 1143–1211. [Google Scholar] [PubMed] [Green Version]
- Sigvartsen, J.; Gabrielsen, L.E.; Abildsnes, E.; Stea, T.H.; Omfjord, C.S.; Rohde, G. Exploring the Relationship between Physical Activity, Life Goals and Health-Related Quality of Life among High School Students: A Cross-Sectional Study. BMC Public Health 2016, 16, 9. [Google Scholar] [CrossRef] [PubMed] [Green Version]
- Gianicolo, E.A.L.; Eichler, M.; Muensterer, O.; Strauch, K.; Blettner, M. Methods for Evaluating Causality in Observational Studies. Dtsch. Aerzteblatt Online 2020, 117, 101. [Google Scholar] [CrossRef] [PubMed]


| Variables | Total | p * | Boys | p * | Girls | p * | p ** | ||||||
|---|---|---|---|---|---|---|---|---|---|---|---|---|---|
| Age | 8–12 (N = 2205) | 13–14 (N = 992) | 8–14 (N = 3197) | 8–12 (N = 1119) | 13–14 (N = 491) | 8–14 (N = 1610) | 8–12 (N = 1086) | 13–14 (N = 501) | 8–14 (N = 1587) | ||||
| Median (IR) | 10.00 (2) | 13.00 (1) | 11.00 (4) | n/a | 10.00 (2) | 13.00 (1) | 11.00 (4) | n/a | 10.00 (2) | 14.00 (1) | 11.00 (3) | n/a | 0.448 |
| Mean (SD) | 10.11 (1.41) | 13.50 (0.50) | 11.16 (1.97) | 10.10 (1.40) | 13.49 (0.50) | 11.14 (1.97) | 10.12 (1.42) | 13.50 (0.50) | 11.19 (1.98) | ||||
| PA | |||||||||||||
| Median (IR) | 3.00 (2) | 3.00 (2) | 3.00 (2) | 0.526 | 3.00 (2) | 3.00 (2) | 3.00 (2) | 0.041 | 3.00 (2) | 3.00 (2) | 3.00 (2) | 0.008 | <0.001 |
| Mean (SD) | 2.90 (1.03) | 2.85 (1.09) | 2.88 (1.05) | 3.04 (0.98) | 3.12 (1.00) | 3.06 (0.99) | 2.75 (1.06) | 2.59 (1.12) | 2.70 (1.08) | ||||
| Mquality | |||||||||||||
| Median (IR) | 90.00 (12.50) | 87.50 (15.00) | 90.00 (12.50) | <0.001 | 90.00 (12.50) | 87.50 (15.00) | 90.00 (12.50) | 0.085 | 90.00 (12.50) | 87.50 (15.00) | 90.00 (12.50) | <0.001 | 0.266 |
| Mean (SD) | 87.98 (10.30) | 86.23 (11.20) | 87.43 (10.62) | 87.57 (10.59) | 86.61 (10.70) | 87.27 (10.63) | 88.40 (9.97) | 85.86 (11.67) | 87.60 (10.60) | ||||
| Mapping Chu9d | |||||||||||||
| Median (IR) | 0.99 (0.10) | 0.97 (0.12) | 0.97 (0.11) | <0.001 | 0.97 (0.11) | 0.97 (0.11) | 0.97 (0.11) | 0.034 | 0.99 (0.11) | 0.97 (0.12) | 0.98 (0.10) | <0.001 | 0.039 |
| Mean (SD) | 0.97 (0.08) | 0.96 (0.09) | 0.97 (0.08) | 0.97 (0.08) | 0.96 (0.09) | 0.97 (0.08) | 0.98 (0.08) | 0.96 (0.09) | 0.97 (0.08) | ||||
| PA | Mquality | PA | Medians Dif | Means Dif | p * | p ** | Mapping Chu9d | PA | Medians Dif | Means Dif | p * | p ** | |
|---|---|---|---|---|---|---|---|---|---|---|---|---|---|
| 1 | Median (IR) | 87.50 (15) | 2 | −2.50 | −3.16 | <0.001 | <0.001 | 0.967 (0.117) | 2 | −0.006 | −0.019 | <0.001 | <0.001 |
| Mean (SD) | 84.23 (12.46) | 3 | 0.00 | −2.68 | 0.002 | 0.944 (0.967) | 3 | −0.006 | −0.025 | <0.001 | |||
| 4 | −2.50 | −4.93 | <0.001 | 4 | −0.027 | −0.037 | <0.001 | ||||||
| 2 | Median (IR) | 90 (17.5) | 1 | 2.50 | 3.16 | <0.001 | <0.001 | 0.973 (0.111) | 1 | 0.006 | 0.019 | <0.001 | <0.001 |
| Mean (SD) | 87.39 (11.17) | 3 | 2.50 | 0.48 | 0.04 | 0.963 (0.09) | 3 | 0.000 | −0.005 | 0.956 | |||
| 4 | 0.00 | −1.77 | 0.006 | 4 | −0.021 | −0.018 | <0.001 | ||||||
| 3 | Median (IR) | 87.50 (15) | 1 | 0.00 | 2.68 | <0.001 | 0.002 | 0.973 (0.107) | 1 | 0.006 | 0.025 | <0.001 | <0.001 |
| Mean (SD) | 86.91 (9.74) | 2 | −2.50 | −0.48 | 0.04 | 0.968 (0.077) | 2 | 0.000 | 0.005 | 0.956 | |||
| 4 | −2.50 | −2.25 | <0.001 | 4 | −0.021 | −0.013 | <0.001 | ||||||
| 4 | Median (IR) | 90 (12.5) | 1 | 2.50 | 4.93 | <0.001 | <0.001 | 0.995 (0.108) | 1 | 0.027 | 0.037 | <0.001 | <0.001 |
| Mean (SD) | 89.16 (9.88) | 2 | 0.00 | 1.77 | 0.006 | 0.981 (0.073) | 2 | 0.021 | 0.018 | <0.001 | |||
| 3 | 2.50 | 2.25 | <0.001 | 3 | 0.021 | 0.013 | <0.001 |
| Variables | Not Participate in Physical Activity or Do Occasionally/Several Times a Month (N = 2046) | Participate in Physical Activity Several Times a Week (N = 1151) | p |
|---|---|---|---|
| Mquality | <0.001 | ||
| Median (IR) | 87.50 (15) | 90 (12.5) | |
| Mean (SD) | 86.47 (10.89) | 89.16 (9.89) | |
| Mapping Chu9d | <0.001 | ||
| Median (IR) | 0.97 (0.111) | 0.99 (0.108) | |
| Mean (SD) | 0.96 (0.086) | 0.98 (0.073) |
| Mquality | PA rho | p | Mapping Chu9d | PA rho | p |
|---|---|---|---|---|---|
| Total sample | 0.124 | <0.001 | Total sample | 0.122 | <0.001 |
| Boys (total) | 0.142 | <0.001 | Boys (total) | 0.142 | <0.001 |
| 8–12 years | 0.130 | <0.001 | 8–12 | 0.119 | <0.001 |
| 13–14 years | 0.173 | <0.001 | 13–14 | 0.201 | <0.001 |
| Girls (total) | 0.123 | <0.001 | Girls (total) | 0.123 | <0.001 |
| 8–12 years | 0.089 | 0.003 | 8–12 | 0.100 | 0.001 |
| 13–14 years | 0.174 | <0.001 | 13–14 | 0.153 | 0.001 |
Publisher’s Note: MDPI stays neutral with regard to jurisdictional claims in published maps and institutional affiliations. |
© 2021 by the authors. Licensee MDPI, Basel, Switzerland. This article is an open access article distributed under the terms and conditions of the Creative Commons Attribution (CC BY) license (https://creativecommons.org/licenses/by/4.0/).
Share and Cite
Calzada-Rodríguez, J.I.; Denche-Zamorano, Á.M.; Pérez-Gómez, J.; Mendoza-Muñoz, M.; Carlos-Vivas, J.; Barrios-Fernandez, S.; Adsuar, J.C. Health-Related Quality of Life and Frequency of Physical Activity in Spanish Students Aged 8–14. Int. J. Environ. Res. Public Health 2021, 18, 9418. https://0-doi-org.brum.beds.ac.uk/10.3390/ijerph18179418
Calzada-Rodríguez JI, Denche-Zamorano ÁM, Pérez-Gómez J, Mendoza-Muñoz M, Carlos-Vivas J, Barrios-Fernandez S, Adsuar JC. Health-Related Quality of Life and Frequency of Physical Activity in Spanish Students Aged 8–14. International Journal of Environmental Research and Public Health. 2021; 18(17):9418. https://0-doi-org.brum.beds.ac.uk/10.3390/ijerph18179418
Chicago/Turabian StyleCalzada-Rodríguez, José I., Ángel M. Denche-Zamorano, Jorge Pérez-Gómez, María Mendoza-Muñoz, Jorge Carlos-Vivas, Sabina Barrios-Fernandez, and José Carmelo Adsuar. 2021. "Health-Related Quality of Life and Frequency of Physical Activity in Spanish Students Aged 8–14" International Journal of Environmental Research and Public Health 18, no. 17: 9418. https://0-doi-org.brum.beds.ac.uk/10.3390/ijerph18179418