
Communicating Air Quality Index Information: Effects of Different Styles on Individuals’ Risk Perception and Precaution Intention


Abstract
:1. Introduction
2. Literature Review
2.1. AQI Information
2.2. Valence of AQI Descriptor and Risk Perception
2.3. Third-Person Effect of AQI Warning Messages
3. Method
3.1. Procedure
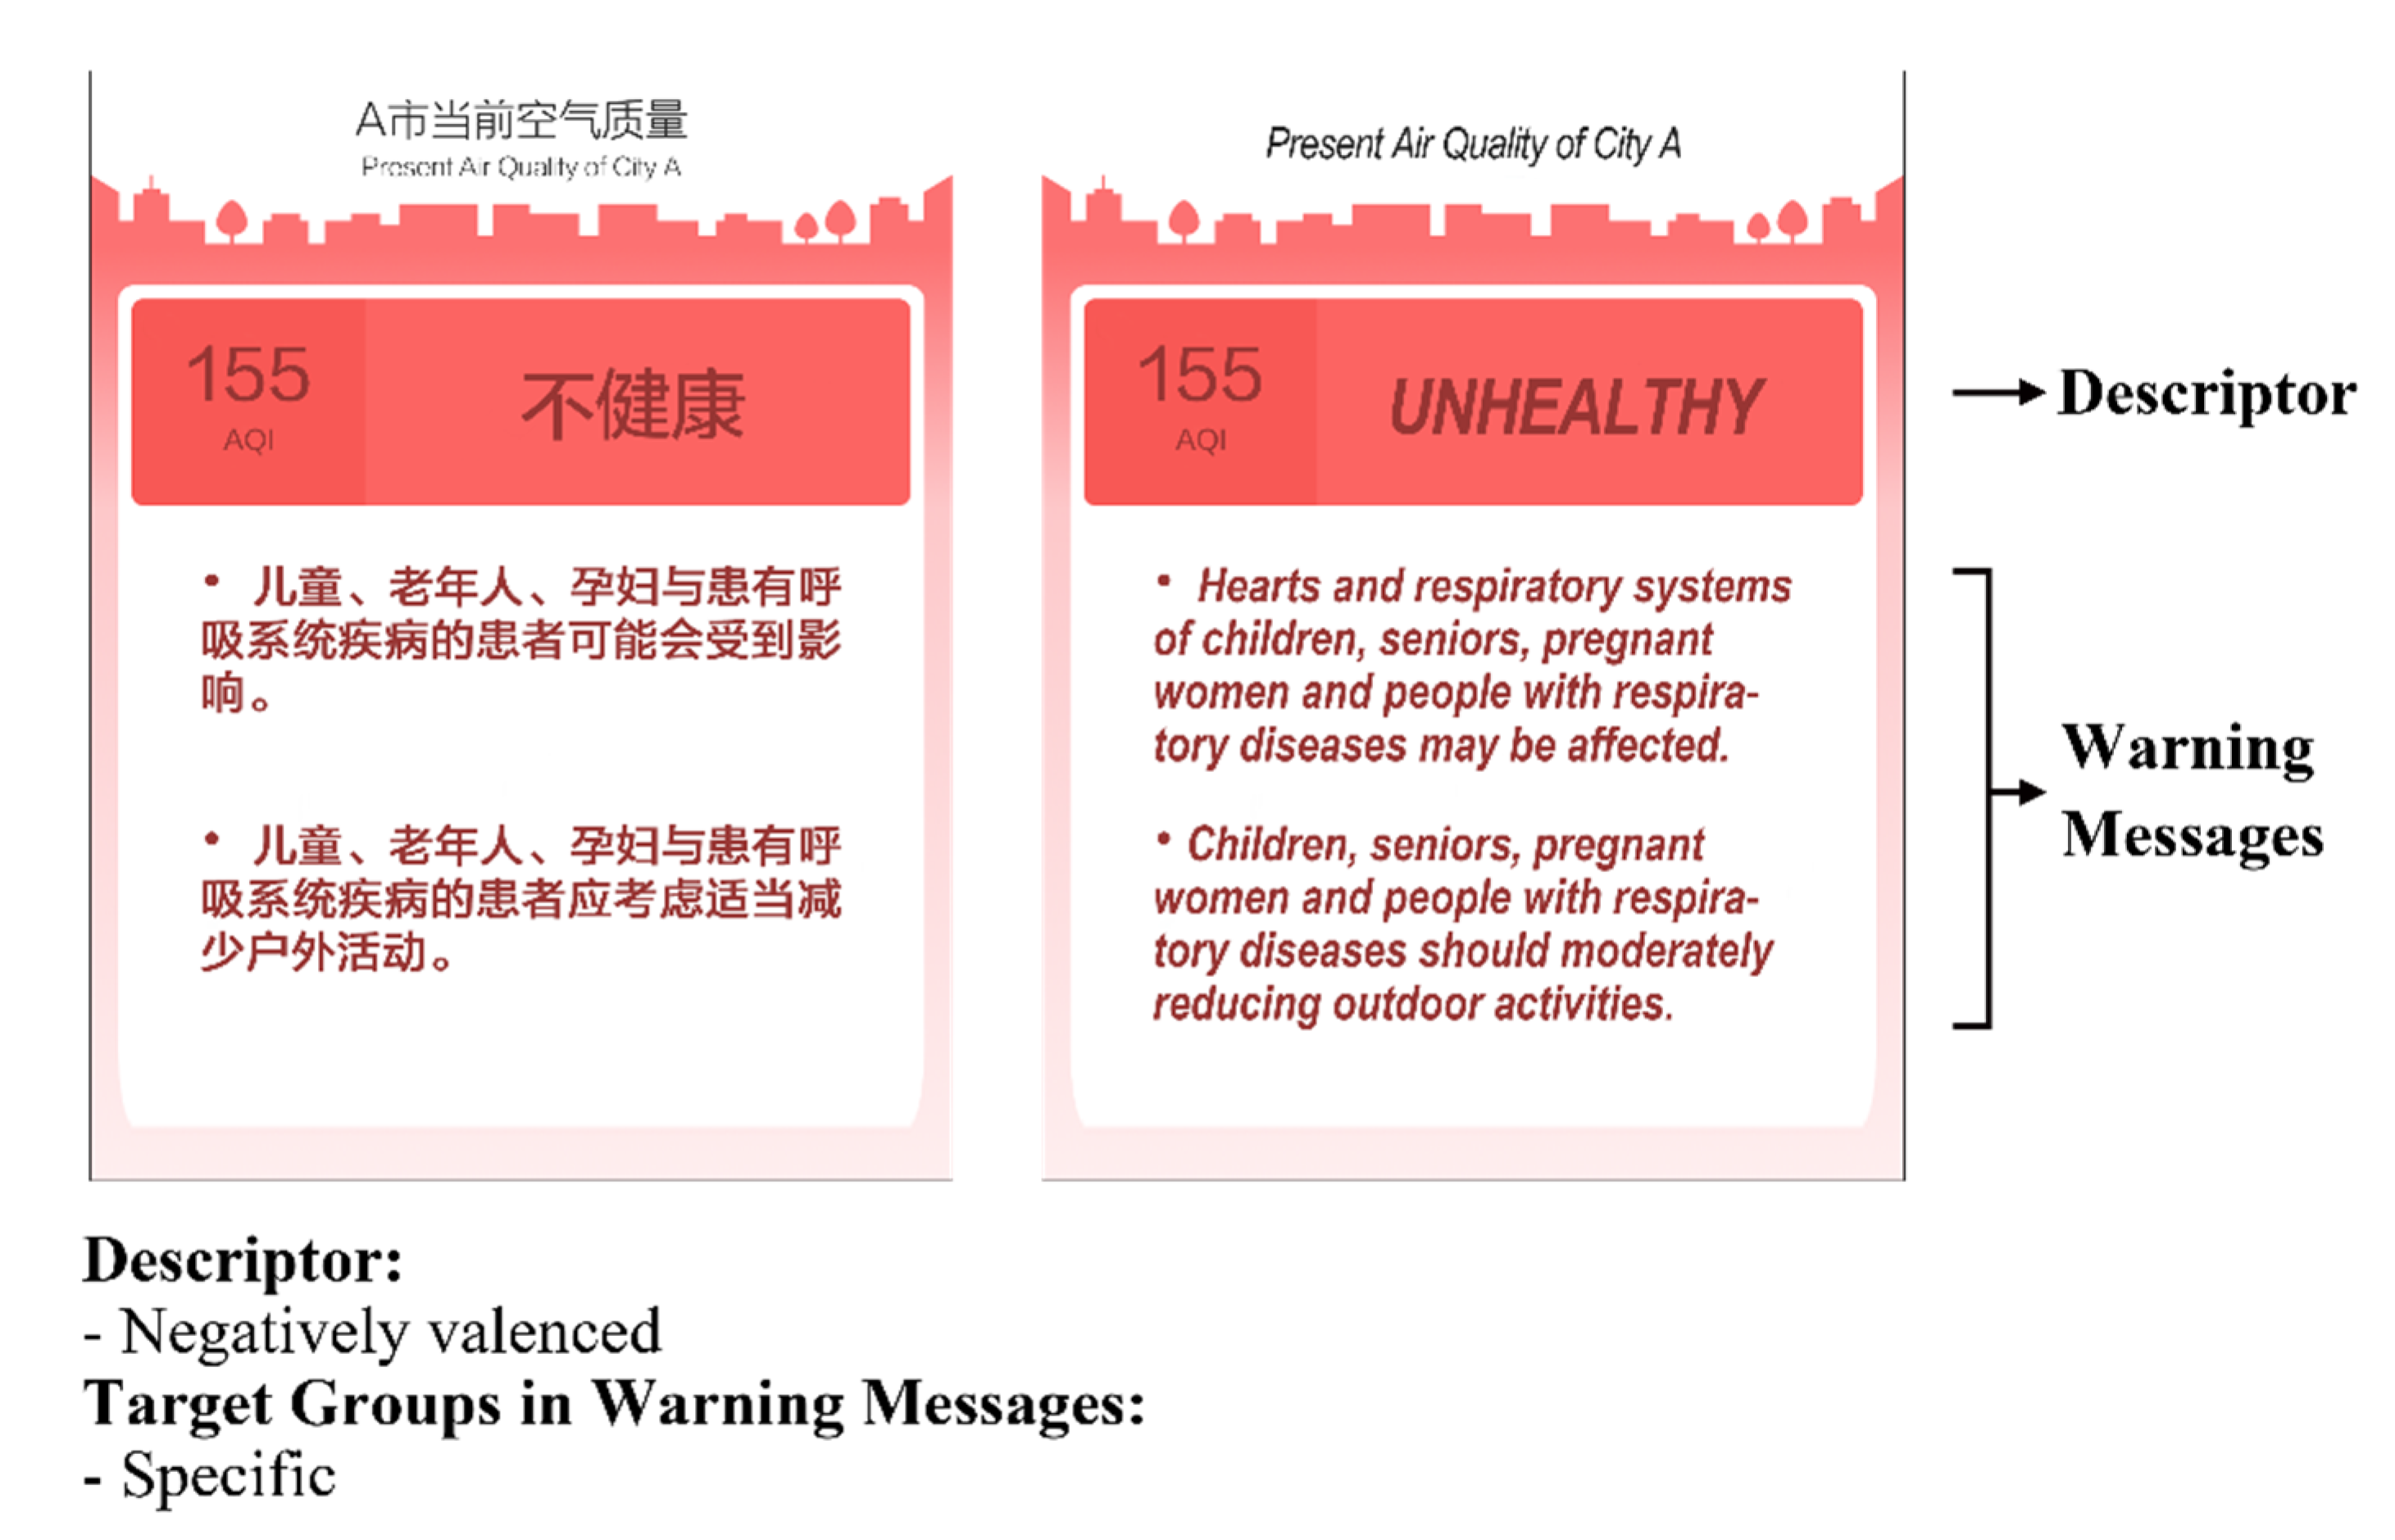
3.2. Stimuli
3.3. Sample
3.4. Measures
3.5. Attention and Manipulation Check
4. Results
4.1. Descriptive Results
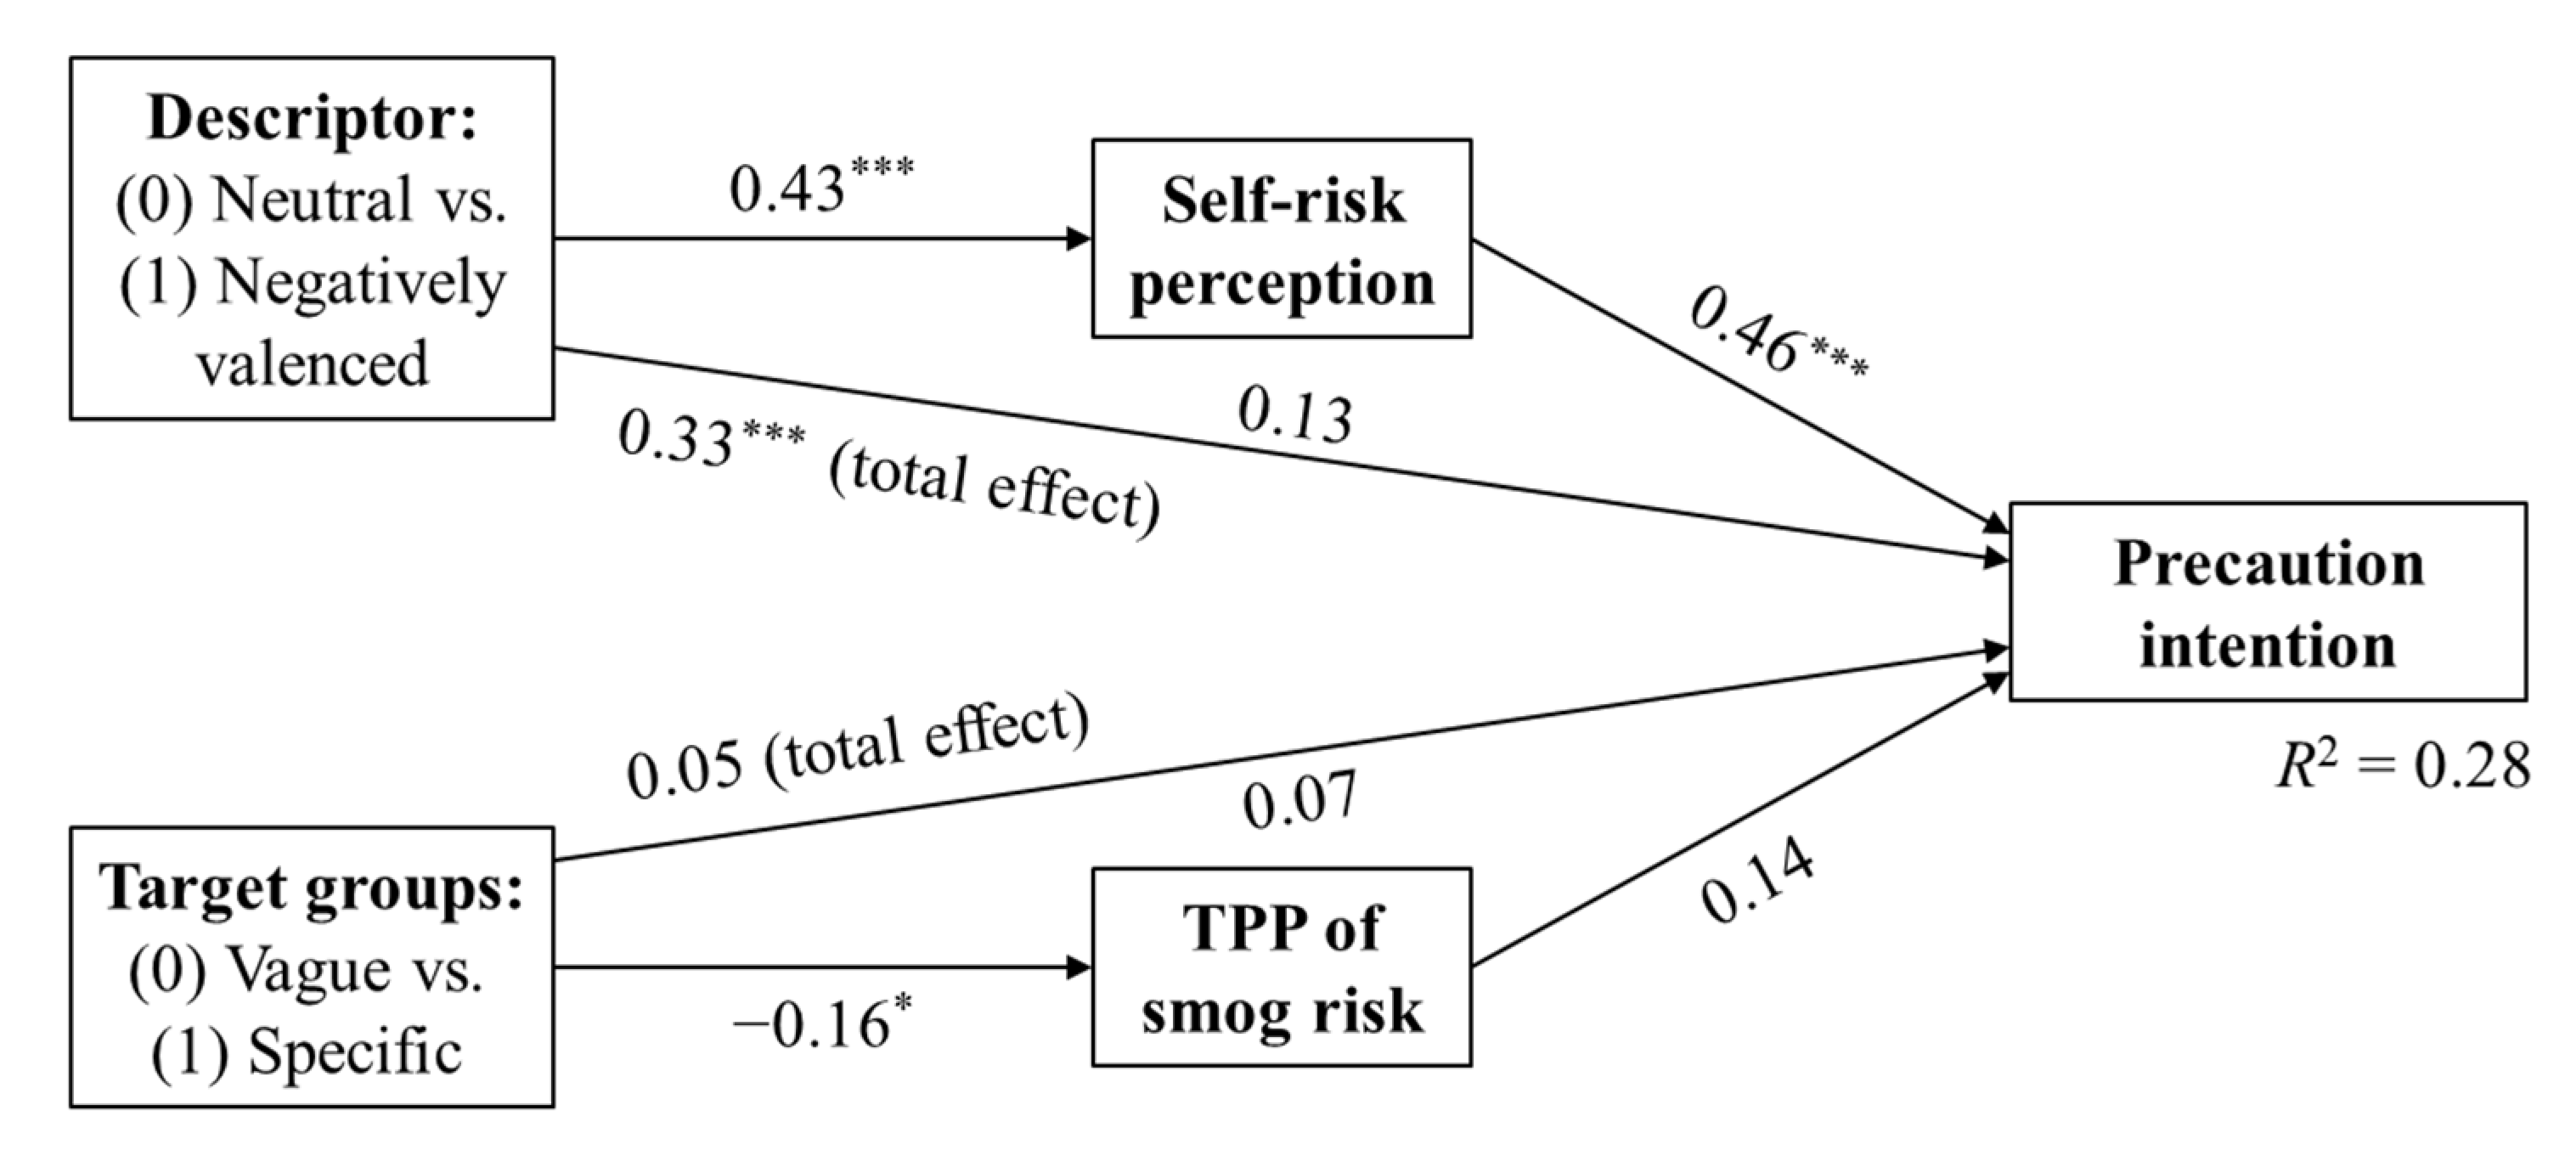
4.2. Hypotheses Testing
5. Discussion
Limitations and Future Research
6. Conclusions
Supplementary Materials
Author Contributions
Funding
Institutional Review Board Statement
Informed Consent Statement
Data Availability Statement
Conflicts of Interest
References
- Ritchie, H. Air Pollution. Our World in Data. 2017. Available online: https://ourworldindata.org/air-pollution (accessed on 10 July 2020).
- NASA. Smog or Fog? Actually, a Bit of Both. 2014. Available online: https://earthobservatory.nasa.gov/images/84701/smog-or-fog-actually-a-bit-of-both (accessed on 13 July 2020).
- Brauer, M.; Brumm, J.; Vedal, S.; Petkau, A.J. Exposure misclassification and threshold concentrations in time series analyses of air pollution health effects. Risk Anal. 2002, 22, 1183–1193. [Google Scholar] [CrossRef]
- Salvador, S.; Salvador, E.; Air Quality Index (AQI). Presented at the Air Quality Communication Workshop. United States Environmental Protection Agency. 2012. Available online: https://www.epa.gov/sites/production/files/2014-05/documents/zell-aqi.pdf (accessed on 13 July 2020).
- Kanchan, K.; Gorai, A.K.; Goyal, P. A review on air quality indexing system. Asian J. Atmos. Environ. 2015, 9, 101–113. [Google Scholar] [CrossRef] [Green Version]
- United States Environmental Protection Agency. Technical Assistance Document for the Reporting of Daily Air Quality; USEPA: Research Triangle Park, NC, USA, 2018. Available online: https://www.airnow.gov/publications/air-quality-index/technical-assistance-document-for-reporting-the-daily-aqi/ (accessed on 13 July 2020).
- World Health Organization. Air Quality Guidelines for Europe, 2nd ed.; WHO: Copenhagen, Denmark, 2000; Available online: https://apps.who.int/iris/handle/10665/107335 (accessed on 13 July 2020).
- Han, L.; Zhou, W.; Pickett, S.T.; Li, W.; Qian, Y. Multicontaminant air pollution in Chinese cities. Bull. World Health Organ. 2018, 96, 233. [Google Scholar] [CrossRef]
- Ministry of Ecology and Environment of the People’s Republic of China. Technical Regulation on Ambient Air Quality Index; (on trial); MEEPRC: Beijing, China, 2012. Available online: http://www.mee.gov.cn/ywgz/fgbz/bz/bzwb/jcffbz/201203/t20120302_224166.shtml (accessed on 13 July 2020). (In Chinese)
- Fu, X.; Huang, L.; Zhu, W.; Zou, Y. Haze-related health protective behaviors among citizens in Beijing city: An online survey. Chin. J. Public Health 2021, 37, 1273–1276. Advance online publication(In Chinese) [Google Scholar] [CrossRef]
- Duan, R.; Takahashi, B. The two-way flow of news: A comparative study of American and Chinese newspaper coverage of Beijing’s air pollution. Int. Commun. Gaz. 2017, 79, 83–107. [Google Scholar] [CrossRef]
- Huang, J.; Yang, J.Z. Beyond under the dome: An environmental documentary amplified public risk perception about air pollution in China. J. Risk Res. 2020, 23, 227–241. [Google Scholar] [CrossRef]
- Li, H.; Svarverud, R. When London hit the headlines: Historical analogy and the Chinese media discourse on air pollution. China Q. 2018, 234, 357–376. [Google Scholar] [CrossRef] [Green Version]
- Bush, J.; Moffatt, S.; Dunn, C.E. Keeping the public informed? Public negotiation of air quality information. Public Underst. Sci. 2001, 10, 213–229. [Google Scholar] [CrossRef]
- Slovic, P.; Fischhoff, B.; Lichtenstein, S. Facts and Fears: Understanding Perceived Risk. In The Perception of Risk; Slovic, P., Ed.; Earthscan Publications: New York, NY, USA, 2000; pp. 137–153. [Google Scholar]
- World Health Organization. Air Quality Guidelines. Global Update 2005. Particulate Matter, Ozone, Nitrogen Dioxide and Sulfur Dioxide; WHO: Copenhagen, Denmark, 2006; Available online: https://www.euro.who.int/en/health-topics/environment-and-health/Housing-and-health/publications/pre-2009/air-quality-guidelines.-global-update-2005.-particulate-matter,-ozone,-nitrogen-dioxide-and-sulfur-dioxide (accessed on 13 July 2020).
- Brunekreef, B.; Holgate, S.T. Air pollution and health. Lancet 2002, 360, 1233–1242. [Google Scholar] [CrossRef]
- Chen, B.; Kan, H. Air pollution and population health: A global challenge. Environ. Health Prev. Med. 2008, 13, 94–101. [Google Scholar] [CrossRef] [PubMed] [Green Version]
- Daniels, M.J.; Dominici, F.; Zeger, S.L.; Samet, J.M. The National Morbidity, Mortality, and Air Pollution Study. Part III: PM10 Concentration-Response Curves and Thresholds for the 20 Largest US Cities; Research report; Health Effects Institute: Boston, MA, USA, 2004; 94 Pt 3; pp. 1–21. Available online: https://europepmc.org/article/med/15457982 (accessed on 15 July 2020).
- Samoli, E.; Analitis, A.; Touloumi, G.; Schwartz, J.; Anderson, H.R.; Sunyer, J.; Bisanti, L.; Zmirou, D.; Vonk, J.M.; Pekkanen, J.; et al. Estimating the exposure–response relationships between particulate matter and mortality within the APHEA multicity project. Environ. Health Perspect. 2005, 113, 88–95. [Google Scholar] [CrossRef]
- Pope Iii, C.A.; Burnett, R.T.; Thun, M.J.; Calle, E.E.; Krewski, D.; Ito, K.; Thurston, G.D. Lung cancer, cardiopulmonary mortality, and long-term exposure to fine particulate air pollution. JAMA 2002, 287, 1132–1141. [Google Scholar] [CrossRef] [Green Version]
- Raaschou-Nielsen, O.; Andersen, Z.J.; Beelen, R.; Samoli, E.; Stafoggia, M.; Weinmayr, G.; Hoffmann, B.; Fischer, P.; Nieuwenhuijsen, M.J.; Brunekreef,, B.; et al. Air pollution and lung cancer incidence in 17 European cohorts: Prospective analyses from the European Study of Cohorts for Air Pollution Effects (ESCAPE). Lancet Oncol. 2013, 14, 813–822. [Google Scholar] [CrossRef]
- Central Pollution Control Board of India. National Air Quality Index. CPCBI. 17 September 2014. Available online: https://app.cpcbccr.com/AQI_India/ (accessed on 15 July 2020).
- Pope Iii, C.A. Invited commentary: Particulate matter-mortality exposure-response relations and threshold. Am. J. Epidemiol. 2000, 152, 407–412. [Google Scholar] [CrossRef] [Green Version]
- Gehring, U.; Wijga, A.H.; Hoek, G.; Bellander, T.; Berdel, D.; Brüske, I.; Fuertes, E.; Gruzieva, O.; Heinrich, J.; Hoffmann, B.; et al. Exposure to air pollution and development of asthma and rhinoconjunctivitis throughout childhood and adolescence: A population-based birth cohort study. Lancet Respir. Med. 2015, 3, 933–942. [Google Scholar] [CrossRef] [Green Version]
- Lee, B.J.; Kim, B.; Lee, K. Air pollution exposure and cardiovascular disease. Toxicol. Res. 2014, 30, 71–75. [Google Scholar] [CrossRef]
- Deguen, S.; Zmirou-Navier, D. Social inequalities resulting from health risks related to ambient air quality—A European review. Eur. J. Public Health 2010, 20, 27–35. [Google Scholar] [CrossRef] [Green Version]
- Sun, C.; Kahn, M.E.; Zheng, S. Self-protection investment exacerbates air pollution exposure inequality in urban China. Ecol. Econ. 2017, 131, 468–474. [Google Scholar] [CrossRef] [Green Version]
- Wong, C.M.; Ou, C.Q.; Chan, K.P.; Chau, Y.K.; Thach, T.Q.; Yang, L.; Chung, R.Y.N.; Thomas, G.N.; Peiris, J.S.M.; Wong, T.W.; et al. The effects of air pollution on mortality in socially deprived urban areas in Hong Kong, China. Environ. Health Perspect. 2008, 116, 1189–1194. [Google Scholar] [CrossRef] [PubMed] [Green Version]
- China Power Team. Is Air Quality in China a Social Problem? China Power Team. 16 February 2020. Available online: https://chinapower.csis.org/air-quality/ (accessed on 16 July 2020).
- Ponari, M.; Rodríguez-Cuadrado, S.; Vinson, D.; Fox, N.; Costa, A.; Vigliocco, G. Processing advantage for emotional words in bilingual speakers. Emotion 2015, 15, 644–652. [Google Scholar] [CrossRef] [PubMed] [Green Version]
- Air Korea. Introduction to the CAI. Air Korea. 2018. Available online: https://www.airkorea.or.kr/eng/khaiInfo?pMENU_NO=166 (accessed on 13 July 2020).
- Department for Environment Food & Rural Affairs of UK. Daily Air Quality Index. DEFRAUK. 2011. Available online: https://uk-air.defra.gov.uk/air-pollution/daqi (accessed on 13 July 2020).
- Department of Planning, Industry and Environment of NSW. About the Air Quality Index. DPIENSW. 3 February 2020. Available online: https://www.environment.nsw.gov.au/topics/air/understanding-air-quality-data/air-quality-index (accessed on 13 July 2020).
- Environmental Protection Department of Hong Kong. Health Advice. EPDHK. 13 December 2013. Available online: https://www.aqhi.gov.hk/en/health-advice/sub-health-advice.html (accessed on 13 July 2020).
- European Environmental Agency. European Air Quality Index. EEA. 16 November 2017. Available online: https://www.eea.europa.eu/themes/air/air-quality-index (accessed on 13 July 2020).
- Government of Canada. Understanding Air Quality Health Index messages. Government of Canada. 23 November 2015. Available online: https://www.canada.ca/en/environment-climate-change/services/air-quality-health-index/understanding-messages.html (accessed on 13 July 2020).
- Ministry of the Environment and Natural Resources of Mexico. Official Mexican STANDARD NOM-172-SEMARNAT-2019, Guidelines for Obtaining and Communicating the Index of Air Quality and Health Risks. MENRM. 20 November 2019. Available online: https://www.dof.gob.mx/nota_detalle.php?codigo=5579387&fecha=20/11/2019 (accessed on 13 July 2020). (In Spanish).
- National Environmental Agency of Singapore. Managing Haze: Health Advisory for the General Public. NEAS. 1 April 2014. Available online: https://www.nea.gov.sg/our-services/pollution-control/air-pollution/managing-haze (accessed on 13 July 2020).
- Fife-Schaw, C.; Rowe, G. Public perceptions of everyday food hazards: A psychometric study. Risk Anal. 1996, 16, 487–500. [Google Scholar] [CrossRef]
- Slovic, P. Perception of Risk. In The Perception of Risk; Slovic, P., Ed.; Earthscan Publications: New York, NY, USA, 2000; pp. 220–231. [Google Scholar]
- Jagiello, R.D.; Hills, T.T. Bad news has wings: Dread risk mediates social amplification in risk communication. Risk Anal. 2018, 38, 2193–2207. [Google Scholar] [CrossRef]
- Jacobs, L.A. An analysis of the concept of risk. Cancer Nurs. 2000, 23, 12–19. [Google Scholar] [CrossRef]
- Lane, R.D.; Chua, P.M.; Dolan, R.J. Common effects of emotional valence, arousal and attention on neural activation during visual processing of pictures. Neuropsychologia 1999, 37, 989–997. [Google Scholar] [CrossRef] [Green Version]
- Slovic, P.; Peters, E. Risk perception and affect. Curr. Dir. Psychol. Sci. 2006, 15, 322–325. [Google Scholar] [CrossRef]
- Hornsey, M.J.; Fielding, K.S. A cautionary note about messages of hope: Focusing on progress in reducing carbon emissions weakens mitigation motivation. Glob. Environ. Change 2016, 39, 26–34. [Google Scholar] [CrossRef]
- Janz, N.K.; Becker, M.H. The health belief model: A decade later. Health Educ. Q. 1984, 11, 1–47. [Google Scholar] [CrossRef] [PubMed] [Green Version]
- Dillard, A.J.; Ferrer, R.A.; Ubel, P.A.; Fagerlin, A. Risk perception measures’ associations with behavior intentions, affect, and cognition following colon cancer screening messages. Health Psychol. 2012, 31, 106. [Google Scholar] [CrossRef]
- van der Weerd, W.; Timmermans, D.R.; Beaujean, D.J.; Oudhoff, J.; van Steenbergen, J.E. Monitoring the level of government trust, risk perception and intention of the general public to adopt protective measures during the influenza A (H1N1) pandemic in the Netherlands. BMC Public Health 2011, 11, 575. [Google Scholar] [CrossRef] [Green Version]
- Davison, W.P. The third-person effect in communication. Public Opin. Q. 1983, 47, 1–15. [Google Scholar] [CrossRef] [Green Version]
- Golan, G.J.; Day, A.G. The first-person effect and its behavioral consequences: A new trend in the twenty-five year history of third-person effect research. Mass Commun. Soc. 2008, 11, 539–556. [Google Scholar] [CrossRef]
- Chen, H.; Atkin, D. Understanding third-person perception about Internet privacy risks. New Media Soc. 2021, 23, 419–437. [Google Scholar] [CrossRef]
- Stavrositu, C.D.; Kim, J. Social media metrics: Third-person perceptions of health information. Comput. Hum. Behav. 2014, 35, 61–67. [Google Scholar] [CrossRef]
- Wei, R.; Lo, V.H.; Lu, H.Y. Third-person effects of health news: Exploring the relationships among media exposure, presumed media influence, and behavioral intentions. Am. Behav. Sci. 2008, 52, 261–277. [Google Scholar]
- Duck, J.M.; Mullin, B.A. The perceived impact of the mass media: Reconsidering the third person effect. Eur. J. Soc. Psychol. 1995, 25, 77–93. [Google Scholar] [CrossRef]
- Eveland, W.P., Jr.; Nathanson, A.I.; Detenber, B.H.; McLeod, D.M. Rethinking the social distance corollary: Perceived likelihood of expsoure and the third-person perception. Commun. Res. 1999, 26, 275–302. [Google Scholar] [CrossRef]
- Harris, P.; Middleton, W. The illusion of control and optimism about health: On being less at risk but no more in control than others. Br. J. Soc. Psychol. 1994, 33, 369–386. [Google Scholar] [CrossRef] [PubMed]
- Perloff, L.S.; Fetzer, B.K. Self–other judgments and perceived vulnerability to victimization. J. Personal. Soc. Psychol. 1986, 50, 502. [Google Scholar] [CrossRef]
- Liberman, N.; Trope, Y.; McCrea, S.M.; Sherman, S.J. The effect of level of construal on the temporal distance of activity enactment. J. Exp. Soc. Psychol. 2007, 43, 143–149. [Google Scholar] [CrossRef] [Green Version]
- Chung, S.; Moon, S.I. Is the third-person effect real? A critical examination of rationales, testing methods, and previous findings of the third-person effect on censorship attitudes. Hum. Commun. Res. 2006, 42, 312–337. [Google Scholar] [CrossRef]
- Jang, S.M.; Kim, J.K. Third person effects of fake news: Fake news regulation and media literacy interventions. Comput. Hum. Behav. 2018, 80, 295–302. [Google Scholar] [CrossRef]
- Lo, V.H.; Wei, R.; Wu, H. Examining the first, second and third-person effects of Internet pornography on Taiwanese adolescents: Implications for the restriction of pornography. Asian J. Commun. 2010, 20, 90–103. [Google Scholar] [CrossRef]
- Perloff, R.M. Mass media, social perception, and the third person effect. In Media Effects: Advances in Theory and Research, 3rd ed.; Bryant, J., Oliver, M.B., Eds.; Routledge: New York, NY, USA, 2008; pp. 252–268. [Google Scholar]
- Faul, F.; Erdfelder, E.; Buchner, A.; Lang, A.G. Statistical power analyses using G* Power 3.1: Tests for correlation and regression analyses. Behav. Res. Methods 2009, 41, 1149–1160. [Google Scholar] [CrossRef] [PubMed] [Green Version]
- Durfee, J.L. “Social Change” and “Status Quo” Framing Effects on Risk Perception: An Exploratory Experiment. Sci. Commun. 2006, 27, 459–495. [Google Scholar] [CrossRef]
- Cheng, P.; Wei, J.; Marinova, D.; Guo, X. Adoption of protective behaviours: Residents response to city smog in Hefei, China. J. Contingencies Crisis Manag. 2017, 25, 244–255. [Google Scholar] [CrossRef]
- Wei, J.; Zhu, W.; Marinova, D.; Wang, F. Household adoption of smog protective behavior: A comparison between two Chinese cities. J. Risk Res. 2017, 20, 846–867. [Google Scholar] [CrossRef]
- Wang, J. An Empirical Study on College Students’ Risk Perception and Policy Cognition in Smog and Non-Smog Areas. Mod. Commun. J. Commun. Univ. China 2018, 12, 21. (In Chinese) [Google Scholar]
- So, J.; Jeong, S.H.; Hwang, Y. Which type of risk information to use for whom? Moderating role of outcome-relevant involvement in the effects of statistical and exemplified risk information on risk perceptions. J. Health Commun. 2017, 22, 304–311. [Google Scholar] [CrossRef] [PubMed]
- Pham, C.; Rundle-Thiele, S.; Parkinson, J.; Li, S. Alcohol warning label awareness and attention: A multi-method study. Alcohol Alcohol. 2018, 53, 39–45. [Google Scholar] [CrossRef]
- Fischhoff, B.; Davis, A.L. Communicating scientific uncertainty. Proc. Natl. Acad. Sci. USA 2014, 111 (Suppl. 4), 13664–13671. [Google Scholar] [CrossRef] [Green Version]
- Gustafson, A.; Rice, R.E. A review of the effects of uncertainty in public science communication. Public Underst. Sci. 2020, 29, 614–633. [Google Scholar] [CrossRef] [PubMed]
- Gustafson, A.; Rice, R.E. The effects of uncertainty frames in three science communication topics. Sci. Commun. 2019, 41, 679–706. [Google Scholar] [CrossRef]
- Government of Ontario. What is the Air Quality Health Index? Government of Ontario. 2015. Available online: http://www.airqualityontario.com/science/aqhi_description.php (accessed on 13 July 2020).
- Man, S.S.; Chan, A.H.S.; Alabdulkarim, S. Quantification of risk perception: Development and validation of the construction worker risk perception (CoWoRP) scale. J. Saf. Res. 2019, 71, 25–39. [Google Scholar] [CrossRef] [PubMed]


| Countries/Regions | AQI Types | Level, Descriptor, Index Range | Target Groups in Warning Messages at Each Level |
|---|---|---|---|
| Mainland China [9] | AQI (Air Quality Index) | 1, Excellent, 0–50 2, Good, 51–100 3, Lightly Polluted, 101–150 4, Moderately Polluted, 151–200 5, Heavily Polluted, 201–300 6, Severely Polluted, >300 | (1) All population (1) (2) Hypersensitive population (2) (3) Healthy population (3–6) (4) Sensitive population (3, 4) (5) Children and seniors (3–6) (6) Individuals with respiratory or heart diseases (3–5) (7) Individuals with heart or lung diseases (5) (8) General population (4–6) (9) Sick people (6) |
| US [6] | AQI (Air Quality Index) | 1, Good, 0–50 2, Moderate, 51–100 3, Unhealthy for Sensitive Groups, 101–150 4, Unhealthy, 151–200 5, Very Unhealthy, 201–300 6, Hazardous, 301–500 | (1) Unusually sensitive people (2) (2) Sensitive groups (3, 4) (3) General public (3, 4) (4) Everyone (5, 6) |
| South Korea [32] | CAI (Comprehensive Air-quality Index) | A, Good, 0–50 B, Moderate, 51–100 C, Unhealthy, 101–250 D/E, Very Unhealthy, 251–500 | (1) Patients (all) (2) Sensitive groups (C–E) (3) General public (C, E) |
| Canada [37] | AQHI (Air Quality Health Index) | 1–3, Low Risk, (Each*) 4–6, Moderate Risk, (Each*) 7–9, High Risk, (Each*) 10–12, Very High Risk, (Each*) | (Separate warning messages for each population group) (1) At-risk population (2) General population |
| India [23] | AQI (Air Quality Index) | 1, Good, 0–50 2, Satisfactory, 51–100 3, Moderately Polluted, 101–200 4, Poor, 201–300 5, Very Poor, 301–400 6, Severe, 401–500 | (1) Sensitive people (2) (2) People with lungs, asthma, and heart diseases (3) (3) Most people (4) (4) Healthy people (6) (5) Those with existing diseases (6) |
| Hong Kong [35] | AQHI (Air Quality Health Index) | 1–3, Low, (Each*) 4–6, Moderate, (Each*) 7, High, (Each*) 8–10, Very High, (Each*) 10+, Serious, (Each*) | (Separate warning messages for each population group) (1) People with existing heart or respiratory illnesses (2) Children and the elderly (3) Outdoor workers (4) General public |
| EU [36] | EAQI (European Air Quality Index) | 1, Good, (Each*) 2, Fair, (Each*) 3, Moderate, (Each*) 4, Poor, (Each*) 5, Very Poor, (Each*) 6, Extremely Poor, (Each*) | (Separate warning messages for each population group) (1) Sensitive population (2) General population |
| UK [33] | DAQI (Daily Air Quality Index) | 1–3, Low, (Each*) 4–6, Moderate, (Each*) 7–9, High, (Each*) 10, Very High, (Each*) | (Separate warning messages for each population group) (1) At-risk individuals (2) General population |
| Australia [34] | AQI (Air Quality Index) | 1, Very Good, 0–33 2, Good, 34–66 3, Fair, 67–99 4, Poor, 100–149 5, Very Poor, 150–200 6, Hazardous, >200 | (1) Sensitive groups (6) (2) Others (3) (3) Other adults (4–6) (4) Anyone who experience symptoms (4) |
| Mexico [38] | AIR AND HEALTH Index (Air Quality and Health Risks Index) | 1, Good, (Each*) 2, Regular, (Each*) 3, Bad, (Each*) 4, Very Bad, (Each*) 5, Extremely Bad, (Each*) | (Separate warning messages for each population group) (1) Sensitive groups (2) For the entire population |
| Singapore [39] | PSI (Pollutants Standards Index) | 1, Good, 0–50 2, Moderate, 51–100 3, Unhealthy, 101–200 4, Very unhealthy, 201–300 5, Hazardous, >300 | (Separate warning messages for each population group) (1) Healthy persons (2) Elderly, pregnant women and children (3) Persons with chronic lung disease, heart disease |
| M (SD) | 1 | 2 | 3 | 4 | 5 | 6 | |
|---|---|---|---|---|---|---|---|
| 1. Descriptor (IV) | 0: neutral; 1: negatively valenced | 1 | |||||
| 2. Target groups (IV) | 0: vague; 1: specific | 0.01 | 1 | ||||
| 3. Self-risk perception | 3.38 (0.76) | 0.43 ** | 0.10 | 1 | |||
| 4. TPP of smog risk | 0.09 (0.39) | −0.02 | −0.18 * | −0.20 * | 1 | ||
| 5. Precaution intention | 4.02 (0.60) | 0.33 ** | 0.10 | 0.50 ** | 0.03 | 1 | |
| 6. Knowledge of smog | 5.37 (1.78) | −0.07 | −0.15 | −0.04 | 0.18 * | 0.03 | 1 |
| Mean | ||||||
|---|---|---|---|---|---|---|
| Descriptor | Target Groups | |||||
| Variables | Neutral (n = 75) | Negatively valenced (n = 75) | F | Vague (n = 77) | Specific (n = 73) | F |
| Self-risk perception | 3.07 (0.08) | 3.71 (0.08) | 32.54 *** | 3.32 (0.08) | 3.46 (0.08) | 1.63 |
| TPP of smog risk | 0.09 (0.05) | 0.08 (0.05) | 0.06 | 0.15 (0.04) | 0.01 (0.05) | 4.84 * |
| Precaution intention | 3.83 (0.07) | 4.22 (0.07) | 17.28 *** | 3.97 (0.07) | 4.08 (0.07) | 1.40 |
Publisher’s Note: MDPI stays neutral with regard to jurisdictional claims in published maps and institutional affiliations. |
© 2021 by the authors. Licensee MDPI, Basel, Switzerland. This article is an open access article distributed under the terms and conditions of the Creative Commons Attribution (CC BY) license (https://creativecommons.org/licenses/by/4.0/).
Share and Cite
Wu, Y.; Zhang, L.; Wang, J.; Mou, Y. Communicating Air Quality Index Information: Effects of Different Styles on Individuals’ Risk Perception and Precaution Intention. Int. J. Environ. Res. Public Health 2021, 18, 10542. https://0-doi-org.brum.beds.ac.uk/10.3390/ijerph181910542
Wu Y, Zhang L, Wang J, Mou Y. Communicating Air Quality Index Information: Effects of Different Styles on Individuals’ Risk Perception and Precaution Intention. International Journal of Environmental Research and Public Health. 2021; 18(19):10542. https://0-doi-org.brum.beds.ac.uk/10.3390/ijerph181910542
Chicago/Turabian StyleWu, Yuheng, Lin Zhang, Jilong Wang, and Yi Mou. 2021. "Communicating Air Quality Index Information: Effects of Different Styles on Individuals’ Risk Perception and Precaution Intention" International Journal of Environmental Research and Public Health 18, no. 19: 10542. https://0-doi-org.brum.beds.ac.uk/10.3390/ijerph181910542