Relationship of Limb Lengths and Body Composition to Lifting in Weightlifting


 ,
,  , and
, and
Abstract
:1. Introduction
2. Materials and Methods
2.1. Design
2.2. Sample
2.3. Inclusion and Exclusion Criteria
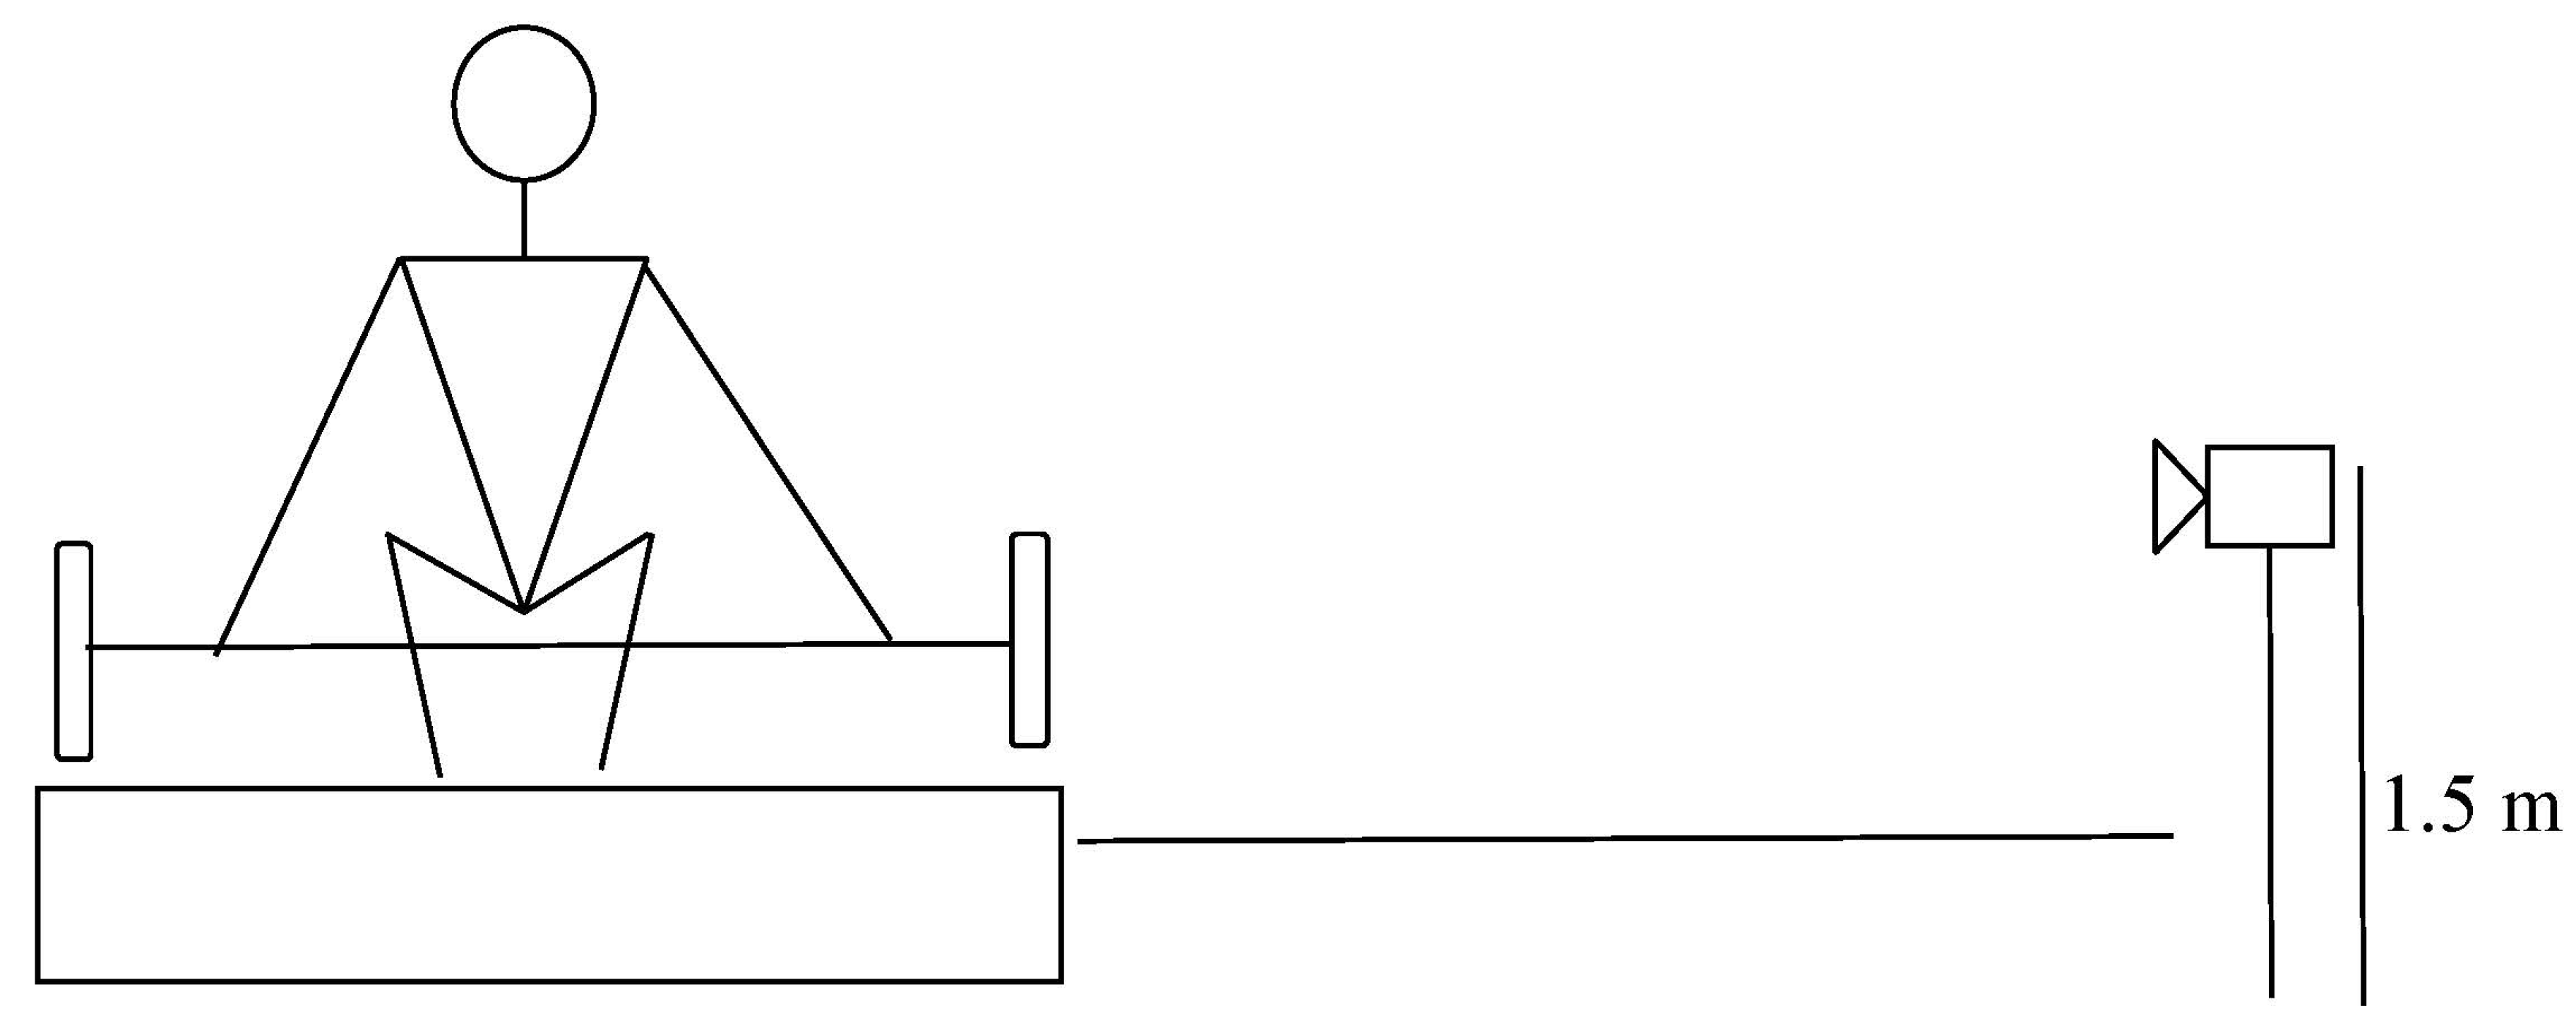
2.4. Materials
2.5. Procedures
2.6. Statistical Analysis
3. Results
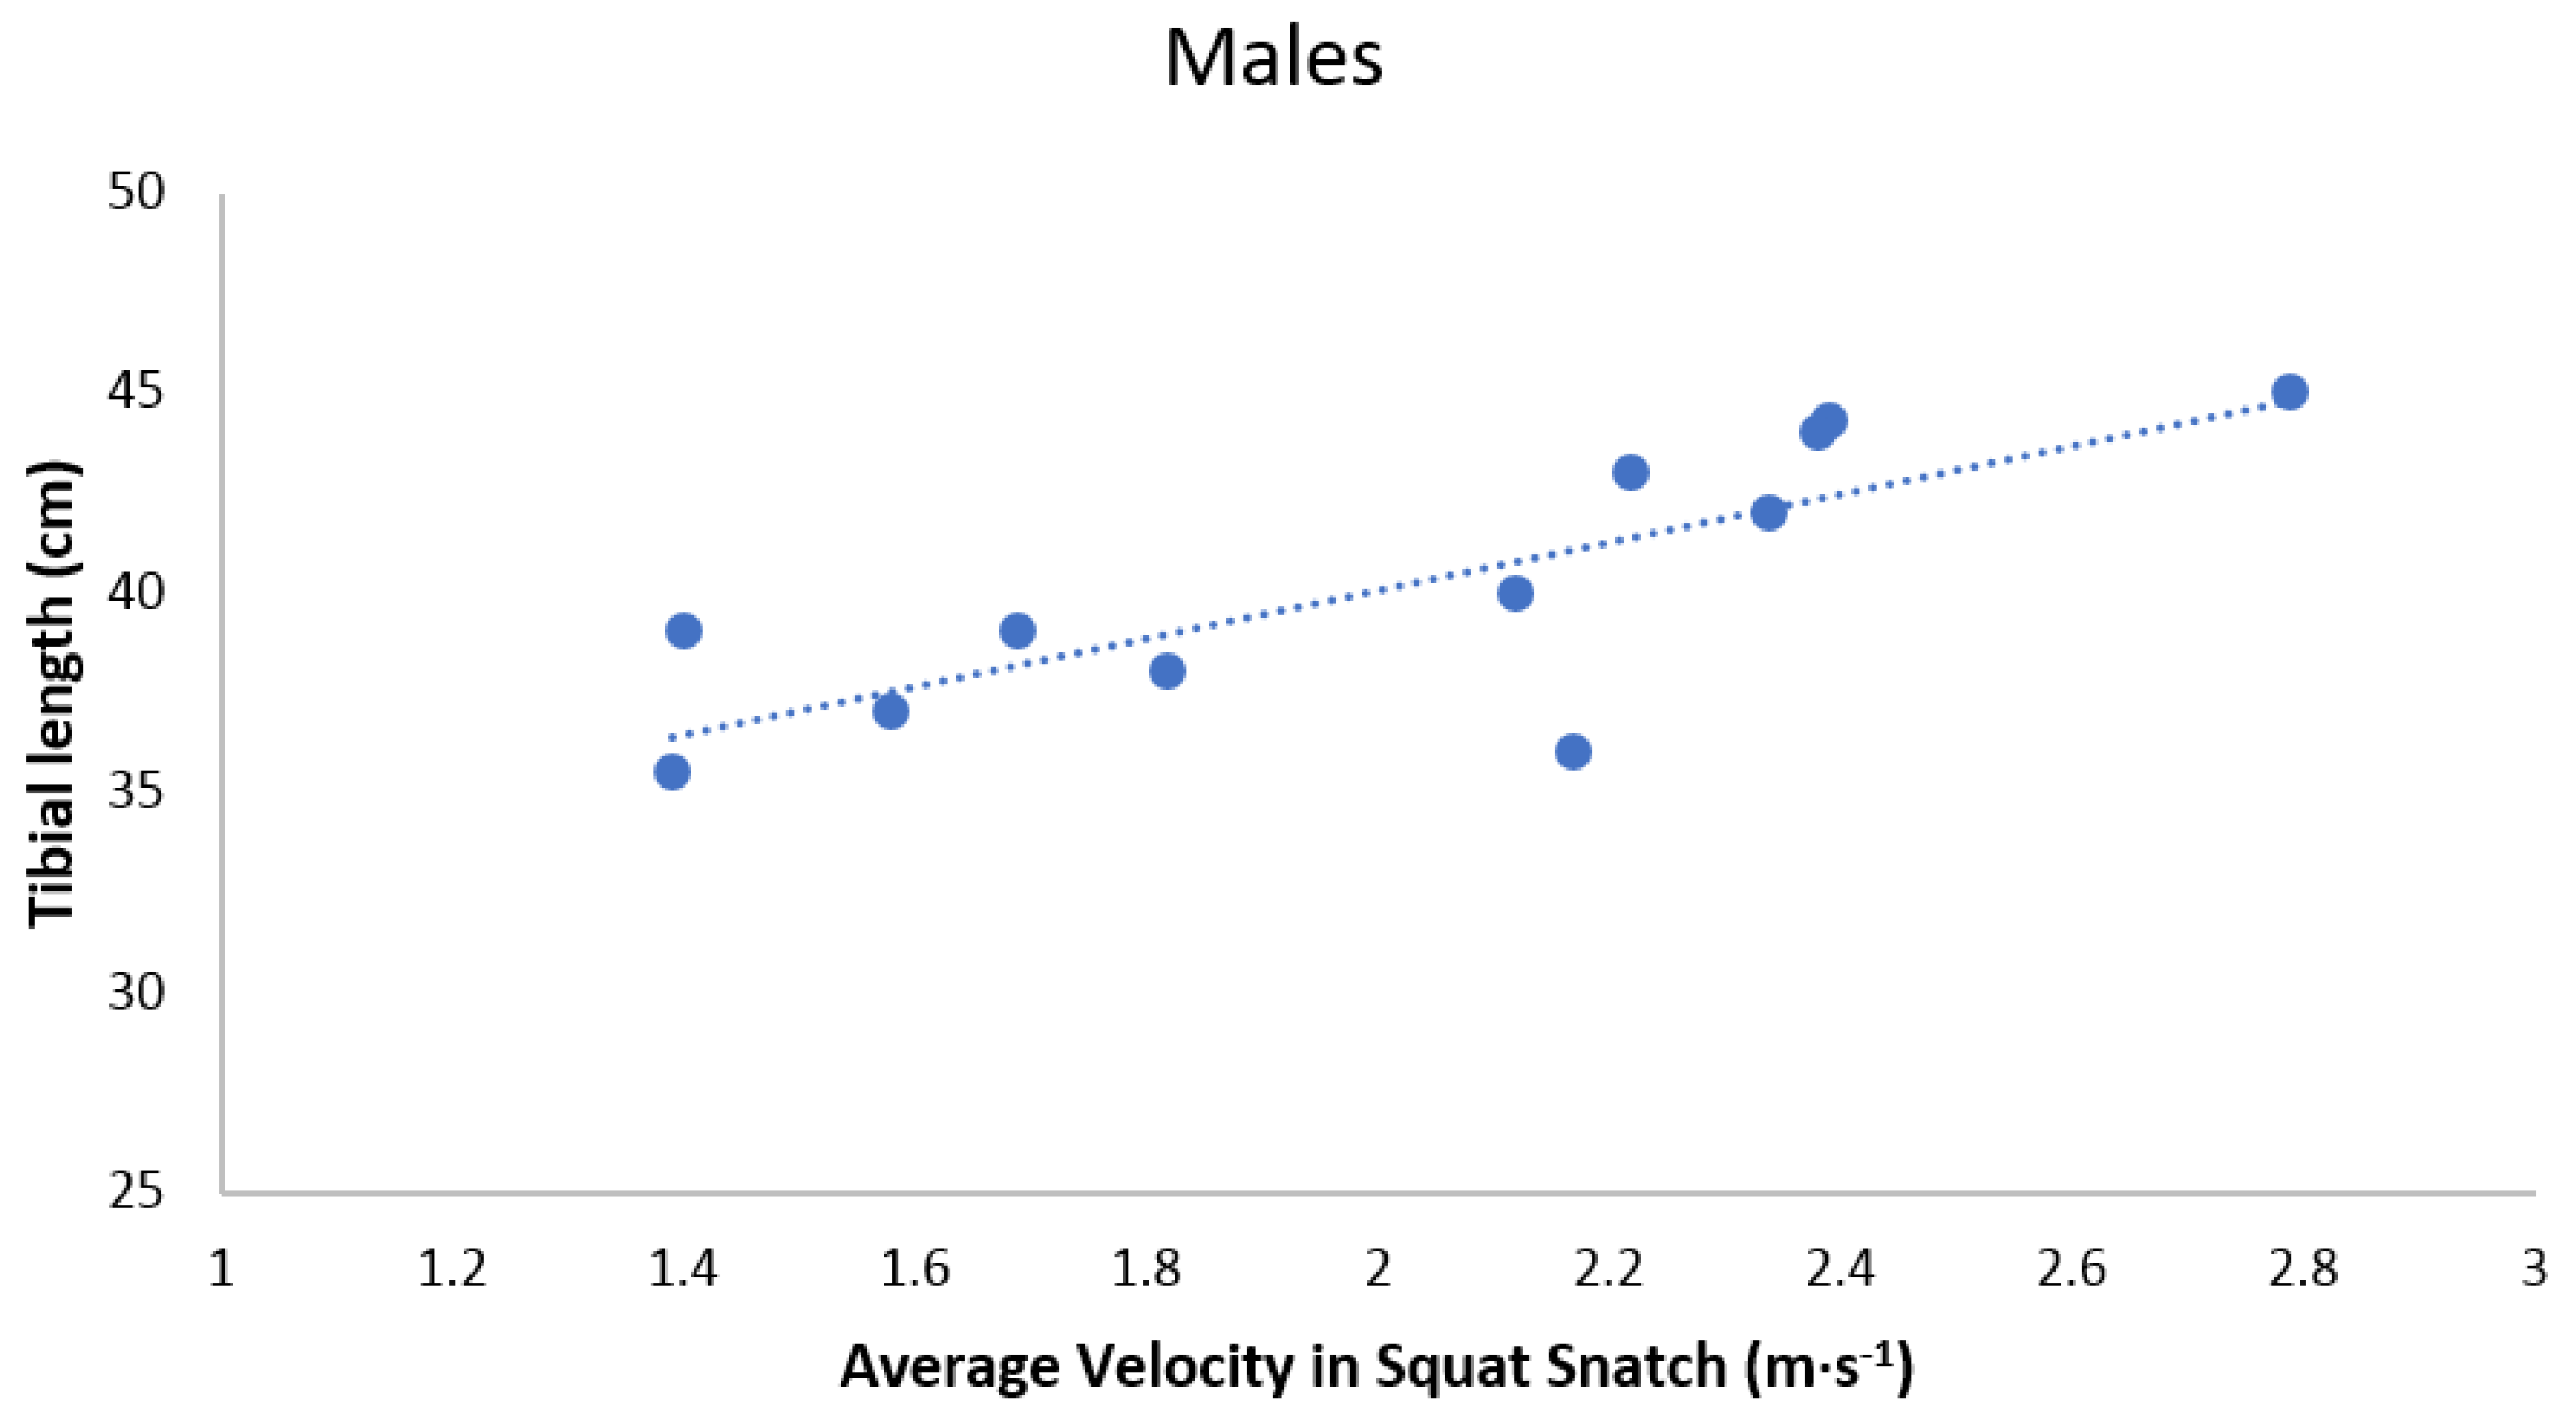
3.1. Males
3.1.1. Squat Snatch
3.1.2. Clean & Jerk
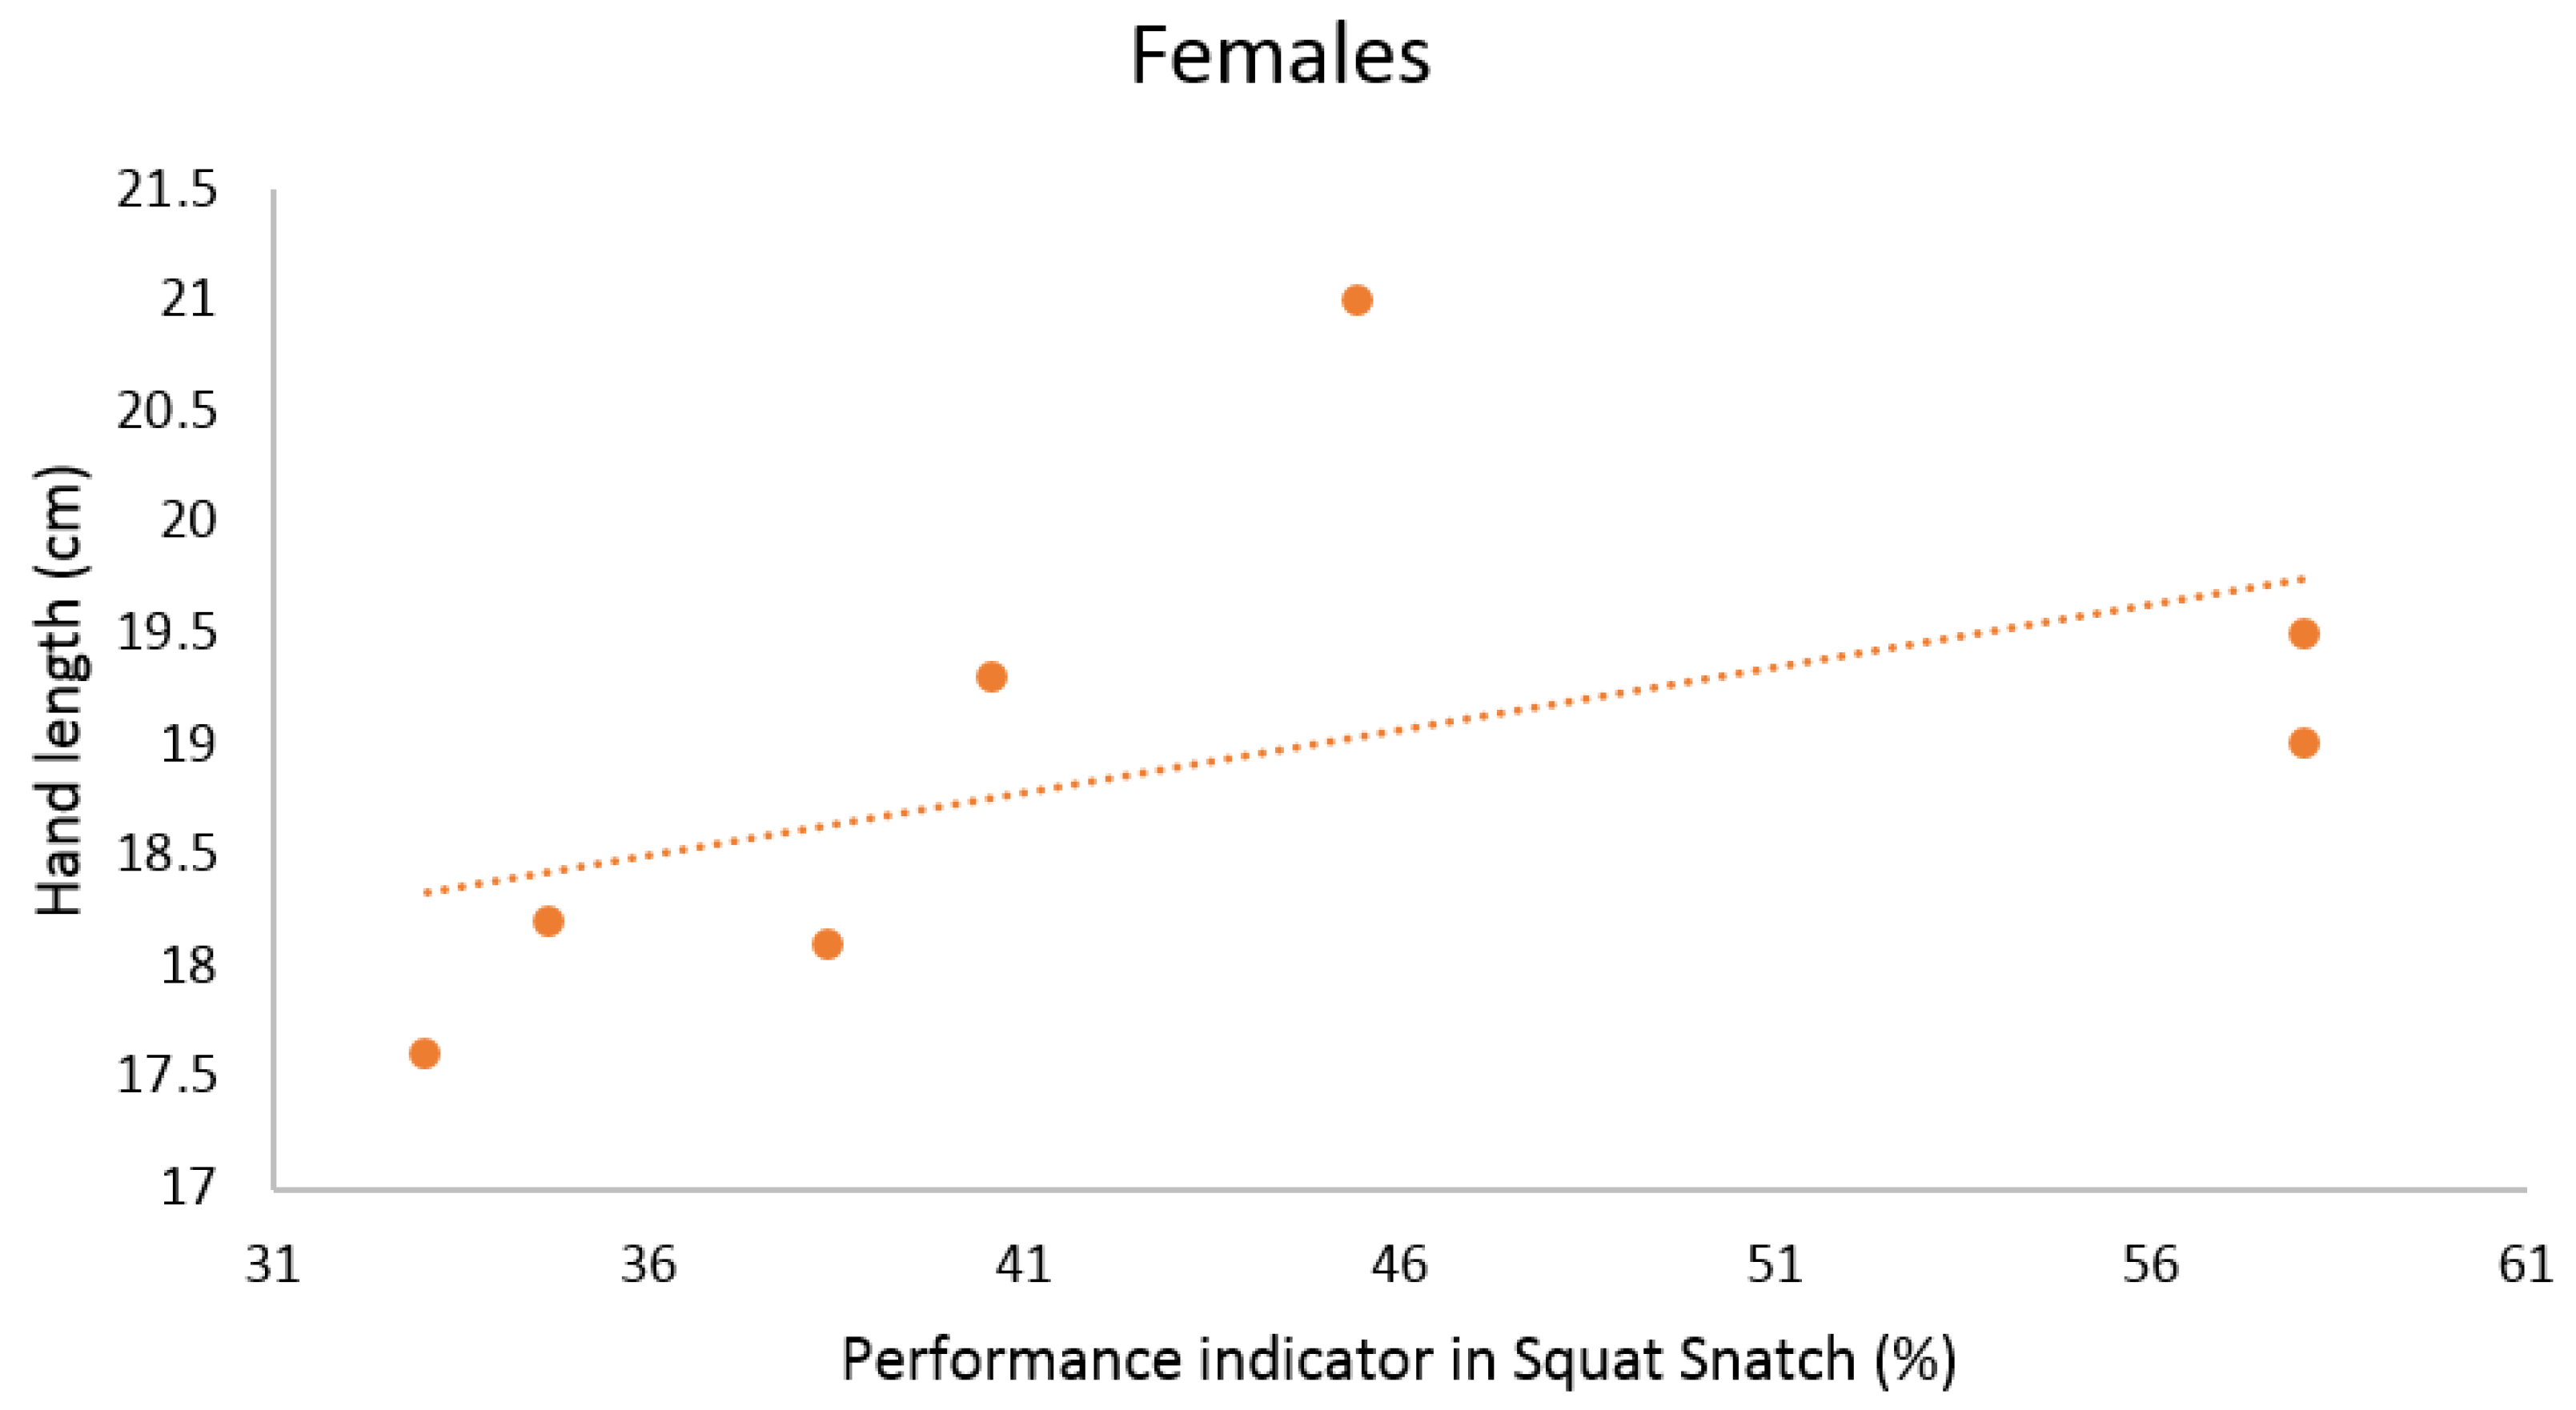
3.2. Females
3.2.1. Squat Snatch
3.2.2. Clean & Jerk
4. Discussion
Limitations
5. Conclusions
Author Contributions
Funding
Institutional Review Board Statement
Informed Consent Statement
Data Availability Statement
Acknowledgments
Conflicts of Interest
References
- Chiu, L.Z.F.; Schilling, B.K. A Primer on Weightlifting: From Sport to Sports Training. Strength Cond. J. 2005, 27, 42–48. [Google Scholar] [CrossRef]
- Akkuş, H. Kinematic Analysis of the Snatch Lift with Elite Female Weightlifters during the 2010 World Weightlifting Championship. J. Strength Cond. Res. 2012, 26, 897–905. [Google Scholar] [CrossRef] [Green Version]
- Gourgoulis, V.; Aggeloussis, N.; Antoniou, P.; Christoforidis, C.; Mavromatis, G.; Garas, A. Comparative 3-Dimensional Kinematic Analysis of the Snatch Technique in Elite Male and Female Greek Weightlifters. J. Strength Cond. Res. 2002, 16, 359–366. [Google Scholar] [CrossRef]
- Gourgoulis, V.; Aggeloussis, N.; Garas, A.; Mavromatis, G. Unsuccessful vs. Successful Performance in Snatch Lifts: A Kinematic Approach. J. Strength Cond. Res. 2009, 23, 486–494. [Google Scholar] [CrossRef]
- Ikeda, Y.; Jinji, T.; Matsubayashi, T.; Matsuo, A.; Inagaki, E.; Takemata, T.; Kikuta, M. Comparison of the Snatch Technique for Female Weightlifters at the 2008 Asian Championships. J. Strength Cond. Res. 2012, 26, 1281–1295. [Google Scholar] [CrossRef]
- Kauhanen, H. A Biomechanical Analysis of the Snatch and Clean Jerk Techniques of Finnish Elite and District Level Weightlifters. Scand. J. Sports Sci. 1984, 6, 47–56. [Google Scholar]
- Storey, A.; Smith, H.K. Unique Aspects of Competitive Weightlifting: Performance, Training and Physiology. Sports Med. 2012, 42, 769–790. [Google Scholar] [CrossRef] [PubMed]
- Winter, E.M.; Abt, G.; Brookes, F.B.C.; Challis, J.H.; Fowler, N.E.; Knudson, D.V.; Knuttgen, H.G.; Kraemer, W.J.; Lane, A.M.; van Mechelen, W.; et al. Misuse of “Power” and Other Mechanical Terms in Sport and Exercise Science Research. J. Strength Cond. Res. 2016, 30, 292–300. [Google Scholar] [CrossRef] [PubMed] [Green Version]
- Lietzke, M.H. Relation between Weight-Lifting Totals and Body Weight. Science 1956, 124, 486–487. [Google Scholar] [CrossRef] [PubMed]
- Vanderburgh, P.M.; Dooman, C. Considering Body Mass Differences, Who Are the World’s Strongest Women? Med. Sci. Sports Exerc. 2000, 32, 197–201. [Google Scholar] [CrossRef] [Green Version]
- Orvanová, E. Somatotypes of Weight Lifters. J. Sports Sci. 1990, 8, 119–137. [Google Scholar] [CrossRef] [PubMed]
- Stone, M.H.; Pierce, K.C.; Sands, W.A.; Stone, M.E. Weightlifting: A Brief Overview. Strength Cond. J. 2006, 28, 50–66. [Google Scholar] [CrossRef]
- Fry, A.C.; Ciroslan, D.; Fry, M.D.; LeRoux, C.D.; Schilling, B.K.; Chiu, L.Z.F. Anthropometric and Performance Variables Discriminating Elite American Junior Men Weightlifters. J. Strength Cond. Res. 2006, 20, 861–866. [Google Scholar] [CrossRef] [PubMed]
- Marchocka, M. Analysis of Body Build of Senior Weightlifters with Particular Regard for Proportions. Biol. Sport 1984, 1, 55–71. [Google Scholar]
- Carter, J.E.L. Physical Structure of Olympic Athletes. Part 1, The Montreal Olympic Games Anthropological Project; Karger: Basel, Switerland; München, Germany, 1982; ISBN 978-3-8055-3502-1. [Google Scholar]
- Musser, L.J.; Garhammer, J.; Rozenek, R.; Crussemeyer, J.A.; Vargas, E.M. Anthropometry and Barbell Trajectory in the Snatch Lift for Elite Women Weightlifters. J. Strength Cond. Res. 2014, 28, 1636–1648. [Google Scholar] [CrossRef]
- Kuo, Y.-H. The anthropometric study of women’s weightlifters in Taiwan. In Proceedings of the 23th ISBS-Conference Proceedings Archive, Beijing, China, 22–27 August 2005. [Google Scholar]
- Mayhew, J.L.; McCormick, T.P.; Piper, F.C.; Kurth, A.L.; Arnold, M.D. Relationships of Body Dimensions to Strength Performance in Novice Adolescent Male Powerlifters. Pediatric. Exerc. Sci. 1993, 5, 347–356. [Google Scholar] [CrossRef]
- Mayhew, J.L.; Piper, F.C.; Ware, J.S. Anthropometric Correlates with Strength Performance among Resistance Trained Athletes. J. Sports Med. Phys. Fit. 1993, 33, 159–165. [Google Scholar]
- Burdett, R. Biomechanics of the Snatch Technique of Highly Skilled and Skilled Weightlifters. Res. Q. Exerc. Sport 2013, 53, 193–197. [Google Scholar] [CrossRef]
- Kipp, K.; Harris, C. Patterns of Barbell Acceleration during the Snatch in Weightlifting Competition. J. Sports Sci 2015, 33, 1467–1471. [Google Scholar] [CrossRef]
- Isaka, T.; Okada, J.; Funato, K. Kinematic Analysis of the Barbell during the Snatch Movement of Elite Asian Weight Lifters. J. Appl. Biomech. 1996, 12, 508–516. [Google Scholar] [CrossRef]
- Korkmaz, S.; Harbili, E. Biomechanical Analysis of the Snatch Technique in Junior Elite Female Weightlifters. J. Sports Sci. 2016, 34, 1088–1093. [Google Scholar] [CrossRef] [PubMed]
- Kipp, K. Relative Importance of Lower Extremity Net Joint Moments in Relation to Bar Velocity and Acceleration in Weightlifting. Sports Biomech. 2020, 1–13. [Google Scholar] [CrossRef] [PubMed]
- Puig-Diví, A.; Escalona-Marfil, C.; Padullés-Riu, J.M.; Busquets, A.; Padullés-Chando, X.; Marcos-Ruiz, D. Validity and Reliability of the Kinovea Program in Obtaining Angles and Distances Using Coordinates in 4 Perspectives. PLoS ONE 2019, 14, e0216448. [Google Scholar] [CrossRef] [PubMed]
- Results 2019 International Weightlifting Federation World Championships. Available online: https://www.iwf.net/new_bw/results_by_events/?event=472 (accessed on 2 November 2020).
- Cabañas Armesilla, M.D. Compendio de cineantropometría; CTO Editorial SL: Madrid, Spain, 2009; ISBN 978-84-92523-71-9. [Google Scholar]
- De Rose, E.H.; Guimaraes, A.G.S. A model for optimization of somatotype in young athletes. In Kinanthropometry II; University Park Press: Baltimore, MD, USA, 1980; pp. 77–80. [Google Scholar]
- Hopkins, W.G. A New View of Statistics. Available online: https://www.sportsci.org/resource/stats/newview.html (accessed on 10 November 2020).
- Canda, A.S. Variables Antropométricas de La Población Deportista Española; Consejo Superior de Deportes: Madrid, Spain, 2012; ISBN 978-84-7949-220-5.
- Pons, V.; Riera, J.; Galilea, P.A.; Drobnic, F.; Banquells, M.; Ruiz, O. Características Antropométricas, Composición Corporal y Somatotipo Por Deportes. Datos de Referencia Del CAR de San Cugat, 1989–2013. Apunt. Med. Esport. 2015, 50, 65–72. [Google Scholar] [CrossRef]
- Huebner, M.; Perperoglou, A. Sex Differences and Impact of Body Mass on Performance from Childhood to Senior Athletes in Olympic Weightlifting. PLoS ONE 2020, 15, e0238369. [Google Scholar] [CrossRef] [PubMed]
- Travis, S.K.; Goodin, J.R.; Beckham, G.K.; Bazyler, C.D. Identifying a Test to Monitor Weightlifting Performance in Competitive Male and Female Weightlifters. Sports 2018, 6, 46. [Google Scholar] [CrossRef] [Green Version]
- Vigotsky, A.D.; Bryanton, M.A.; Nuckols, G.; Beardsley, C.; Contreras, B.; Evans, J.; Schoenfeld, B.J. Biomechanical, Anthropometric, and Psychological Determinants of Barbell Back Squat Strength. J. Strength Cond. Res. 2019, 33 (Suppl. 1), 26–35. [Google Scholar] [CrossRef]
- Jw, K.; Pa, H.; Sn, P.; Pj, M. Can Absolute and Proportional Anthropometric Characteristics Distinguish Stronger and Weaker Powerlifters? J. Strength Cond. Res. 2009, 23, 2256–2265. [Google Scholar] [CrossRef]
- Canda, A. Deportistas de Alta Competición Con Índice de Masa Corporal Igual o Mayor a 30 Kg/m2. ¿Obesidad o Gran Desarrollo Muscular? Apunt. Med. Esport. 2017, 52, 29–36. [Google Scholar] [CrossRef]
- Hirsch, K.R.; Smith-Ryan, A.E.; Trexler, E.T.; Roelofs, E.J. Body Composition and Muscle Characteristics of Division I Track and Field Athletes. J. Strength Cond. Res. 2016, 30, 1231–1238. [Google Scholar] [CrossRef] [Green Version]
- Commission, A.S. Anthropometrica: A Textbook of Body Measurement for Sports and Health Courses; UNSW Press: Sydney, Australia, 1996; ISBN 978-0-86840-223-9. [Google Scholar]
- Thé, D.J.; Ploutz-Snyder, L. Age, Body Mass, and Gender as Predictors of Masters Olympic Weightlifting Performance. Med. Sci. Sports Exerc. 2003, 35, 1216–1224. [Google Scholar] [CrossRef] [PubMed]
- Ford, L.E.; Detterline, A.J.; Ho, K.K.; Cao, W. Gender-and Height-Related Limits of Muscle Strength in World Weightlifting Champions. J. Appl. Physiol. (1985) 2000, 89, 1061–1064. [Google Scholar] [CrossRef] [PubMed] [Green Version]
- Wilmore, J.H.; Costill, D.L. Fisiología Del Esfuerzo Y Del Deporte; Editorial Paidotribo: Badalona, Spaing, 2007; ISBN 978-84-8019-916-2. [Google Scholar]
- Currier, B.S.; Harty, P.S.; Zabriskie, H.A.; Stecker, R.A.; Moon, J.M.; Jagim, A.R.; Kerksick, C.M. Fat-Free Mass Index in a Diverse Sample of Male Collegiate Athletes. J. Strength Cond. Res. 2019, 33, 1474–1479. [Google Scholar] [CrossRef] [PubMed]
- Bartonietz, K. Biomechanics of the Snatch: Toward a Higher Training Efficiency. Strength Cond. J. 1996, 18, 24–31. [Google Scholar] [CrossRef]
- Gourgoulis, V.; Aggelousis, N.; Mavromatis, G.; Garas, A. Three-Dimensional Kinematic Analysis of the Snatch of Elite Greek Weightlifters. J. Sports Sci. 2000, 18, 643–652. [Google Scholar] [CrossRef] [PubMed]
- Okada, J.; Iijima, K.; Fukunaga, T.; Kikuchi, T.; Kato, K. Kinematic Analysis of the Snatch Technique Used by Japanese and International Female Weightlifters at the 2006 Junior World Championship. Int. J. Sport Health Sci. 2008, 6, 194–202. [Google Scholar] [CrossRef] [Green Version]
- Ho, K.W.L.; Williams, M.D.; Wilson, C.J.; Meehan, D.L. Using Three-Dimensional Kinematics to Identify Feedback for the Snatch: A Case Study. J. Strength Cond. Res. 2011, 25, 2773–2780. [Google Scholar] [CrossRef]
- Takano, B. CLASSIC COACHING TECHNIQUES: Coaching Optimal Technique in the Snatch and Clean and Jerk-Part I. Strength Cond. J. 1993, 15, 33–39. [Google Scholar] [CrossRef]
- Lockie, R.G.; Moreno, M.R.; Orjalo, A.J.; Lazar, A.; Liu, T.M.; Stage, A.A.; Birmingham-Babauta, S.A.; Stokes, J.J.; Giuliano, D.V.; Risso, F.G.; et al. Relationships Between Height, Arm Length, and Leg Length on the Mechanics of the Conventional and High-Handle Hexagonal Bar Deadlift. J. Strength Cond. Res. 2018, 32, 3011–3019. [Google Scholar] [CrossRef] [Green Version]
- Keogh, J.; Hume, P.; Mellow, P.; Pearson, S. The Use of Anthropometric Variables to Predict Bench Press and Squat Strength in Well-Trained Strength Athletes. In Proceedings of the 23th ISBS-Conference Proceedings Archive, Beijing, China, 22–27 August 2005. [Google Scholar]
- Young, R.W. Evolution of the Human Hand: The Role of Throwing and Clubbing. J. Anat. 2003, 202, 165–174. [Google Scholar] [CrossRef]
- Cronin, J.; Lawton, T.; Harris, N.; Kilding, A.; McMaster, D.T. A Brief Review of Handgrip Strength and Sport Performance. J. Strength Cond. Res. 2017, 31, 3187–3217. [Google Scholar] [CrossRef] [PubMed] [Green Version]


| Sample | |||||||
|---|---|---|---|---|---|---|---|
| Men | Women | ||||||
| Sport Modality | Weightlifting | n = 12 | n = 7 | ||||
| Basic measures | Body mass (kg) | 84.6 | ± | 14.1 | 64.4 | ± | 7.6 |
| Stature (cm) | 176.2 | ± | 6.9 | 166.9 | ± | 4.1 | |
| Skinfolds (mm) | Triceps | 8.2 | ± | 3.5 | 13.2 | ± | 5.5 |
| Subscapular | 12.4 | ± | 6.3 | 9.7 | ± | 2.6 | |
| Biceps | 4.5 | ± | 2.0. | 5.5 | ± | 2.4 | |
| Iliac crest | 16.5 | ± | 4.7 | 14.3 | ± | 3.8 | |
| Supraspinale | 10.2 | ± | 5.6 | 9.0 | ± | 3.55 | |
| Abdominal | 14.6 | ± | 5.38 | 14.1 | ± | 7.0 | |
| Thigh | 12.8 | ± | 4.64 | 15.2 | ± | 3.14 | |
| Calf | 7.3 | ± | 3.25 | 13.3 | ± | 6.5 | |
| Girths (cm) | Arm (relaxed) | 34.5 | ± | 2.9 | 29.7 | ± | 2.6 |
| Arm (flexed and tensed) | 37.1 | ± | 2.4 | 30.6 | ± | 2.2 | |
| Waist (minimum) | 87.4 | ± | 7.6 | 72.5 | ± | 4.3 | |
| Hip (maximum) | 100.8 | ± | 6.4 | 98.2 | ± | 4.6 | |
| Calf (maximum) | 38.8 | ± | 3.1 | 35.6 | ± | 2.9 | |
| Breadths (mm) | Humerus | 7.1 | ± | 0.4 | 6.7 | ± | 1.0 |
| Bi-styloid | 5.8 | ± | 0.4 | 5.2 | ± | 0.2 | |
| Femur | 9.9 | ± | 0.7 | 8.9 | ± | 0.4 | |
| Body composition | % Body fat | 10.0. | ± | 2.5 | 15.2 | ± | 3.0 |
| % Muscle mass | 51.6 | ± | 3.0 | 48.8 | ± | 3.0 | |
| % Bone mass | 14.4 | ± | 1.4 | 15.1 | ± | 1.1 | |
| Fat mass (kg) | 8.7 | ± | 3.5 | 9.9 | ± | 2.6 | |
| Muscle mass (kg) | 43.5 | ± | 6.5 | 31.4 | ± | 3.9 | |
| Bone mass (kg) | 12.1 | ± | 1.8 | 9.7 | ± | 0.9 | |
| Lengths (cm) | Lower limb | 94.5 | ± | 3.9 | 92.7 | ± | 2.87 |
| Femur | 48.1 | ± | 2.4 | 48.8 | ± | 1.4 | |
| Calf | 40.2 | ± | 3.4 | 36.6 | ± | 2.6 | |
| Foot | 26.8 | ± | 1.4 | 23.8 | ± | 0.9 | |
| Upper limb | 78.7 | ± | 3.2 | 73.5 | ± | 1.9 | |
| Arm | 34.0. | ± | 1.3 | 32.0 | ± | 1.3 | |
| Foream | 24.3 | ± | 1.1 | 22.2 | ± | 1.1 | |
| Hand | 20.3 | ± | 1.3 | 19.0 | ± | 1.1 | |
| Anthropometric indexes | Fat-free mass Index | 24.4 | ± | 2.1 | 19.5 | ± | 1.4 |
| Brachial index | 71.5 | ± | 3.4 | 69.4 | ± | 3.3 | |
| Intermembral index | 83.3 | ± | 2.0 | 79.3 | ± | 3.3 | |
| Movement | One Motion (Snatch) | Two Motions (Clean and Jerk) | |
|---|---|---|---|
| Initial point of snatch: barbell lift-off from the ground |  | Initial point of clean: barbell lift-off from the ground |  |
| Final point of snatch: barbell peaks in vertical trajectory (maximum height) |  | Final point of clean: first contact of the barbell with the athlete’s shoulders in two movements |  |
| Initial point of jerk: barbell lift-off from the athlete’s shoulders |  | ||
| Final point of jerk: full extension of the athlete’s arms and legs split in the final position |  | ||
| Sa | BM | S | THW | CC | Load (kg) | Average Velocity (m·s−1) | Peak Velocity (m·s−1) | |||||
|---|---|---|---|---|---|---|---|---|---|---|---|---|
| Snatch | C&J | Snatch | Clean | Jerk | Snatch | Clean | Jerk | |||||
| Males | ||||||||||||
| M1 | 70.0 | 170.0 | 3 | S 73 | 83 A | 108 B | 2.17 | 1.53 | 1.10 | 3.40 | 2.64 | 2.28 |
| M2 | 76.0 | 166.0 | 3 | S 81 | 55 C | 70 D | 1.69 | 1.41 | 1.18 | 3.56 | 3.00 | 3.23 |
| M3 | 75.5 | 176.4 | 3 | S 81 | 70 C | 90 D | 1.39 | 1.58 | 1.54 | 3.50 | 3.08 | 3.01 |
| M4 | 75.3 | 173.0 | 4 | S 81 | 78 C | 105 D | 2.38 | 1.14 | 1.29 | 3.59 | 2.38 | 2.49 |
| M5 | 77.7 | 171.0 | 5 | S 81 | 95 C | 115 D | 2.12 | 1.80 | 1.53 | 3.50 | 2.71 | 2.93 |
| M6 | 79.7 | 168.0 | 5 | S 81 | 95 C | 130 D | 1.40 | 1.77 | 1.17 | 3.27 | 3.02 | 2.07 |
| M7 | 81.5 | 179.8 | 5 | S 89 | 107 E | 139 F | 1.58 | 1.68 | 1.61 | 3.22 | 2.63 | 2.71 |
| M8 | 88.7 | 184.1 | 3 | S 89 | 73 E | 95 F | 2.39 | 2.18 | 1.76 | 3.40 | 2.82 | 2.60 |
| M9 | 88.7 | 181.1 | 5 | S 89 | 95 E | 140 F | 2.22 | 2.11 | 1.57 | 3.56 | 3.55 | 2.81 |
| M10 | 82.5 | 177.8 | 5 | S 89 | 110 E | 130 F | 2.34 | 2.10 | 1.58 | 3.65 | 3.26 | 2.66 |
| M11 | 96.4 | 178.0 | 6 | S 102 | 100 G | 105 H | 1.82 | 2.04 | 1.37 | 3.46 | 2.85 | 3.06 |
| M12 | 123.0 | 189.0 | 4 | S + 109 | 85 I | 108 J | 2.79 | 1.83 | 1.79 | 4.17 | 3.10 | 2.93 |
| Females | ||||||||||||
| F1 | 52.5 | 160.0 | 6 | S 55 | 45 K | 63 L | 1.49 | 1.40 | 1.64 | 3.49 | 3.38 | 2.79 |
| F2 | 57.4 | 163.4 | 5 | S 59 | 43 M | 57 N | 3.66 | 3.20 | 3.38 | 2.12 | 1.21 | 1.64 |
| F3 | 64.0 | 165.2 | 3 | S 71 | 37 P | 45 Q | 3.36 | 2.70 | 2.79 | 2.30 | 1.60 | 1.70 |
| F4 | 66.0 | 170.0 | 3 | S 71 | 43 P | 55 Q | 3.71 | 3.12 | 2.79 | 1.57 | 1.14 | 1.64 |
| F5 | 66.5 | 170.3 | 5 | S 71 | 65 P | 90 Q | 1.66 | 1.34 | 1.78 | 3.60 | 3.33 | 2.98 |
| F6 | 68.5 | 170.1 | 5 | S 71 | 65 P | 85 Q | 1.82 | 1.27 | 1.92 | 3.70 | 3.28 | 3.16 |
| F7 | 76.0 | 170.2 | 3 | S 76 | 43 R | 50 S | 3.83 | 2.71 | 2.55 | 1.68 | 1.38 | 1.38 |
| Snatch | Clean | Jerk | C&J | |||||
|---|---|---|---|---|---|---|---|---|
| AV | MV | PI | AV | MV | AV | MV | PI | |
| Basic measures | ||||||||
| Body mass (kg) | 0.182 | 0.218 | 0.091 | 0.606 | 0.501 | 0.739 | 0.435 | −0.056 |
| (0.571) | (0.495) | (0.778) | (0.037) | (0.097) | (0.006) | (0.157) | (0.863) | |
| Stature (cm) | 0.573 | 0.264 | 0.186 | 0.552 | 0.098 | 0.832 | 0.175 | 0.049 |
| (0.051) | (0.408) | (0.564) | (0.063) | (0.762) | (0.001) | (0.586) | (0.880) | |
| Girths (cm) | ||||||||
| Arm (relaxed) | 0.364 | 0.214 | 0.095 | 0.385 | 0.140 | 0.161 | −0.074 | −0.070 |
| (0.245) | (0.503) | (0.770) | (0.217) | (0.665) | (0.618) | (0.820) | (0.829) | |
| Arm (flexed and tensed) | 0.238 | 0.141 | 0.151 | 0.483 | 0.238 | 0.336 | 0.011 | −0.077 |
| (0.457) | (0.663) | (0.640) | (0.112) | (0.457) | (0.286) | (0.974) | (0.812) | |
| Waist (minimum) | 0.035 | 0.221 | −0.168 | 0.238 | 0.413 | 0.280 | 0.182 | −0.399 |
| (0.914) | (0.489) | (0.601) | (0.457) | (0.183) | (0.379) | (0.571) | (0.199) | |
| Hip (maximum) | 0.091 | 0.267 | −0.459 | −0.168 | 0.049 | 0.070 | 0.203 | −0.497 |
| (0.779) | (0.401) | (0.134) | (0.602) | (0.880) | (0.829) | (0.527) | (0.101) | |
| Calf (maximum) | 0.254 | 0.319 | −0.051 | 0.109 | 0.215 | 0.264 | −0.145 | −0.190 |
| (0.427) | (0.313) | (0.875) | (0.736) | (0.503) | (0.407) | (0.654) | (0.554) | |
| Body composition | ||||||||
| Fat mass (%) | 0.168 | 0.457 | −0.557 | −0.014 | 0.161 | 0.266 | 0.588 | −0.692 |
| (0.602) | (0.135) | (0.060) | (0.966) | (0.618) | (0.404) | (0.044) | (0.013) | |
| Muscle mass (%) | −0.154 | −0.316 | 0.634 | 0.154 | −0.021 | −0.084 | −0.350 | 0.720 |
| (0.633) | (0.316) | (0.027) | (0.633) | (0.948) | (0.795) | (0.264) | (0.008) | |
| Bone mass (%) | −0.252 | 0.025 | −0.392 | −0.629 | −0.196 | −0.692 | −0.025 | −0.385 |
| (0.430) | (0.939) | (0.207) | (0.028) | (0.542) | (0.013) | (0.940) | (0.217) | |
| Fat-free mass Index | −0.133 | 0.239 | 0.046 | 0.336 | 0.608 | 0.420 | 0.438 | −0.203 |
| (0.681) | (0.454) | (0.888) | (0.286) | (0.036) | (0.175) | (0.155) | (0.527) | |
| Lengths (cm) | ||||||||
| Lower limb (LL) | 0.637 | 0.359 | 0.163 | 0.459 | 0.137 | 0.767 | 0.023 | 0.172 |
| (0.026) | (0.252) | (0.612) | (0.134) | (0.672) | (0.004) | (0.944) | (0.594) | |
| Relative lower limb | 0.245 | 0.243 | −0.186 | −0.538 | −0.245 | −0.322 | −0.193 | 0 |
| (0.443) | (0.448) | (0.564) | (0.071) | (0.443) | (0.308) | (0.549) | (1) | |
| Femur | 0.007 | 0.141 | −0.072 | −0.189 | −0.119 | 0.323 | 0.348 | −0.330 |
| (0.983) | (0.662) | (0.824) | (0.555) | (0.712) | (0.306) | (0.268) | (0.295) | |
| Calf | 0.848 | 0.562 | −0.181 | 0.448 | 0.207 | 0.494 | −0.147 | −0.088 |
| (<0.001) | (0.057) | (0.574) | (0.144) | (0.519) | (0.103) | (0.648) | (0.787) | |
| Foot | 0.574 | 0.178 | −0.075 | 0.252 | −0.011 | 0.616 | −0.037 | −0.077 |
| (0.051) | (0.580) | (0.816) | (0.429) | (0.974) | (0.033) | (0.909) | (0.812) | |
| Upper limb (UL) | 0.466 | 0.149 | −0.037 | 0.269 | −0.244 | 0.696 | 0.227 | −0.194 |
| (0.126) | (0.644) | (0.909) | (0.399) | (0.445) | (0.012) | (0.479) | (0.545) | |
| Relative upper limb | −0.070 | 0.148 | −0.602 | −0.517 | −0.084 | −0.287 | 0.039 | −0.566 |
| (0.829) | (0.647) | (0.038) | (0.085) | (0.795) | (0.366) | (0.905) | (0.055) | |
| Arm | 0.128 | 0.360 | −0.270 | −0.277 | −0.213 | 0.489 | 0.426 | −0.376 |
| (0.693) | (0.250) | (0.396) | (0.384) | (0.507) | (0.106) | (0.167) | (0.228) | |
| Forearm | 0.667 | 0.239 | 0.030 | 0.452 | 0.035 | 0.367 | −0.246 | −0.046 |
| (0.018) | (0.454) | (0.926) | (0.141) | (0.913) | (0.241) | (0.442) | (0.887) | |
| Hand | 0.399 | 0.059 | −0.375 | 0.180 | −0.071 | 0.452 | 0.287 | −0.491 |
| (0.198) | (0.856) | (0.229) | (0.575) | (0.827) | (0.14) | (0.366) | (0.105) | |
| Brachial index | 0.245 | −0.213 | 0.333 | 0.550 | 0.151 | −0.182 | −0.477 | 0.340 |
| (0.442) | (0.506) | (0.290) | (0.064) | (0.640) | (0.571) | (0.117) | (0.280) | |
| Intermembral index | −0.245 | −0.060 | −0.480 | −0.126 | 0.063 | 0.070 | 0.273 | −0.559 |
| (0.443) | (0.854) | (0.114) | (0.697) | (0.846) | (0.829) | (0.390) | (0.059) | |
| Snatch | Clean | Jerk | C&J | |||||
|---|---|---|---|---|---|---|---|---|
| AV | MV | PI | AV | MV | AV | MV | PI | |
| Basic measures | ||||||||
| Body mass (kg) | 0.393 | 0 | 0.054 | −0.250 | −0.107 | −0.126 | −0.072 | −0.071 |
| (0.383) | (1) | (0.908) | (0.589) | (0.819) | (0.788) | (0.878) | (0.879) | |
| Stature (cm) | 0.394 | −0.039 | 0.119 | −0.236 | −0.256 | −0.03 | 0.030 | 0.020 |
| (0.382) | (0.933) | (0.799) | (0.610) | (0.579) | (0.949) | (0.949) | (0.967) | |
| Girths (cm) | ||||||||
| Arm (relaxed) | 0.523 | −0.324 | −0.418 | 0.198 | −0.270 | 0.227 | −0.455 | −0.414 |
| (0.229) | (0.478) | (0.350) | (0.670 | (0.558) | (0.624) | (0.306) | (0.355) | |
| Arm (flexed and tensed) | −0.071 | 0 | −0.180 | −0.071 | 0.321 | −0.270 | −0.162 | −0.107 |
| (0.879) | (1) | (0.699) | (0.879 | (0.482) | (0.558) | (0.728) | (0.819) | |
| Waist (minimum) | 0.536 | −0.321 | −0.270 | 0.036 | −0.286 | 0.054 | −0.342 | −0.321 |
| (0.215) | (0.482) | (0.558) | (0.939) | (0.535) | (0.908) | (0.452) | (0.482) | |
| Hip (maximum) | 0.071 | 0.214 | −0.090 | −0.357 | 0.107 | −0.054 | 0.162 | 0 |
| (0.879) | (0.645) | (0.848) | (0.432) | (0.819) | (0.908) | (0.728) | (1) | |
| Calf (maximum) | 0.357 | 0.143 | −0.018 | −0.357 | −0.036 | −0.090 | 0.018 | −0.143 |
| (0.432) | (0.760) | (0.969) | (0.432) | (0.939) | (0.848) | (0.969) | (0.760) | |
| Body composition | ||||||||
| Fat mass (%) | 0.286 | −0.286 | −0.198 | 0.143 | −0.321 | 0.234 | −0.162 | −0.071 |
| (0.535) | (0.535) | (0.670) | (0.760) | (0.482) | (0.613) | (0.728) | (0.879) | |
| Muscle mass (%) | −0.214 | 0.250 | 0.090 | −0.214 | 0.464 | −0.432 | 0.018 | −0.071 |
| (0.645) | (0.589) | (0.848) | (0.645) | (0.294) | (0.333) | (0.969) | (0.879) | |
| Bone mass (%) | −0.214 | −0.071 | 0.198 | 0.071 | −0.107 | 0 | 0.198 | 0.214 |
| (0.645) | (0.879) | (0.670) | (0.879) | (0.819) | (1) | (0.670) | (0.645) | |
| Fat-free mass Index | 0.429 | 0.071 | −0.216 | −0.286 | −0.107 | 0.036 | −0.054 | −0.321 |
| (0.337) | (0.879) | (0.641) | (0.535) | (0.819) | (0.939) | (0.908) | (0.482) | |
| Lengths (cm) | ||||||||
| Lower limb (LL) | 0.162 | −0.216 | 0.255 | 0.414 | −0.180 | 0.118 | −0.336 | 0.180 |
| (0.728) | (0.641) | (0.582) | (0.355) | (0.699) | (0.801) | (0.461) | (0.699) | |
| Relative lower limb | −0.143 | −0.179 | 0.144 | 0.429 | 0.071 | −0.018 | −0.288 | 0.143 |
| (0.760) | (0.702) | (0.758) | (0.337) | (0.879) | (0.969) | (0.531) | (0.760) | |
| Femur | 0.505 | −0.580 | −0.179 | 0.617 | −0.356 | 0.179 | −0.736 | −0.337 |
| (0.247) | (0.172) | (0.700) | (0.140) | (0.434) | (0.700) | (0.059) | (0.460) | |
| Calf | 0.198 | −0.090 | 0.400 | 0.306 | −0.414 | 0.373 | −0.055 | 0.378 |
| (0.670) | (0.848) | (0.374) | (0.504) | (0.355) | (0.410) | (0.908) | (0.403) | |
| Foot | −0.631 | 0.775 | 0.964 | −0.667 | 0.631 | −0.655 | 0.709 | 0.883 |
| (0.129) | (0.041) | (<0.001) | (0.102) | (0.129) | (0.111) | (0.074) | (0.008) | |
| Upper limb (UL) | 0.234 | 0.252 | 0.427 | −0.090 | −0.234 | 0.236 | 0.145 | 0.288 |
| (0.613) | (0.585) | (0.339) | (0.848) | (0.613) | (0.610) | (0.756) | (0.531) | |
| Relative upper limb | −0.414 | 0.613 | 0.391 | −0.306 | 0.342 | −0.055 | 0.473 | 0.360 |
| (0.355) | (0.144) | (0.386) | (0.504) | (0.452) | (0.908) | (0.284) | (0.427) | |
| Arm | 0.371 | 0 | 0.318 | −0.074 | −0.445 | 0.224 | 0.112 | 0.185 |
| (0.413) | (1) | (0.487) | (0.875) | (0.317) | (0.629) | (0.811) | (0.691) | |
| Forearm | 0.252 | 0.144 | −0.318 | 0.036 | −0.234 | 0.564 | 0.009 | −0.252 |
| (0.585) | (0.758) | (0.487) | (0.939) | (0.613) | (0.188) | (0.985) | (0.585) | |
| Hand | −0.679 | 0.500 | 0.757 | −0.321 | 0.643 | −0.631 | 0.414 | 0.714 |
| (0.094) | (0.253) | (0.049) | (0.482) | (0.119) | (0.129) | (0.355) | (0.071) | |
| Brachial index | 0.214 | 0 | −0.450 | 0.214 | −0.107 | 0.468 | −0.234 | −0.357 |
| (0.645) | (1) | (0.310) | (0.645) | (0.819) | (0.289) | (0.613) | (0.432) | |
| Intermembral index | 0.214 | 0.036 | −0.288 | −0.214 | −0.179 | 0.162 | 0.126 | −0.321 |
| (0.645 | (0.939) | (0.531) | (0.645) | (0.702) | (0.728) | (0.788) | (0.482) | |
Publisher’s Note: MDPI stays neutral with regard to jurisdictional claims in published maps and institutional affiliations. |
© 2021 by the authors. Licensee MDPI, Basel, Switzerland. This article is an open access article distributed under the terms and conditions of the Creative Commons Attribution (CC BY) license (http://creativecommons.org/licenses/by/4.0/).
Share and Cite
Vidal Pérez, D.; Martínez-Sanz, J.M.; Ferriz-Valero, A.; Gómez-Vicente, V.; Ausó, E. Relationship of Limb Lengths and Body Composition to Lifting in Weightlifting. Int. J. Environ. Res. Public Health 2021, 18, 756. https://0-doi-org.brum.beds.ac.uk/10.3390/ijerph18020756
Vidal Pérez D, Martínez-Sanz JM, Ferriz-Valero A, Gómez-Vicente V, Ausó E. Relationship of Limb Lengths and Body Composition to Lifting in Weightlifting. International Journal of Environmental Research and Public Health. 2021; 18(2):756. https://0-doi-org.brum.beds.ac.uk/10.3390/ijerph18020756
Chicago/Turabian StyleVidal Pérez, Dafnis, José Miguel Martínez-Sanz, Alberto Ferriz-Valero, Violeta Gómez-Vicente, and Eva Ausó. 2021. "Relationship of Limb Lengths and Body Composition to Lifting in Weightlifting" International Journal of Environmental Research and Public Health 18, no. 2: 756. https://0-doi-org.brum.beds.ac.uk/10.3390/ijerph18020756