Preliminary Results of the Planet Nutrition Program on Obesity Parameters in Mexican Schoolchildren: Pilot Single-School Randomized Controlled Trial

 , and
, and 
Abstract
:1. Introduction
2. Materials and Methods
2.1. Study Design
2.2. Participants
2.3. Training for the Study Team
2.4. Intervention Components
2.4.1. Nutrition Education Sessions
2.4.2. Physical Activity
2.4.3. Indirect Family Participation
2.5. Control Group
2.6. Outcome Measures
2.6.1. Primary Outcome
- BMI z-score: First, the weight and height of the children were measured. A SECA digital scale, model 872, was used to measure the body weight. The measurement was taken without shoes and accessories in the school sports uniform. Participants stood in the center of the scale with their arms at their sides. The height was measured with a stadiometer (SECA 213), without shoes, with the body resting on the stadiometer, heels together, slightly spread toes and extended legs. The Frankfurt plane was followed to a better position [20]. To obtain the BMI z-score, the WHO Anthro Plus software version 3.2 (Blue-infinity, S.A, Geneva, Switzerland) was used, where the values of weight, age, date of birth and sex were considered [21].
2.6.2. Secondary Outcomes
- Waist circumference: The measurement was taken at the umbilical scar level, with the participant standing and on the upper garment (due to the lack of privacy) using a non-stretch tape measure. Participants were asked to indicate their umbilical scar location and to inhale and exhale [20].
- Body fat: A tetrapolar electrical bioimpedance device (RJL Quantum II) was used to obtain the resistance and reactance values. The equipment has an alternating electrical current of 800 µA to 500 kHz. Participants were asked to remove any metal objects, shoes, and socks. Participants lay on a mat without moving for at least 5 min. Two electrodes were placed on the wrist and two on the right-side foot. To estimate the body fat percentage, an equation validated in Mexican children was used [22].
- Blood pressure: A digital sphygmomanometer, model Omron HEM-907, was used. The children sat down and rested for 2 to 3 min, then the cuff was placed on the right arm at the level of the biceps with the arm stretched. Two measurements were made to obtain an average value of systolic and diastolic blood pressure [23].
- Cardiorespiratory fitness: The Course-Navette test was used to indirectly estimate the maximum oxygen consumption (VO2Max). The participants completed a 20-m shuttle run test to the rhythm of a recording. The test is in one-minute stages and the speed increases (0.85 km/h to 0.5 km/h). Children were asked to stop when they felt tired [24]. The test was carried out by the study physical activity team.
- Physical activity and sedentary activities questionnaire: The physical activity and sedentary lifestyle part of the questionnaire “The Health Behavior in School-aged Children” (HBSC) was used, which is a validated lifestyle questionnaire for school-age children [25]. It consists of 9 questions, 5 questions related to the time and frequency of physical activity and 4 to sedentary activities.
- Food frequency questionnaire: A qualitative food frequency questionnaire was used, adapted from the questionnaire used in the PERSEO program with schoolchildren [26]. The questionnaire consists of 12 questions about the consumption of healthy foods (fruits, vegetables, cereals, legumes, animal source food, dairy, etc.) and unhealthy (sugary drinks, salty snacks, sweets, pastries, sausages, etc.). The frequency ranges from never to more than twice a day [27].
- Nutrition knowledge: To assess learning in the nutrition education sessions, a questionnaire designed by the study team was used. It consisted of 32 questions about nutrition and health. Questions were multiple choice with 4 possible responses (A–D) or ‘true or false’ choices. The results were calculated on a scale from 0 to 10. The higher the score, the greater the knowledge.
- Evaluation of the acceptability and benefits of the program: At the end of the intervention, an evaluation form was completed by the children of the intervention group and their parents. The children’s evaluation contained 3 multiple choice questions to rate the program and the benefits obtained, it was evaluated at school by the program staff. Similarly, the parents’ evaluation contained 4 multiple choice questions rating their perception of benefits in their children due to the program, the kind of benefits they noticed, the rating of the information received, and the way they would like to participate in the program if offered in the future.
2.7. Randomization
2.8. Statistical Analysis
3. Results
3.1. Study Variables
3.1.1. Obesity Parameters
3.1.2. Lifestyle and Nutrition Knowledge
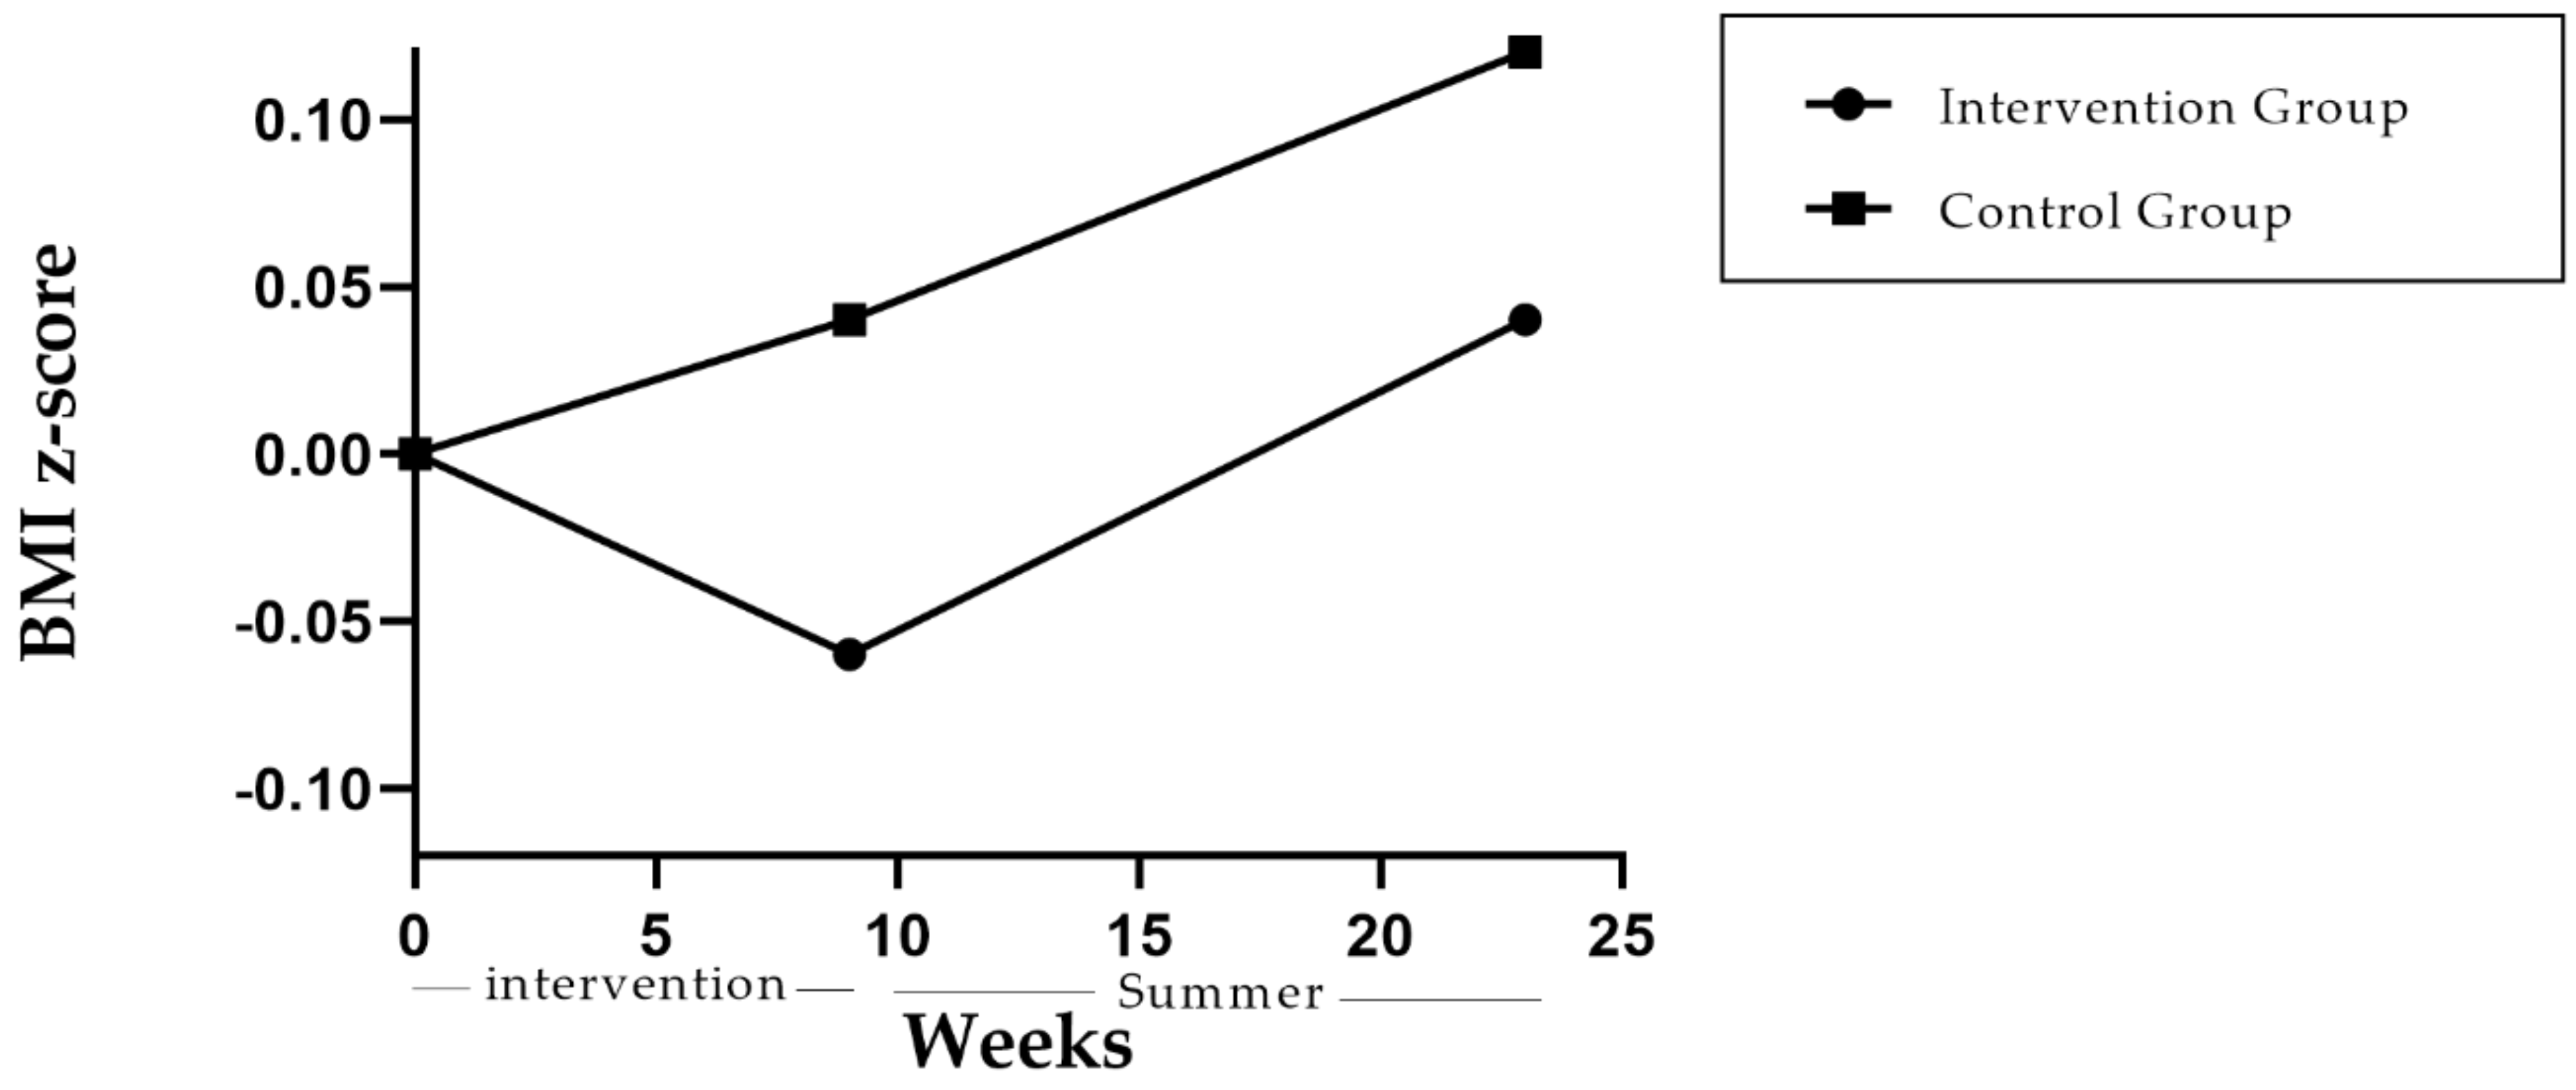
3.1.3. BMI Z-Score after the Summer Holiday
3.1.4. Evaluation of the Program by Children and Parents
3.1.5. Harms
4. Discussion
5. Conclusions
Author Contributions
Funding
Institutional Review Board Statement
Informed Consent Statement
Data Availability Statement
Acknowledgments
Conflicts of Interest
Appendix A

| Characteristics | Intervention Group (n = 21) | Control Group (n = 20) | Total (n = 41) | p Value |
|---|---|---|---|---|
| n (%) | ||||
| Fruit consumption | 0.43 | |||
| Weekly or at least once a week | 16 (76.2) | 13 (65.0) | 29 (70.7) | |
| Daily or more than 1 time a day | 5 (23.8) | 7 (35.0) | 12 (29.3) | |
| Vegetable consumption | 0.81 | |||
| Weekly or at least once a week | 14 (66.7) | 14 (70) | 28 (68.3) | |
| Daily or more than 1 time a day | 7 (33.3) | 6 (30.0) | 13 (31.7) | |
| Cereals and tubers consumption | 0.64 | |||
| Weekly or at least once a week | 9 (42.9) | 10 (50.0) | 19 (46.3) | |
| Daily or more than 1 time a day | 12 (57.1) | 10 (50.0) | 22 (53.7) | |
| Legume consumption | 0.47 | |||
| Never or less than 1 time a week | 1 (4.80) | 1 (5.00) | 2 (4.90) | |
| Weekly or at least once a week | 11 (52.4) | 14 (70.0) | 25 (61.0) | |
| Daily or more than 1 time a day | 9 (42.9) | 5 (25.0) | 14 (34.1) | |
| Dairy consumption | 0.39 | |||
| Weekly or at least once a week | 12 (57.1) | 14 (70.0) | 26 (63.4) | |
| Daily or more than 1 time a day | 9 (42.9) | 6 (30.0) | 15 (36.6) | |
| Animal source food consumption | 0.63 | |||
| Weekly or at least once a week | 11 (52.4) | 12 (52.2) | 23 (56.1) | |
| Daily or more than 1 time a day | 10 (47.6) | 8 (40.0) | 18 (43.9) | |
| Processed meat consumption | 0.97 | |||
| Never or less than 1 time a week | 7 (33.3) | 6 (30.0) | 13 (31.7) | |
| Weekly or at least once a week | 12 (57.1) | 12 (60.0) | 24 (58.5) | |
| Daily or more than 1 time a day | 2 (9.50) | 2 (10.0) | 4 (9.80) | |
| Fat consumption | 0.99 | |||
| Never or less than 1 time a week | 2 (9.50) | 2 (10.0) | 4 (9.80) | |
| Weekly or at least once a week | 15 (71.4) | 14 (70.0) | 29 (70.7) | |
| Daily or more than 1 time a day | 4 (19.0) | 4 (20.0) | 8 (19.5) | |
| Sweet beverages consumption | 0.14 | |||
| Never or less than 1 time a week | 2 (9.5) | 0 (0.00) | 2 (4.9) | |
| Weekly or at least once a week | 16 (76.2) | 13 (65.0) | 29 (70.7) | |
| Daily or more than 1 time a day | 3 (14.3) | 7 (35.0) | 10 (24.4) | |
| Snack consumption | 0.13 | |||
| Never or less than 1 time a week | 6 (28.6) | 4 (20.0) | 10 (24.4) | |
| Weekly or at least once a week | 12 (57.1) | 16 (80.0) | 28 (68.3) | |
| Daily or more than 1 time a day | 3 (14.3) | 0 (0.00) | 3 (7.30) | |
| Pastry consumption | 0.06 | |||
| Never or less than 1 time a week | 5 (23.8) | 1 (5.00) | 6 (14.6) | |
| Weekly or at least once a week | 14 (66.7) | 19 (95.0) | 33 (80.5) | |
| Daily or more than 1 time a day | 2 (9.50) | 0 (0.00) | 2 (4.90) | |
| Candy consumption | 0.33 | |||
| Never or less than 1 time a week | 7 (33.3) | 6 (30.0) | 13 (31.7) | |
| Weekly or at least once a week | 14 (66.7) | 12 (60.0) | 26 (63.4) | |
| Daily or more than 1 time a day | 0 (0.00) | 2 (10.0) | 2 (4.90) | |
Appendix B
| Characteristics | Intervention Group (n = 21) | Control Group (n = 20) | Total (n = 41) | p Value |
|---|---|---|---|---|
| n (%) | ||||
| Fruit consumption | 0.89 | |||
| Weekly or at least once a week | 12 (57.1) | 11 (55.0) | 23 (56.1) | |
| Daily or more than 1 time a day | 9 (42.9) | 9 (45.0) | 18 (43.9) | |
| Vegetables consumption | 0.34 | |||
| Never or less than 1 time a week | 0 (0.00) | 1 (5.00) | 1 (2.40) | |
| Weekly or at least once a week | 11 (52.4) | 13 (65.0) | 24 (58.5) | |
| Daily or more than 1 time a day | 10 (47.6) | 6 (30.0) | 16 (39.0) | |
| Cereals and tubers consumption | 0.55 | |||
| Weekly or at least once a week | 14 (66.7) | 15 (75.0) | 29 (70.7) | |
| Daily or more than 1 time a day | 7 (33.3) | 5 (25.0) | 12 (29.3) | |
| Legumes consumption | 0.32 | |||
| Never or less than 1 time a week | 1 (4.80) | 0 (0.00) | 1 (2.40) | |
| Weekly or at least once a week | 14 (66.7) | 17 (85.0) | 31 (75.6) | |
| Daily or more than 1 time a day | 6 (28.6) | 3 (15.0) | 9 (22.0) | |
| Dairy consumption | 0.22 | |||
| Weekly or at least once a week | 12 (57.1) | 15 (75.0) | 27 (65.9) | |
| Daily or more than 1 time a day | 9 (42.9) | 5 (25.0) | 14 (34.1) | |
| Animal source food consumption | 0.86 | |||
| Weekly or at least once a week | 11 (52.4) | 11 (55.0) | 22 (53.7) | |
| Daily or more than 1 time a day | 10 (47.6) | 9 (45.0) | 19 (46.3) | |
| Processed meat consumption | 0.73 | |||
| Never or less than 1 time a week | 3 (14.3) | 4 (20.0) | 7 (17.1) | |
| Weekly or at least once a week | 16 (76.2) | 13 (65.0) | 29 (70.7) | |
| Daily or more than 1 time a day | 2 (9.50) | 3 15.0) | 5 (12.2) | |
| Fat consumption | 0.57 | |||
| Never or less than 1 time a week | 0 (0.00) | 1 (5.00) | 1 (2.40) | |
| Weekly or at least once a week | 16 (76.2) | 15 (75.0) | 31 (75.6) | |
| Daily or more than 1 time a day | 5 (23.8) | 4 (20.0) | 9 (22.0) | |
| Sweet beverages consumption | 0.19 | |||
| Never or less than 1 time a week | 5 (23.8) | 2 (10.0) | 7 (17.1) | |
| Weekly or at least once a week | 16 (76.2) | 16 (80.0) | 32 (78.0) | |
| Daily or more than 1 time a day | 0 (0.00) | 2 (10.0) | 2 (4.90) | |
| Snack consumption | 0.97 | |||
| Never or less than 1 time a week | 5 (23.8) | 1 5.00) | 6 (14.6) | |
| Weekly or at least once a week | 16 (76.2) | 17 (85.0) | 33 (80.5) | |
| Daily or more than 1 time a day | 0 (0.00) | 2 (10.0) | 2 (4.90) | |
| Pastries consumption | 0.17 | |||
| Never or less than 1 time a week | 7 (33.3) | 5 (25.0) | 12 (29.3) | |
| Weekly or at least once a week | 14 (66.7) | 12 (60.0) | 26 (63.4) | |
| Daily or more than 1 time a day | 0 (0.00) | 3 (7.30) | 3 (7.30) | |
| Candy consumption | 0.65 | |||
| Never or less than 1 time a week | 6 (28.6) | 4 (20.0) | 10 (24.4) | |
| Weekly or at least once a week | 13 (61.9) | 15 (75.0) | 28 (68.3) | |
| Daily or more than 1 time a day | 2 (9.50) | 1 (5.00) | 3 (7.30) | |
References
- World Health Organization (WHO). Obesity and Overweight. Available online: https://www.who.int/news-room/fact-sheets/detail/obesity-and-overweight (accessed on 10 October 2019).
- NCD Risk Factor Collaboration. Worldwide Trends in Body-Mass Index, Underweight, Overweight, and Obesity from 1975 to 2016: A pooled analysis of 2416 population-based measurement studies in 128 · 9 million children, adolescents, and adults. Lancet 2017, 390, 2627–2642. [Google Scholar] [CrossRef] [Green Version]
- Shamah-Levy, T.; Vielma-Orozco, E.; Heredia-Hernández, O.; Romero-Martínez, M.; Mojica-Cuevas, J.C.-N.L.; Santaella-Castell, J.A.R.-D.J. Encuesta Nacional de Salud y Nutrición 2018–19: Resultados Nacionales; Instituto Nacional de Salud Pública: Cuernavaca, Mexico, 2020. [Google Scholar]
- Sharma, V.; Coleman, S.; Nixon, J.; Sharples, L.; Shield, J.H.; Rutter, H.; Bryant, M. A systematic review and meta—Analysis estimating the population prevalence of comorbidities in children and adolescents aged 5 to 18 years. Obes. Rev. 2019, 1341–1349. [Google Scholar] [CrossRef]
- Llewellyn, A.; Simmonds, M.; Owen, C.G.; Woolacott, N. Childhood obesity as a predictor of morbidity in adulthood: A systematic review and meta-analysis. Obes. Rev. 2016. [Google Scholar] [CrossRef] [PubMed]
- Smith, J.D.; Egan, K.N.; Montaño, Z.; Dawson-McClure, S.; Jake-Schoffman, D.E.; Larson, M.; St. George, S.M. A Developmental Cascade Perspective of Pediatric Obesity: Conceptual Model and Scoping Review. Health Psychol. Rev. 2019, 12, 271–293. [Google Scholar] [CrossRef] [PubMed]
- Vilchis-gil, J.; Galván-portillo, M.; Klünder-klünder, M.; Cruz, M.; Flores-huerta, S. Food habits, physical activities and sedentary lifestyles of eutrophic and obese school children: A case—control study. BMC Public Health 2015, 1–8. [Google Scholar] [CrossRef] [PubMed] [Green Version]
- Franckle, R.; Adler, R.; Davison, K. Accelerated Weight Gain Among Children During Summer Versus School Year and Related Racial/Ethnic Disparities: A Systematic Review Data sources. Prev. Chronic Dis. 2014, 11, 1–10. [Google Scholar] [CrossRef] [Green Version]
- Díaz-Zavala, R.G.; Castro-Cantú, M.F.; Valencia, M.E.; Álvarez-Hernández, G.; Haby, M.M.; Esparza-Romero, J. Effect of the Holiday Season on Weight Gain: A Narrative Review. J. Obes. 2017, 2017. [Google Scholar] [CrossRef] [Green Version]
- Hippel, P.T.V.; Workman, J. From Kindergarten Through Second Grade, US. Children’s Obesity Prevalence Grows Only During Summer Vacations. Obes. J. 2016, 24, 2296–2300. [Google Scholar] [CrossRef] [Green Version]
- Pan American Health Organization (PAHO). Plan de Acción Para la Prevención de la Obesidad en la Niñez y la Adolescencia. Available online: https://www.paho.org/hq/dmdocuments/2015/Obesity-Plan-Of-Action-Child-Spa-2015.pdf (accessed on 10 October 2019).
- Brown, T.; Thm, M.; Hooper, L.; Gao, Y.; Zayegh, A.; Ijaz, S.; Elwenspoek, M.; Sc, F.; Magee, L.; Brown, T.; et al. Interventions for preventing obesity in children (Review). Cochr. Database Syst. Rev. 2019. [Google Scholar] [CrossRef] [Green Version]
- Pérez-Rodrigo, C.; Aranceta, J. Nutrition education in schools: Experiences and challenges. Eur. J. Clin. Nutr. 2003, 57, S82–S85. [Google Scholar] [CrossRef] [Green Version]
- Gortmaker, S.L.; Peterson, K.; Wiecha, J.; Sobol, A.M.; Dixit, S.; Fox, M.K.; Laird, N. Reducing Obesity via a School-Based Interdisciplinary Intervention Among Youth. Arch. Pediatr. Adolesc. Med. 1999, 153, 409–418. [Google Scholar] [CrossRef] [PubMed]
- Franks, A.L.; Kelder, S.H.; Dino, G.A.; Horn, K.A.; Steven, L.; Wiecha, J.L.; Simoes, E.J. School-based Programs: Lessons Learned from CATCH, Planet Health, and Not-On-Tabacco. Prev. Chronic Dis. 2007, 4, 1–9. [Google Scholar]
- Chavez, R.C.; Nam, E.W. School-based obesity prevention interventions in Latin America: A systematic review. Rev. Saude Publica 2020, 54, 110. [Google Scholar] [CrossRef] [PubMed]
- Universidad Autónoma del Estado de Hidalgo (UAEH). Educación en Salud y Nutrición en Escuelas Primarias: Los Proyectos Formativos Como Estrategia Innovadora de Planificación Didáctica; Galván, M., Granados, V., López, G., Hernández, J., Eds.; Primera Consejo Editorial: Hidalgo, Mexico, 2016; ISBN 9786074824827. [Google Scholar]
- Shamah, T.; Morales, C.; Amaya, C.; Salsazar, A.; Jiménez, A.; Méndez, I.; Humarán, G. Effectiveness of a diet and physical activity promotion strategy on the prevention of obesity in Mexican school children. BMC Public Health 2012, 1–13. [Google Scholar] [CrossRef] [PubMed] [Green Version]
- USDA. Choose MyPlate. Available online: https://www.fns.usda.gov/program/myplate (accessed on 18 January 2021).
- Gibson, R. Principles of Nutritional Assessment; Oxford University Press: New York, NY, USA, 1990. [Google Scholar]
- WHO. Growth Reference 5–19 Years. Available online: https://www.who.int/growthref/en/ (accessed on 1 October 2019).
- Ramírez, E.; Valencia, M.E.; Bourges, H.; Espinosa, T.; Moya-camarena, S.Y.; Salazar, G.; Aleman, H. Body composition prediction equations based on deuterium oxide dilution method in Mexican children: A national study. Eur. J. Clin. Nutr. 2012, 1099–1103. [Google Scholar] [CrossRef] [Green Version]
- Flynn, J.; Kaelber, D.; Baker-Smith, C.; Blowey, D.; Falkner, B.; Gidding, S.S. Clinical Practice Guideline for Screening and Management of High Blood Pressure in Children and Adolescents. Am. Acad. Pediatr. 2017, 140, e20171904. [Google Scholar] [CrossRef] [Green Version]
- Léger, L.A.; Mercier, D.; Gadoury, C.; Lambert, J. The multistage 20 metre shuttle run test for aerobic fitness The multistage 20 metre shuttle run test for aerobic fitness. J. Sports Sci. 2007, 6, 93–101. [Google Scholar] [CrossRef]
- Currie, C.; Inchley, J.; Molcho, M.; Lenzi, M.; Veselska, Z.; Wild, F. Health Behaviour in School-aged Children (HBSC) Study Protocol: Background, Methodology and Mandatory Items for the 2009/10 Survey. Int. J. Public Health 2009, 54, 140–150. [Google Scholar]
- Shamah-Levy, T.; Cuevas-Nasu, L.; Rivera-Dommarco, J.; Hernández-Ávila, M. Encuesta Nacional de Salud y Nutrición de Medio Camino 2016 (ENSANUT MC 2016). Inst. Nac. Salud Pública Secr. Salud 2016, 2016, 151. [Google Scholar]
- Aranceta, J.; Pérez, C.; Santolaya, J.; Gondra, J. El Proyecto PERSEO en Bilbao: Evaluación preliminar. Rev. Esp. Nutr. Comunitaria 2013, 19, 88–97. [Google Scholar]
- Verjans-Janssen, S.R.B.; Van De Kolk, L.; Van Kann, D.; Kremers, S.; Gerards, S. Effectiveness of school-based physical activity and nutrition interventions with direct parental involvement on children’ s BMI and energy balance-related behaviors—A systematic review. PLoS ONE 2018, 13, e0204560. [Google Scholar] [CrossRef] [PubMed]
- Carrel, A.L.; Clark, R.R.; Peterson, S.; Eickhoff, J.; Allen, D.B. School-based fitness changes are lost during the summer vacation. Arch. Pediatr. Adolesc. Med. 2007, 161, 561–564. [Google Scholar] [CrossRef] [PubMed]
- Yin, Z.; Moore, J.B.; Johnson, M.H.; Vernon, M.M.; Gutin, B. The impact of a 3-year after-school obesity prevention program in elementary school children. Child. Obes. 2012, 8, 60–70. [Google Scholar] [CrossRef] [PubMed] [Green Version]
- Brazendale, K.; Beets, M.W.; Weaver, R.G.; Pate, R.R.; Turner-McGrievy, G.M.; Kaczynski, A.T.; Chandler, J.L.; Bohnert, A.; von Hippel, P.T. Understanding differences between summer vs. school obesogenic behaviors of children: The structured days hypothesis. Int. J. Behav. Nutr. Phys. Act. 2017, 14, 1–14. [Google Scholar] [CrossRef]
- Campbell, M.K. Review Biological, environmental, and social influences on childhood obesity. Pediatr. Res. 2016, 79, 205–211. [Google Scholar] [CrossRef] [Green Version]
- Elder, J.P.; Ayala, G.X.; Harris, S. Theories and Intervention Approaches to Health-Behavior Change in Primary Care. Am. J. Prev. Med. 1999, 17, 16–20. [Google Scholar] [CrossRef]
- Baranowski, T.; Cullen, K.W.; Nicklas, T.; Thompson, D.; Baranowski, J.; Cullen, K.W. Are Current Health Behavioral Change Models Helpful in Guiding Prevention of Weight Gain Efforts? Obes. Res. 2003. [Google Scholar] [CrossRef]
- Díaz-Zavala, R.G.; Esparza-Romero, J.; Moya-Camarena, S.; Robles-Sardín, A.E.; Valencia, M.E. Lifestyle Intervention in Primary Care Settings Improves Obesity Parameters among Mexican Youth. J. Am. Diet. Assoc. 2010, 110, 285–290. [Google Scholar] [CrossRef]
- Bleich, S.N.; Vercammen, K.A.; Zatz, L.Y.; Frelier, J.M.; Ebbeling, C.B.; Peeters, A. Review Interventions to prevent global childhood overweight and obesity: A systematic review. Lancet Diabetes Endocrinol. 2017, 8587, 1–15. [Google Scholar] [CrossRef]
- Carrel, A.L.; Logue, J.; Deininger, H.; Clark, R.R.; Montague, P.; Baldwin, S. An after-school exercise program improves fitness, and body composition in elementary school children. J. Phys. Educ. Sport Manag. 2014, 2, 32–36. [Google Scholar]
- Eldridge, S.M.; Chan, C.L.; Campbell, M.J.; Bond, C.M.; Hopewell, S.; Thabane, L.; Lancaster, G.A.; Altman, D.; Bretz, F.; Campbell, M.; et al. CONSORT 2010 statement: Extension to randomised pilot and feasibility trials. BMJ 2016, 355. [Google Scholar] [CrossRef] [Green Version]
- Cotton, W.; Dudley, D.; Peralta, L.; Werkhoven, T. The effect of teacher-delivered nutrition education programs on elementary-aged students: An updated systematic review and meta-analysis. Prev. Med. Rep. 2020, 20, 101178. [Google Scholar] [CrossRef] [PubMed]


| Sessions | Topics |
|---|---|
| 1 | Creating healthy habits |
| 2 | What is excess weight? |
| 3 | Is it really bad to eat ultra-processed food? |
| 4 | The bitter truth of sweetened beverages |
| 5 | The importance of physical activity |
| 6 | Sedentary behaviors |
| 7 | Food Guidelines: My plate |
| 8 | Analyzing my healthy lunch |
| 9 | Jar for healthy drinking |
| 10 | Sweetened beverages vs. healthy lunch |
| 11 | Reading food labels |
| 12 | Importance of healthy nutrition |
| 13 | Ultra-processed food |
| 14 | Sustainable lifestyle |
| 15 | Traditional Mexican diet |
| 16 | Healthy lunch |
| 17 | Identifying good and bad fats |
| 18 | What is important to know about sodium? |
| 19 | Smoking |
| 20 | Learning about Cancer |
| 21 | Importance of consuming fruits and vegetables |
| 22 | Vitamins and minerals |
| 23 | Why is fiber consumption important |
| 24 | Gut microbiota |
| 25 | Jeopardy: Let’s put into practice the learning |
| 26 | How to prepare a salad |
| Characteristics | Intervention Group (n = 21) | Control Group (n = 20) | Total (n = 41) | p Value |
|---|---|---|---|---|
| Mean ± SD | ||||
| Age (y) | 10.2 ± 0.43 | 10.3 ± 0.48 | 10.2 ± 0.46 | 0.44 |
| Weight (kg) | 44.2 ± 13.5 | 41.8 ± 10.6 | 43.0 ± 12.2 | 0.55 |
| Height (m) | 1.44 ± 0.08 | 1.44 ± 0.07 | 2.54 ± 3.92 | 0.84 |
| BMI z-score a | 1.14 ± 1.57 | 0.86 ± 1.37 | 1.01 ± 1.47 | 0.55 |
| Waist circumference (cm) | 70.6 ± 12.9 | 69.0 ± 11.3 | 69.8 ± 12.1 | 0.67 |
| Body fat (%) | 34.4 ± 6.52 | 33.5 ± 6.19 | 34.0 ± 6.31 | 0.67 |
| Systolic Blood Pressure (mmHg) | 102 ± 11.2 | 95.5 ± 14.9 | 99.0 ± 13.4 | 0.09 |
| Diastolic Blood Pressure (mmHg) | 60.8 ± 8.71 | 57.5 ± 16.3 | 59.2 ± 12.9 | 0.79 |
| Cardiorespiratory fitness (VO2Max) | 38.6 ± 4.09 | 37.9 ± 3.20 | 38.3 ± 1.52 | 0.54 |
| Nutrition knowledge (pts) b | 4.80 ± 1.50 | 4.30 ± 1.00 | 4.60 ± 1.35 | 0.30 |
| Daily physical activity (hrs) | 1.06 ± 0.69 | 0.98 ± 0.47 | 1.02 ± 0.59 | 0.98 |
| Daily sedentary activities (hrs) | 0.78 ± 0.53 | 1.02 ± 0.63 | 0.90 ± 0.59 | 0.16 |
| n (%) | ||||
| Sex | 0.64 | |||
| Male | 10 (47.7) | 11 (55.0) | 21 (51.2) | |
| Female | 11 (52.3) | 9 (45.0) | 20 (48.7) | |
| Father’s education | 0.52 | |||
| Basic level c | 5 (25.0) | 2 (11.8) | 7 (18.9) | |
| High school | 4 (20.0) | 7 (35.3) | 11 (27.9) | |
| College (University) | 8 (45.0) | 6 (32.3) | 14 (40.5) | |
| Postgraduate d | 2 (10.0) | 3 (17.6) | 5 (13.5) | |
| Mother’s education | 0.09 | |||
| Basic level c | 3 (15.8) | 1 (5.26) | 4 (9.75) | |
| High school | 7 (21.1) | 7 (21.1) | 14 (34.1) | |
| College (University) | 11 (63.1) | 8 (47.4) | 21 (51.2) | |
| Postgraduate d | 0.00 | 4 (26.3) | 4 (9.75) | |
| Nutritional status (BMI-based) | 0.90 | |||
| Underweight | 1 (4.76) | 2 (10.0) | 3 (7.30) | |
| Normal weight | 9 (47.6) | 11 (50.0) | 20 (48.8) | |
| Overweight | 3 (14.3) | 2 (10.0) | 5 (12.2) | |
| Obesity | 8 (33.3) | 5 (30.0) | 13 (31.8) | |
| Outcome | Baseline | 9 Weeks | 23 Weeks | Change at 9 Weeks a | Change at 23 Weeks a | Difference at 9 Weeks b | Difference at 23 Weeks b |
|---|---|---|---|---|---|---|---|
| Mean ± SD | Mean (95% CI) | ||||||
| Weight (kg) | −0.70 (−1.35, 0.06) | −0.36 (−1.56, 0.82) | |||||
| Intervention | 44.1 ± 13.6 | 44.6 ± 13.3 | 46.9 ± 14.2 | 0.44 ± 0.78 | 2.75 ± 1.39 | ||
| Control | 41.9 ± 10.7 | 43.0 ± 11.1 | 45.0 ± 11.7 | 1.15 ± 1.22 | 3.12 ± 2.28 | ||
| Height (cm) | 0.005 (−0.0006, 0.01) | 0.003 (−0.004, 0.011) | |||||
| Intervention | 1.44 ± 0.08 | 1.45 ± 0.08 | 1.46 ± 0.08 | 0.01 ± 0.01 | 0.02 ± 0.01 | ||
| Control | 1.44 ± 0.07 | 1.45 ± 0.07 | 1.46 ± 0.07 | 0.01 ± 0.01 | 0.02 ± 0.01 | ||
| BMI z-score | −0.11 (−0.23, 0.01) | 0.07 (−0.22, 0.07) | |||||
| Intervention | 1.14 ± 1.57 | 1.07 ± 1.53 | 1.19 ± 1.56 | −0.06 ± 0.12 | 0.04 ± 0.21 | ||
| Control | 0.86 ± 1.37 | 0.90 ± 1.39 | 0.98 ± 1.42 | 0.04 ± 0.25 | 0.12 ± 0.26 | ||
| Waist circumference (cm) | −3.45 (−5.55, −1.36) c | — | |||||
| Intervention | 70.6 ± 12.9 | 68.2 ± 12.3 | — | −2.35 ± 3.06 | — | ||
| Control | 68.9 ± 11.3 | 70.0 ± 11.5 | — | 1.10 ± 3.55 | — | ||
| Body Fat (%) | −1.72 (−3.42, −0.02) d | — | |||||
| Intervention | 34.3 ± 6.53 | 32.8 ± 6.34 | — | −1.47 ± 2.76 | — | ||
| Control | 33.5 ± 6.19 | 33.7 ± 6.62 | — | 0.24 ± 2.51 | — | ||
| Systolic Blood Pressure (mmHg) | −8.28 (−17.6, 1.04) | — | |||||
| Intervention | 102 ± 11.2 | 102 ± 12.7 | — | −0.33 ± 11.6 | — | ||
| Control | 95.4 ± 14.8 | 103 ± 12.9 | — | 7.95 ± 17.4 | — | ||
| Diastolic Blood Pressure (mmHg) | 0.89 (−2.26, 4.04) | — | |||||
| Intervention | 60.7 ± 8.71 | 58.9 ± 8.7 | — | −1.89 ± 2.33 | — | ||
| Control | 61.7 ± 12.5 | 50.0 ± 13.1 | — | −2.70 ± 6.72 | — | ||
| Cardiorespiratory fitness (VO2Max) | 0.72 (−0.98, 2.4) | — | |||||
| Intervention | 38.5 ± 4.09 | 38.9 ± 4.05 | — | 0.35 ± 1.17 | — | ||
| Control | 38.1 ± 3.13 | 37.7 ± 3.47 | — | −0.36 ± 3.68 | — | ||
| Nutrition Knowledge (pts) e | 1.15 (0.27, 2.03) | — | |||||
| Intervention | 4.81 ± 1.56 | 6.49 ± 2.15 | — | 1.67 ± 1.62 | — | ||
| Control | 4.38 ± 1.07 | 4.90 ± 1.27 | — | 0.52 ± 1.09 | — | ||
| Daily physical activity (hrs) f | 0.44 (0.01, 0.88) | — | |||||
| Intervention | 1.06 ± 0.69 | 1.27 ± 0.50 | — | 0.21 ± 0.78 | — | ||
| Control | 0.98 ± 0.47 | 0.74 ± 0.44 | — | −0.23 ± 0.58 | — | ||
| Daily sedentary activities (hrs) | 0.09 (−0.29, 0.48) | — | |||||
| Intervention | 0.78 ± 0.52 | 0.78 ± 0.56 | — | 0.006 ± 0.74 | — | ||
| Control | 1.02 ± 0.63 | 0.93 ± 0.68 | — | −0.08 ± 0.45 | — | ||
Publisher’s Note: MDPI stays neutral with regard to jurisdictional claims in published maps and institutional affiliations. |
© 2021 by the authors. Licensee MDPI, Basel, Switzerland. This article is an open access article distributed under the terms and conditions of the Creative Commons Attribution (CC BY) license (http://creativecommons.org/licenses/by/4.0/).
Share and Cite
Ramírez-Rivera, D.L.; Martínez-Contreras, T.; Villegas-Valle, R.C.; Henry-Mejia, G.; Quizán-Plata, T.; Haby, M.M.; Díaz-Zavala, R.G. Preliminary Results of the Planet Nutrition Program on Obesity Parameters in Mexican Schoolchildren: Pilot Single-School Randomized Controlled Trial. Int. J. Environ. Res. Public Health 2021, 18, 790. https://0-doi-org.brum.beds.ac.uk/10.3390/ijerph18020790
Ramírez-Rivera DL, Martínez-Contreras T, Villegas-Valle RC, Henry-Mejia G, Quizán-Plata T, Haby MM, Díaz-Zavala RG. Preliminary Results of the Planet Nutrition Program on Obesity Parameters in Mexican Schoolchildren: Pilot Single-School Randomized Controlled Trial. International Journal of Environmental Research and Public Health. 2021; 18(2):790. https://0-doi-org.brum.beds.ac.uk/10.3390/ijerph18020790
Chicago/Turabian StyleRamírez-Rivera, Diana L., Teresita Martínez-Contreras, Rosa C. Villegas-Valle, Gricelda Henry-Mejia, Trinidad Quizán-Plata, Michelle M. Haby, and Rolando G. Díaz-Zavala. 2021. "Preliminary Results of the Planet Nutrition Program on Obesity Parameters in Mexican Schoolchildren: Pilot Single-School Randomized Controlled Trial" International Journal of Environmental Research and Public Health 18, no. 2: 790. https://0-doi-org.brum.beds.ac.uk/10.3390/ijerph18020790