
Strategies to Control Human Health Risks Arising from Antibiotics in the Environment: Molecular Modification of QNs for Enhanced Plant–Microbial Synergistic Degradation

Abstract
:1. Introduction
2. Materials and Methods
2.1. Data Source of the Plant–Microbial Synergistic Degradation Effect of QNs
2.2. D-QSAR Model of the Plant–Microbial Synergistic Degradation Effect of QNs
2.2.1. Characterization of the Plant–Microbial Synergistic Degradation Effect of QNs—Fuzzy Comprehensive Evaluation Method
2.2.2. Construction of the 3D-QSAR Model for the Plant–Microbial Synergistic Degradation Effect of QNs
2.3. Evaluation of the Environment-Friendliness and Functional Properties of the QNs Derivatives—EPI, Gaussian, Pharmacodynamics, and HQSAR Model
2.4. Simulation of the Plant and Microbial Transformation Pathways of QNs and Their Derivatives
2.5. Assessment of Human Health Risk Raised by the Plant and Microbial Transformation Products of QNs and Their Derivatives Using Pharmacokinetics and Toxicokinetics
3. Results and Discussion
3.1. Construction and Evaluation of the 3D-QSAR Model for the Plant–Microbial Synergistic Degradation Effects of QNs
3.1.1. Calculation of the Plant–Microbial Synergistic Degradation Effect Values of QNs
3.1.2. Construction and Evaluation of the 3D-QSAR Model for the Plant–Microbial Synergistic Degradation Effects of QNs
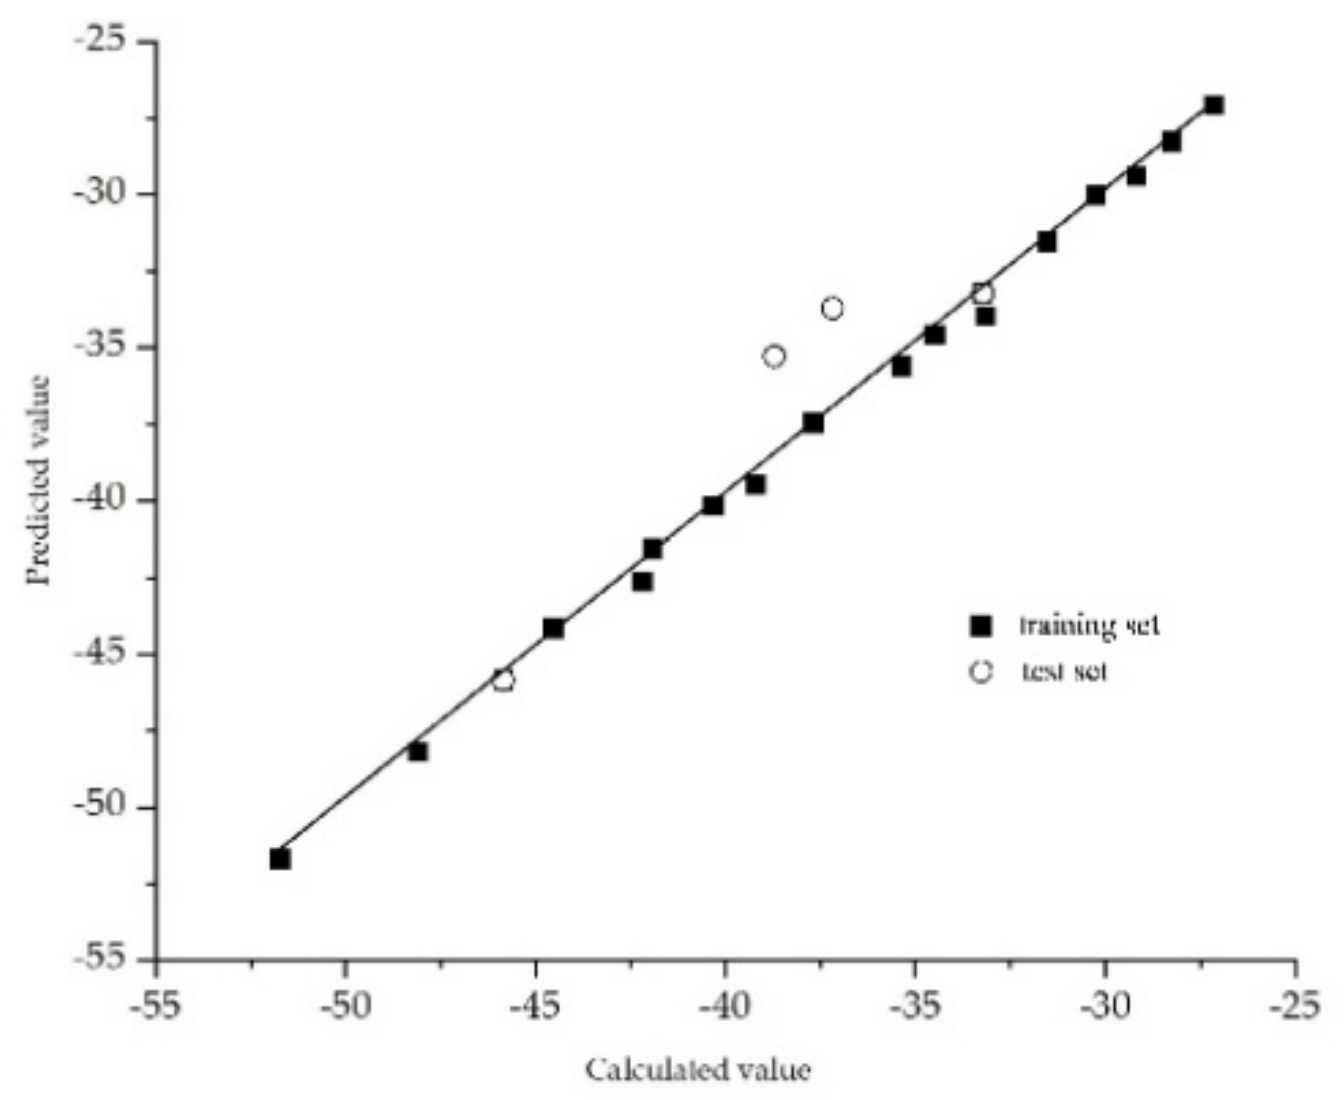
3.1.3. Validation of the 3D-QSAR Model for the Plant–Microbial Synergistic Degradation Effects of QNs
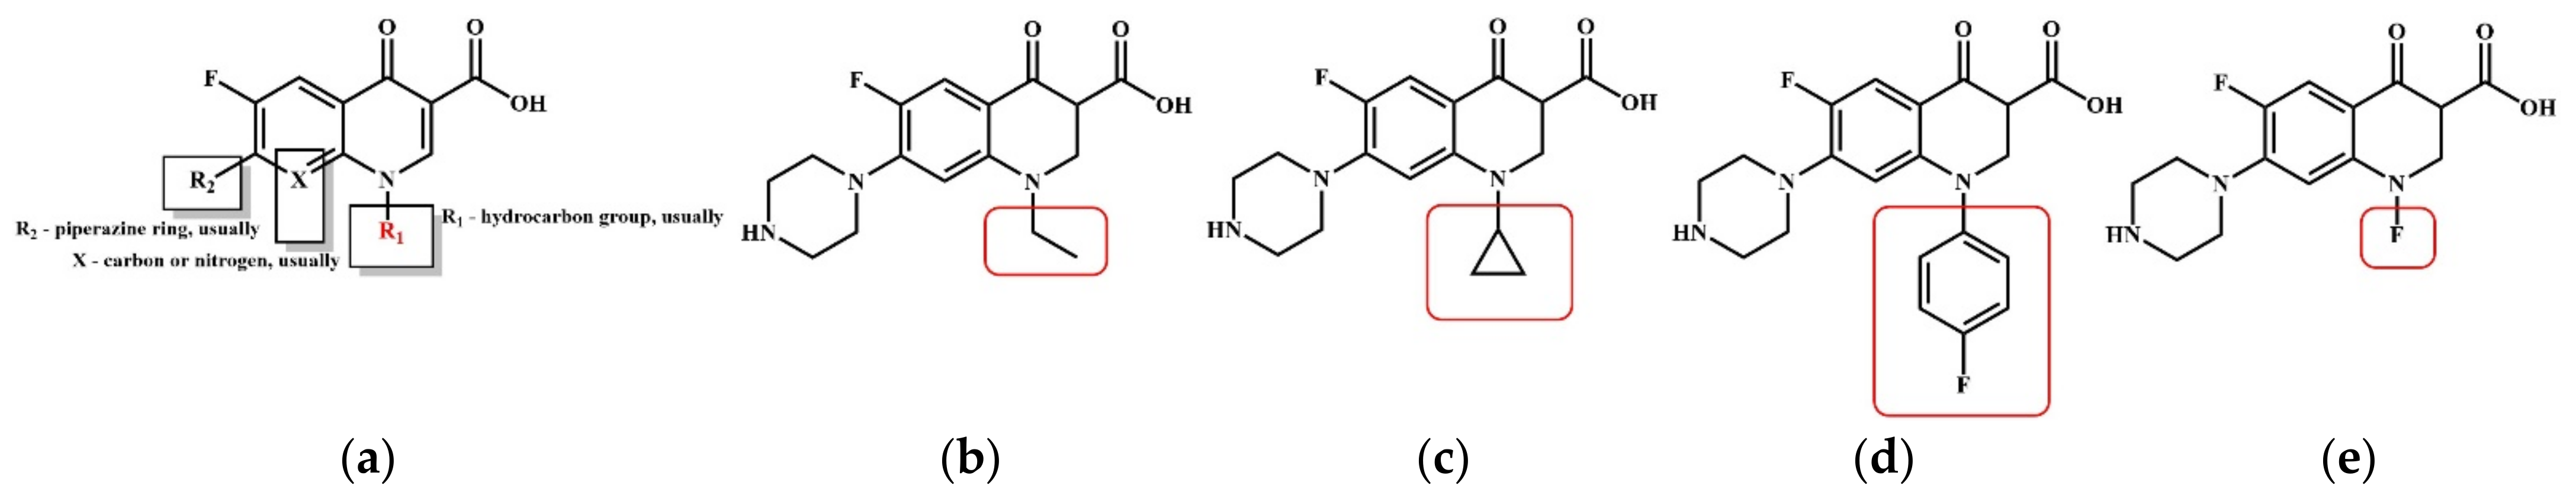
3.2. Molecular Modification of the QNs Derivatives Based on the CoMSIA Model for the Plant–Microbial Synergistic Degradation Effects
3.3. Prediction and Evaluation of the Plant–Microbial Synergistic Degradation Effects of the Modified NOR Derivatives
3.4. Evaluation of the Environment-Friendliness and the Functional Properties of NOR Derivatives
3.4.1. Evaluation of the Environment-Friendliness of NOR Derivatives
3.4.2. Evaluation of the Functional Properties of NOR Derivatives
3.5. Simulation of the Plant and Microbial Transformation Pathways of NOR and Its Derivatives
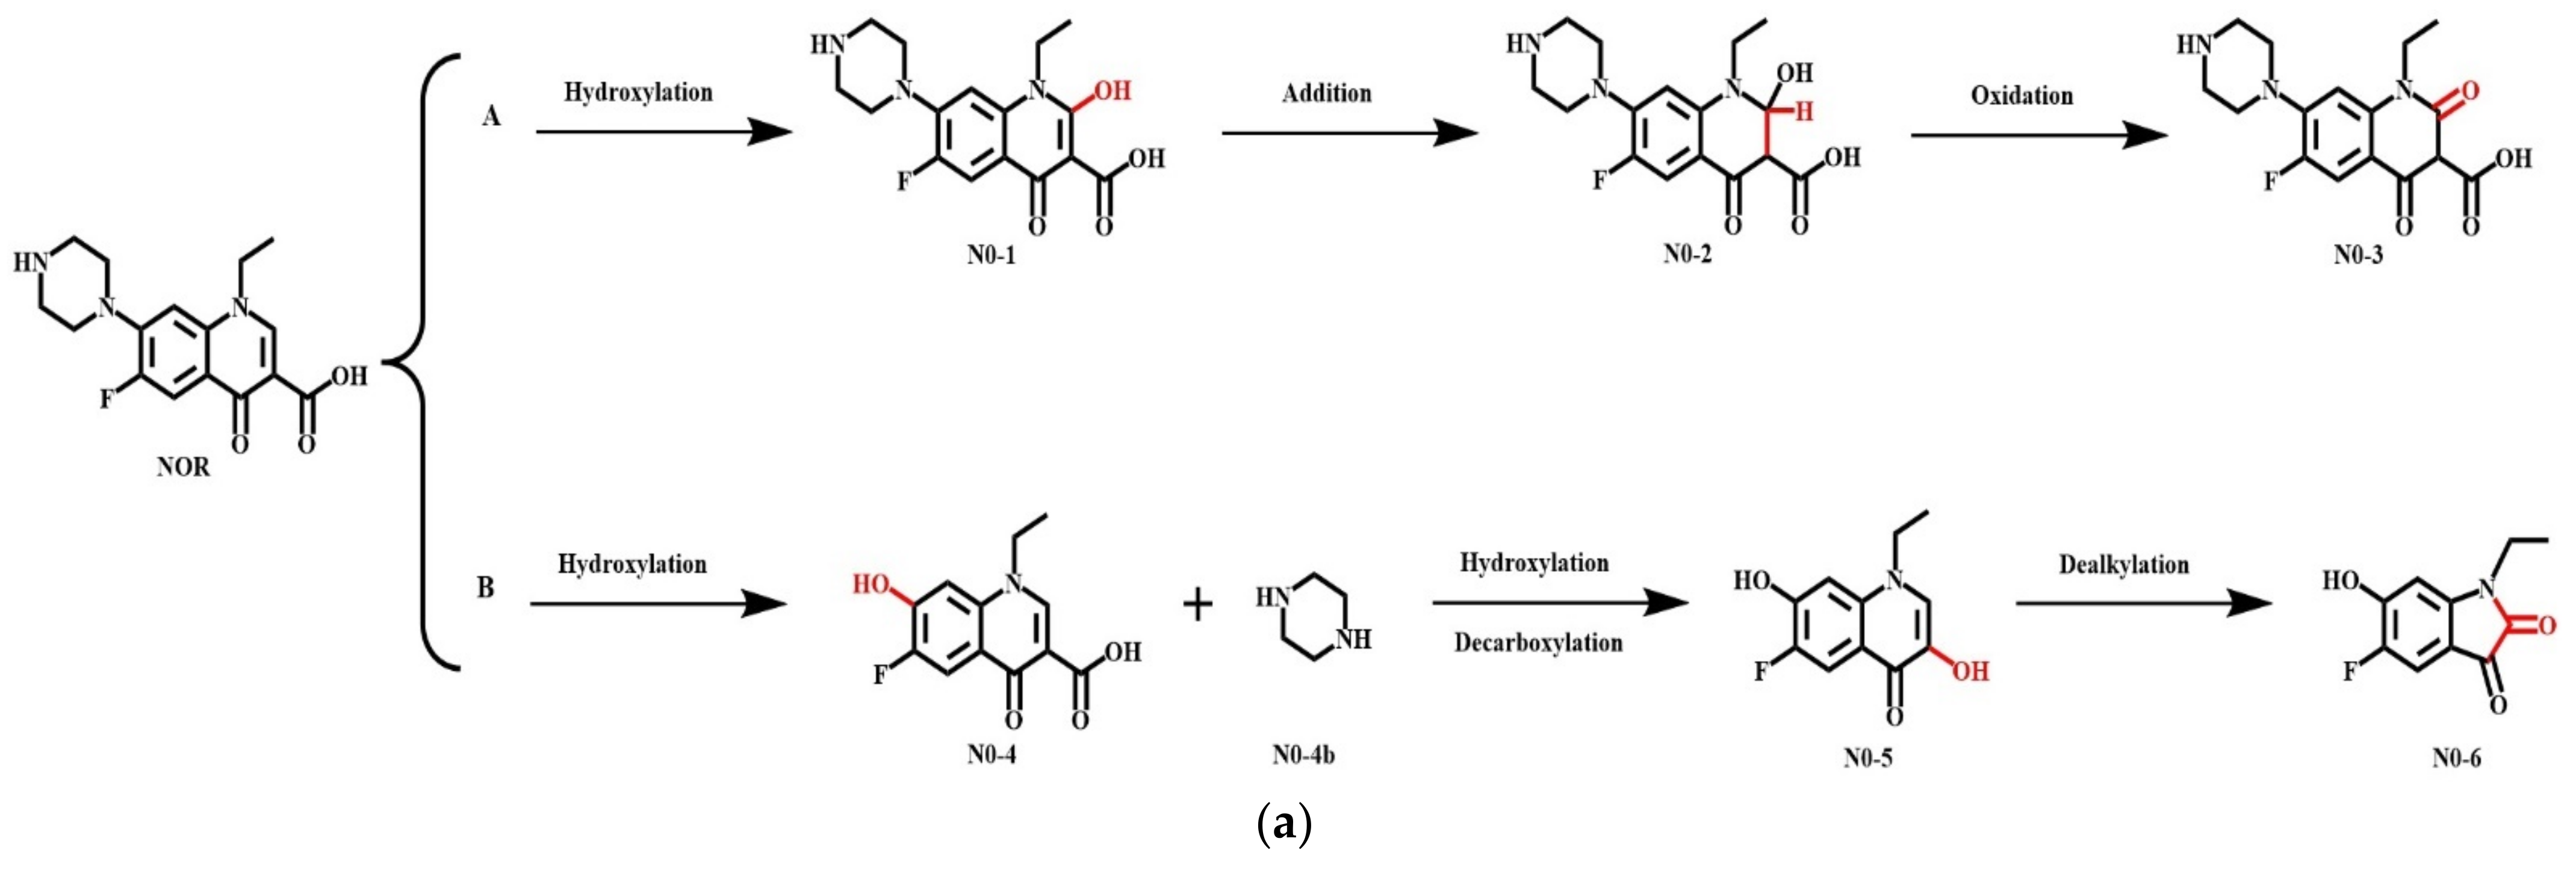
3.5.1. Simulation of the Plant Degradation Pathways of NOR and Its Derivatives
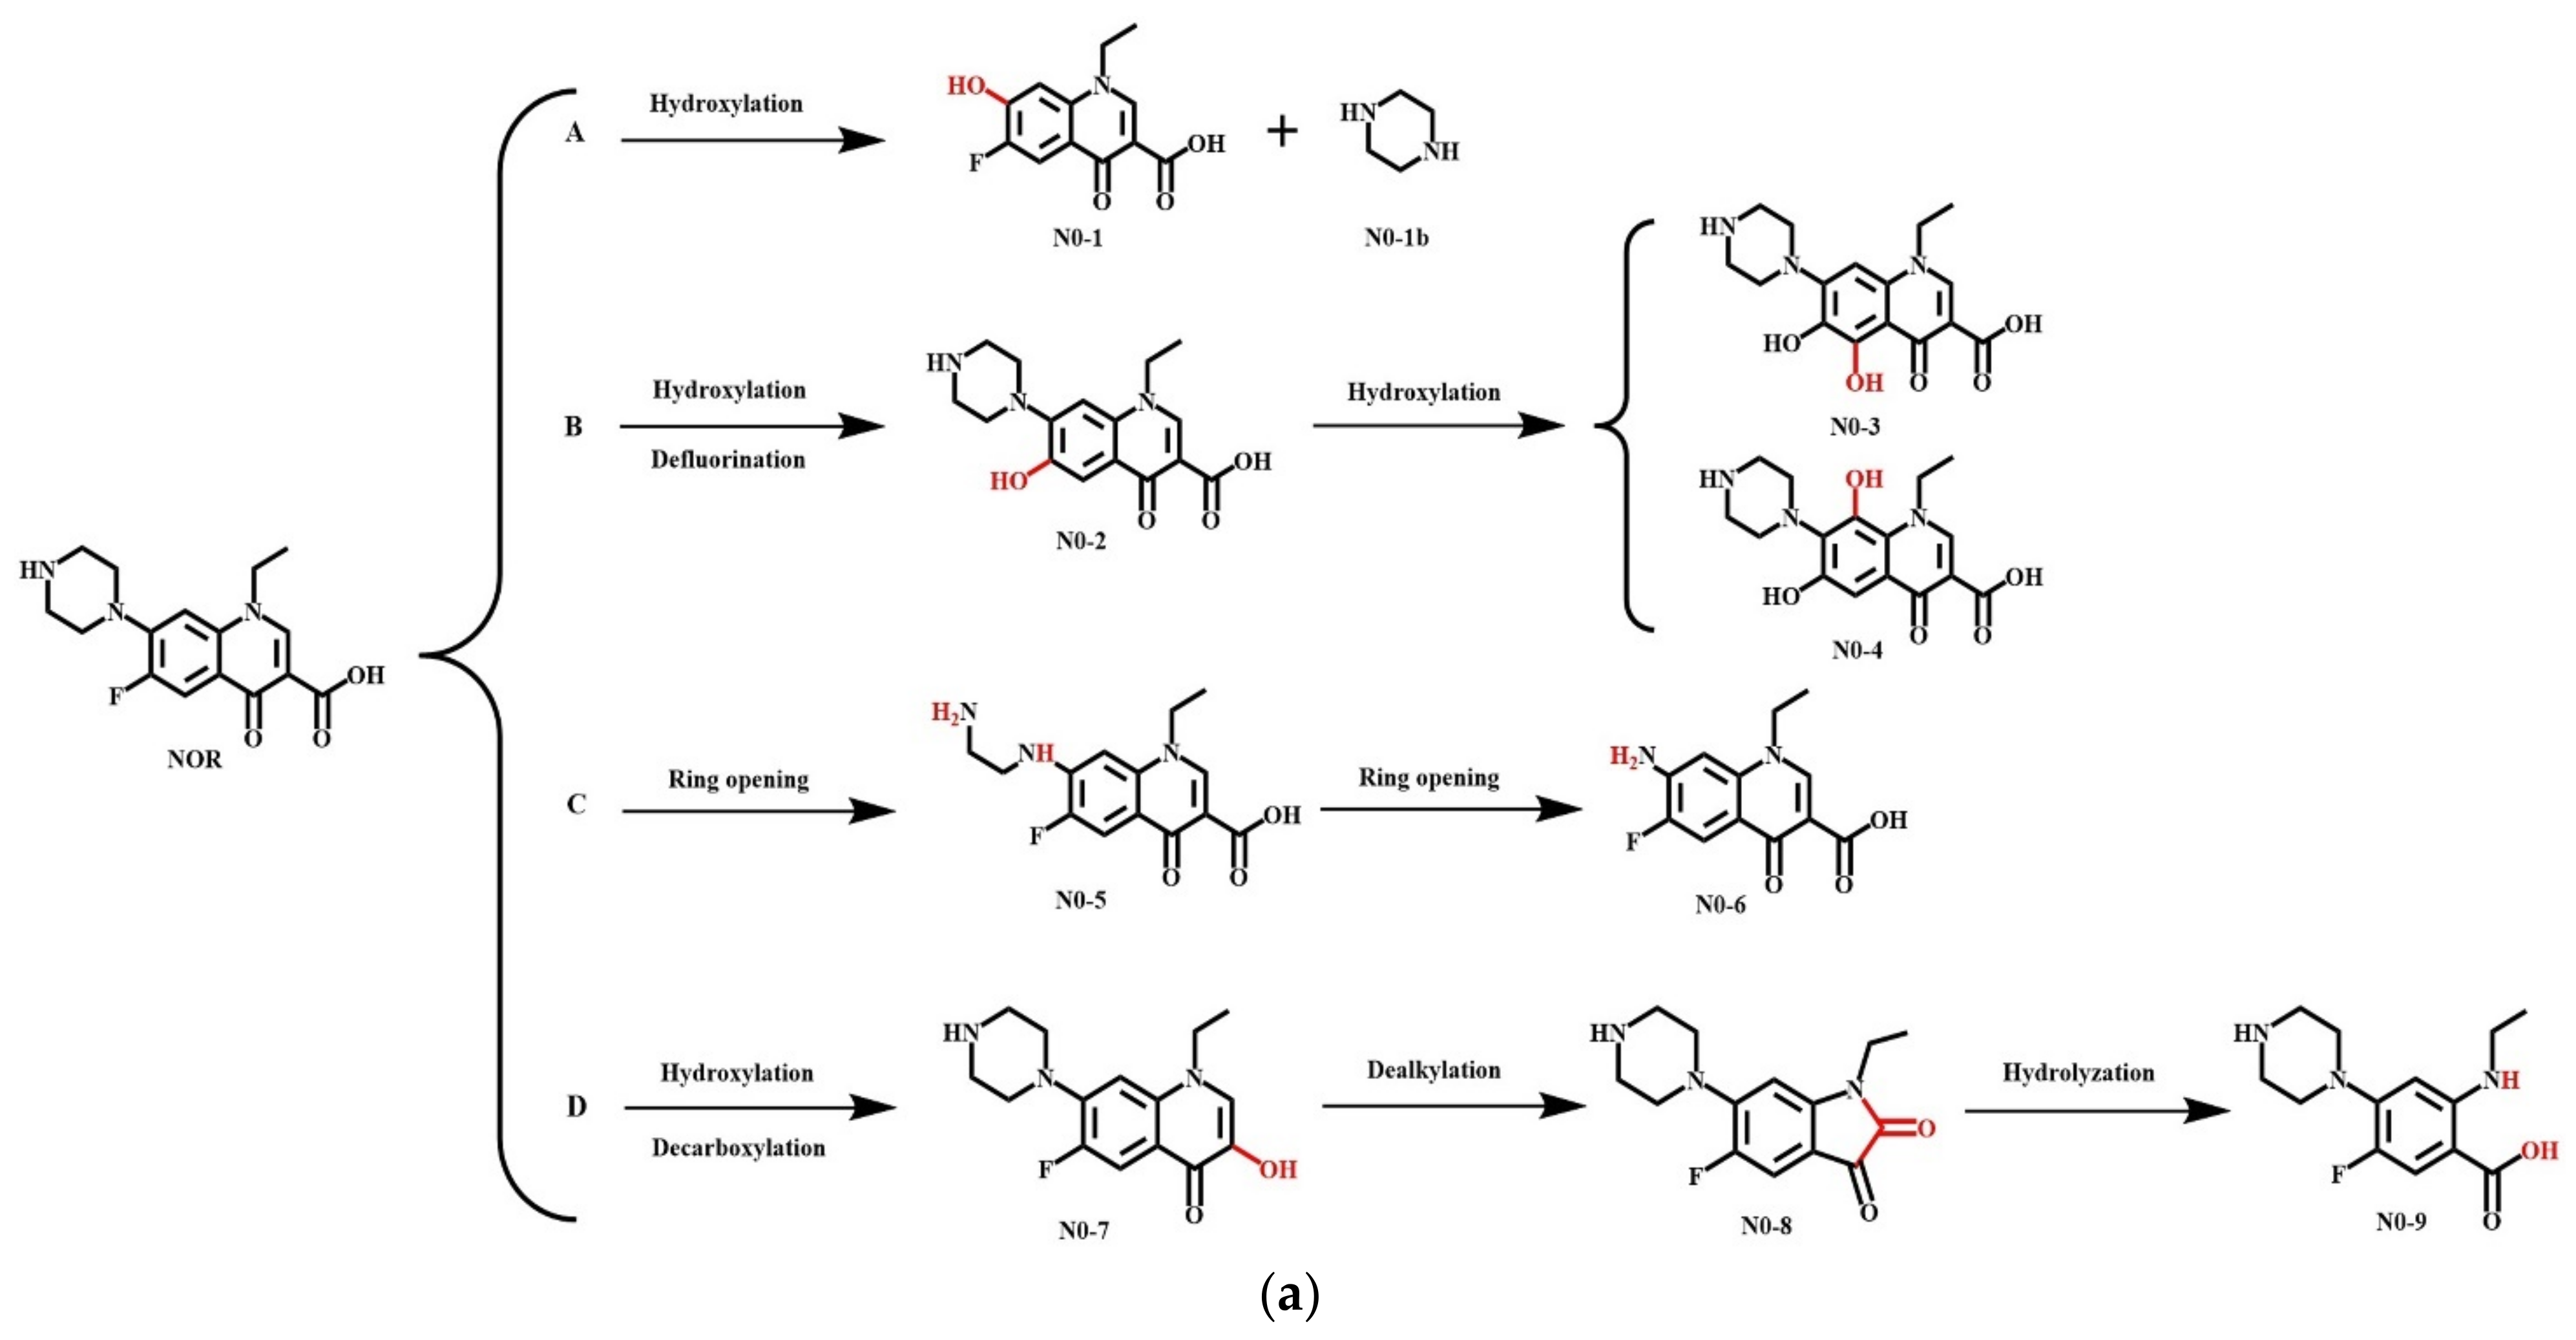
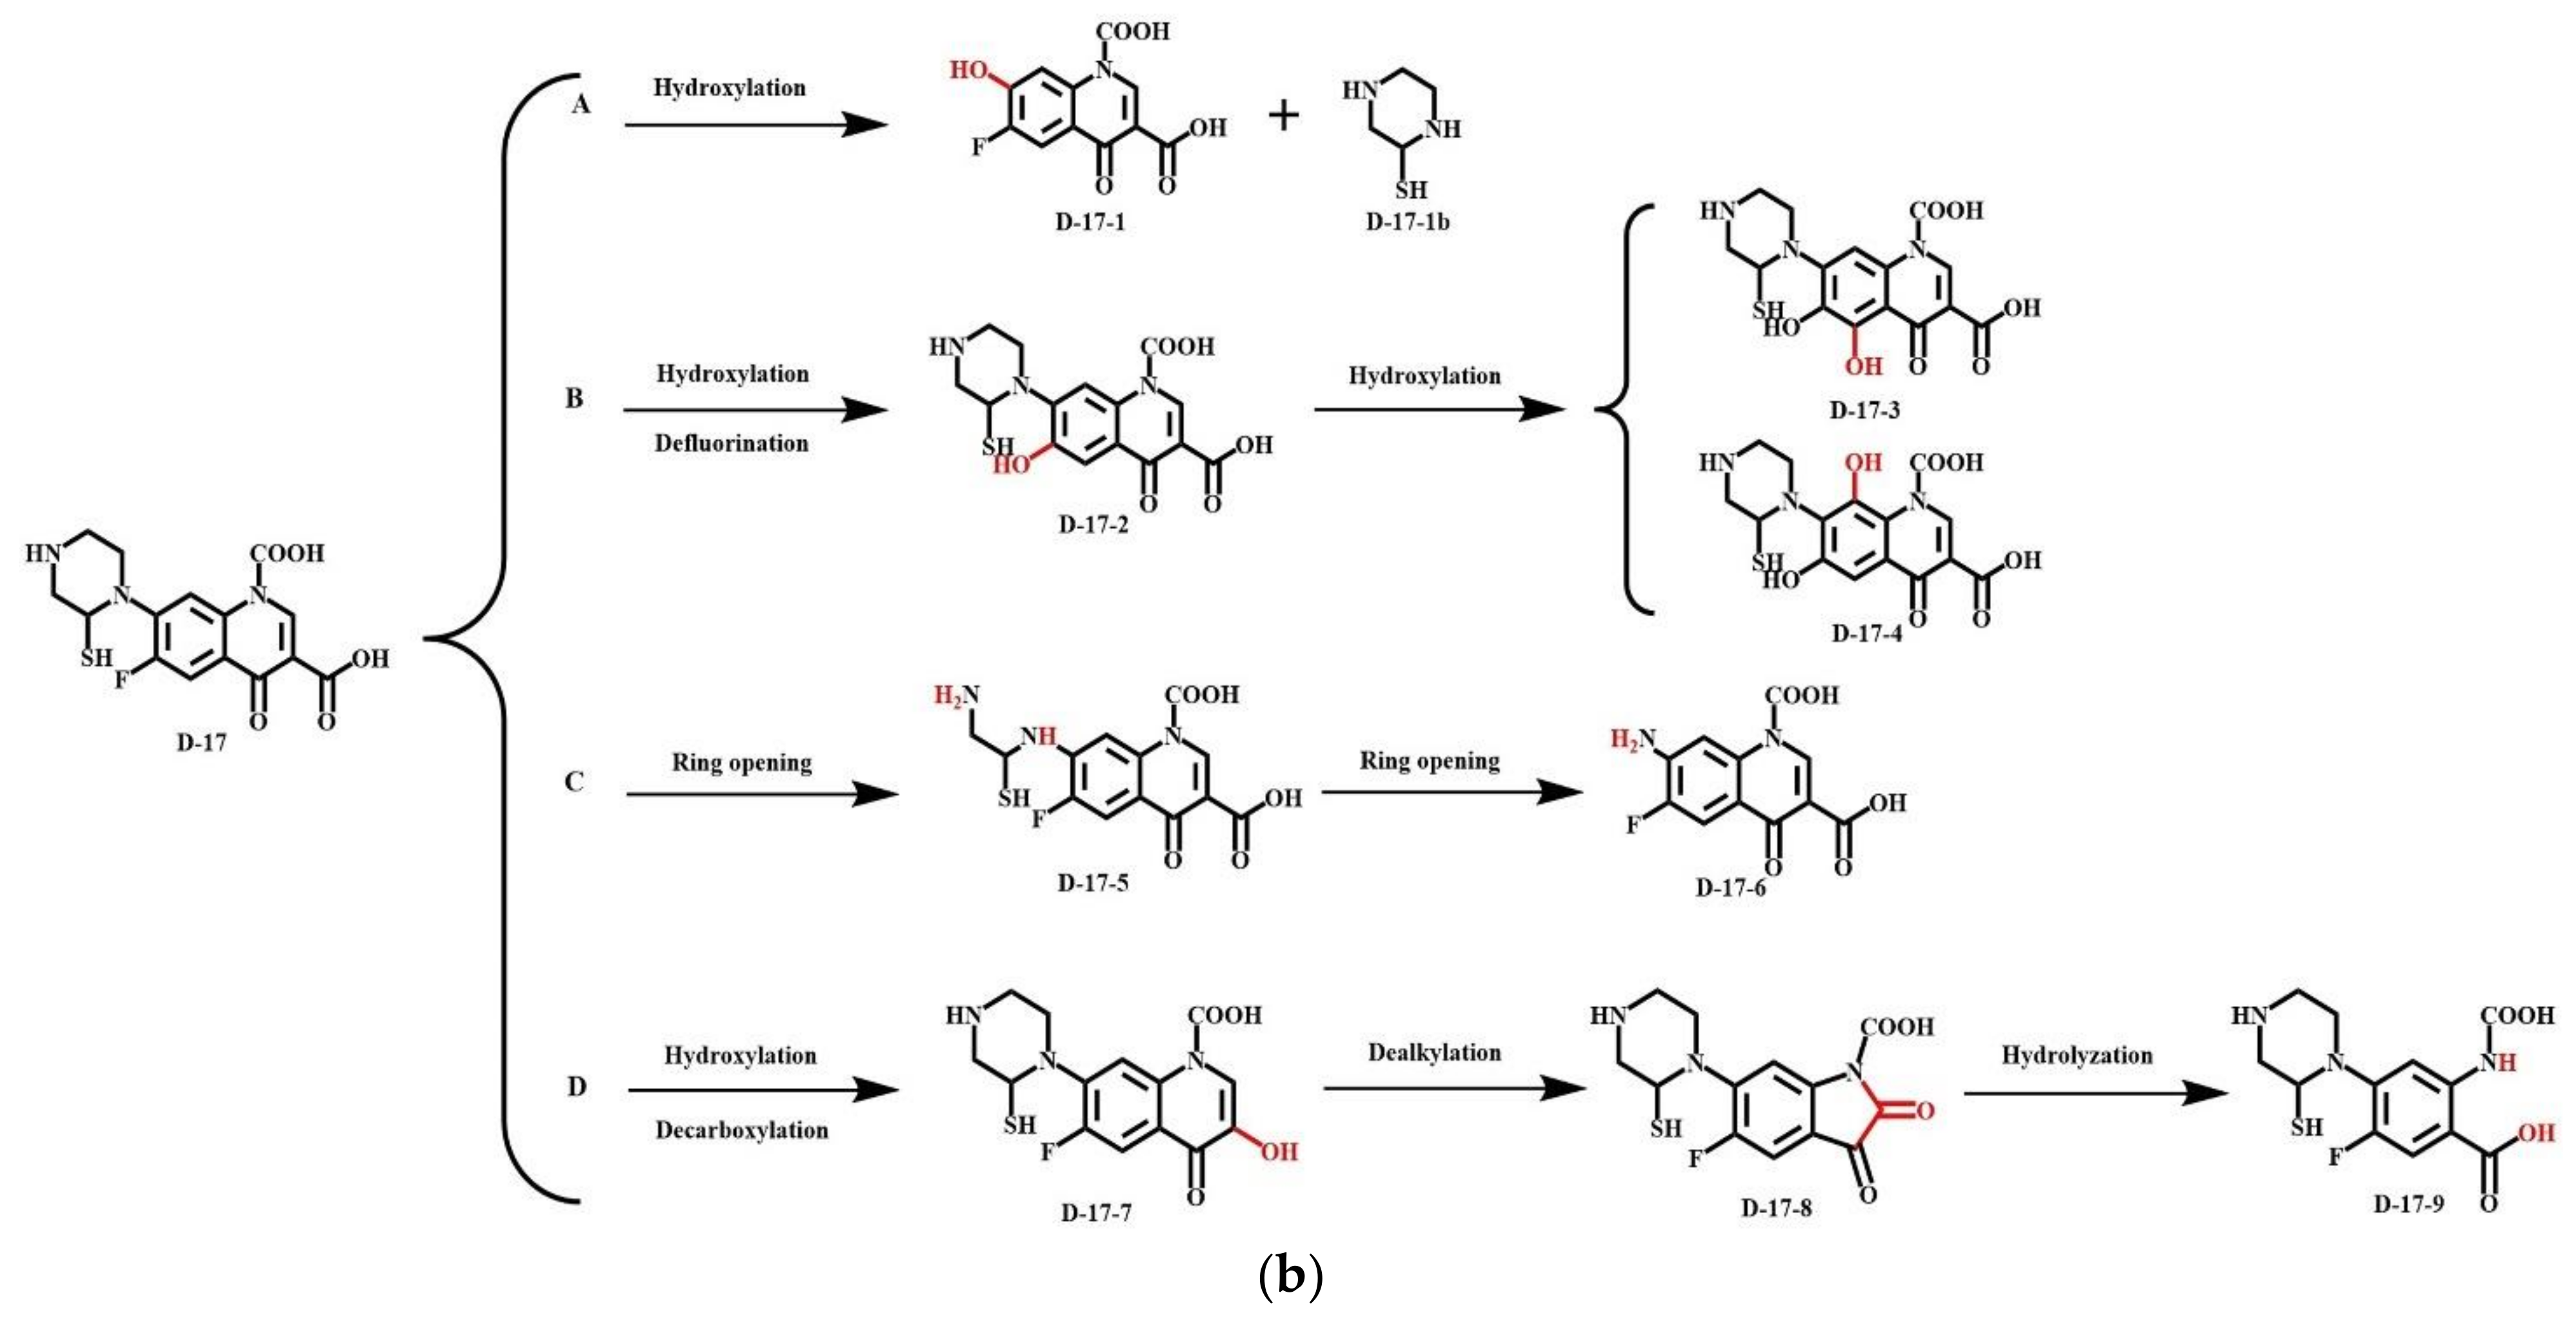
3.5.2. Simulation of the Microbial Degradation Pathways of NOR and Its Derivatives
3.6. Assessment of the Human Health Risk Raised by the Plant and Microbial Transformation Products of NOR and Its Derivatives
4. Conclusions
Author Contributions
Funding
Institutional Review Board Statement
Informed Consent Statement
Data Availability Statement
Acknowledgments
Conflicts of Interest
References
- He, X.T.; Deng, M.C.; Wang, Q.; Yang, Y.T.; Yang, Y.F.; Nie, X.P. Residues and health risk assessment of quinolones and sulfonamides in cultured fish from Pearl River Delta, China. Aquaculture 2016, 458, 38–46. [Google Scholar] [CrossRef]
- Xu, W.H.; Zhang, G.; Zou, S.C.; Li, X.; Liu, Y.C. Determination of selected antibiotics in the Victoria Harbour and the Pearl River, South China using high-performance liquid chromatography-electrospray ionization tandem mass spectrometry. Environ. Pollut. 2007, 145, 672–679. [Google Scholar] [CrossRef] [PubMed] [Green Version]
- Andreozzi, R.; Raffaele, M.; Nicklas, P. Pharmaceuticals in STP effluents and their solar photodegradation in aquatic environment. Chemosphere 2003, 50, 1319–1330. [Google Scholar] [CrossRef]
- Doorslaer, V.X.; Dewulf, J.; Langenhove, V.H.; Demeestere, K. Fluoroquinolone antibiotics: An emerging class of environmental micropollutants. Sci. Total Environ. 2014, 500–501, 250–269. [Google Scholar] [CrossRef]
- Xie, W.Y.; McGrath, P.S.; Su, J.Q.; Hirsch, R.P.; Clark, M.I.; Shen, Q.R.; Zhu, Y.G.; Zhao, F.J. Long-Term Impact of Field Applications of Sewage Sludge on Soil Antibiotic Resistome. Environ. Sci. Technol. 2016, 50, 12602–12611. [Google Scholar] [CrossRef] [PubMed]
- Donkor, S.E.; Newman, J.M.; Tay, C.K.S.; Dayie, T.K.D.N.; Bannerman, E.; Olu-Taiwo, M. Investigation into the risk of exposure to antibiotic residues contaminating meat and egg in Ghana. Food Control. 2011, 22, 869–873. [Google Scholar] [CrossRef]
- Al-Ahmad, A.; Daschner, F.D.; Kümmerer, K. Biodegradability of Cefotiam, Ciprofloxacin, Meropenem, Penicillin G, and Sulfamethoxazole and Inhibition of Waste Water Bacteria. Arch. Environ. Contam. Toxicol. 1999, 37, 158–163. [Google Scholar] [CrossRef] [PubMed]
- Li, B.; Zhang, T. Biodegradation and adsorption of antibiotics in the activated sludge process. Environ. Sci. Technol. 2010, 44, 3468–3473. [Google Scholar] [CrossRef]
- Zhou, L.J.; Ying, G.G.; Liu, S.; Zhao, J.L.; Yang, B.; Chen, Z.F.; Lai, H.J. Occurrence and fate of eleven classes of antibiotics in two typical wastewater treatment plants in South China. Sci. Total Environ. 2013, 452-453, 365–376. [Google Scholar] [CrossRef]
- Sevcan, A. Enhanced biodegradation of antibiotic combinations via the sequential treatment of the sludge resulting from pharmaceutical wastewater treatment using white-rot fungi Trametes versicolor and Bjerkandera adusta. Appl. Microbiol. Biotechnol. 2016, 100, 6491–6499. [Google Scholar]
- Bergheim, M.; Gminski, R.; Spangenberg, B.; Debiak, M.; Bürkle, A.; Mersch-Sundermann, V.; Kümmerer, K.; Gieré, R. Antibiotics and sweeteners in the aquatic environment: Biodegradability, formation of phototransformation products, and in vitro toxicity. Environ. Sci. Pollut. Res. Int. 2015, 22, 18017–18030. [Google Scholar] [CrossRef] [PubMed] [Green Version]
- Golet, M.E.; Xifra, I.; Siegrist, H.; Alder, C.A.; Giger, W. Environmental exposure assessment of fluoroquinolone antibacterial agents from sewage to soil. Environ. Sci. Technol. 2003, 37, 3243–3249. [Google Scholar] [CrossRef] [PubMed]
- Dorival-García, N.; Zafra-Gómez, A.; Navalón, A.; González-López, J.; Hontoria, E.; Vílchez, J.L. Removal and degradation characteristics of quinolone antibiotics in laboratory-scale activated sludge reactors under aerobic, nitrifying and anoxic conditions. J. Environ. Manag. 2013, 120, 75–83. [Google Scholar] [CrossRef]
- Alexy, R.; Kümpel, T.; Kümmerer, K. Assessment of degradation of 18 antibiotics in the Closed Bottle Test. Chemosphere 2004, 57, 505–512. [Google Scholar] [CrossRef] [PubMed]
- Senta, I.; Terzic, S.; Ahel, M. Occurrence and fate of dissolved and particulate antimicrobials in municipal wastewater treatment. Water Res. 2013, 47, 705–714. [Google Scholar] [CrossRef] [PubMed] [Green Version]
- Rodriguez-Mozaz, S.; Chamorro, S.; Marti, E.; Huerta, B.; Gros, M.; Sànchez-Melsió, A.; Borrego, M.C.; Barceló, D.; Balcázar, L.J. Occurrence of antibiotics and antibiotic resistance genes in hospital and urban wastewaters and their impact on the receiving river. Water Res. 2015, 69, 234–242. [Google Scholar] [CrossRef] [PubMed]
- Xiong, J.Q.; Kurade, B.M.; Patil, V.D.; Jang, M.; Paeng, K.J.; Jeon, B.H. Biodegradation and metabolic fate of levofloxacin via a freshwater green alga, Scenedesmus obliquus in synthetic saline wastewater. Algal Res. 2017, 25, 54–61. [Google Scholar] [CrossRef]
- Zhang, X.; Zhao, H.X.; Du, J.; Qu, Y.X.; Shen, C.; Tan, F.; Chen, J.W.; Quan, X. Occurrence, removal, and risk assessment of antibiotics in 12 wastewater treatment plants from Dalian, China. Environ. Sci. Pollut. Res. Int. 2017, 24, 16478–16487. [Google Scholar] [CrossRef] [PubMed]
- Tolls, J. Sorption of veterinary pharmaceuticals in soils: A review. Environ. Sci. Technol. 2001, 35, 3397–3406. [Google Scholar] [CrossRef] [PubMed]
- Boxall, B.A.A.; Johnson, P.; Smith, J.E.; Sinclair, J.C.; Stutt, E.; Levy, S.L. Uptake of veterinary medicines from soils into plants. J. Agric. Food Chem. 2006, 54, 2288–2297. [Google Scholar] [CrossRef] [PubMed]
- Chen, Y.; Rosazza, J.P.N.; Reese, C.P.; Chang, H.Y.; Nowakowski, M.A.; Kiplinger, J.P. Microbial models of soil metabolism: Biotransformations of danofloxacin. J. Ind. Microbiol. and Biotechnol. 1997, 19, 378–384. [Google Scholar] [CrossRef] [PubMed]
- Ma, B.; He, Y.; Chen, H.H.; Xu, J.M.; Rengel, Z. Dissipation of polycyclic aromatic hydrocarbons (PAHs) in the rhizosphere: Synthesis through meta-analysis. Environ. Pollut. 2010, 158, 855–861. [Google Scholar] [CrossRef] [PubMed]
- Riley, D.; Barber, S.A. Effect of Ammonium and Nitrate Fertilization on Phosphorus Uptake as Related to Root-Induced pH Changes at the Root-Soil Interface. Soil Sci. Soc. Am. J. 1971, 35, 301–306. [Google Scholar] [CrossRef]
- Gahoonia, T.S.; Claassen, N.; Jungk, A. Mobilization of phosphate in different soils by ryegrass supplied with ammonium or nitrate. Plant. Soil 1992, 140, 241–248. [Google Scholar] [CrossRef]
- Mackova, M.; Prouzova, P.; Stursa, P.; Ryslava, E.; Uhlik, O.; Beranova, K.; Rezek, J.; Kurzawova, V.; Demnerova, K.; Macek, T. Phyto/rhizoremediation studies using long-term PCB-contaminated soil. Environ. Sci. Pollut. Res. 2009, 16, 817–829. [Google Scholar] [CrossRef] [PubMed]
- Moritsuka, N.; Yanai, J.; Kosaki, T. Effect of plant growth on the distribution and forms of soil nutrients in the rhizosphere. Soil Sci. Plant. Nutr. 2012, 46, 439–447. [Google Scholar]
- Tsednee, M.; Mak, Y.W.; Chen, Y.R.; Yeh, K.C. A sensitive LC-ESI-Q-TOF-MS method reveals novel phytosiderophores and phytosiderophore-iron complexes in barley. N. Phytol. 2012, 195, 951–961. [Google Scholar] [CrossRef] [PubMed]
- Chekol, T.; Vough, R.L.; Chaney, L.R. Phytoremediation of polychlorinated biphenyl-contaminated soils: The rhizosphere effect. Environ. Int. 2004, 30, 799–804. [Google Scholar] [CrossRef] [PubMed]
- Gilbert, E.S.; Crowley, D.E. Repeated application of carvone-induced bacteria to enhance biodegradation of polychlorinated biphenyls in soil. Appl. Microbiol. Biotechnol. 1998, 50, 489–494. [Google Scholar] [CrossRef] [PubMed]
- Yi, H.; Crowley, E.D. Biostimulation of PAH Degradation with Plants Containing High Concentrations of Linoleic Acid. Environ. Sci. Technol. 2007, 41, 4382–4388. [Google Scholar] [CrossRef] [PubMed]
- Rasmussen, K.S. Molecular and physiological aspects of plant peroxidases. Plant. Mol. Biol. Rep. 1990, 8, 313–314. [Google Scholar] [CrossRef]
- Zhao, H.M.; Huang, H.B.; Du, H.; Lin, J.; Xiang, L.; Li, Y.W.; Cai, Q.Y.; Li, H.; Mo, C.H.; Liu, J.S.; et al. Intraspecific variability of ciprofloxacin accumulation, tolerance, and metabolism in Chinese flowering cabbage (Brassica parachinensis). J. Hazard. Mater. 2018, 349, 252–261. [Google Scholar] [CrossRef]
- Olga, K.; Oksana, G.; Radka, K.; Miroslav, F.; Roman, G. Antibiotics degradation in soil: A case of clindamycin, trimethoprim, sulfamethoxazole and their transformation products. Environ. Pollut. 2017, 220, 1251–1263. [Google Scholar]
- Marco-Urrea, E.; Pérez-Trujillo, M.; Vicent, T.; Caminal, G. Ability of white-rot fungi to remove selected pharmaceuticals and identification of degradation products of ibuprofen by Trametes versicolor. Chemosphere 2009, 74, 765–772. [Google Scholar] [CrossRef] [PubMed]
- Prieto, A.; Möder, M.; Rodil, R.; Adrian, L.; Marco-Urrea, E. Degradation of the antibiotics norfloxacin and ciprofloxacin by a white-rot fungus and identification of degradation products. Bioresour. Technol. 2011, 102, 10987–10995. [Google Scholar] [CrossRef] [PubMed]
- Asgher, M.; Bhatti, H.N.; Ashraf, M.; Legge, L.R. Recent developments in biodegradation of industrial pollutants by white rot fungi and their enzyme system. Biodegradation 2008, 19, 771–783. [Google Scholar] [CrossRef] [PubMed]
- Liu, H. Study on the Degradation of Sulfamerazine by Horseradish Peroxidase. Master’s Thesis, Shandong University, Jinan, China, 2019. [Google Scholar]
- Kurnik, K.; Treder, K.; Twarużek, M.; Grajewski, J.; Tretyn, A.; Tyburski, J. Potato Pulp as the Peroxidase Source for 2,4-Dichlorophenol Removal. Waste Biomass Valoriz. 2018, 9, 1061–1071. [Google Scholar] [CrossRef] [Green Version]
- Čvančarová, M.; Moeder, M.; Filipová, A.; Cajthaml, T. Biotransformation of fluoroquinolone antibiotics by ligninolytic fungi—Metabolites, enzymes and residual antibacterial activity. Chemosphere 2015, 136, 311–320. [Google Scholar] [CrossRef] [PubMed]
- Gao, Y.H.; Jia, L.H.; Wu, Z.J.; Sun, Z.J. Effect of albendazole on microstructure and ultrastructure during spermiogenesis in earthworms. Acta Sci. Circumst. 2012, 32, 2607–2611. [Google Scholar]
- Piotrowicz-Cieślak, I.A.; Adomas, B.; Nałęcz-Jawecki, G.; Michalczyk, J.D. Phytotoxicity of Sulfamethazine Soil Pollutant to Six Legume Plant Species. J. Toxicol. Environ. Health 2010, 73, 1220–1229. [Google Scholar] [CrossRef] [PubMed]
- D’Abrosca, B.; Fiorentino, A.; Izzo, A.; Cefarelli, G.; Pascarella, T.M.; Uzzo, P.; Monaco, P. Phytotoxicity evaluation of five pharmaceutical pollutants detected in surface water on germination and growth of cultivated and spontaneous plants. J. Environ. Sci. Health 2008, 43, 285–294. [Google Scholar] [CrossRef] [PubMed]
- Pruden, A.; Pei, R.T.; Heather, S.; Kenneth, H.C. Antibiotic resistance genes as emerging contaminants: Studies in northern Colorado. Environ. Sci. Technol. 2006, 40, 7445–7450. [Google Scholar] [CrossRef] [PubMed]
- Davison, J. Genetic Exchange between Bacteria in the Environment. Plasmid 1999, 42, 73–91. [Google Scholar] [CrossRef] [PubMed]
- Allen, K.H.; Donato, J.; Wang, H.H.; Cloud-Hansen, A.K.; Davies, J.; Handelsman, J. Call of the wild: Antibiotic resistance genes in natural environments. Nat. Rev. Microbiol. 2010, 8, 251–259. [Google Scholar] [CrossRef] [PubMed]
- Uddin, M.; Chen, J.W.; Qiao, X.L.; Tian, R.; Arafat, Y.; Yang, X.J. Bacterial community variations in paddy soils induced by application of veterinary antibiotics in plant-soil systems. Ecotoxicol. Environ. Saf. 2019, 167, 44–53. [Google Scholar] [CrossRef] [PubMed]
- Jin, C.X.; Chen, Q.Y.; Sun, R.L.; Zhou, Q.X.; Liu, J.J. Eco-toxic effects of sulfadiazine sodium, sulfamonomethoxine sodium and enrofloxacin on wheat, Chinese cabbage and tomato. Ecotoxicology 2009, 18, 878–885. [Google Scholar] [CrossRef] [PubMed]
- Azanu, D.; Styrishave, B.; Darko, G.; Weisser, J.J.; Abaidoo, C.R. Occurrence and risk assessment of antibiotics in water and lettuce in Ghana. Sci. Total. Environ. 2018, 622-623, 293–305. [Google Scholar] [CrossRef] [PubMed]
- Gill, H.J.; Hough, S.J.; Naisbitt, D.J.; Maggs, J.L.; Kitteringham, N.R.; Pirmohamed, M.; Park, B.K. The relationship between the disposition and immunogenicity of sulfamethoxazole in the rat. J. Pharmacol. Exp. Ther. 1997, 282, 795–801. [Google Scholar]
- Fu, Q.G.; Zhang, J.B.; Borchardt, D.; Schlenk, D.; Gan, J. Direct Conjugation of Emerging Contaminants in Arabidopsis: Indication for an Overlooked Risk in Plants? Environ. Sci. Technol. 2017, 51, 6071–6081. [Google Scholar] [CrossRef] [PubMed]
- Prosser, S.R.; Sibley, K.P. Corrigendum to: “Human health risk assessment of pharmaceuticals and personal care products in plant tissue due to biosolids and manure amendments, and wastewater irrigation” [Environ. Int. 2015, 75, 223–233]. Environ. Int. 2015, 84, 203–208. [Google Scholar] [CrossRef] [PubMed]
- Yana, R.; Jose, M.D.; Robert, L.; Joan, S.; Bi, C.X.; Charmi, B.; Chen, L.; Alexander, S.R.; Sebastian, B.; Stephen, K.B.; et al. RCSB Protein Data Bank: Architectural Advances Towards Integrated Searching and Efficient Access to Macromolecular Structure Data from the PDB Archive. J. Mol. Biol. 2021, 433, 166704. [Google Scholar]
- Østergaard, L.; Teilum, K.; Mirza, O.; Mattsson, O.; Petersen, M.; Welinder, G.K.; Mundy, J.; Gajhede, M.; Henriksen, A. Arabidopsis ATP A2 peroxidase. Expression and high-resolution structure of a plant peroxidase with implications for lignification. Plant. Mol. Biol. 2000, 44, 231–243. [Google Scholar] [CrossRef] [PubMed]
- Munirathinam, S.; Katsuyuki, K.; Michael, H.G.; Thomas, L.P. Preliminary Crystallographic Analysis of Manganese Peroxidase from Phanerochaete chrysosporium. Med. Chem. 1994, 238, 845–848. [Google Scholar]
- Blodig, W.; Smith, A.T.; Doyle, W.A.; Piontek, K. Crystal structures of pristine and oxidatively processed lignin peroxidase expressed in Escherichia coli and of the W171F variant that eliminates the redox active tryptophan 171. Implications for the reaction mechanism. J. Mol. Biol. 2001, 305, 851–861. [Google Scholar] [CrossRef]
- Piontek, K.; Antorini, M.; Choinowski, T. Crystal structure of a laccase from the fungus Trametes versicolor at 1.90-A resolution containing a full complement of coppers. J. Biol. Chem. 2002, 277, 37663–37669. [Google Scholar] [CrossRef] [Green Version]
- Krovat, E.M.; Steindl, T.; Langer., T. Recent Advances in Docking and Scoring. Curr. Comput.-Aided Drug Des. 2004, 1, 93–102. [Google Scholar] [CrossRef]
- Meng, X.Y.; Zhang, H.X.; Mezei, M.; Cui, M. Molecular Docking: A Powerful Approach for Structure-Based Drug Discovery. Curr. Comput.-Aided Drug Des. 2011, 7, 146–157. [Google Scholar] [CrossRef]
- Hou, Y.L.; Zhao, Y.Y.; Li, Y. Environmentally Friendly Fluoroquinolone Derivatives with Lower Plasma Protein Binding Rate Designed Using 3D-QSAR, Molecular Docking and Molecular Dynamics Simulation. Int. J. Environ. Res. Public Health 2020, 17, 6626. [Google Scholar] [CrossRef]
- Gu, W.W.; Li, Q.; Li, Y. Law and mechanism analysis of biodegradability of polychlorinated naphthalenes based on principal component analysis, QSAR models, molecular docking and molecular dynamics simulation. Chemosphere 2020, 243, 1–8. [Google Scholar] [CrossRef]
- Ogrizek, M.; Turk, S.; Lešnik, S.; Sosič, I.; Hodošček, M.; Mirković, B.; Kos, J.; Janežič, D.; Gobec, S.; Konc, J. Molecular dynamics to enhance structure-based virtual screening on cathepsin B. J. Comput.-Aided Mol. Des. 2015, 29, 707–712. [Google Scholar] [CrossRef]
- Childers, M.C.; Daggett, V. Insights from molecular dynamics simulations for computational protein design. Mol. Syst. Des. Eng. 2017, 2, 9–33. [Google Scholar] [CrossRef] [PubMed] [Green Version]
- Bessonov, K.; Vassall, K.A.; Harauz, G. Parameterization of the proline analogue Aze (azetidine-2-carboxylic acid) for molecular dynamics simulations and evaluation of its effect on homo-pentapeptide conformations. J. Mol. Graphics Modell. 2013, 39, 118–125. [Google Scholar] [CrossRef] [PubMed]
- Joo, J.C.; Pack, S.P.; Kim, Y.H.; Yoo, Y.J. Thermostabilization of Bacillus circulans xylanase: Computational optimization of unstable residues based on thermal fluctuation analysis. J. Biotechnol. 2011, 151, 56–65. [Google Scholar] [CrossRef]
- Wang, C.H.; Nguyen, H.P.; Pham, K.; Huynh, D.; Le, N.T.B.; Wang, H.L.; Ren, P.Y.; Luo, R. Calculating protein-ligand binding affinities with MMPBSA: Method and error analysis. J. Comput. Chem. 2016, 37, 2436–2446. [Google Scholar] [CrossRef] [Green Version]
- Wang, P.Z. Fuzzy Set Theory and its Application; Shanghai Scientific & Technical Publishers: Shanghai, China, 1983; pp. 33–76. [Google Scholar]
- Jiang, J.S.; Wu, Y.; Chen, F.; Qian, K. Application of analytic hierarchy process and fuzzy comprehensive evaluation method in graduate students’ academic evaluation. J. Shangqiu Norm. Univ. 2020, 36, 12–17. [Google Scholar]
- Gu, W.W.; Zhao, Y.Y.; Li, Q.; Li, Y. Environmentally friendly polychlorinated naphthalenes (PCNs) derivatives designed using 3D-QSAR and screened using molecular docking, density functional theory and health-based risk assessment. J. Hazard. Mater. 2019, 363, 316–327. [Google Scholar] [CrossRef]
- Sree, G.V.; Bathula, C.; Youi, H.K.; Kim, H.S.; Inn, S.J.; Im, H. Photophysical and DFT investigation of imidazole-based hole transporting materials for phosphorescent OLEDs with high current efficiency. J. Mol. Liq. 2021, 338, 116708. [Google Scholar] [CrossRef]
- Furer, V.L.; Vandyukov, A.E.; Kleshnina, S.R.; Solovieva, S.E.; Antipin, I.S.; Kovalenko, V.I. DFT study of conformation, hydrogen bonds, IR, and Raman spectra of the sodium salt of p-hexasulfonatocalix[6]arene DFT. J. Mol. Struct. 2021, 1243, 130892. [Google Scholar] [CrossRef]
- Zhao, X.H.; Zhao, Y.Y.; Ren, Z.X.; Li, Y. Combined QSAR/QSPR and molecular docking study on fluoroquinolones to reduce biological enrichment. Comput. Biol. Chem. 2019, 79, 177–184. [Google Scholar] [CrossRef]
- Xiao, T.; Wei, X.Y.; Gao, X.X.; Gu, Q.; Wang, L.; Fang, H.; Gu, L.Q.; Qi, H.; Yi, Y.Q. The pharmacokinetics of gigantol and syringic acid. Northwest. Pharm. J. 2011, 26, 211–213. [Google Scholar]
- Zhao, X.H.; Wang, X.L.; Li, Y. Combined HQSAR method and molecular docking study on genotoxicity mechanism of quinolones with higher genotoxicity. Environ. Sci. Pollut. Res. 2019, 26, 34830–34853. [Google Scholar] [CrossRef]
- Tian, R. Uptake and Metabolism of Four Typical Antibiotics in Leafy Vegetables. Master’s Thesis, Dalian University of Technology, Dalian, China, 2019. [Google Scholar]
- Wetzstein, H.G.; Schmeer, N.; Karl, W. Degradation of the fluoroquinolone enrofloxacin by the brown rot fungus Gloeophyllum striatum: Identification of metabolites. Appl. Environ. Microbiol. 1998, 64, 4272–4281. [Google Scholar] [CrossRef] [Green Version]
- Salahinejad, M.; Ghasemi, J.B. 3D-QSAR studies on the toxicity of substituted benzenes to Tetrahymena pyriformis: CoMFA, CoMSIA and VolSurf approaches. Ecotoxicol. Environ. Saf. 2014, 105, 128–134. [Google Scholar] [CrossRef]
- Liu, S.C.; Sun, S.J.; Cui, P.; Ding, Y.F. Molecular Modification of Fluoroquinolone-Biodegrading Enzymes Based on Molecular Docking and Homology Modelling. Int. J. Environ. Res. Public Health 2019, 16, 3407. [Google Scholar] [CrossRef] [Green Version]
- Gao, Y.T. Quantitative structure-activity relationships studying the toxicity of metal and metal oxide nanoparticles and amphetamines. Master’s Thesis, Qingdao University, Qingdao, China, 2020. [Google Scholar]
- Nath, A.; Kumer, A.; Zaben, F.; Khan, M.W. Investigating the binding affinity, molecular dynamics, and ADMET properties of 2,3-dihydrobenzofuran derivatives as an inhibitor of fungi, bacteria, and virus protein. Beni-Suef Univ. J. Basic Appl. Sci. 2021, 10, 1–13. [Google Scholar] [CrossRef]
- Kuthyala, S.; Hanumanthappa, M.; Kumar, S.M.; Sheik, S.; Karikannar, N.G.; Prabhu, A. Crystal, Hirshfeld, ADMET, drug-like and anticancer study of some newly synthesized imidazopyridine containing pyrazoline derivatives. J. Mol. Struct. 2019, 1197, 65–72. [Google Scholar] [CrossRef]
- Liu, Y. The research on the application of three kinds of QSAR softwares in the ecological classification of chemicals management. Master’s Thesis, East China University of Science and Technology, Shanghai, China, 2012. [Google Scholar]
- Qu, R.J.; Liu, H.X.; Feng, M.B.; Yang, X.; Wang, Z.Y. Investigation on Intramolecular Hydrogen Bond and Some Thermodynamic Properties of Polyhydroxylated Anthraquinones. J. Chem. Eng. Data 2012, 57, 2442–2455. [Google Scholar] [CrossRef]
- Yang, L.Z.; Liu, M. 3D-QSAR Model of Polybrominated Biphenyls Tri-effect Modified by Standard Deviation Standardization Method and Its Application in Environmental-Friendly Molecular Modification. Chem. J. Chin. Univ. 2019, 40, 2471–2479. [Google Scholar]
- Veerasamy, R.; Rajak, H.; Jain, A.; Sivadasan, S.; Varghese, P.C.; Agrawal, K.R. Validation of QSAR models—Strategies and importance. Int. J. Drug Des. Discov. 2011, 2, 511–519. [Google Scholar]
- Wang, X.L.; Gu, W.W.; Guo, E.M.; Cui, C.Y.; Li, Y. Assessment of long-range transport potential of polychlorinated Naphthalenes based on three-dimensional QSAR models. Environ. Sci. Pollut. Res. 2017, 24, 14802–14818. [Google Scholar] [CrossRef] [PubMed]
- Gu, W.W.; Chen, Y.; Li, Y. Attenuation of the Atmospheric Migration Ability of Polychlorinated Naphthalenes (PCN-2) Based on Three-dimensional QSAR Models with Full Factor Experimental Design. Bull. Environ. Contam. and Toxicol. 2017, 99, 276–280. [Google Scholar] [CrossRef] [PubMed]
- Yang, L.Z.; Liu, M. A double-activity (green algae toxicity and bacterial genotoxicity) 3D-QSAR model based on the comprehensive index method and its application in fluoroquinolones’ modification. Int. J. Environ. Res. Public Health 2020, 17, 942. [Google Scholar] [CrossRef] [PubMed] [Green Version]
- Kasperkiewicz, A.; Pawliszyn, J. Multiresidue pesticide quantitation in multiple fruit matrices via automated coated blade spray and liquid chromatography coupled to triple quadrupole mass spectrometry. Food Chem. 2020, 339, 127815. [Google Scholar] [CrossRef] [PubMed]
- Gu, W.W.; Chen, Y.; Zhang, L.; Li, Y. Prediction of octanol-water partition coefficient for polychlorinated naphthalenes through three-dimensional QSAR models. Hum. Ecol. Risk Assess. 2016, 23, 40–55. [Google Scholar] [CrossRef]
- Jazaeri, S.; Bock, E.J.; Bagagli, P.M.; Iametti, S.; Bonomi, F.; Seetharaman, K. Structural modifications of gluten proteins in strong and weak wheat dough during mixing. Cereal Chem. 2015, 92, 105–113. [Google Scholar] [CrossRef]
- Hu, Y.M.; Wang, L.J.; Li, Z.G. Modification of protein structure and dough rheological properties of wheat flour through superheated steam treatment. J. Cereal Sci. 2017, 76, 222–228. [Google Scholar] [CrossRef]
- Carrasquillo, J.A.; Bruland, L.G.; MacKay, A.A.; Vasudevan, D. Sorption of ciprofloxacin and oxytetracycline zwitterions to soils and soil minerals: Influence of compound structure. Environ. Sci. Technol. 2008, 42, 7634–7642. [Google Scholar] [CrossRef] [PubMed]
- Huijbers, M.C.P.; Flach, C.F.; Larsson, D.G.J. A conceptual framework for the environmental surveillance of antibiotics and antibiotic resistance. Environ. Int. 2019, 130, 104880. [Google Scholar] [CrossRef] [PubMed]
- Sun, H.Y.; Shi, X.; Mao, J.D.; Zhu, D.Q. Tetracycline sorption to coal and soil humic acids: An examination of humic structural heterogeneity. Environ. Toxicol. Chem. 2010, 29, 1934–1942. [Google Scholar] [CrossRef] [PubMed]
- Heuer, H.; Smalla, K. Manure and sulfadiazine synergistically increased bacterial antibiotic resistance in soil over at least two months. Environ. Microbiol. 2007, 9, 657–666. [Google Scholar] [CrossRef]
- Fang, H.; Han, L.X.; Zhang, H.P.; Deng, Y.F.; Ge, Q.Q.; Mei, J.J.; Long, Z.N.; Yu, Y.L. Repeated treatments of ciprofloxacin and kresoxim-methyl alter their dissipation rates, biological function and increase antibiotic resistance in manured soil. Sci. Total. Environ. 2018, 628–629, 661–671. [Google Scholar] [CrossRef]
- Chung, H.S.; Lee, Y.J.; Rahman, M.M.; Abd El-Aty, A.M.; Lee, H.S.; Kabir, M.H.; Kim, S.W.; Park, B.J.; Kim, J.E.; Hacımüftüoğlu, F.; et al. Uptake of the veterinary antibiotics chlortetracycline, enrofloxacin, and sulphathiazole from soil by radish. Sci. Total Environ. 2017, 605-606, 322–331. [Google Scholar] [CrossRef] [PubMed]
- Migliore, L.; Cozzolino, S.; Fiori, M. Phytotoxicity to and uptake of enrofloxacin in crop plants. Chemosphere 2003, 52, 1233–1244. [Google Scholar] [CrossRef]
- Žižek, S.; Zidar, P. Toxicity of the ionophore antibiotic lasalocid to soil-dwelling invertebrates: Avoidance tests in comparison to classic sublethal tests. Chemosphere 2013, 92, 570–575. [Google Scholar] [CrossRef] [PubMed]
- Zhu, D.; An, X.L.; Chen, Q.L.; Yang, X.R.; Christie, P.; Ke, X.; Wu, L.H.; Zhu, Y.G. Antibiotics Disturb the Microbiome and Increase the Incidence of Resistance Genes in the Gut of a Common Soil Collembolan. Environ. Sci. Technol. 2018, 52, 3081–3090. [Google Scholar] [CrossRef] [PubMed]
- Pan, M.; Chu, L.M. Adsorption and degradation of five selected antibiotics in agricultural soil. Sci. Total. Environ. 2016, 545–546, 48–56. [Google Scholar] [CrossRef]
- Schafhauser, B.H.; Kristofco, A.L.; de Oliveira, C.M.R.; Brooks, W.B. Global review and analysis of erythromycin in the environment: Occurrence, bioaccumulation and antibiotic resistance hazards. Environ. Pollut. 2018, 238, 440–451. [Google Scholar] [CrossRef] [PubMed]
- Michelini, L.; Reichel, R.; Werner, W.; Ghisi, R.; Thiele-Bruhn, S. Sulfadiazine Uptake and Effects on Salix fragilis L. and Zea mays L. Plants. Water Air Soil Pollut. 2012, 223, 5243–5257. [Google Scholar] [CrossRef]
- Han, Y.; Zhou, W.S.; Tang, Y.; Shi, W.; Shao, Y.Q.; Ren, P.; Zhang, J.M.; Xiao, G.Q.; Sun, H.X.; Liu, G.X. Microplastics aggravate the bioaccumulation of three veterinary antibiotics in the thick shell mussel Mytilus coruscus and induce synergistic immunotoxic effects. Sci. Total Environ. 2021, 770, 145273. [Google Scholar] [CrossRef] [PubMed]
- Li, X.X.; Zhang, B.Y.; Huang, W.; Cantwell, C.; Chen, B. Integration of Fuzzy Matter-Element Method and 3D-QSAR Model for Generation of Environmentally Friendly Quinolone Derivatives. Int. J. Environ. Res. Public Health 2020, 17, 3239. [Google Scholar] [CrossRef] [PubMed]
- Zhang, W.H.; Gu, W.W.; Sun, R.H.; Zhou, M.Y.; Han, Z.Z.; Li, Y. An adjusted 3D-QSAR model for the combined activity of fluoroquinolones photodegradation and microbial degradation assisted by dynamic simulation and its application in molecular modification. Ecotoxicol. Environ. Saf. 2021, 212, 111973. [Google Scholar] [CrossRef] [PubMed]
- Zhang, W.H.; Sun, R.H.; Zhao, X.H.; Li, Y. Environmental Conversion Path Inference of New Designed Fluoroquinolones and Their Potential Environmental Risk. Arch. Environ. Contam. Toxicol. 2020, 78, 310–328. [Google Scholar] [CrossRef]
- Qiu, Y.L.; Jiang, L.; Li, Y. Theoretical support for the enhancement of infrared spectrum signals by derivatization of phthalic acid esters using a pharmacophore model. Spectrosc. Lett. 2018, 51, 155–162. [Google Scholar]
- Brzozowski, A.M.; Pike, A.C.; Dauter, Z.; Hubbard, R.E.; Bonn, T.; Engström, O.; Ohman, L.; Greene, G.L.; Gustafsson, J.A.; Carlquist, M. Molecular basis of agonism and antagonism in the oestrogen receptor. Nature 1997, 389, 753–758. [Google Scholar] [CrossRef] [PubMed]
- Sarra, M.; Khedidja, B.; Mohamed, Y. Identification of 3-methoxycarpachromene and masticadienonic acid as new target inhibitors against trypanothione reductase from leishmania infantum using molecular docking and ADMET prediction. Molecules 2021, 26, 3335. [Google Scholar]
- Sandermann, H. Plant-metabolism of xenobiotics. Trends Biochem. Sci. 1992, 17, 82–84. [Google Scholar] [CrossRef]
- Farkas, M.H.; Berry, J.O.; Aga, D.S. Chlortetracycline detoxification in maize via induction of glutathione S-transferases after antibiotic exposure. Environ. Sci. Technol. 2007, 41, 1450–1456. [Google Scholar] [CrossRef] [PubMed]
- Goldstein, M.; Shenker, M.; Chefetz, B. Insights into the uptake processes of wastewater-borne pharmaceuticals by vegetables. Environ. Sci. Technol. 2014, 48, 5593–5600. [Google Scholar] [CrossRef] [PubMed]
- Malchi, T.; Maor, Y.; Tadmor, G.; Shenker, M.; Chefetz, B. Irrigation of root vegetables with treated wastewater: Evaluating uptake of pharmaceuticals and the associated human health risks. Environ. Sci. Technol. 2014, 48, 9325–9333. [Google Scholar] [CrossRef] [PubMed]
- Miller, E.L.; Nason, S.L.; Karthikeyan, K.G.; Pedersen, J.A. Root uptake of pharmaceuticals and personal care product ingredients. Environ. Sci. Technol. 2016, 50, 525–541. [Google Scholar] [CrossRef]
- Pan, M.; Chu, L.M. Fate of antibiotics in soil and their uptake by edible crops. Sci. Total Environ. 2017, 599-600, 500–512. [Google Scholar] [CrossRef]
- Boatman, R.; Kelsey, J.; Ball, N. Acute toxicity classification for ethylene glycol mono-n-butyl ether under the Globally Harmonized System. Regul. Toxicol. Pharmacol. 2014, 68, 41–50. [Google Scholar] [CrossRef] [PubMed] [Green Version]
- Huang, J.J.; Hu, H.Y.; Tang, F.; Li, Y.; Lu, S.Q.; Lu, Y. Inactivation and reactivation of antibiotic-resistant bacteria by chlorination in secondary effluents of a municipal wastewater treatment plant. Water Res. 2011, 45, 2775–2781. [Google Scholar] [CrossRef] [PubMed]
- Xia, X.Q.; Huang, C.H.; Xi, B.D.; Tan, W.B.; Tang, Z.R. Review on biotransformation and mechanism of fluoroquinolone antibiotics from livestock manure. J. Agro-Environ. Sci. 2019, 38, 257–267. [Google Scholar]
- Jia, Y.; Khanal, S.K.; Shu, H.; Zhang, H.Q.; Chen, G.H.; Lu, H. Ciprofloxacin degradation in anaerobic sulfate-reducing bacteria (SRB) sludge system: Mechanism and pathways. Water Res. 2018, 136, 64–74. [Google Scholar] [CrossRef] [PubMed]
- Sun, Y.H. Research on the Oxidation Mechanisms of Typical Organic Pollutants in the Atmosphere. Ph.D. Thesis, Shandong University, Jinan, China, 2015. [Google Scholar]


| No. | Compounds | Abbreviations | Synergistic Value (B, kcal/mol) | ||||
|---|---|---|---|---|---|---|---|
| 1PA2 | 1MNP | 1GYC | 1B85 | ||||
| 1 | Difloxacin | DIF | 25.182 | −132.832 | −134.927 | −154.835 | −38.709 |
| 2 | Enrofloxacin | ENR | −99.515 | −113.013 | −129.396 | −150.755 | −37.689 |
| 3 | Norfloxacin | NOR | −54.030 | −34.061 | −78.238 | −136.532 | −34.133 |
| 4 | Lomefloxacin | LOM | −86.227 | −75.699 | −137.530 | −156.759 | −39.190 |
| 5 | Levofloxacin | LEV | −102.767 | −108.691 | −131.059 | −88.252 | −32.765 |
| 6 | Pefloxacin | PEF | −113.216 | −76.226 | −122.837 | −141.439 | −35.360 |
| 7 | Fleroxacin | FLE | −57.882 | −118.085 | −144.362 | −148.723 | −37.181 |
| 8 | Ciprofloxacin | CIP | −74.823 | −84.186 | −126.139 | −82.975 | −31.535 |
| 9 | Balofloxacin | BAL | −111.963 | −113.730 | −86.164 | −137.961 | −34.490 |
| 10 | Marbofloxacin | MAR | −129.744 | −81.674 | −143.075 | −135.558 | −35.769 |
| 11 | Pipemidic acid | PIP | −75.560 | 8.497 | −116.738 | −101.248 | −29.185 |
| 12 | Cinoxacin | CIN | −76.538 | −108.556 | −96.815 | −86.754 | −27.139 |
| 13 | Enoxacin | ENO | −45.854 | −38.068 | −88.957 | −114.112 | −28.528 |
| 14 | Danofloxacin | DAN | −83.938 | −117.966 | −115.184 | −167.616 | −41.904 |
| 15 | Gatifloxacin | GAT | −68.580 | −178.118 | −111.547 | −170.889 | −44.530 |
| 16 | Ofloxacin | OFL | −84.910 | −107.253 | −84.247 | −51.343 | −26.813 |
| 17 | Rufloxacin | RUF | −136.757 | −144.343 | −121.198 | −122.849 | −36.086 |
| 18 | Pazufloxacin | PAZ | −82.190 | −11.624 | −112.995 | −103.151 | −28.249 |
| 19 | Nadifloxacin | NAD | −109.028 | −80.519 | −121.006 | −116.732 | −30.252 |
| 20 | Moxifloxacin | MOX | −112.860 | −192.333 | −95.345 | −170.045 | −48.083 |
| 21 | Sparfloxacin | SPA | −95.365 | −102.209 | −123.286 | −132.893 | −33.223 |
| 22 | Sarafloxacin | SAR | −98.545 | −125.849 | −131.262 | −124.028 | −32.816 |
| 23 | Amifloxacin | AMI | −120.565 | −120.368 | −148.711 | −129.569 | −37.178 |
| 24 | Besifloxacin | BES | −121.613 | −77.347 | −122.906 | −187.176 | −46.794 |
| 25 | Clinafloxacin | CLI | −97.981 | −95.433 | −121.897 | −131.993 | −32.998 |
| 26 | Grepafloxacin | GRE | −126.186 | −109.368 | −98.129 | −168.713 | −42.178 |
| 27 | Orbifloxacin | ORB | −96.297 | −97.955 | −136.773 | −161.230 | −40.308 |
| 28 | Sitafloxacin | SIT | −85.799 | −138.752 | −129.410 | −183.378 | −45.845 |
| 29 | Temafloxacin | TEM | −118.200 | −57.170 | −128.660 | −206.845 | −51.711 |
| CoMSIA | q2 | n | R2 | (R2 − q2)/R2 | SEE | F | Q2 | cSDEP | dq2/dr2yy | r2pred | |
|---|---|---|---|---|---|---|---|---|---|---|---|
| For plant–microbial | 4 enzymes | 0.707 | 10 | 1.000 | 29% | 0.223 | 1816.658 | 0.571 | 8.009 | 1.664 | 0.764 |
| For plant | 1PA2 | 0.833 | 6 | 0.995 | 16% | 0.640 | 230.436 | 0.705 | 5.050 | 1.599 | 0.854 |
| For microbial | 1MNP | 0.695 | 6 | 0.997 | 30% | 0.862 | 507.790 | 0.503 | 10.529 | 1.529 | 0.921 |
| 1B85 | 0.707 | 10 | 0.999 | 29% | 0.396 | 974.934 | 0.459 | 10.154 | 1.385 | 0.870 | |
| 1GYC | 0.743 | 5 | 0.990 | 25% | 0.558 | 198.713 | 0.501 | 3.907 | 2.116 | 0.678 | |
| No. | Compounds | Substitution Sites and Groups |
|---|---|---|
| 3 | NOR | |
| D-1 | Derivative-1 | 13-Sulfydryl |
| D-2 | Derivative-2 | 13-Chlorine |
| D-3 | Derivative-3 | 13-Fluorine |
| D-4 | Derivative-4 | 1- Bromine |
| D-5 | Derivative-5 | 2- Fluorine |
| D-6 | Derivative-6 | 2- Methyl |
| D-7 | Derivative-7 | 2-Amidogen |
| D-8 | Derivative-8 | 2-Sulfydryl |
| D-9 | Derivative-9 | 2-Carboxyl |
| D-10 | Derivative-10 | 2-Trifluoromethyl |
| D-11 | Derivative-11 | 2-Fluoromethane |
| D-12 | Derivative-12 | 13-Sulfydryl, 1-Bromine |
| D-13 | Derivative-13 | 13-Sulfydryl, 2-Fluorine |
| D-14 | Derivative-14 | 13-Sulfydryl, 2-Methyl |
| D-15 | Derivative-15 | 13-Sulfydryl, 2-Amidogen |
| D-16 | Derivative-16 | 13-Sulfydryl, 2-Sulfydryl |
| D-17 | Derivative-17 | 13-Sulfydryl, 2-Carboxyl |
| D-18 | Derivative-18 | 13-Sulfydryl, 2-Trifluoromethyl |
| D-19 | Derivative-19 | 13-Sulfydryl, 2-Fluoromethane |
| D-20 | Derivative-20 | 13-Chlorine, 1-Bromine |
| D-21 | Derivative-21 | 13-Chlorine, 2-Fluorine |
| D-22 | Derivative-22 | 13-Chlorine, 2-Methyl |
| D-23 | Derivative-23 | 13-Chlorine, 2-Amidogen |
| D-24 | Derivative-24 | 13-Chlorine, 2-Sulfydryl |
| D-25 | Derivative-25 | 13-Chlorine, 2-Carboxyl |
| D-26 | Derivative-26 | 13-Chlorine, 2-Trifluoromethyl |
| D-27 | Derivative-27 | 13-Chlorine, 2-Fluoromethane |
| D-28 | Derivative-28 | 13-Fluorine, 1-Bromine |
| D-29 | Derivative-29 | 13-Fluorine, 2-Fluorine |
| D-30 | Derivative-30 | 13-Fluorine, 2-Methyl |
| D-31 | Derivative-31 | 13-Fluorine, 2-Amidogen |
| D-32 | Derivative-32 | 13-Fluorine, 2-Sulfydryl |
| D-33 | Derivative-33 | 13-Fluorine, 2-Carboxyl |
| D-34 | Derivative-34 | 13-Fluorine, 2-Trifluoromethyl |
| D-35 | Derivative-35 | 13-Fluorine, 2-Fluoromethane |
| No. | Synergistic Degradation Effect | Plant Degradation Effect | Microbial Degradation Effect | |||||||
|---|---|---|---|---|---|---|---|---|---|---|
| Peroxidase (1PA2) | Manganese Peroxidase (1MNP) | Lignin Peroxidase (1B85) | Laccase (1GYC) | |||||||
| Pred. | Change Rate (%) | Pred. | Change Rate (%) | Pred. | Change Rate (%) | Pred. | Change Rate (%) | Pred. | Change Rate (%) | |
| NOR | −34.133 | −13.508 | −8.515 | −34.133 | −19.560 | |||||
| D-1 | −41.476 | 21.51 | −22.395 | 65.80 | −24.503 | 187.76 | −38.547 | 12.93 | −25.518 | 30.46 |
| D-2 | −40.962 | 20.01 | −22.802 | 68.81 | −26.370 | 209.69 | −37.985 | 11.29 | −25.736 | 31.57 |
| D-3 | −40.264 | 17.96 | −22.431 | 66.06 | −25.574 | 200.34 | −36.847 | 7.95 | −25.247 | 29.07 |
| D-4 | −37.647 | 10.30 | −20.081 | 48.67 | −22.109 | 159.65 | −37.158 | 8.86 | −21.794 | 11.42 |
| D-5 | −39.659 | 16.19 | −21.930 | 62.35 | −26.472 | 210.89 | −41.139 | 20.53 | −26.767 | 36.85 |
| D-6 | −37.730 | 10.54 | −19.620 | 45.25 | −21.055 | 147.27 | −32.266 | −5.47 | −22.889 | 17.02 |
| D-7 | −38.463 | 12.69 | −22.785 | 68.68 | −22.665 | 166.18 | −31.787 | −6.87 | −26.959 | 37.83 |
| D-8 | −38.084 | 11.58 | −23.036 | 70.54 | −22.719 | 166.81 | −31.336 | −8.19 | −25.945 | 32.64 |
| D-9 | −37.642 | 10.28 | −22.492 | 66.51 | −22.367 | 162.68 | −33.497 | −1.86 | −25.880 | 32.31 |
| D-10 | −37.863 | 10.93 | −17.501 | 29.57 | −20.936 | 145.87 | −39.716 | 16.36 | −21.092 | 7.83 |
| D-11 | −37.960 | 11.21 | −18.353 | 35.87 | −19.453 | 128.46 | −31.118 | −8.83 | −22.320 | 14.11 |
| D-12 | −39.697 | 16.30 | −19.601 | 45.11 | −23.427 | 175.13 | −39.766 | 16.50 | −21.912 | 12.02 |
| D-13 | −40.974 | 20.04 | −22.558 | 67.00 | −24.818 | 191.46 | −40.992 | 20.09 | −26.805 | 37.04 |
| D-14 | −40.344 | 18.20 | −20.468 | 51.53 | −23.313 | 173.79 | −36.819 | 7.87 | −23.498 | 20.13 |
| D-15 | −41.174 | 20.63 | −23.340 | 72.79 | −24.561 | 188.44 | −37.111 | 8.72 | −27.152 | 38.81 |
| D-16 | −40.751 | 19.39 | −23.709 | 75.52 | −24.861 | 191.97 | −36.279 | 6.29 | −26.317 | 34.54 |
| D-17 | −39.598 | 16.01 | −22.146 | 63.95 | −23.723 | 178.60 | −36.198 | 6.05 | −26.126 | 33.57 |
| D-18 | −40.278 | 18.00 | −17.726 | 31.23 | −22.833 | 168.15 | −43.327 | 26.94 | −21.470 | 9.76 |
| D-19 | −39.670 | 16.22 | −19.617 | 45.23 | −22.965 | 169.70 | −39.374 | 15.35 | −22.482 | 14.94 |
| D-20 | −39.165 | 14.74 | −19.715 | 45.96 | −24.314 | 185.54 | −39.254 | 15.00 | −21.891 | 11.92 |
| D-21 | −40.431 | 18.45 | −22.691 | 67.99 | −26.170 | 207.34 | −40.512 | 18.69 | −26.815 | 37.09 |
| D-22 | −35.528 | 4.09 | −23.541 | 74.28 | −23.630 | 177.51 | −41.617 | 21.93 | −27.929 | 42.79 |
| D-23 | −40.614 | 18.99 | −23.527 | 74.18 | −25.955 | 204.82 | −36.655 | 7.39 | −27.258 | 39.36 |
| D-24 | −40.199 | 17.77 | −23.860 | 76.64 | −26.209 | 207.80 | −35.791 | 4.86 | −26.390 | 34.92 |
| D-25 | −39.083 | 14.50 | −22.262 | 64.81 | −24.560 | 188.43 | −35.597 | 4.29 | −26.084 | 33.35 |
| D-26 | −34.702 | 1.67 | −21.147 | 56.56 | −21.602 | 153.69 | −48.717 | 42.73 | −26.756 | 36.79 |
| D-27 | −34.582 | 1.32 | −22.809 | 68.86 | −22.980 | 169.88 | −44.842 | 31.37 | −27.215 | 39.14 |
| D-28 | −37.599 | 10.15 | −20.159 | 49.24 | −21.980 | 158.13 | −38.281 | 10.84 | −22.085 | 12.91 |
| D-29 | −39.758 | 16.48 | −22.317 | 65.22 | −25.357 | 197.79 | −39.869 | 16.80 | −26.477 | 35.36 |
| D-30 | −39.205 | 14.86 | −20.095 | 48.77 | −23.667 | 177.94 | −35.861 | 5.06 | −23.026 | 17.72 |
| D-31 | −36.572 | 7.15 | −25.676 | 90.09 | −24.773 | 190.93 | −41.135 | 20.51 | −30.032 | 53.54 |
| D-32 | −36.482 | 6.88 | −26.681 | 97.53 | −26.457 | 210.71 | −40.807 | 19.55 | −29.724 | 51.96 |
| D-33 | −38.599 | 13.08 | −22.699 | 68.05 | −28.217 | 231.38 | −34.088 | −0.13 | −27.707 | 41.65 |
| D-34 | −39.239 | 14.96 | −17.691 | 30.97 | −23.286 | 173.47 | −42.904 | 25.70 | −21.280 | 8.79 |
| D-35 | −38.567 | 12.99 | −19.225 | 42.33 | −23.257 | 173.13 | −38.399 | 12.50 | −21.954 | 12.24 |
| No. | Bioaccumulation | Soil Adsorbability | ||
|---|---|---|---|---|
| log Kow | Change Rate (%) | log Koc | Change Rate (%) | |
| 3 | −1.03 | −0.392 | ||
| D-1 | 0.4 | −138.83 | 0.399 | −201.79% |
| D-2 | −0.13 | −87.38 | 0.105 | −126.79% |
| D-3 | −0.44 | −57.28 | −0.066 | −83.16% |
| D-4 | −0.45 | −56.31 | −0.072 | −81.63% |
| D-5 | −1.34 | 30.10 | −0.542 | 38.27% |
| D-10 | −0.38 | −63.11 | −0.033 | −91.58% |
| D-12 | 0.25 | −124.27 | 0.316 | −180.61% |
| D-13 | −0.64 | −37.86 | −0.155 | −60.46% |
| D-14 | −0.09 | −91.26 | 0.128 | −132.65% |
| D-15 | −1.32 | 28.16 | −0.531 | 35.46% |
| D-16 | −0.66 | −35.92 | −0.166 | −57.65% |
| D-17 | −1.91 | 85.44 | −0.857 | 118.62% |
| D-18 | 0.33 | −132.04 | 0.36 | −191.84% |
| D-19 | −0.15 | −85.44 | 0.094 | −123.98% |
| D-20 | −0.27 | −73.79 | 0.028 | −107.14% |
| D-21 | −1.16 | 12.62 | −0.442 | 12.76% |
| D-23 | −1.85 | 79.61 | −0.824 | 110.20% |
| D-24 | −1.18 | 14.56 | −0.454 | 15.82% |
| D-25 | −2.44 | 136.89 | −1.15 | 193.37% |
| D-28 | −0.59 | −42.72 | −0.149 | −61.99% |
| D-29 | −1.48 | 43.69 | −0.619 | 57.91% |
| D-30 | −0.93 | −9.71 | −0.337 | −14.03% |
| D-31 | −2.16 | 109.71 | −0.996 | 154.08% |
| D-33 | −2.75 | 166.99 | −1.322 | 237.24% |
| D-34 | −0.51 | −50.49 | −0.105 | −73.21% |
| D-35 | −0.99 | −3.88 | −0.37 | −5.61% |
| No. | Stability | Genotoxicity | |||||
|---|---|---|---|---|---|---|---|
| Molecular Structure Stability | Molecular Metabolic Stability | ||||||
| Frequency (cm−1) | Total Energy (a.u.) | Change Rate (%) | Bayesian Score | Change Rate (%) | pLOEC | Change Rate (%) | |
| 3 | 24.82 | −1109.899 | −3.860 | 8.055 | |||
| D-5 | 28.90 | −1130.418 | 1.85 | −3.434 | −11.05 | 7.559 | −6.16 |
| D-15 | 26.16 | −1484.726 | 33.77 | −2.516 | −34.83 | 8.435 | 4.72 |
| D-17 | 18.46 | −1617.921 | 45.77 | −2.214 | −42.65 | 8.159 | 1.29 |
| D-21 | 22.80 | −1589.958 | 43.25 | −2.876 | −25.49 | 7.464 | −7.34 |
| D-23 | 23.88 | −1546.137 | 39.30 | −2.772 | −28.18 | 7.97 | −1.06 |
| D-24 | 22.11 | −1888.951 | 70.19 | −4.553 | 17.96 | 7.814 | −2.99 |
| D-25 | 18.30 | −1679.331 | 51.30 | −2.471 | −36.00 | 7.692 | −4.51 |
| D-29 | 27.90 | −1229.614 | 10.79 | −2.449 | −36.54 | 7.311 | −9.24 |
| D-30 | 23.08 | −1169.793 | 5.40 | −3.051 | −20.97 | 7.483 | −7.10 |
| D-31 | 27.64 | −1185.797 | 6.84 | −2.163 | −43.96 | 7.766 | −3.59 |
| D-33 | 18.66 | −1318.992 | 18.84 | −2.044 | −47.06 | 7.466 | −7.31 |
| D-35 | 13.05 | −1268.980 | 14.33 | −2.876 | −25.50 | 7.443 | −7.60 |
| Property | Parameter | Value | Description | References |
|---|---|---|---|---|
| Stability of molecular structure | Frequency (cm−1) | >0 | Stable | [108] |
| Total Energy (a.u.) | Lower | Higher | [109] | |
| Stability of molecular metabolism | Bayesian Score | <0.161 | Non-inhibitor | [110] |
| >0.161 | Inhibitor | |||
| Genotoxicity | pLOEC | Higher | Higher | [73] |
| Transformation | Pathway | NOR | D-17 | Change Rate (%) | ||||||
|---|---|---|---|---|---|---|---|---|---|---|
| Reactant | Product | ΔE (kJ/mol) | ΔE (Total) (kJ/mol) | Reactant | Product | ΔE (kJ/mol) | ΔE (Total) (kJ/mol) | |||
| Plant Degradation | Pathway A | NOR | N0-1 | 7.021 | 1042.390 | D-17 | D-17-1 | 0.098 | 569.287 | ↓* −98.61 |
| N0-1 | N0-2 | 575.569 | D-17-1 | D-17-2 | 9.357 | ↓−98.37 | ||||
| N0-2 | N0-3 | 459.801 | D-17-2 | D-17-3 | 559.832 | ↑* 21.76 | ||||
| Pathway B | NOR | N0-4 | 59.555 | 63.301 | D-17 | D-17-4 | 25.885 | 25.885 | ↓−56.54 | |
| N0-4 | N0-5 | 0.364 | D-17-4 | D-17-5 | −5.233 | - | - | |||
| N0-5 | N0-6 | 3.381 | D-17-5 | D-17-6 | 527.635 | |||||
| Microbial Degradation | Pathway A | NOR | N0-1 | 59.555 | 59.555 | D-17 | D-17-1 | 25.885 | 25.885 | ↓−56.54 |
| Pathway B | NOR | N0-2 | 102.450 | 644.955 | D-17 | D-17-2 | 86.674 | 147.276 | ↓−15.40 | |
| N0-2 | N0-3 | −39.949 | D-17-2 | D-17-3 | −2.983 | - | ||||
| N0-4 | 542.506 | D-17-4 | 60.602 | ↓−88.83 | ||||||
| Pathway C | NOR | N0-5 | 14.263 | 38.950 | D-17 | D-17-5 | 57.831 | 68.585 | ↑305.47 | |
| N0-5 | N0-6 | 24.687 | D-17-5 | D-17-6 | 10.754 | ↓−56.44 | ||||
| Pathway D | NOR | N0-7 | 40.871 | 63.897 | D-17 | D-17-7 | −17.971 | - | - | |
| N0-7 | N0-8 | 1.274 | D-17-7 | D-17-8 | 646.370 | |||||
| N0-8 | N0-9 | 21.752 | D-17-8 | D-17-9 | 343.622 | |||||
| Transformation | Pathway | Product | ADMET EXT Hepatotoxic (Non vs. Toxic) | Ames Mutagenicity (Non vs. Mutagenicity) | NTP Rodent Carcinogenicity (Non vs. Carcinogen) | FDA Rodent Carcinogenicity (Non vs. Carcinogen) | |||||||
|---|---|---|---|---|---|---|---|---|---|---|---|---|---|
| Hepatotoxicity | Change Rate (%) | Male Rat | Female Rat | Male Mouse | Female Mouse | Male Rat | Female Rat | Male Mouse | Female Mouse | ||||
| NOR | 1.861/T | 0.937/M | 0.671/C | 0.500/N | 0.674/C | 0.378/N | 0.091/N | 0.137/N | 0.125/N | 0.217/N | |||
| Plant Degradation | A | N0-1 | 1.131/T | −39.21 | 0.728/M | 0.578/N | 0.448/N | 0.608/C | 0.522/N | 0.154/N | 0.183/N | 0.171/N | 0.212/N |
| N0-2 | −0.338/N | −118.15 | 0.671/N | 0.589/N | 0.403/N | 0.600/C | 0.378/N | 0.157/N | 0.184/N | 0.154/N | 0.221/N | ||
| B | N0-4 | −0.106/N | −105.71 | 0.703/N | 0.606/C | 0.464/N | 0.517/N | 0.479/N | 0.312/N | 0.230/N | 0.220/N | 0.215/N | |
| Microbial Degradation | A | N0-1 | −0.106/N | −105.71 | 0.703/N | 0.606/C | 0.464/N | 0.517/N | 0.479/N | 0.312/N | 0.230/N | 0.220/N | 0.215/N |
| B | N0-2 | −1.040/N | −155.88 | 0.707/N | 0.566/C | 0.395/N | 0.568/C | 0.434/N | 0.218/N | 0.217/N | 0.216/N | 0.206/N | |
| N0-4 | −0.277/N | −114.88 | 0.725/N | 0.311/C | 0.363/N | 0.395/N | 0.311/N | 0.257/N | 0.205/N | 0.234/N | 0.208/N | ||
| D-17 | 1.931/T | 0.663/N | 0.591/N | 0.445/N | 0.486/N | 0.362/N | 0.171/N | 0.205/N | 0.140/N | 0.213/N | |||
| Plant Degradation | A | D-17-1 | 1.593/T | −17.47 | 0.666/N | 0.515/N | 0.381/N | 0.462/N | 0.335/N | 0.173/N | 0.204/N | 0.145/N | 0.213/N |
| D-17-2 | −1.185/N | −161.36 | 0.632/N | 0.532/N | 0.332/N | 0.418/N | 0.277/N | 0.166/N | 0.219/N | 0.167/N | 0.206/N | ||
| B | D-17-4 | 0.382//N | −80.19 | 0.721/N | 0.625/C | 0.487/N | 0.540/N | 0.461/N | 0.317/N | 0.226/N | 0.219/N | 0.219/N | |
| Microbial Degradation | A | D-17-1 | 0.382/N | −80.19 | 0.721/N | 0.625/C | 0.487/N | 0.540/N | 0.461/N | 0.317/N | 0.226/N | 0.219/N | 0.219/N |
| B | D-17-2 | −1.280/N | −166.32 | 0.679/N | 0.539/N | 0.398/N | 0.354/N | 0.363/N | 0.238/N | 0.227/N | 0.189/N | 0.205/N | |
| D-17-4 | 0.307/N | −84.09 | 0.632/N | 0.639/C | 0.418/N | 0.541/N | 0.279/N | 0.218/N | 0.212/N | 0.151/N | 0.217/N | ||
| Transformation | Pathway | Product | Rat Oral | Developmental Toxicity Potential (DTP) (Non vs. Toxic) | Skin Irritancy (Non vs. Irritant) | Skin Sensitization | Ocular Irritancy | ||||||
| LD50* (g/kg) | Non vs. Sens | Weak vs. Strong | Non vs. Irritant | Mild vs. Moderate/Severe | |||||||||
| NOR | 1.955/C4 | 0.707/T | 0.957/N | 0.800/S | 0.897/S | 0.999/I | 0.861/M | ||||||
| Plant Degradation | A | N0-1 | 4.166/C5 | 0.651/T | 0.966/N | 0.810/S | 0.890/S | 0.999/I | 0.841/M | ||||
| N0-2 | 1.622/C4 | 0.669/T | 0.949/N | 0.773/S | 0.863/W | 0.999/I | 0.886/M | ||||||
| B | N0-4 | 0.278/C3 | 0.566/T | 0.950/N | 0.856/S | 0.925/S | 0.999/I | 0.833/M | |||||
| Microbial Degradation | A | N0-1 | 0.278/C3 | 0.566/T | 0.950/N | 0.856/S | 0.925/S | 0.999/I | 0.833/M | ||||
| B | N0-2 | 2.731/C5 | 0.625/T | 0.962/N | 0.788/S | 0.889/S | 0.999/I | 0.867/M | |||||
| N0-4 | 1.528/C4 | 0.541/T | 0.906/N | 0.861/S | 0.913/S | 0.999/I | 0.828/M | ||||||
| D-17 | 1.369/C4 | 0.631/T | 0.961/N | 0.786/S | 0.850/W | 0.999/I | 0.844/M | ||||||
| Plant Degradation | A | D-17-1 | 0.643/C4 | 0.637/T | 0.959/N | 0.774/S | 0.848/W | 0.999/I | 0.857/M | ||||
| D-17-2 | 0.531/C4 | 0.644/T | 0.952/N | 0.748/S | 0.795/W | 0.999/I | 0.871/M | ||||||
| B | D-17-4 | 0.236/C3 | 0.547/T | 0.949/N | 0.844/S | 0.976/S | 0.999/I | 0.836/M | |||||
| Microbial Degradation | A | D-17-1 | 0.236/C3 | 0.547/T | 0.949/N | 0.844/S | 0.976/S | 0.999/I | 0.836/M | ||||
| B | D-17-2 | 1.127/C4 | 0.599/T | 0.967/N | 0.775/S | 0.858/W | 0.999/I | 0.844/M | |||||
| D-17-4 | 1.116/C4 | 0.625/T | 0.966/N | 0.772/S | 0.860/W | 0.999/I | 0.862/M | ||||||
Publisher’s Note: MDPI stays neutral with regard to jurisdictional claims in published maps and institutional affiliations. |
© 2021 by the authors. Licensee MDPI, Basel, Switzerland. This article is an open access article distributed under the terms and conditions of the Creative Commons Attribution (CC BY) license (https://creativecommons.org/licenses/by/4.0/).
Share and Cite
Sun, P.; Zhao, W. Strategies to Control Human Health Risks Arising from Antibiotics in the Environment: Molecular Modification of QNs for Enhanced Plant–Microbial Synergistic Degradation. Int. J. Environ. Res. Public Health 2021, 18, 10610. https://0-doi-org.brum.beds.ac.uk/10.3390/ijerph182010610
Sun P, Zhao W. Strategies to Control Human Health Risks Arising from Antibiotics in the Environment: Molecular Modification of QNs for Enhanced Plant–Microbial Synergistic Degradation. International Journal of Environmental Research and Public Health. 2021; 18(20):10610. https://0-doi-org.brum.beds.ac.uk/10.3390/ijerph182010610
Chicago/Turabian StyleSun, Peixuan, and Wenjin Zhao. 2021. "Strategies to Control Human Health Risks Arising from Antibiotics in the Environment: Molecular Modification of QNs for Enhanced Plant–Microbial Synergistic Degradation" International Journal of Environmental Research and Public Health 18, no. 20: 10610. https://0-doi-org.brum.beds.ac.uk/10.3390/ijerph182010610