
The Comparison of the Effects between Continuous and Intermittent Energy Restriction in Short-Term Bodyweight Loss for Sedentary Population: A Randomized, Double-Blind, Controlled Trial


Abstract
:1. Introduction
2. Method
2.1. Participants Recruitment and Ethics
2.1.1. Inclusion Criteria
2.1.2. Exclusion Criteria
2.1.3. Ethics Approvement
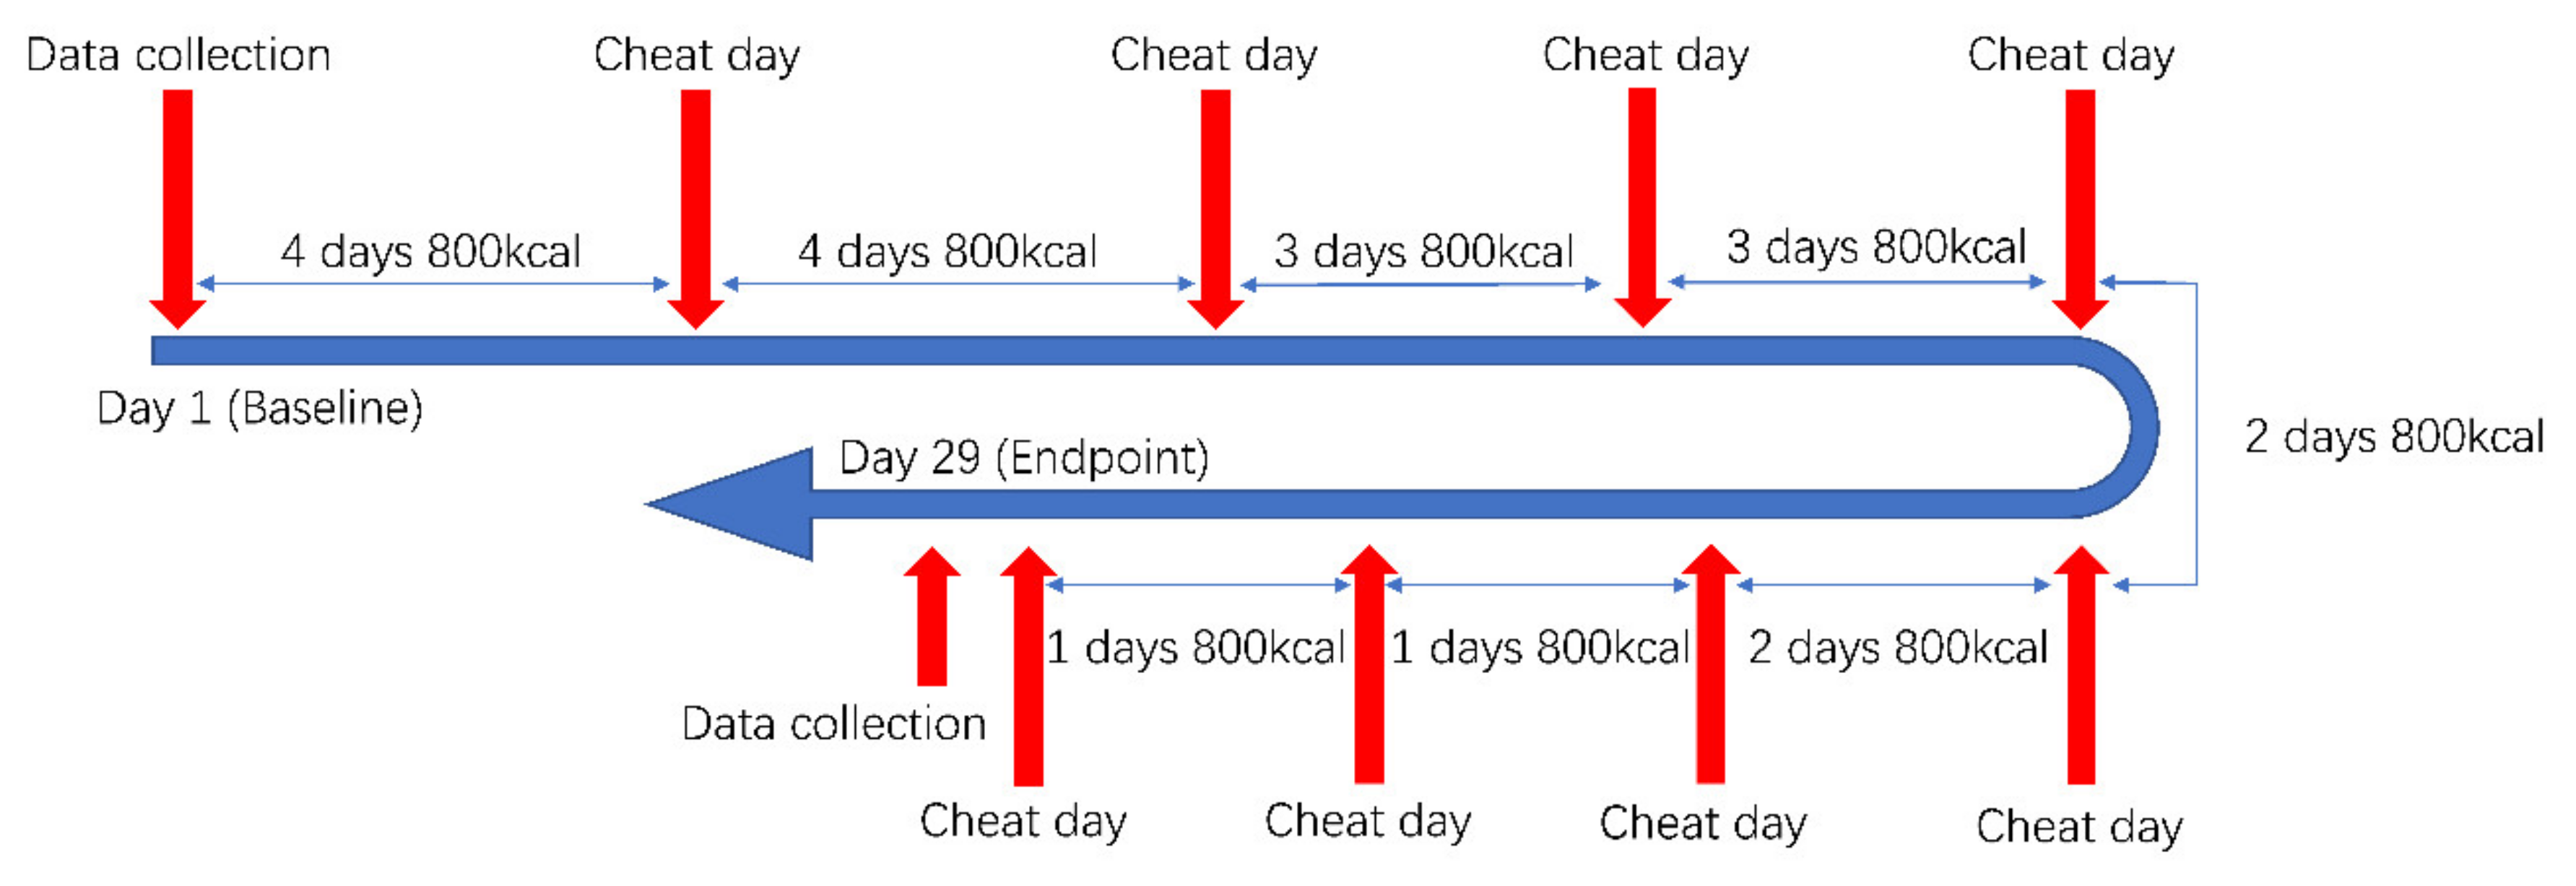
2.2. Protocol
2.2.1. Randomization and Blinding
2.2.2. Intervention(s)
- Intermittent Energy Restriction (IER)
- Continuous Energy Restriction (CER)
- Physical Exercise
2.3. Data Collection
2.3.1. Participants Characteristics
2.3.2. Daily Data Collection
2.3.3. Participants Characteristics
2.3.4. Individual Plan Retention
2.4. Statistical Calculation and Analysis
3. Results
3.1. Participants
3.2. Effect on Bodyweight Loss Plan
3.3. Individual Plan Retention
3.4. Influence Factors Analysis
4. Discussion
5. Conclusions
Supplementary Materials
Author Contributions
Funding
Institutional Review Board Statement
Informed Consent Statement
Data Availability Statement
Conflicts of Interest
References
- Tinsley, G.M.; Trexler, E.T.; Smith-Ryan, A.E.; Paoli, A.; Graybeal, A.J.; Campbell, B.I.; Schoenfeld, B.J. Changes in body composition and neuromuscular performance through preparation, 2 competitions, and a recovery period in an experienced female physique athlete. J. Strength Cond. Res. 2019, 33, 1823–1839. [Google Scholar] [CrossRef] [PubMed]
- Mitchell, L.; Slater, G.; Hackett, D.; Johnson, N.; O’Connor, H. Physiological implications of preparing for a natural male bodybuilding competition. Eur. J. Sport Sci. 2018, 18, 619–629. [Google Scholar] [CrossRef] [PubMed]
- Chappell, A.J.; Simper, T.; Barker, M.E. Nutritional strategies of high level natural bodybuilders during competition preparation. J. Int. Soc. Sports Nutr. 2018, 15, 4. [Google Scholar]
- Pardue, A.; Trexler, E.T.; Sprod, L.K. Case study: Unfavorable but transient physiological changes during contest preparation in a drug-free male bodybuilder. Int. J. Sport Nutr. Exerc. Metab. 2017, 27, 550–559. [Google Scholar] [CrossRef]
- Helms, E.R.; Aragon, A.A.; Fitschen, P.J. Evidence-based recommendations for natural bodybuilding contest preparation: Nutrition and supplementation. J. Int. Soc. Sports Nutr. 2014, 11, 20. [Google Scholar] [CrossRef] [PubMed] [Green Version]
- Rossow, L.M.; Fukuda, D.H.; Fahs, C.A.; Loenneke, J.P.; Stout, J.R. Natural bodybuilding competition preparation and recovery: A 12-month case study. Int. J. Sports Physiol. Perform. 2013, 8, 582–592. [Google Scholar] [CrossRef] [Green Version]
- Lambert, C.P.; Frank, L.L.; Evans, W.J. Macronutrient considerations for the sport of bodybuilding. Sports Med. 2004, 34, 317–327. [Google Scholar] [CrossRef] [PubMed]
- Bamman, M.M.; Hunter, G.R.; Newton, L.E.; Roney, R.K.; Khaled, M.A. Changes in body composition, diet, and strength of bodybuilders during the 12 weeks prior to competition. J. Sports Med. Phys. Fit. 1993, 33, 383–391. [Google Scholar]
- Sandoval, W.M.; Heyward, V.H. Food selection patterns of bodybuilders. Int. J. Sport Nutr. 1991, 1, 61–68. [Google Scholar]
- Kleiner, S.M.; Bazzarre, T.L.; Litchford, M.D. Metabolic profiles, diet, and health practices of championship male and female bodybuilders. J. Am. Diet Assoc. 1990, 90, 962–967. [Google Scholar] [CrossRef]
- Peos, J.J.; Norton, L.E.; Helms, E.R.; Galpin, A.J.; Fournier, P. Intermittent dieting: Theoretical considerations for the athlete. Sports 2019, 7, 22. [Google Scholar] [CrossRef] [PubMed] [Green Version]
- Varady, K.A. Intermittent versus daily calorie restriction: Which diet regimen is more effective for weight loss? Obes. Rev. 2011, 12, e593–e601. [Google Scholar] [CrossRef] [PubMed]
- Campbell, B.; Aguilar, D.; Wong, V.; Rogers, G.; Fox, C.; Hosey, T.; Lindsay, S.; Ford, S.; Radford, D. The effects of intermittent carbohydrate re-feeds vs. continuous dieting on resting metabolic rate in resistance trained individuals: A flexible dieting study. In Proceedings of the 15th International Society of Sports Nutrition (ISSN) Conference and Expo, Clearwater Beach, FL, USA, 7–9 June 2018; pp. 7–9. [Google Scholar]
- Rosenbaum, M.; Leibel, R.L. Models of energy homeostasis in response to maintenance of reduced bodyweight. Obesity 2016, 24, 1620–1629. [Google Scholar] [CrossRef] [PubMed] [Green Version]
- Doucet, E.; Imbeault, P.; St-Pierre, S.; Almeras, N.; Mauriege, P.; Despres, J.P.; Bouchard, C.; Tremblay, A. Greater than predicted decrease in energy expenditure during exercise after bodyweight loss in obese men. Clin. Sci. 2003, 105, 89–95. [Google Scholar] [CrossRef] [PubMed]
- Levine, J.A. Non-exercise activity thermogenesis (neat). Best Pract. Res. Clin. Endocrinol. Metab. 2002, 16, 679–702. [Google Scholar] [CrossRef]
- Weigle, D.S. Contribution of decreased body mass to diminished thermic effect of exercise in reduced-obese men. Int. J. Obes. 1988, 12, 567. [Google Scholar]
- Trexler, E.T.; Smith-Ryan, A.E.; Norton, L.E. Metabolic adaptation to weight loss: Implications for the athlete. J. Int. Soc. Sports Nutr. 2014, 11, 7. [Google Scholar] [CrossRef] [PubMed] [Green Version]
- Miles, C.W.; Wong, N.P.; Rumpler, W.V.; Conway, J. Effect of circadian variation in energy expenditure, within-subject variation and weight reduction on thermic effect of food. Eur. J. Clin. Nutr. 1993, 47, 274–284. [Google Scholar]
- Rohrig, B.; Pettitt, R.; Pettitt, C.; Kanzenbach, T. Psychophysiological tracking of a female physique competitor through competition preparation. Int. J. Exerc. Sci. 2017, 10, 301–311. [Google Scholar]
- Robinson, S.L.; Lambeth-Mansell, A.; Gillibrand, G.; Smith-Ryan, A.; Bannock, L. A nutrition and conditioning intervention for natural bodybuilding contest preparation: Case study. J. Int. Soc. Sports Nutr. 2015, 12, 20. [Google Scholar] [CrossRef] [Green Version]
- Mountjoy, M.; Sundgot-Borgen, J.K.; Burke, L.M.; Ackerman, K.E.; Blauwet, C.; Constantini, N.; Lebrun, C.; Lundy, B.; Melin, A.K.; Meyer, N.L.; et al. Ioc consensus statement on relative energy deficiency in sport (red-s): 2018 update. Br. J. Sports Med. 2018, 52, 687–697. [Google Scholar] [CrossRef] [Green Version]
- Roman, Y.M.; Dominguez, M.C.; Easow, T.M.; Pasupuleti, V.; White, C.M.; Hernandez, A.V. Effects of intermittent versus continuous dieting on weight and body composition in obese and overweight people: A systematic review and meta-analysis of randomized controlled trials. Int. J. Obes. 2019, 43, 2017–2027. [Google Scholar]
- Harvie, M.N.; Pegington, M.; Mattson, M.P.; Frystyk, J.; Dillon, B.; Evans, G.; Cuzick, J.; Jebb, S.A.; Martin, B.; Cutler, R.G.; et al. The effects of intermittent or continuous energy restriction on weight loss and metabolic disease risk markers: A randomized trial in young overweight women. Int. J. Obes. 2011, 35, 714–727. [Google Scholar] [CrossRef] [Green Version]
- Martinez-de-Quel, O.; Suarez-Iglesias, D.; Lopez-Flores, M.; Perez, C.A. Physical activity, dietary habits and sleep quality before and during covid-19 lockdown: A longitudinal study. Appetite 2021, 158, 105019. [Google Scholar] [CrossRef]
- Bradbury, K.E.; Cairns, B.J. Understanding the relation between bmi and mortality. BMJ 2019, 364, l1219. [Google Scholar] [CrossRef]
- Adab, P.; Pallan, M.; Whincup, P.H. Is bmi the best measure of obesity? BMJ 2018, 360, k1274. [Google Scholar] [PubMed] [Green Version]
- Huxley, R.; Mendis, S.; Zheleznyakov, E.; Reddy, S.; Chan, J. Body mass index, waist circumference and waist:Hip ratio as predictors of cardiovascular risk--a review of the literature. Eur. J. Clin. Nutr. 2010, 64, 16–22. [Google Scholar] [CrossRef] [Green Version]
- Fletcher, A.; Bonell, C.; Sorhaindo, A. You are what your friends eat: Systematic review of social network analyses of young people’s eating behaviours and bodyweight. J. Epidemiol. Community Health 2011, 65, 548–555. [Google Scholar] [CrossRef]
- Sikorski, C.; Riedel, C.; Luppa, M.; Schulze, B.; Werner, P.; Konig, H.H.; Riedel-Heller, S.G. Perception of overweight and obesity from different angles: A qualitative study. Scand. J. Public Health 2012, 40, 271–277. [Google Scholar] [CrossRef] [PubMed]
- Ortega, R.M.; Requejo, A.M.; Quintas, E.; Redondo, M.R.; Lopez-Sobaler, M.; Andres, P. Concern regarding bodyweight and energy balance in a group of female university students from madrid: Differences with respect to body mass index. J. Am. Coll. Nutr. 1997, 16, 244–251. [Google Scholar] [CrossRef] [PubMed]
- Xue, J.; Li, S.; Zhang, Y.; Hong, P. Accuracy of predictive resting-metabolic-rate equations in chinese mainland adults. Int. J. Environ. Res. Public Health 2019, 16, 2747. [Google Scholar] [CrossRef] [Green Version]
- Camps, S.G.; Wang, N.X.; Tan, W.S.; Henry, C.J. Estimation of basal metabolic rate in chinese: Are the current prediction equations applicable? Nutr. J. 2016, 15, 79. [Google Scholar] [CrossRef] [Green Version]
- Leung, R.; Woo, J.; Chan, D.; Tang, N. Validation of prediction equations for basal metabolic rate in chinese subjects. Eur. J. Clin. Nutr. 2000, 54, 551–554. [Google Scholar] [CrossRef] [Green Version]
- Liu, H.Y.; Lu, Y.F.; Chen, W.J. Predictive equations for basal metabolic rate in chinese adults: A cross-validation study. J. Am. Diet. Assoc. 1995, 95, 1403–1408. [Google Scholar] [PubMed]
- Westcott, W.L.; Winett, R.A.; Annesi, J.J.; Wojcik, J.R.; Anderson, E.S.; Madden, P.J. Prescribing physical activity: Applying the acsm protocols for exercise type, intensity, and duration across 3 training frequencies. Phys. Sportsmed. 2009, 37, 51–58. [Google Scholar] [CrossRef] [PubMed]
- Garthe, I.; Raastad, T.; Refsnes, P.E.; Koivisto, A.; Sundgot-Borgen, J. Effect of two different weight-loss rates on body composition and strength and power-related performance in elite athletes. Int. J. Sport Nutr. Exerc. Metab. 2011, 21, 97–104. [Google Scholar] [CrossRef] [PubMed]
- Shubin, V.I.; Laricheva, K.A.; Ialovaia, N.I.; Lobas, N.M.; Shamarina, T.M. Energy expenditures and the functional state of the neuromuscular system in athletes regulating bodyweight by use of a low-calorie diet. Vopr. Pitan. 1981, 1, 11–15. [Google Scholar]
- Kato, M.; Shimazu, M.; Moriguchi, S.; Kishino, Y. Body mass index (bmi) is a reliable index to estimate obesity as a risk factor for deteriorating health. Tokushima J. Exp. Med. 1996, 43, 1–6. [Google Scholar]
- Haase, C.L.; Eriksen, K.T.; Lopes, S.; Satylganova, A.; Schnecke, V.; McEwan, P. Body mass index and risk of obesity-related conditions in a cohort of 2.9 million people: Evidence from a uk primary care database. Obes. Sci. Pract. 2021, 7, 137–147. [Google Scholar] [CrossRef]
- Pontzer, H. Constrained total energy expenditure and the evolutionary biology of energy balance. Exerc. Sport Sci. Rev. 2015, 43, 110–116. [Google Scholar] [CrossRef]
- Pontzer, H.; Durazo-Arvizu, R.; Dugas, L.R.; Plange-Rhule, J.; Bovet, P.; Forrester, T.E.; Lambert, E.V.; Cooper, R.S.; Schoeller, D.A.; Luke, A. Constrained total energy expenditure and metabolic adaptation to physical activity in adult humans. Curr. Biol. 2016, 26, 410–417. [Google Scholar] [CrossRef] [Green Version]
- Pontzer, H.; Raichlen, D.A.; Wood, B.M.; Mabulla, A.Z.; Racette, S.B.; Marlowe, F.W. Hunter-gatherer energetics and human obesity. PLoS ONE 2012, 7, e40503. [Google Scholar] [CrossRef] [PubMed]
- Harvie, M.; Wright, C.; Pegington, M.; McMullan, D.; Mitchell, E.; Martin, B.; Cutler, R.G.; Evans, G.; Whiteside, S.; Maudsley, S.; et al. The effect of intermittent energy and carbohydrate restriction v. Daily energy restriction on weight loss and metabolic disease risk markers in overweight women. Br. J. Nutr. 2013, 110, 1534–1547. [Google Scholar]
- Davis, J.M.; Welsh, R.S.; Alerson, N.A. Effects of carbohydrate and chromium ingestion during intermittent high-intensity exercise to fatigue. Int. J. Sport Nutr. Exerc. Metab. 2000, 10, 476–485. [Google Scholar] [CrossRef] [PubMed]
- Byrne, N.M.; Sainsbury, A.; King, N.A.; Hills, A.P.; Wood, R.E. Intermittent energy restriction improves weight loss efficiency in obese men: The matador study. Int. J. Obes. 2018, 42, 129–138. [Google Scholar] [CrossRef] [Green Version]
- Abt, G.; Zhou, S.; Weatherby, R. The effect of a high-carbohydrate diet on the skill performance of midfield soccer players after intermittent treadmill exercise. J. Sci. Med. Sport 1998, 1, 203–212. [Google Scholar]
- Dostal, T.; Plews, D.J.; Hofmann, P.; Laursen, P.B.; Cipryan, L. Effects of a 12-week very-low carbohydrate high-fat diet on maximal aerobic capacity, high-intensity intermittent exercise, and cardiac autonomic regulation: Non-randomized parallel-group study. Front. Physiol. 2019, 10, 912. [Google Scholar] [CrossRef] [PubMed] [Green Version]
- Denay, K.L.; Breslow, R.G.; Turner, M.N.; Nieman, D.C.; Roberts, W.O.; Best, T.M. Acsm call to action statement: Covid-19 considerations for sports and physical activity. Curr. Sports Med. Rep. 2020, 19, 326–328. [Google Scholar] [CrossRef]
- Heitmann, B.L.; Lissner, L. Obese individuals underestimate their food intake--which food groups are under-reported? Ugeskr. Laeger 1996, 158, 6902–6906. [Google Scholar] [PubMed]
- Strohacker, K.; McCaffery, J.M.; MacLean, P.S.; Wing, R.R. Adaptations of leptin, ghrelin or insulin during weight loss as predictors of weight regain: A review of current literature. Int. J. Obes. 2014, 38, 388–396. [Google Scholar] [CrossRef] [Green Version]
- Maestu, J.; Eliakim, A.; Jurimae, J.; Valter, I.; Jurimae, T. Anabolic and catabolic hormones and energy balance of the male bodybuilders during the preparation for the competition. J. Strength Cond. Res. 2010, 24, 1074–1081. [Google Scholar] [CrossRef]
- Hulmi, J.J.; Isola, V.; Suonpaa, M.; Jarvinen, N.J.; Kokkonen, M.; Wennerstrom, A.; Nyman, K.; Perola, M.; Ahtiainen, J.P.; Hakkinen, K. The effects of intensive weight reduction on body composition and serum hormones in female fitness competitors. Front. Physiol. 2016, 7, 689. [Google Scholar] [CrossRef] [Green Version]
- Sadeghian, M.; Hosseini, S.A.; Zare Javid, A.; Ahmadi Angali, K.; Mashkournia, A. Effect of fasting-mimicking diet or continuous energy restriction on weight loss, body composition, and appetite-regulating hormones among metabolically healthy women with obesity: A randomized controlled, parallel trial. Obes. Surg. 2021, 31, 2030–2039. [Google Scholar]
- Beaulieu, K.; Casanova, N.; Oustric, P.; Turicchi, J.; Gibbons, C.; Hopkins, M.; Varady, K.; Blundell, J.; Finlayson, G. Matched weight loss through intermittent or continuous energy restriction does not lead to compensatory increases in appetite and eating behavior in a randomized controlled trial in women with overweight and obesity. J. Nutr. 2020, 150, 623–633. [Google Scholar] [CrossRef]
- Deighton, K.; Batterham, R.L.; Stensel, D.J. Appetite and gut peptide responses to exercise and calorie restriction. The effect of modest energy deficits. Appetite 2014, 81, 52–59. [Google Scholar] [CrossRef] [PubMed]
- Seimon, R.V.; Taylor, P.; Little, T.J.; Noakes, M.; Standfield, S.; Clifton, P.M.; Horowitz, M.; Feinle-Bisset, C. Effects of acute and longer-term dietary restriction on upper gut motility, hormone, appetite, and energy-intake responses to duodenal lipid in lean and obese men. Am. J. Clin. Nutr. 2014, 99, 24–34. [Google Scholar] [CrossRef] [Green Version]
- Kim, B. Thyroid hormone as a determinant of energy expenditure and the basal metabolic rate. Thyroid 2008, 18, 141–144. [Google Scholar] [CrossRef]
- King, N.A.; Hester, J.; Gately, P.J. The effect of a medium-term activity- and diet-induced energy deficit on subjective appetite sensations in obese children. Int. J. Obes. 2007, 31, 334–339. [Google Scholar] [CrossRef] [Green Version]
- Wirths, W. Influence of deficient activity and insufficient caloric supply on energy metabolism. Int. Z. Angew. Physiol. 1967, 24, 39–56. [Google Scholar] [PubMed]
- Wang, L.; Wang, H.; Zhang, B.; Popkin, B.M.; Du, S. Elevated fat intake increases bodyweight and the risk of overweight and obesity among chinese adults: 1991–2015 trends. Nutrients 2020, 12, 3272. [Google Scholar]
- Beulen, Y.; Martinez-Gonzalez, M.A.; van de Rest, O.; Salas-Salvado, J.; Sorli, J.V.; Gomez-Gracia, E.; Fiol, M.; Estruch, R.; Santos-Lozano, J.M.; Schroder, H.; et al. Quality of dietary fat intake and bodyweight and obesity in a mediterranean population: Secondary analyses within the predimed trial. Nutrients 2018, 10, 2011. [Google Scholar]
- Hooper, L.; Abdelhamid, A.; Bunn, D.; Brown, T.; Summerbell, C.D.; Skeaff, C.M. Effects of total fat intake on bodyweight. Cochrane Database Syst. Rev. 2015, 8, CD011834. [Google Scholar]
- Leyden, E.; Hanson, P.; Halder, L.; Rout, L.; Cherry, I.; Shuttlewood, E.; Poole, D.; Loveder, M.; Abraham, J.; Kyrou, I.; et al. Older age does not influence the success of weight loss through the implementation of lifestyle modification. Clin. Endocrinol. 2021, 94, 204–209. [Google Scholar] [CrossRef] [PubMed]
- DeLuca, L.; Toro-Ramos, T.; Michaelides, A.; Seng, E.; Swencionis, C. Relationship between age and weight loss in noom: Quasi-experimental study. JMIR Diabetes 2020, 5, e18363. [Google Scholar] [PubMed]
- Jakubczak, L.F. Age differences in the effects of palatability of diet on regulation of calorie intake and bodyweight of rats. J. Gerontol. 1977, 32, 49–57. [Google Scholar] [PubMed]
- Schemmel, R.; Mickelsen, O.; Mostosky, U. Influence of bodyweight, age, diet and sex on fat depots in rats. Anat. Rec. 1970, 166, 437–445. [Google Scholar] [CrossRef]
- Schemmel, R.; Mickelsen, O.; Tolgay, Z. Dietary obesity in rats: Influence of diet, weight, age, and sex on body composition. Am. J. Physiol. 1969, 216, 373–379. [Google Scholar] [CrossRef]
- Woolford, S.J.; Sallinen, B.J.; Clark, S.J.; Iglayreger, H.B.; Gordon, P.M. Association between physician recommendation for adolescents to join a weight loss program and bmi change. J. Prim. Care Community Health 2012, 3, 83–87. [Google Scholar] [CrossRef]
- Walker, S.E.; Smolkin, M.E.; O′Leary, M.L.; Cluett, S.B.; Norwood, V.F.; Deboer, M.D.; Gurka, M.J. Predictors of retention and bmi loss or stabilization in obese youth enrolled in a weight loss intervention. Obes. Res. Clin. Pract. 2012, 6, e330–e339. [Google Scholar] [CrossRef] [Green Version]
- Leahey, T.M.; Gokee LaRose, J.; Fava, J.L.; Wing, R.R. Social influences are associated with bmi and weight loss intentions in young adults. Obesity 2011, 19, 1157–1162. [Google Scholar] [CrossRef] [PubMed]
- Kruger, J.; Bowles, H.R.; Jones, D.A.; Ainsworth, B.E.; Kohl, H.W., 3rd. Health-related quality of life, bmi and physical activity among us adults (>/=18 years): National physical activity and weight loss survey, 2002. Int. J. Obes. 2007, 31, 321–327. [Google Scholar]
- Lee, K.; Sohn, H.; Lee, S.; Lee, J. Weight and bmi over 6 years in korean children: Relationships to body image and weight loss efforts. Obes. Res. 2004, 12, 1959–1966. [Google Scholar] [CrossRef]
- Thackray, A.E.; Barrett, L.A.; Tolfrey, K. Acute effects of energy deficit induced by moderate-intensity exercise or energy-intake restriction on postprandial lipemia in healthy girls. Pediatr. Exerc. Sci. 2015, 27, 192–202. [Google Scholar] [PubMed] [Green Version]
- Naharudin, M.N.; Yusof, A. The effect of 10 days of energy-deficit diet and high-intensity exercise training on the plasma high-density-lipoprotein (hdl) level among healthy collegiate males. Eur. J. Sport Sci. 2021, 1–10. [Google Scholar] [CrossRef]
- Schleh, M.W.; Pitchford, L.M.; Gillen, J.B.; Horowitz, J.F. Energy deficit required for exercise-induced improvements in glycemia the next day. Med. Sci. Sports Exerc. 2020, 52, 976–982. [Google Scholar] [CrossRef]
- Campbell, B.I.; Aguilar, D.; Colenso-Semple, L.M.; Hartke, K.; Fleming, A.R.; Fox, C.D.; Longstrom, J.M.; Rogers, G.E.; Mathas, D.B.; Wong, V.; et al. Intermittent energy restriction attenuates the loss of fat free mass in resistance trained individuals. A randomized controlled trial. J. Funct. Morphol. Kinesiol. 2020, 5, 19. [Google Scholar] [CrossRef] [PubMed] [Green Version]
- Johansson, H.E.; Edholm, D.; Kullberg, J.; Rosqvist, F.; Rudling, M.; Straniero, S.; Karlsson, F.A.; Ahlstrom, H.; Sundbom, M.; Riserus, U. Energy restriction in obese women suggest linear reduction of hepatic fat content and time-dependent metabolic improvements. Nutr. Diabetes 2019, 9, 34. [Google Scholar] [CrossRef]
- De Andrade, P.B.; Neff, L.A.; Strosova, M.K.; Arsenijevic, D.; Patthey-Vuadens, O.; Scapozza, L.; Montani, J.P.; Ruegg, U.T.; Dulloo, A.G.; Dorchies, O.M. Caloric restriction induces energy-sparing alterations in skeletal muscle contraction, fiber composition and local thyroid hormone metabolism that persist during catch-up fat upon refeeding. Front. Physiol. 2015, 6, 254. [Google Scholar] [CrossRef]
- Arai, T.; Kim, H.J.; Hirako, S.; Nakasatomi, M.; Chiba, H.; Matsumoto, A. Effects of dietary fat energy restriction and fish oil feeding on hepatic metabolic abnormalities and insulin resistance in kk mice with high-fat diet-induced obesity. J. Nutr. Biochem. 2013, 24, 267–273. [Google Scholar] [PubMed] [Green Version]


| Items | Included after Recruitment | ||||
|---|---|---|---|---|---|
| Total | IERG | CERG | t-Value | Sig | |
| Recruited (Female) | 26 (22) | 12 (11) | 14 (11) | ||
| Analyzed (Female) | 18 (14) | 8 (7) | 10 (7) | ||
| Lost rate | 30.8% | 33.3% | 28.6% | ||
| Age | 31.3 (6.3) | 34.3 (5.1) | 29.0 (6.4) | 2.358 | 0.031 * |
| BH (cm) | 165.4 (7.8) | 163.3 (6.0) | 167.1 (8.9) | −2.506 | 0.023 * |
| BW (kg) | 65.2 (11.2) | 63.0 (8.5) | 67.0 (13.1) | −2.015 | 0.061 |
| BMI (kg/m2) | 23.8 (3.2) | 23.7 (3.2) | 23.9 (3.3) | −0.740 | 0.470 |
| RMR (kcal) | 1404.0 (230.7) | 1340.0 (163.2) | 1455.2 (270.6) | −2.018 | 0.061 |
| Group | BW | BMI | RMR | |||||||||
|---|---|---|---|---|---|---|---|---|---|---|---|---|
| Baseline | Endpoint | t | Sig | Baseline | Endpoint | t | Sig | Baseline | Endpoint | t | Sig | |
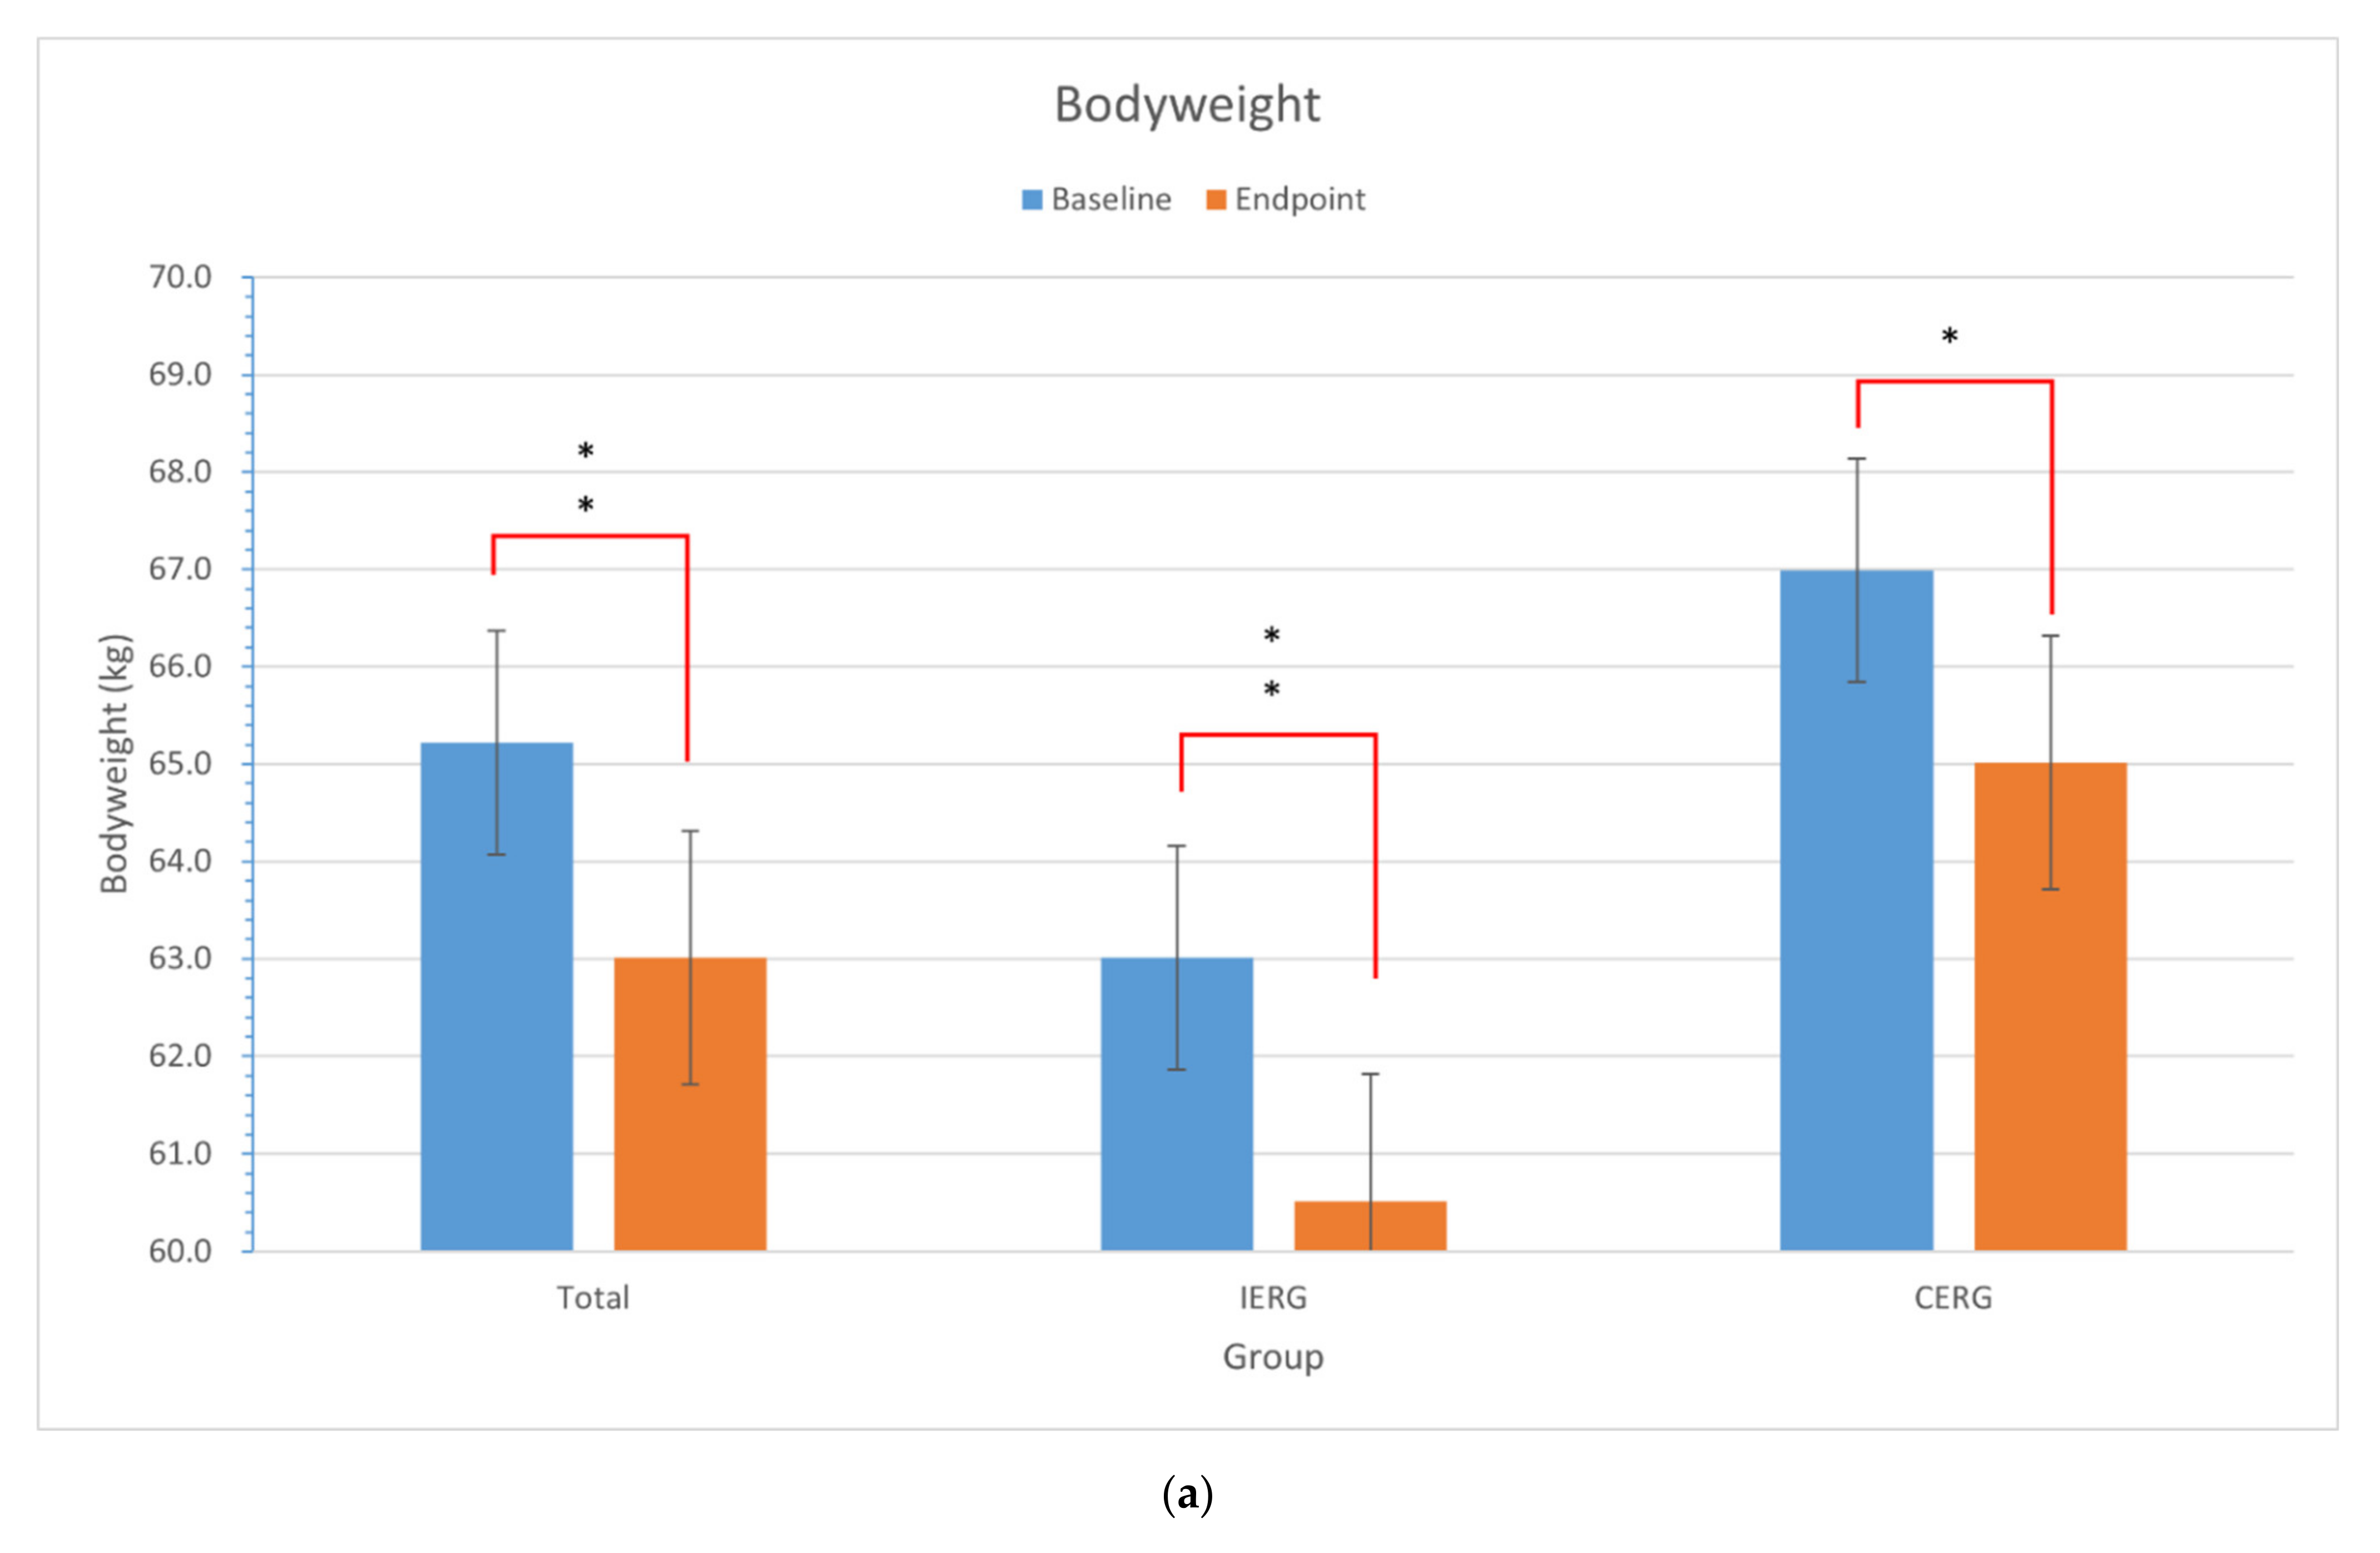
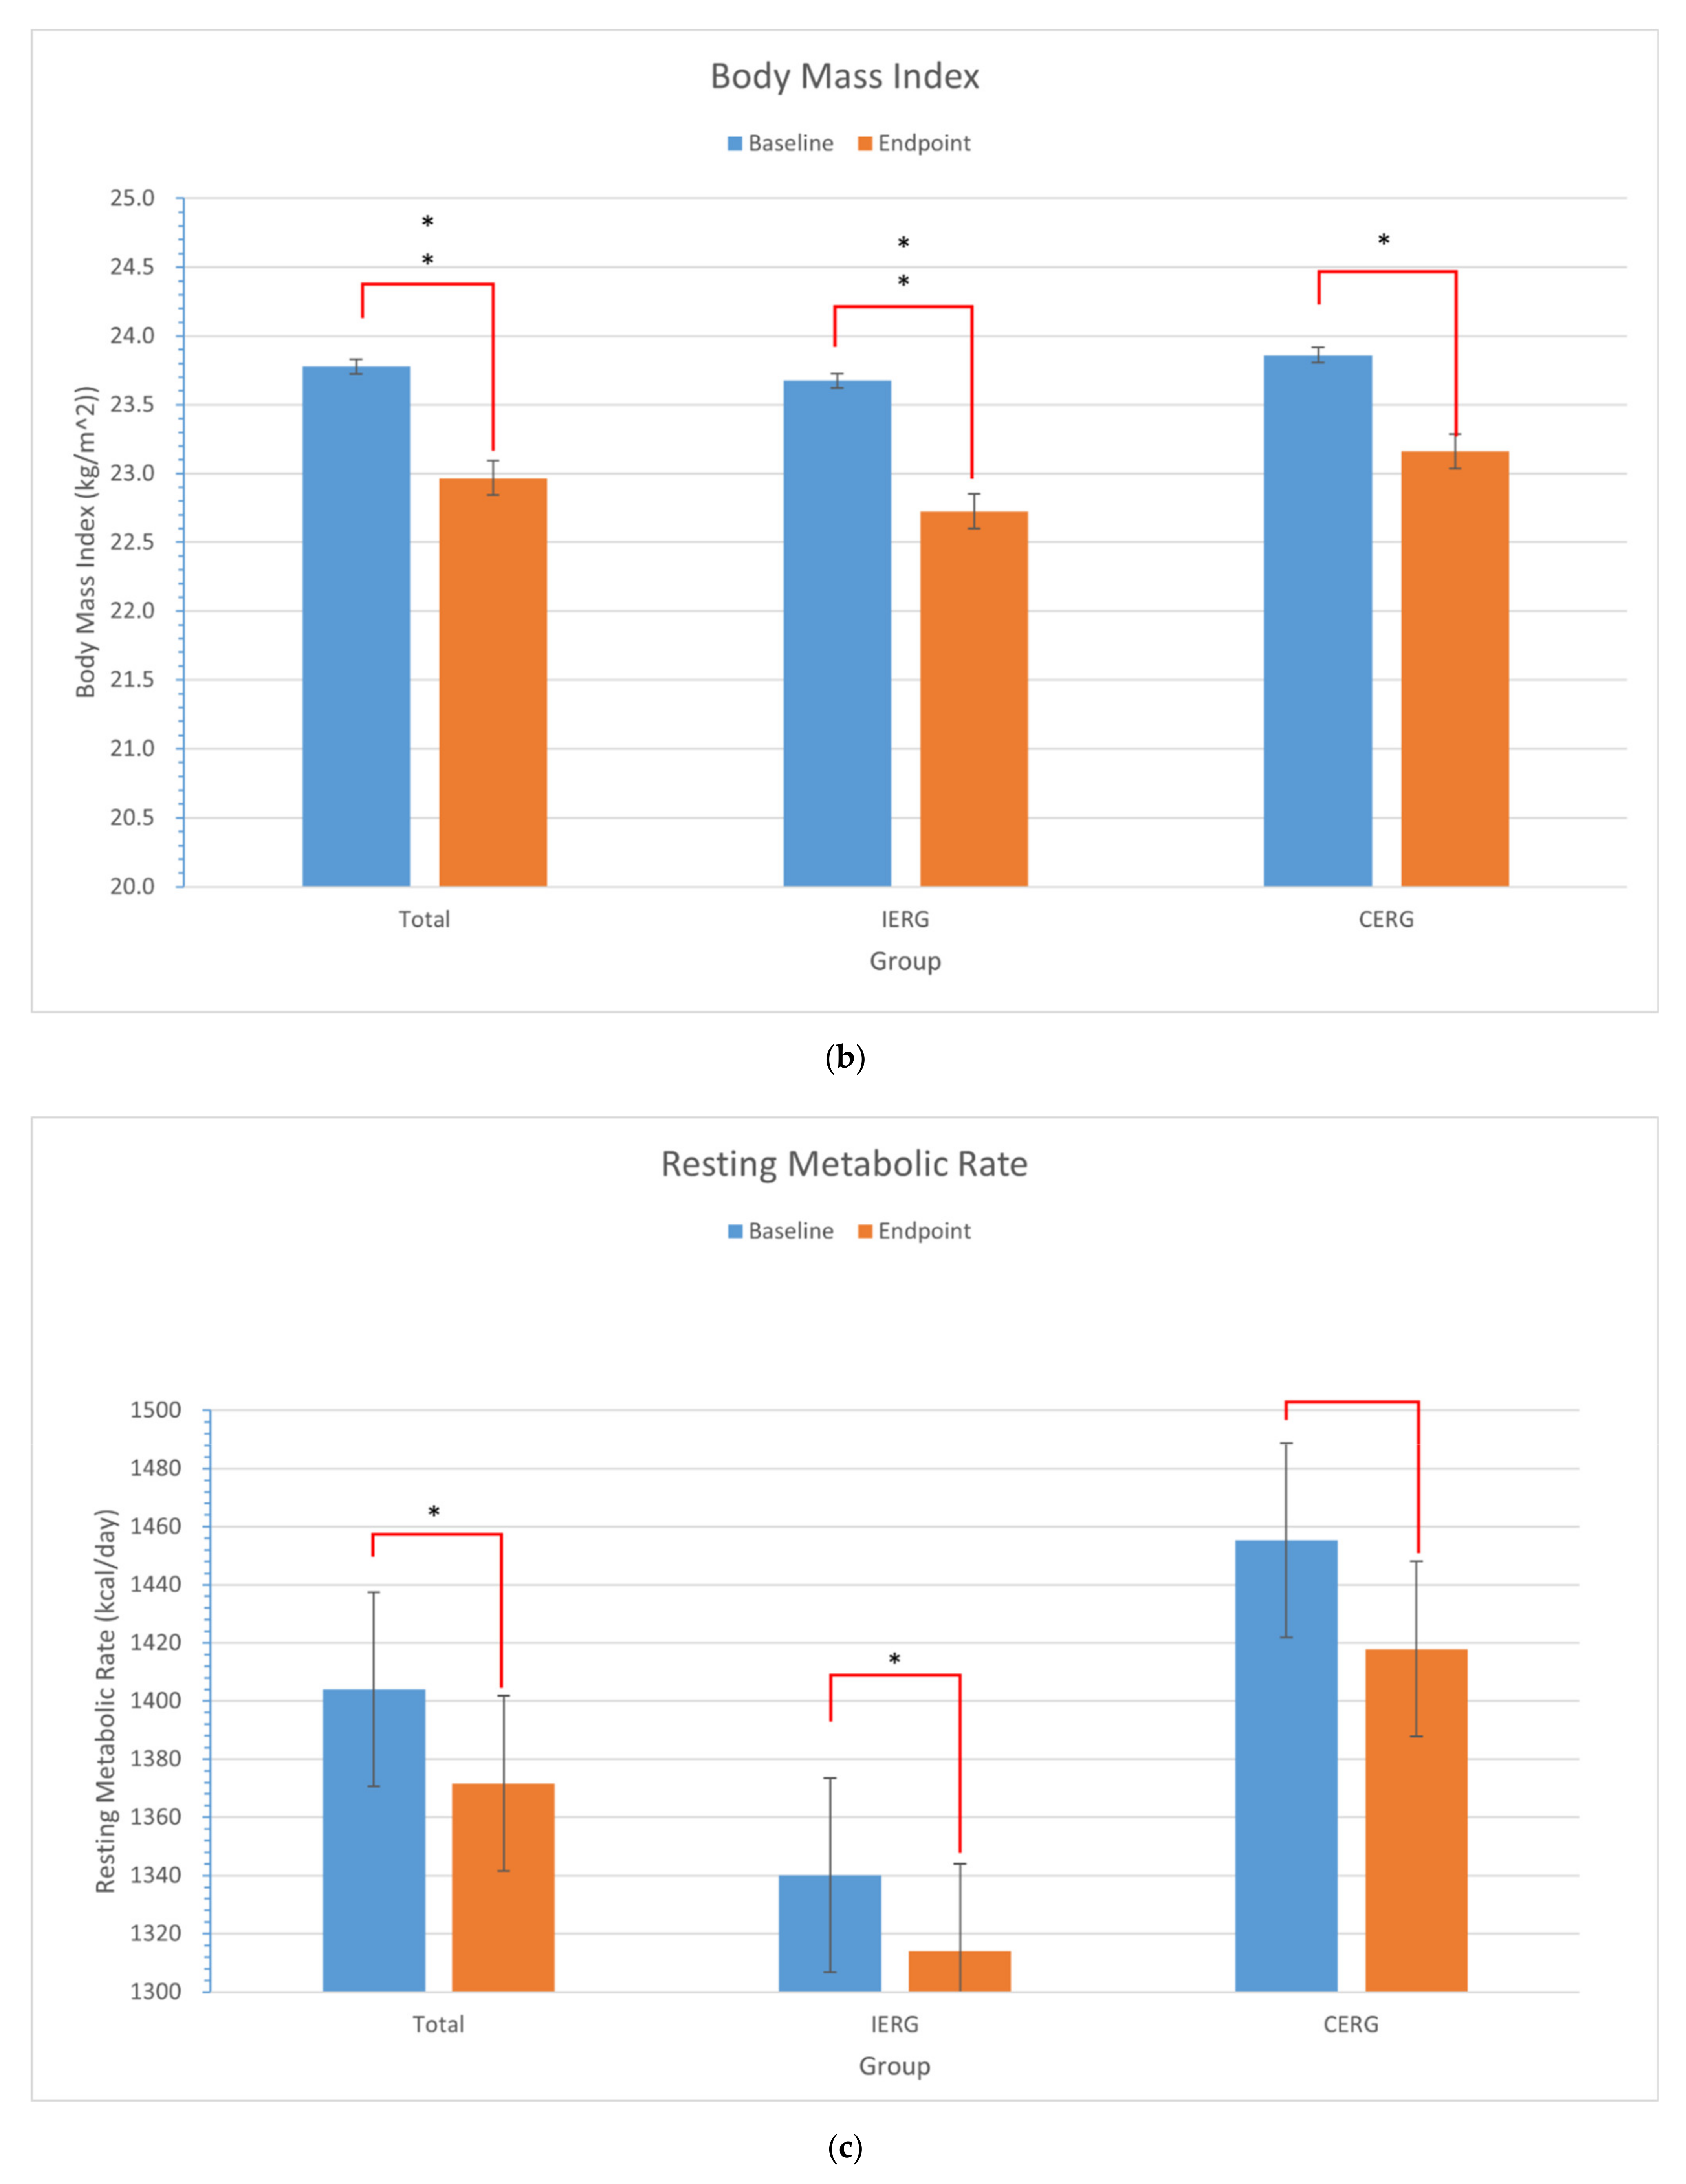
| IERG (n = 8) | 63.01 (8.46) | 60.51 (8.78) | 6.859 | 0.000 ** | 23.68 (3.19) | 22.73 (3.32) | 6.971 | 0.000 ** | 1339.98 (163.14) | 1314.01 (156.79) | 4.485 | 0.003 * |
| CERG (n = 10) | 66.99 (13.09) | 65.01 (11.75) | 2.294 | 0.047 * | 23.86 (3.28) | 23.16 (2.82) | 2.384 | 0.041 * | 1455.23 (270.64) | 1417.84 (225.67) | 1.679 | 0.128 |
| Total (n = 18) | 65.22 (11.15) | 63.01 (10.50) | 4.446 | 0.000 ** | 22.78(3.15) | 22.97 (2.97) | 4.709 | 0.000 ** | 1401.01 (230.67) | 1371.69 (199.75) | 2.604 | 0.019 * |
| Items | Group | N | M/MD | SD | Variance Homogeneity | t Test | Statistical Power | |||
|---|---|---|---|---|---|---|---|---|---|---|
| F | Sig | Mean Difference | t | Sig | 1-β | |||||
| Total Energy Intake (kcal) | IERG | 10 | 28,064 | 6634 | 1.113 | 0.307 | −10,664 | −3.058 | 0.008 * | 0.78 |
| CERG | 8 | 38,728 | 8180 | |||||||
| Total EAT (kcal) | IERG | 10 | 7759 | 3296 | 3.993 | 0.063 | −4653 | −2.372 | 0.031 * | 0.63 |
| CERG | 8 | 12,413 | 5011 | |||||||
| Total Energy Deficiency (kcal) | IERG | 10 | 29,408 | 12,352 | 0.072 | 0.792 | −4717 | −0.875 | 0.359 | 0.78 |
| CERG | 8 | 34,125 | 9956 | |||||||
| Change in BW (kg) | IERG | 10 | 2.30 | 1.03 | 2.247 | 0.153 | 0.188 | 0.180 | 0.859 | 0.92 |
| CERG | 8 | 2.11 | 3.10 | |||||||
| Change in BMI (kg/m2) | IERG | 10 | 0.88 | 0.39 | 2.143 | 0.163 | 0.168 | 0.466 | 0.647 | 0.88 |
| CERG | 8 | 0.71 | 1.06 | |||||||
| Change in RMR (kcal) | IERG | 10 | 25.95 | 16.79 | 3.082 | 0.098 | −14.30 | 0.561 | 0.582 | 0.85 |
| CERG | 8 | 40.35 | 78.95 | |||||||
| Items | Group | N | Mean | SD | Variance Homogeneity | t test | Statistical Power | |||
|---|---|---|---|---|---|---|---|---|---|---|
| F | Sig | Mean Difference | t | Sig | 1-β | |||||
| VD | IERG | 10 | 26.40 | 2.72 | 7.571 | 0.014 * | −1.475 | −1.699 | 0.122 | 0.67 |
| CERG | 8 | 27.88 | 0.35 | |||||||
| Group | Items | Age | BBH | BBW | BBMI | BMIC | BRMR | R | TCH | TP | TF | TE | TEAT | TED | DCH | DP | DF | DEI | DEAT | DED | PCBMI |
|---|---|---|---|---|---|---|---|---|---|---|---|---|---|---|---|---|---|---|---|---|---|
| IERG | BMIC | −0.07 | −0.06 | −0.37 | −0.35 | 1.00 | −0.11 | 0.51 * | 0.11 | 0.31 | −0.57 * | −0.48 | −0.01 | 0.26 | −0.13 | −0.09 | −0.72 * | −0.65 * | −0.11 | 0.20 | 0.98 |
| PCBMI | 0.00 | −0.01 | −0.47 | −0.47 | 0.98 | −0.21 | 0.53 * | 0.12 | 0.34 | −0.59 * | −0.48 | −0.02 | 0.19 | −0.12 | −0.08 | −0.73 * | −0.64 * | −0.12 | 0.12 | 1.00 | |
| CERG | BMIC | −0.59 * | 0.09 | 0.51 * | 0.63 | 1.00 | 0.68 * | −0.05 | 0.37 | −0.11 | −0.31 | 0.00 | 0.04 | 0.58 * | 0.44 | −0.11 | −0.36 | 0.01 | 0.04 | 0.62 * | 0.98 |
| PCBMI | −0.52 * | 0.00 | 0.38 | 0.51 | 0.98 | 0.55 * | −0.15 | 0.28 | −0.18 | −0.37 | −0.09 | 0.03 | 0.50 * | 0.37 | −0.16 | −0.39 | −0.05 | 0.04 | 0.55 * | 1.00 | |
| Total | BMIC | −0.34 | 0.01 | 0.31 | 0.36 | 1.00 | 0.48 | 0.06 | 0.12 | −0.14 | −0.38 | −0.14 | −0.02 | 0.51 * | 0.11 | −0.17 | −0.44 | −0.17 | −0.03 | 0.54 * | 0.97 |
| PCBMI | −0.22 | −0.07 | 0.13 | 0.19 | 0.97 | 0.30 | 0.02 | −0.01 | −0.23 | −0.48 | −0.26 | −0.05 | 0.44 | −0.02 | −0.25 | −0.53 * | −0.29 | −0.06 | 0.47 | 1.00 |
| Group | Classification | Subgroups | N | C (g) | p (g) | F (g) | DEI (kcal) | EAT (kcal) | DED (kcal) | ||||||
|---|---|---|---|---|---|---|---|---|---|---|---|---|---|---|---|
| MD | Sig | MD | Sig | MD | Sig | MD | Sig | MD | Sig | MD | Sig | ||||
| IERG | Energy Intake | VD | 104 | −43.05 | 0.000 ** | −14.91 | 0.000 ** | −19.56 | 0.000 ** | −459.87 | 0.000 ** | −44.22 | 0.206 | 345.78 | 0.000 ** |
| IVD | 113 | ||||||||||||||
| Exercise | ED | 167 | 1.45 | 0.838 | 2.07 | 0.565 | 1.39 | 0.665 | 9.96 | 0.880 | 383.39 | 0.000 ** | 448.56 | 0.000 ** | |
| NED | 50 | ||||||||||||||
| CERG | Energy Intake | VD | 218 | −59.54 | 0.000 ** | −17.94 | 0.010 * | −18.91 | 0.000 ** | −523.14 | 0.000 ** | 275.53 | 0.000 ** | 865.99 | 0.000 ** |
| IVD | 24 | ||||||||||||||
| Exercise | ED | 195 | −8.14 | 0.303 | 3.75 | 0.346 | −3.69 | 0.205 | −34.38 | 0.575 | 477.37 | 0.000 ** | 544.75 | 0.000 ** | |
| NED | 47 | ||||||||||||||
| Total | Energy Intake | VD | 332 | −10.37 | 0.060 * | −2.38 | 0.43 | −9.74 | 0.000 ** | −182.77 | 0.000 ** | 85.60 | 0.010 * | 307.04 | 0.000 ** |
| IVD | 137 | ||||||||||||||
| Exercise | ED | 362 | −0.36 | 0.950 | 3.98 | 0.190 | −0.53 | 0.810 | 8.92 | 0.860 | 434.40 | 0.000 ** | 486.39 | 0.000 ** | |
| NED | 97 | ||||||||||||||
| Group | Items | CH | Protein | Fat | DEI | EAT | DED |
|---|---|---|---|---|---|---|---|
| IERG | CH | 1.000 | |||||
| Protein | 0.215 | 1.000 | |||||
| Fat | 0.326 | 0.451 | 1.000 | - | |||
| DEI | 0.639 * | 0.577 * | 0.854 * | 1.000 | |||
| EAT | 0.009 | 0.087 | 0.186 | 0.149 | 1.000 | ||
| DED | −0.482 | −0.445 | −0.478 | −0.677 * | 0.506 * | 1.000 | |
| CERG | C | 1.000 | |||||
| P | 0.283 | 1.000 | |||||
| F | 0.154 | 0.440 | 1.000 | - | |||
| DEI | 0.638 * | 0.760 * | 0.667 * | 1.000 | |||
| EAT | 0.041 | 0.290 | 0.048 | 0.216 | 1.000 | ||
| DED | −0.341 | −0.102 | −0.347 | −0.357 | 0.759 * | 1.000 | |
| Total | CH | 1.000 | |||||
| Protein | 0.283 | 1.000 | |||||
| Fat | 0.154 | 0.440 | 1.000 | - | |||
| DEI | 0.638 * | 0.760 * | 0.667 * | 1.000 | |||
| EAT | 0.041 | 0.290 | 0.048 | 0.216 | 1.000 | ||
| DED | −0.341 | −0.102 | −0.347 | −0.357 | 0.759 * | 1.000 |
| Group | Dependent | Variables | Adjusted R2 | Constant | Coefficient | ||
|---|---|---|---|---|---|---|---|
| Constant | Sig | B | Sig | ||||
| IERG | PCBMI (%) | R | 0.157 | −11.316 | 0.310 | 0.565 | 0.180 |
| TF | 0.234 | 9.278 | 0.021 * | −0.005 | 0.127 | ||
| DF | 0.459 | 10.319 | 0.005 * | −0.172 | 0.039 * | ||
| DEI | 0.316 | 11.473 | 0.020 * | −0.008 | 0.085 | ||
| DED (kcal) | DEI | 0.833 | 1824.660 | 0.000 ** | −0.982 | 0.000 ** | |
| EAT | 1.239 | 0.000 ** | |||||
| CERG | PCBMI (%) | Age | 0.416 | 3.809 | 0.664 | −0.244 | 0.163 |
| BBMI | −0.722 | 0.339 | |||||
| BRMR | 0.015 | 0.183 | |||||
| TED | 0.032 | 0.102 | |||||
| DED | −0.001 | 0.105 | |||||
| DED (kcal) | EAT | 0.574 | 648.899 | 0.000 ** | 1.033 | 0.000 ** | |
| Total | PCBMI (%) | DF | 0.240 | 9.660 | 0.002 * | −0.152 | 0.022 * |
| DED (kcal) | DEI | 0.813 | 1649.280 | 0.000 ** | −0.794 | 0.000 ** | |
| EAT | 1.232 | 0.000 ** | |||||
Publisher’s Note: MDPI stays neutral with regard to jurisdictional claims in published maps and institutional affiliations. |
© 2021 by the authors. Licensee MDPI, Basel, Switzerland. This article is an open access article distributed under the terms and conditions of the Creative Commons Attribution (CC BY) license (https://creativecommons.org/licenses/by/4.0/).
Share and Cite
Xu, M.; Li, J.; Zou, Y.; Xu, Y. The Comparison of the Effects between Continuous and Intermittent Energy Restriction in Short-Term Bodyweight Loss for Sedentary Population: A Randomized, Double-Blind, Controlled Trial. Int. J. Environ. Res. Public Health 2021, 18, 11645. https://0-doi-org.brum.beds.ac.uk/10.3390/ijerph182111645
Xu M, Li J, Zou Y, Xu Y. The Comparison of the Effects between Continuous and Intermittent Energy Restriction in Short-Term Bodyweight Loss for Sedentary Population: A Randomized, Double-Blind, Controlled Trial. International Journal of Environmental Research and Public Health. 2021; 18(21):11645. https://0-doi-org.brum.beds.ac.uk/10.3390/ijerph182111645
Chicago/Turabian StyleXu, Manwen, Ji Li, Yan Zou, and Yining Xu. 2021. "The Comparison of the Effects between Continuous and Intermittent Energy Restriction in Short-Term Bodyweight Loss for Sedentary Population: A Randomized, Double-Blind, Controlled Trial" International Journal of Environmental Research and Public Health 18, no. 21: 11645. https://0-doi-org.brum.beds.ac.uk/10.3390/ijerph182111645