
Influence of the Pedagogical Model and Experience on the Internal and External Task Load in School Basketball


Abstract
:1. Introduction
2. Materials and Methods
2.1. Design
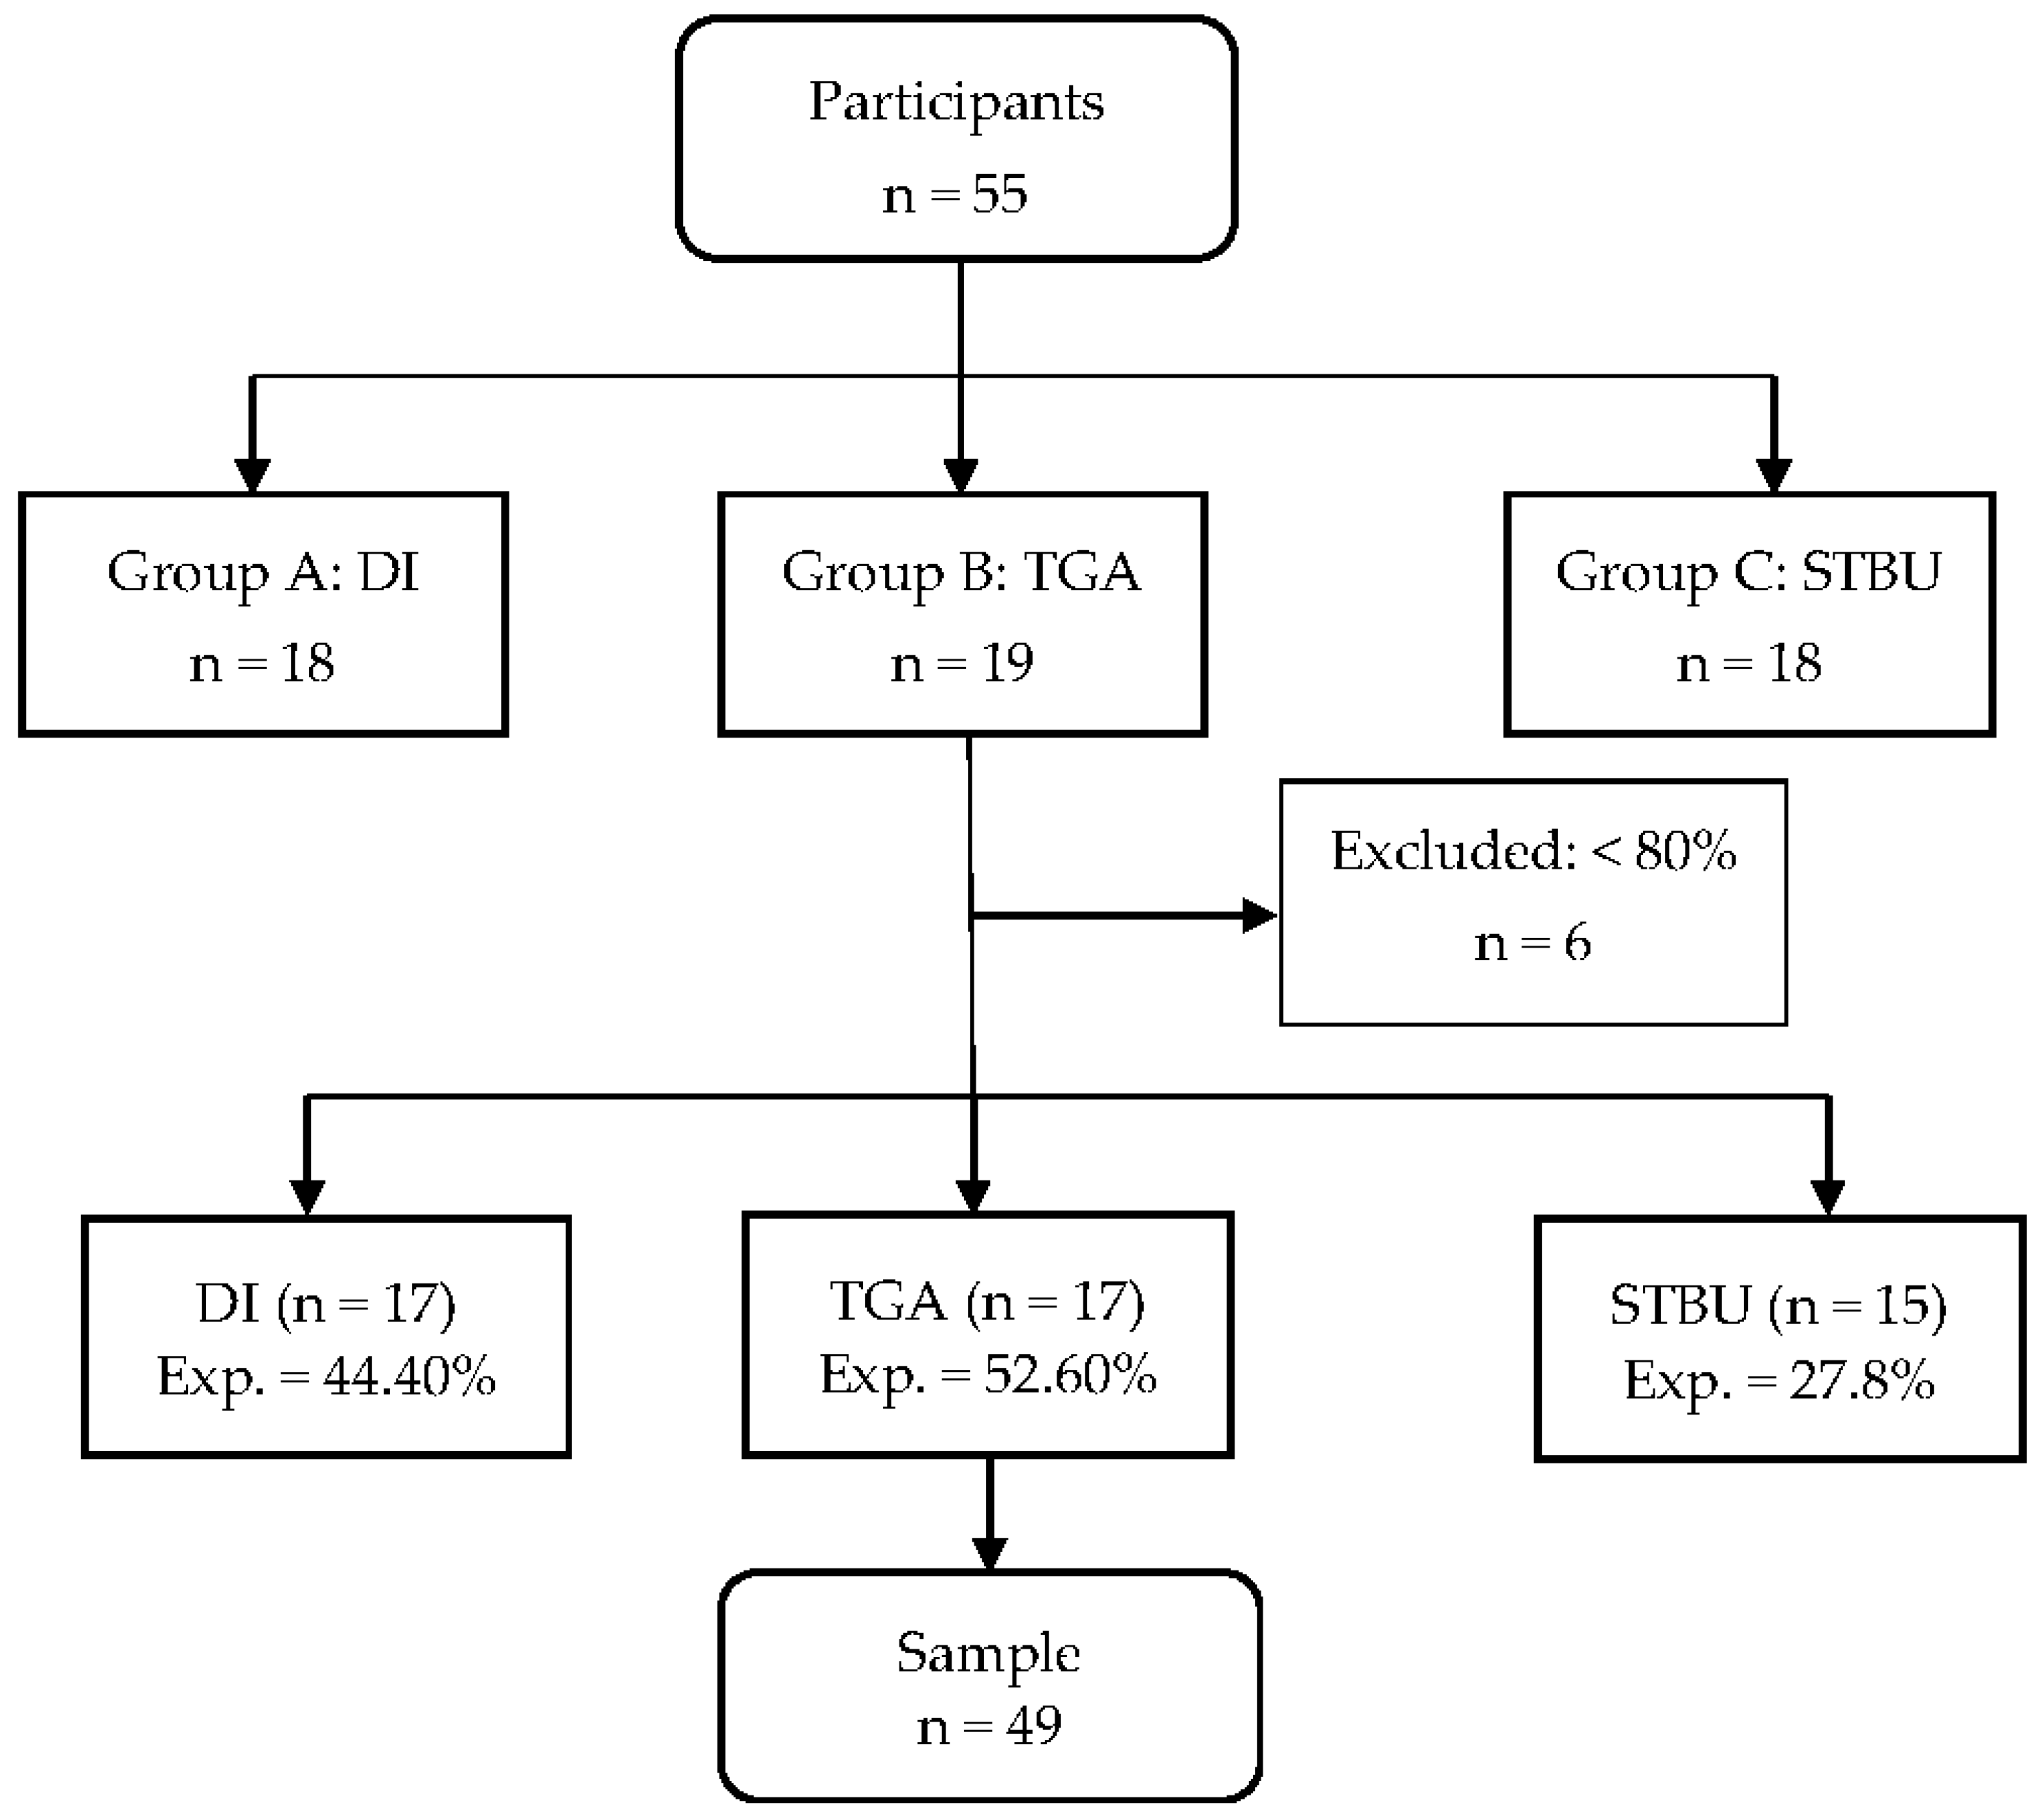
2.2. Sample
2.3. Variables
2.4. Instruments
2.5. Procedure
2.5.1. Prior Planning
2.5.2. Intervention
2.5.3. Data Processing
2.6. Statistical Analysis
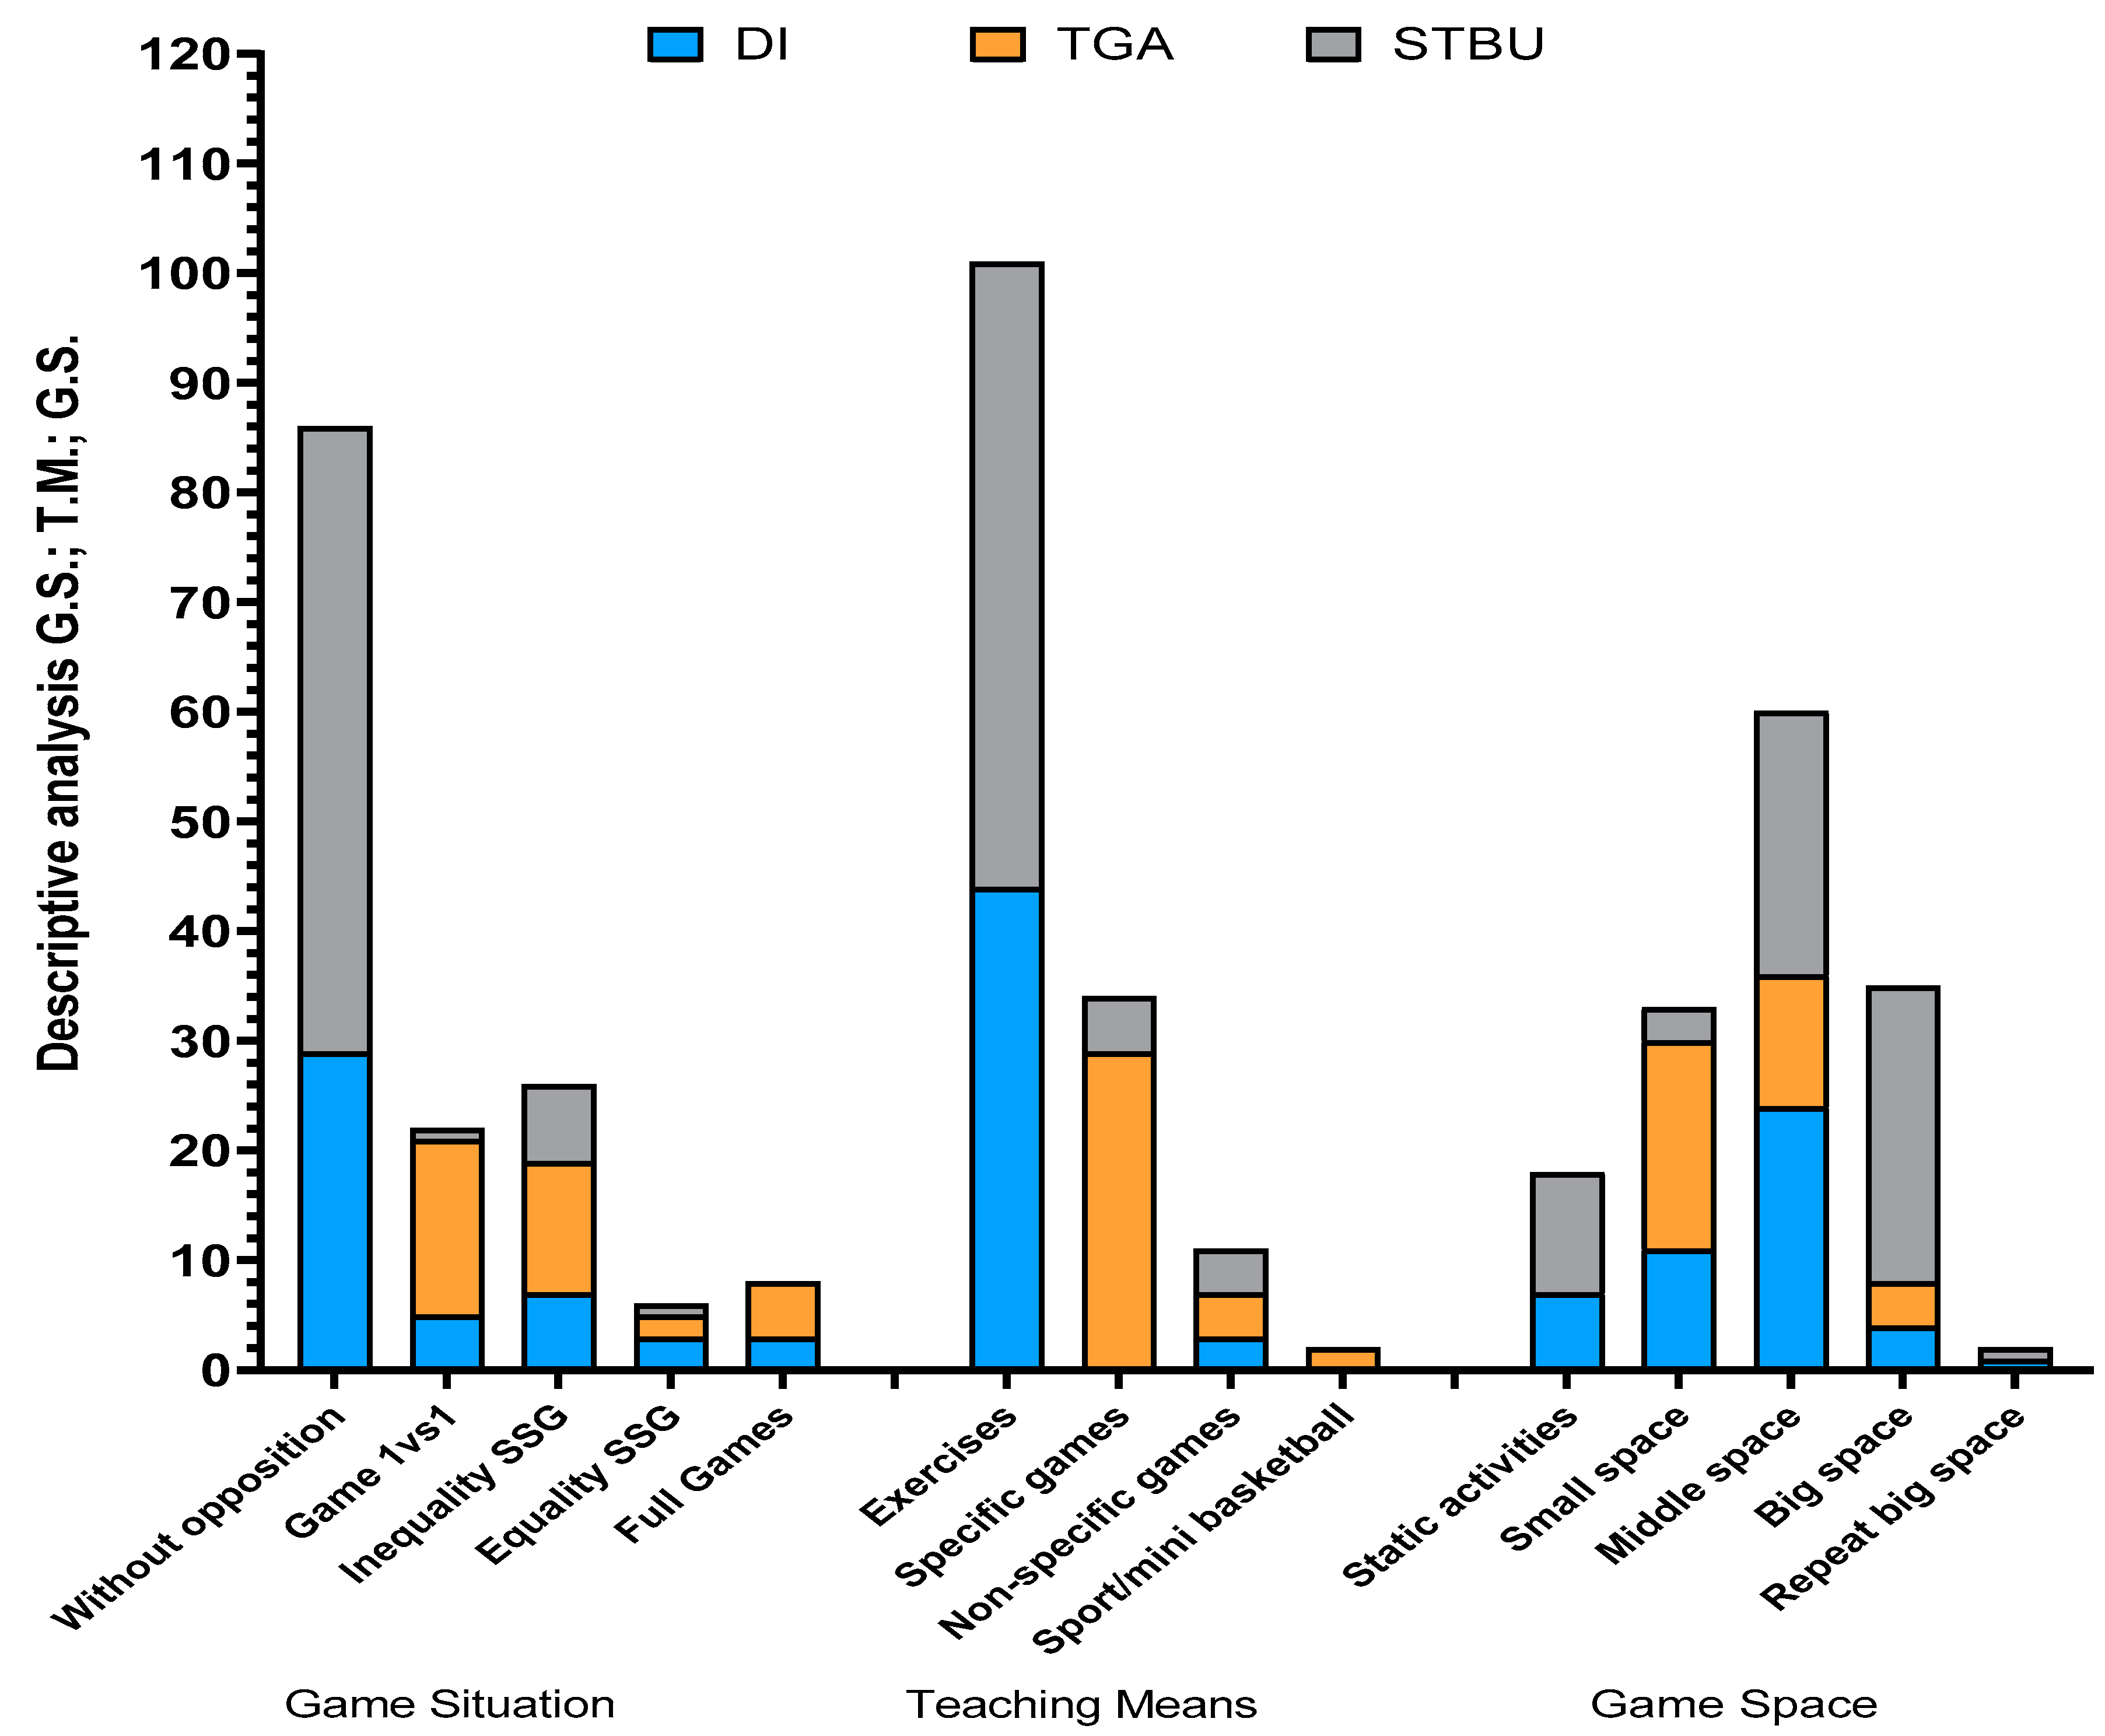
3. Results
4. Discussion
5. Conclusions
5.1. Practical Application
5.2. Strengths and Limitations
Author Contributions
Funding
Institutional Review Board Statement
Informed Consent Statement
Data Availability Statement
Acknowledgments
Conflicts of Interest
References
- Amigo, I.; Zapico, R.; Herrero, J.; Fernández, C. Actividad física, ocio sedentario, falta de sueño y sobrepeso infantil. PST 2008, 20, 516–520. [Google Scholar]
- Zhu, S.; Zhuang, Y.; Ip, P. Impacts on Children and Adolescents’ Lifestyle, Social Support and Their Association with Negative Impacts of the COVID-19 Pandemic. Int. J. Environ. Res. Public Health 2021, 18, 4780. [Google Scholar] [CrossRef]
- Global Atlas on Childhood Obesity. Available online: https://www.worldobesity.org/membersarea/global-atlas-on-childhood-obesity (accessed on 20 October 2021).
- Sperlich, B.; Zinner, C.; Heilemann, I.; Kjendlie, P.-L.; Holmberg, H.-C.; Mester, J. High-Intensity Interval Training Improves VO 2peak, Maximal Lactate Accumulation, Time Trial and Competition Performance in 9–11-Year-Old Swimmers. Eur. J. Appl. Physiol. 2010, 110, 1029–1036. [Google Scholar] [CrossRef] [PubMed] [Green Version]
- Strand, B.N.; Scantling, E.; Johnson, M. Fitness Education: Teaching Concepts-Based Fitness in the Schools; Gorsuch Scarisbrick Publishers: Scottsdale, AZ, USA, 1997. [Google Scholar]
- González-Espinosa, S.; Antúnez, A.; Feu, S.; Ibáñez, S.J. Monitoring the External and Internal Load Under 2 Teaching Methodologies. J. Strength Cond. Res. 2020, 34, 2920–2928. [Google Scholar] [CrossRef] [PubMed]
- Slingerland, M.; Haerens, L.; Cardon, G.; Borghouts, L. Differences in Perceived Competence and Physical Activity Levels during Single-Gender Modified Basketball Game Play in Middle School Physical Education. Eur. Phys. Educ. Rev. 2014, 20, 20–35. [Google Scholar] [CrossRef]
- Cañadas, M.; Ibáñez, S.J. Planning the contents of training in early age basketball teams. Rev. Cienc. Deporte 2010, 6, 49–65. [Google Scholar]
- Cecchini, J.A. Physical Education and Curriculum. In Didactics of Physical Education in Primary Education; Fernández, E., Cecchini, J.A., Zagalaz, M.L., Eds.; Síntesis: Madrid, Spain, 2002. [Google Scholar]
- Ibáñez, S.J.; Feu, S.; Cañadas, M.; González Espinosa, S.; García Rubio, J. Estudio de Los Indicadores de Rendimiento de Aprendizaje Tras La Implementación de Un Programa de Intervención Tradicional y Alternativo Para La Enseñanza Del Baloncesto. Kronos 2016, 15, 1–12. [Google Scholar]
- Feu, S.; García-Rubio, J.; Gamero, M.G.; Ibáñez, S.J. Task Planning for Sports Learning by Physical Education Teachers in the Pre-Service Phase. PLoS ONE 2019, 14, e0212833. [Google Scholar] [CrossRef] [PubMed]
- Metzler, M.W. Instructional Models for Physical Education; Holocomb Hathaway: Scottsdale, AZ, USA, 2011; ISBN 978-1-934432-13-6. [Google Scholar]
- Cañadas, M.; Ibáñez, S.J.; García, J.; Parejo, I.; Feu, S. Game Situations in Youth Basketball Practices. Rev. Int. Med. Cienc. Act. Física Deporte 2013, 13, 41–54. [Google Scholar]
- Balakrishnan, M.; Rengasamy, S.; Aman, M.S. Effect of Teaching Games for Understanding Approach on Students’ Cognitive Learning Outcome. Int. Sch. Sci. Res. Innov. 2011, 5, 714–716. [Google Scholar]
- Ibáñez, S.J.; Jiménez, A.; Antúnez, A. Differences in Basketball Training Loads between Comprehensive and Technical Models of Teaching/Training. Rev. Psicol. Deporte 2015, 24, 47–50. [Google Scholar]
- Reina, M.; García-Rubio, J.; Ibáñez, S.J. Training and Competition Load in Female Basketball: A Systematic Review. Int. J. Environ. Res. Public Health 2020, 17, 2639. [Google Scholar] [CrossRef] [Green Version]
- Bronikowski, M.; Bronikowska, M.; Kantanista, A.; Ciekot, M.; Laudanska-Krzeminska, I.; Szwed, S. Health-Related Intensity Profiles of Physical Education Classes at Different Phases of the Teaching/Learning Process. Biomed. Hum. Kinet. 2009, 1, 86–91. [Google Scholar] [CrossRef] [Green Version]
- Yuste, J.L.; García-Jiménez, J.V.; García-Pellicer, J.J. Intensity of Physical Education Classes in Adolescents. Rev. Int. Med. Cienc. Act. Física Deporte 2015, 15, 309–323. [Google Scholar] [CrossRef] [Green Version]
- Harvey, S.; Song, Y.; Baek, J.H.; Van Der Mars, H. Two Sides of the Same Coin: Student Physical Activity Levels during a Game-Centred Soccer Unit. Eur. Phys. Educ. Rev. 2016, 22, 411–429. [Google Scholar] [CrossRef]
- Casey, A. Models-Based Practice: Great White Hope or White Elephant? Phys. Educ. Sport Pedag. 2014, 19, 18–34. [Google Scholar] [CrossRef] [Green Version]
- Oliver, K.L.; Oesterreich, H.A. Student-Centred Inquiry as Curriculum as a Model for Field-Based Teacher Education. J. Curric. Stud. 2013, 45, 394–417. [Google Scholar] [CrossRef]
- Joo, C.H.; Hwang-Bo, K.; Jee, H. Technical and Physical Activities of Small-Sided Games in Young Korean Soccer Players. J. Strength Cond. Res. 2016, 30, 2164–2173. [Google Scholar] [CrossRef]
- Buchheit, M.; Lacome, M.; Cholley, Y.; Simpson, B. Neuromuscular Responses to Conditioned Soccer Sessions Assessed via GPS-Embedded Accelerometers: Insights into Tactical Periodization. Int. J. Sports Physiol. Perform. 2018, 13, 577–583. [Google Scholar] [CrossRef]
- McLaren, S.J.; Macpherson, T.W.; Coutts, A.J.; Hurst, C.; Spears, I.R.; Weston, M. The Relationships between Internal and External Measures of Training Load and Intensity in Team Sports: A Meta-Analysis. Sports Med. 2017, 48, 41–58. [Google Scholar] [CrossRef] [Green Version]
- Ibáñez, S.J.; Feu, S.; Cañadas, M. Integral Analysis System of Training Tasks, SIATE, in Invasion Games. Rev. Cienc. Deporte 2016, 12, 3–30. [Google Scholar]
- García-Ceberino, J.M.G.; Gamero, M.G.; González-Espinosa, S.; García-Rubio, J.; Feu, S. Study of the external training load of tasks for the teaching of handball in pre-service teachers according to their genre. Rev. Cienc. Deporte 2018, 14, 45–54. [Google Scholar]
- García-Ceberino, J.M.; Gamero, M.G.; Reina, M.; Feu, S.; Ibánez, S.J. Study of External Load in Basketball Tasks Based on Game Phases. Retos Nuevas Tend. Educ. Física Deporte Recreación 2020, 37, 536–541. [Google Scholar] [CrossRef]
- Borg, G. Borg’s Perceived Exertion and Pain Scales; Human kinetics: Champaign, IL, USA, 1998. [Google Scholar]
- Lovell, T.W.; Sirotic, A.C.; Impellizzeri, F.M.; Coutts, A.J. Factors Affecting Perception of Effort (Session Rating of Perceived Exertion) during Rugby League Training. Int. J. Sports Physiol. Perform. 2013, 8, 62–69. [Google Scholar] [CrossRef] [PubMed] [Green Version]
- Reina, M.; Mancha-Triguero, D.; García-Santos, D.; García-Rubio, J.; Ibáñez, S.J. Comparison of Three Methods of Quantifying the Training Load in Basketball. Rev. Int. Cienc. Deporte 2019, 15, 368–382. [Google Scholar] [CrossRef]
- Gómez-Carmona, C.D.; Gamonales Puerto, J.M.; Feu, S.; Ibáñez, S.J. Study of internal and external load by different instruments. A case study in grassroots. Sportis 2019, 5, 444–468. [Google Scholar] [CrossRef] [Green Version]
- Miller, A. Games Centered Approaches in Teaching Children & Adolescents: Systematic Review of Associated Student Outcomes. J. Teach. Phys. Educ. 2015, 34, 36–58. [Google Scholar] [CrossRef]
- García-Ceberino, J.M.; Feu, S.; Gamero, M.G.; Ibáñez, S.J. Pedagogical Variables and Motor Commitment in the Planning of Invasion Sports in Primary Education. Sustainability 2021, 13, 4529. [Google Scholar] [CrossRef]
- García-Ceberino, J.M.; Feu, S.; Ibáñez, S.J. Comparative Study of Two Intervention Programmes for Teaching Soccer to School-Age Students. Sports 2019, 7, 74. [Google Scholar] [CrossRef] [PubMed] [Green Version]
- García-Ceberino, J.M.; Gamero, M.G.; Feu, S.; Ibáñez, S.J. Experience as a Determinant of Declarative and Procedural Knowledge in School Football. Int. J. Environ. Res. Public Health 2020, 17, 1063. [Google Scholar] [CrossRef] [Green Version]
- Gamero, M.G.; García-Ceberino, J.M.; Ibáñez, S.J.; Feu, S. Analysis of Declarative and Procedural Knowledge According to Teaching Method and Experience in School Basketball. Sustainability 2021, 13, 6012. [Google Scholar] [CrossRef]
- García-Ceberino, J.M.; Antúnez, A.; Feu, S.; Ibáñez, S.J. Quantification of Internal and External Load in School Football According to Gender and Teaching Methodology. Int. J. Environ. Res. Public Health 2020, 17, 344. [Google Scholar] [CrossRef] [Green Version]
- Ato, M.; Lopez, J.J.; Benavente, A. A Classification System for Research Designs in Psychology. Anal. Psicol. 2013, 29, 1038–1059. [Google Scholar] [CrossRef] [Green Version]
- González-Espinosa, S.; Ibáñez, S.J.; Feu, S. Design of Two Basketball Teaching Programs in Two Different Teaching Methods. Rev. Cienc. Deporte 2017, 13, 131–152. [Google Scholar]
- González-Espinosa, S.; Ibáñez, S.J.; Feu, S.; Galatti, L. Intervention Programs For Sports Education In The School Context, Petb And Peab: Preliminary Study. Retos Nuevas Tend. Educ. Física Deporte Recreación 2017, 31, 107–113. [Google Scholar] [CrossRef]
- Cañadas, M.; Gómez, M.; García-Rubio, J.; Ibáñez, S.J. Analysis of Training Plans in Basketball: Gender and Formation Stage Differences. J. Hum. Kinet. 2018, 62, 123–134. [Google Scholar] [CrossRef] [Green Version]
- Light, R.L.; Harvey, S.; Mouchet, A. Improving ‘at-Action’ Decision-Making in Team Sports through a Holistic Coaching Approach. Sport. Educ. Soc. 2014, 19, 258–275. [Google Scholar] [CrossRef]
- Reina, M.; García-Rubio, J.; Esteves, P.T.; Ibáñez, S.J. How External Load of Youth Basketball Players Varies According to Playing Position, Game Period and Playing Time. Int. J. Perform. Anal. Sport 2020, 20, 917–930. [Google Scholar] [CrossRef]
- Gómez-Carmona, C.D.; Bastida-Castillo, A.; Ibáñez, S.J.; Pino-Ortega, J. Accelerometry as a Method for External Workload Monitoring in Invasion Team Sports. A Systematic Review. PLoS ONE 2020, 15, e0236643. [Google Scholar] [CrossRef]
- Whaley, M.H.; Kaminsky, L.A.; Dwyer, G.B.; Getchell, L.H.; Norton, J.A. Predictors of over- and underachievement of age-predicted maximal heart rate. Med. Sci. Sports Exerc. 1992, 24, 1173–1179. [Google Scholar] [CrossRef]
- Eston, R.G.; Parfitt, C.G. Effort Perception. In Paediatric Exercise Physiology; Armstrong, N., Ed.; Elsevier: London, UK, 2007. [Google Scholar]
- Gamero, M.G.; González-Espinosa, S.; Ibáñez, S.J.; Feu, S. Instrument for Measurement of Declarative and Procedural Knowledge in Basketball. Rev. Int. Med. Cienc. Act. Física Deporte 2021, in press. [Google Scholar]
- Field, A. Discovering Statistics Using SPSS; Sage Publications: London, UK, 2009. [Google Scholar]
- Tomczak, M.; Tomczak, E. The Need to Report Effect Size Estimates Revisited. An Overview of Some Recommended Measures of Effect Size. Trends Sport Sci. 2014, 21, 19–25. [Google Scholar]
- Cohen, J. Statistical Power Analysis for the Behavioral Sciences, 2nd ed.; Erlbaum: Hillsdale, NJ, USA, 1988; ISBN 978-0-8058-0283-2. [Google Scholar]
- Lenhard, W.; Lenhard, A. Calculation of Effect Sizes; Psychometrica: Bibergau, Germany, 2015. [Google Scholar]
- Cárdenas, M.; Arancibia, H.A. Potencia estadística y cálculo del tamaño del efecto en G*Power: Complementos a las pruebas de significación estadística y su aplicación en psicología. Salud Soc. 2014, 5, 210–224. [Google Scholar] [CrossRef] [Green Version]
- Akubat, I.; Barrett, S.; Abt, G. Integrating the Internal and External Training Loads in Soccer. Int. J. Sports Physiol. Perform. 2014, 9, 457–462. [Google Scholar] [CrossRef] [PubMed]
- Dwyer, D.B.; Gabbett, T.J. Global Positioning System Data Analysis: Velocity Ranges and a New Definition of Sprinting for Field Sport Athletes. J. Strength Cond. Res. 2012, 26, 818–824. [Google Scholar] [CrossRef] [PubMed]
- Aoki, M.S.; Torres-Ronda, L.; Marcelino, P.R.; Drago, G.; Carling, C.; Bradley, P.S.; Moreira, A. Monitoring Training Loads in Professional Basketball Players Engaged in a Periodized Training Program. J. Strength Cond. Res. 2017, 31, 348–358. [Google Scholar] [CrossRef] [PubMed]
- Reilly, T.; Morris, T.; Whyte, G. The Specificity of Training Prescription and Physiological Assessment: A Review. J. Sport Sci. 2009, 27, 575–589. [Google Scholar] [CrossRef]
- Giacomini, D.S.; Soares, V.D.O.; Santos, H.F.; Matias, C.J.; Greco, P.J. O conhecimento tático declarativo e processual em jogadores de futebol de diferentes escalões. Motricidade 2011, 7, 43–53. [Google Scholar] [CrossRef] [Green Version]
- Gaudino, P.; Alberti, G.; Iaia, F.M. Estimated Metabolic and Mechanical Demands during Different Small-Sided Games in Elite Soccer Players. Hum. Mov. Sci. 2014, 36, 123–133. [Google Scholar] [CrossRef]
- Ingebrigtsen, J.; Dalen, T.; Hjelde, G.H.; Drust, B.; Wisløff, U. Acceleration and Sprint Profiles of a Professional Elite Football Team in Match Play. Eur. J. Sport Sci. 2014, 15, 101–110. [Google Scholar] [CrossRef] [PubMed]
- Torres-Ronda, L.; Gonçalves, B.; Marcelino, R.; Torrents, C.; Vicente, E.; Sampaio, J. Heart Rate, Time-Motion, and Body Impacts When Changing the Number of Teammates and Opponents in Soccer Small-Sided Games. J. Strength Cond. Res. 2015, 29, 2723–2730. [Google Scholar] [CrossRef] [PubMed]


| Study Variables | DI M ± SD | TGA M ± SD | STBU M ± SD | H | p | E2R | Pairwise Comparisons | |
|---|---|---|---|---|---|---|---|---|
| Kinematic eTL | dis(m) | 283.15 ± 150.90 | 373.94 ± 147.06 | 156.50 ± 88.46 | 821.02 | 0.00 * | 0.37 | TGA>DI*/TGA>STBU*/DI>STBU* |
| m/min | 37.54 ± 18.05 | 50.07 ± 18.60 | 40.54 ± 23.25 | 118.45 | 0.00 * | 0.05 | TGA>DI*/TGA>STBU* | |
| Nacc | 276.27 ± 79.61 | 280.72 ± 122.32 | 172.16 ± 111.30 | 672.59 | 0.00 * | 0.30 | TGA>STBU*/DI>STBU* | |
| acc/min | 37.99 ± 5.84 | 35.33 ± 4.11 | 38.01 ± 5.87 | 104.25 | 0.00 * | 0.05 | DI>TGA*/STBU>TGA* | |
| Ndec | 275.93 ± 79.50 | 280.61 ± 122.24 | 172.08 ± 111.37 | 671.24 | 0.00 * | 0.30 | TGA>STBU*/DI>STBU* | |
| dec/min | 37.94 ± 5.84 | 35.32 ± 4.10 | 37.98 ± 5.86 | 101.70 | 0.00 * | 0.05 | DI>TGA*/STBU>TGA* | |
| MAX Speed | 10.28 ± 3.40 | 12.50 ± 2.64 | 9.36 ± 3.54 | 308.54 | 0.00 * | 0.14 | TGA>DI*/TGA>STBU*/DI>STBU* | |
| AVG Speed | 3.46 ± 1.11 | 3.78 ± 0.80 | 3.37 ± 1.29 | 59.51 | 0.00 * | 0.03 | TGA>DI*/TGA>STBU* | |
| HIA % | 4.21 ± 7.32 | 7.53 ± 8.07 | 5.06 ± 9.61 | 176.98 | 0.00 * | 0.08 | TGA>DI*/TGA>STBU*/DI>STBU* | |
| walk % | 71.96 ± 21.54 | 66.66 ± 16.01 | 71.52 ± 25.50 | 39.91 | 0.00 * | 0.02 | DI>TGA*/STBU>TGA* | |
| jog % | 25.02 ± 19.17 | 27.22 ± 12.52 | 24.61 ± 21.37 | 19.72 | 0.00 * | 0.01 | TGA>DI*/TGA>STBU* | |
| run % | 2.99 ± 5.00 | 5.96 ± 6.63 | 3.74 ± 7.43 | 193.38 | 0.00 * | 0.09 | TGA>DI*/TGA>STBU*/DI>STBU* | |
| sprint % | 0.03 ± 0.35 | 0.16 ± 0.84 | 0.12 ± 1.05 | 43.86 | 0.00 * | 0.02 | TGA>DI*/TGA>STBU* | |
| Nsprints | 0.01 ± 0.11 | 0.11 ± 0.55 | 0.04 ± 0.34 | 28.67 | 0.00 * | 0.01 | TGA>DI*/TGA>STBU* | |
| Nsteps | 278.56 ± 181.93 | 396.64 ± 176.11 | 165.34 ± 113.59 | 650.85 | 0.00 * | 0.29 | TGA>DI*/TGA>STBU*/DI>STBU* | |
| steps/min | 36.81 ± 22.26 | 53.92 ± 25.08 | 43.23 ± 31.58 | 118.11 | 0.00 * | 0.05 | TGA>DI*/TGA>STBU* | |
| Njumps | 2.93 ± 3.42 | 3.61 ± 3.76 | 1.49 ± 2.47 | 224.01 | 0.00 * | 0.10 | TGA>DI*/TGA>STBU*/DI>STBU* | |
| jumps/min | 0.57 ± 0.42 | 0.57 ± 0.43 | 0.73 ± 0.61 | 16.81 | 0.00 * | 0.01 | STBU>TGA*/STBU>DI* | |
| Neuromuscular eTL | Nimpacts | 904.54 ± 499.55 | 1273.29 ± 458.24 | 497.31 ± 285.63 | 903.01 | 0.00 * | 0.41 | TGA>DI*/TGA>STBU*/DI>STBU* |
| PL | 4.92 ± 2.46 | 6.95 ± 2.57 | 2.99 ± 1.65 | 868.09 | 0.00 * | 0.39 | TGA>DI*/TGA>STBU*/DI>STBU* | |
| PL/min | 0.66 ± 0.28 | 0.93 ± 0.33 | 0.76 ± 0.42 | 184.52 | 0.00 * | 0.08 | TGA>DI*/TGA>STBU*/STBU>DI* | |
| iTL | HRmax | 164.46 ± 26.32 | 176.98 ± 18.35 | 162.46 ± 22.72 | 166.10 | 0.00 * | 0.08 | TGA>DI*/TGA>STBU*/DI>STBU* |
| AVG HR | 142.94 ± 24.21 | 157.12 ± 18.57 | 143.98 ± 23.42 | 160.12 | 0.00 * | 0.07 | TGA>DI*/TGA>STBU* | |
| Rel HR % | 72.82 ± 12.27 | 82.56 ± 8.19 | 78.50 ± 10.19 | 252.21 | 0.00 * | 0.12 | TGA>DI*/TGA>STBU*/STBU>DI* | |
| 50–60% HR | 11.61 ± 20.99 | 2.37 ± 7.15 | 6.66 ± 17.15 | 132.08 | 0.00 * | 0.06 | DI>TGA*/DI>STBU* | |
| 60–70% HR | 20.75 ± 24.22 | 8.94 ± 14.62 | 15.29 ± 21.89 | 84.52 | 0.00 * | 0.04 | DI>TGA*/DI>STBU*/STBU>TGA* | |
| 70–80% HR | 28.42 ± 25.71 | 23.76 ± 21.39 | 27.54 ± 25.55 | 4.56 | 0.11 | 0.00 | - | |
| 80–90% HR | 21.90 ± 24.21 | 36.83 ± 23.70 | 30.42 ± 26.88 | 134.00 | 0.00 * | 0.06 | TGA>DI*/TGA>STBU*/STBU>DI* | |
| 90–95% HR | 6.50 ± 13.34 | 17.07 ± 18.42 | 10.95 ± 16.20 | 177.59 | 0.00 * | 0.08 | TGA>DI*/TGA>STBU*/STBU>DI* | |
| 95–200% HR | 3.45 ± 12.38 | 9.69 ± 16.69 | 7.27 ± 15.58 | 126.38 | 0.00 * | 0.06 | TGA>DI*/TGA>STBU*/STBU>DI* | |
| Study Variables | DI M ± SD | TGA M ± SD | STBU M ± SD | H | p | E2R | Pairwise Comparisons | |
|---|---|---|---|---|---|---|---|---|
| Kinematic eTL | dis(m) | 260.44 ± 105.90 | 354.81 ± 101.61 | 346.03 ± 141.08 | 56.82 | 0.00 * | 0.14 | TGA>DI*/STBU>DI* |
| m/min | 42.37 ± 17.02 | 64.08 ± 11.96 | 57.54 ± 23.08 | 95.14 | 0.00 * | 0.23 | TGA>DI*/STBU>DI* | |
| Nacc | 219.01 ± 36.38 | 175.31 ± 23.03 | 208.24 ± 48.89 | 93.95 | 0.00 * | 0.23 | DI>TGA*/DI>STBU*/STBU>TGA* | |
| acc/min | 35.95 ± 5.91 | 32.63 ± 5.13 | 34.52 ± 7.88 | 30.61 | 0.00 * | 0.07 | DI>TGA*/DI>STBU* | |
| Ndec | 219.04 ± 36.55 | 175.21 ± 23.24 | 208.22 ± 49.03 | 94.09 | 0.00 * | 0.23 | DI>TGA*/DI>STBU*/STBU>TGA* | |
| dec/min | 35.95 ± 5.95 | 32.60 ± 5.10 | 34.52 ± 7.91 | 31.08 | 0.00 * | 0.07 | DI>TGA*/DI>STBU* | |
| MAX Speed | 9.61 ± 3.23 | 13.17 ± 1.86 | 12.19 ± 3.45 | 85.27 | 0.00 * | 0.20 | TGA>DI*/STBU>DI* | |
| AVG Speed | 3.20 ± 1.27 | 4.65 ± 1.48 | 4.22 ± 1.44 | 77.35 | 0.00 * | 0.19 | TGA>DI*/STBU>DI* | |
| HIA % | 4.49 ± 12.01 | 14.59 ± 19.83 | 11.20 ± 17.54 | 89.49 | 0.00 * | 0.22 | TGA>DI*/STBU>DI* | |
| walk % | 77.70 ± 25.31 | 52.89 ± 23.26 | 59.21 ± 23.68 | 79.32 | 0.00 * | 0.19 | DI>TGA*/DI>STBU* | |
| jog % | 18.87 ± 19.89 | 35.73 ± 12.64 | 32.36 ± 16.14 | 73.03 | 0.00 * | 0.18 | TGA>DI*/STBU>DI* | |
| run % | 3.42 ± 8.45 | 11.26 ± 15.85 | 8.32 ± 13.42 | 69.13 | 0.00 * | 0.17 | TGA>DI*/STBU>DI* | |
| sprint % | 0.00 ± 0.04 | 0.12 ± 0.72 | 0.11 ± 0.66 | 5.63 | 0.06 | 0.01 | - | |
| Nsprints | 0.01 ± 0.08 | 0.06 ± 0.261 | 0.05 ± 0.22 | 5.12 | 0.08 | 0.01 | - | |
| Nsteps | 378.79 ± 190.59 | 425.03 ± 152.91 | 422.97 ± 222.80 | 4.53 | 0.10 | 0.01 | - | |
| steps/min | 60.75 ± 29.94 | 75.66 ± 18.70 | 70.28 ± 36.45 | 11.43 | 0.00 * | 0.03 | TGA>DI*/STBU>DI* | |
| Njumps | 3.65 ± 3.62 | 4.46 ± 3.88 | 4.72 ± 4.71 | 4.25 | 0.12 | 0.01 | ||
| jumps/min | 0.75 ± 0.56 | 0.96 ± 0.55 | 0.96 ± 0.75 | 11.18 | 0.00 * | 0.03 | TGA>DI*/STBU>DI* | |
| Neuromuscular eTL | Nimpacts | 1126.04 ± 526.16 | 1148.39 ± 457.02 | 1056.44 ± 476.53 | 5.53 | 0.06 | 0.01 | |
| PL | 6.09 ± 2.52 | 6.94 ± 2.06 | 6.83 ± 2.91 | 7.33 | 0.03 * | 0.02 | STBU>DI* | |
| PL/min | 0.98 ± 0.39 | 1.25 ± 0.24 | 1.13 ± 0.48 | 27.26 | 0.00 * | 0.07 | TGA>DI*/STBU>DI* | |
| iTL | HRmax | 177.93 ± 33.60 | 182.03 ± 25.87 | 186.68 ± 22.65 | 2.46 | 0.29 | 0.01 | - |
| AVG HR | 160.29 ± 35.78 | 161.82 ± 30.48 | 168.83 ± 26.73 | 2.65 | 0.27 | 0.01 | - | |
| Rel HR % | 80.58 ± 16.94 | 83.15 ± 12.63 | 84.52 ± 12.17 | 2.76 | 0.25 | 0.01 | - | |
| 50–60% HR | 7.30 ± 18.03 | 6.76 ± 15.78 | 10.77 ± 24.50 | 0.31 | 0.86 | 0.00 | - | |
| 60–70% HR | 6.63 ± 14.35 | 9.80 ± 17.90 | 8.98 ± 19.50 | 3.63 | 0.16 | 0.01 | - | |
| 70–80% HR | 10.28 ± 17.75 | 8.96 ± 14.60 | 6.38 ± 9.82 | 3.13 | 0.21 | 0.01 | - | |
| 80–90% HR | 24.23 ± 26.53 | 22.04 ± 22.95 | 21.93 ± 22.18 | 0.25 | 0.88 | 0.00 | - | |
| 90–95% HR | 21.48 ± 22.07 | 25.33 ± 21.88 | 27.44 ± 21.43 | 6.71 | 0.04 * | 0.02 | STBU>DI* | |
| 95–200% HR | 19.60 ± 27.38 | 21.26 ± 24.56 | 23.64 ± 26.23 | 4.47 | 0.11 | 0.01 | - | |
| Study Variables | Experience M ± SD | No Experience M ± SD | U | p | r | |
|---|---|---|---|---|---|---|
| Kinematic eTL | dis(m) | 314.96 ± 111.85 | 324.08 ± 133.70 | 20,437.00 | 0.41 | 0.04 |
| m/min | 53.62 ± 17.55 | 55.42 ± 21.79 | 19,833.50 | 0.19 | 0.06 | |
| Nacc | 197.02 ± 38.76 | 203.69 ± 43.86 | 19,616.00 | 0.14 | 0.07 | |
| acc/min | 33.75 ± 6.09 | 34.86 ± 6.82 | 19,575.50 | 0.13 | 0.07 | |
| Ndec | 197.01 ± 38.88 | 203.64 ± 44.05 | 19,667.50 | 0.15 | 0.07 | |
| dec/min | 33.74 ± 6.08 | 34.85 ± 6.84 | 19,579.00 | 0.13 | 0.07 | |
| MAX Speed | 11.50 ± 3.00 | 11.77 ± 3.50 | 18,960.00 | 0.04 * | 0.10 | |
| AVG Speed | 3.96 ± 1.44 | 4.06 ± 1.59 | 20,455.00 | 0.42 | 0.04 | |
| HIA % | 9.42 ± 17.11 | 10.60 ± 17.39 | 19,768.50 | 0.17 | 0.07 | |
| walk % | 64.63 ± 25.37 | 62.29 ± 26.99 | 19,787.50 | 0.18 | 0.07 | |
| jog % | 28.67 ± 17.71 | 29.16 ± 18.29 | 20,306.50 | 0.36 | 0.05 | |
| run % | 6.66 ± 12.13 | 8.45 ± 14.15 | 19,635.00 | 0.14 | 0.07 | |
| sprint % | 0.04 ± 0.41 | 0.11 ± 0.66 | 20,638.00 | 0.08 | 0.09 | |
| Nsprints | 0.02 ± 0.15 | 0.05 ± 0.24 | 20,888.00 | 0.16 | 0.07 | |
| Nsteps | 399.01 ± 177.92 | 416.40 ± 201.05 | 20,070.50 | 0.26 | 0.08 | |
| steps/min | 67.09 ± 27.23 | 70.28 ± 31.61 | 19,713.00 | 0.16 | 0.05 | |
| Njumps | 4.35 ± 4.12 | 4.21 ± 4.09 | 20,623.00 | 0.50 | 0.03 | |
| jumps/min | 0.86 ± 0.64 | 0.91 ± 0.63 | 12,678.50 | 0.37 | 0.90 | |
| Neuromuscular eTL | Nimpacts | 1138.89 ± 474.94 | 1089.09 ± 497.95 | 19,469.50 | 0.11 | 0.08 |
| PL | 6.61 ± 2.40 | 6.62 ± 2.65 | 21,194.50 | 0.84 | 0.01 | |
| PL/min | 1.12 ± 0.37 | 1.12 ± 0.42 | 21,273.00 | 0.89 | 0.01 | |
| iTL | HRmax | 185.40 ± 25.59 | 179.57 ± 29.55 | 17,741.50 | 0.00 * | 0.14 |
| AVG HR | 166.97 ± 30.06 | 160.88 ± 32.28 | 18,165.00 | 0.01 * | 0.13 | |
| Rel HR % | 84.09 ± 13.53 | 81.64 ± 14.59 | 18,758.00 | 0.04 * | 0.10 | |
| 50–60% HR | 6.63 ± 16.52 | 9.50 ± 21.87 | 19,689.00 | 0.09 | 0.08 | |
| 60–70% HR | 7.55 ± 16.24 | 9.18 ± 18.19 | 18,952.00 | 0.04 * | 0.10 | |
| 70–80% HR | 7.40 ± 12.62 | 9.50 ± 15.87 | 20,385.50 | 0.44 | 0.04 | |
| 80–90% HR | 22.78 ± 24.05 | 22.72 ± 23.93 | 20,956.00 | 0.77 | 0.01 | |
| 90–95% HR | 26.46 ± 22.46 | 23.33 ± 21.37 | 19,610.00 | 0.16 | 0.07 | |
| 95–200% HR | 23.70 ± 26.33 | 19.70 ± 25.78 | 19,555.50 | 0.14 | 0.07 | |
| Experience | Yes (M ± SD) | No (M ± SD) | t/u | df | p | dCohen/r |
|---|---|---|---|---|---|---|
| Pre-test | 4.27 ± 1.07 | 3.89 ± 1.38 | 1.01 a | 45 | 0.32 | 0.00 |
| Post-test | 3.51 ± 1.17 | 3.85 ± 1.48 | 259.50 b | −0.50 | 0.62 | 0.07 |
| Methodology | DI (M ± SD) | TGA (M ± SD) | STBU (M ± SD) | f/h | df | p | η2/E2R |
|---|---|---|---|---|---|---|---|
| Pre-test | 4.29 ± 1.29 | 3.96 ± 1.34 | 3.91 ± 1.18 | 1.32 a | 2 | 0.67 | 0.18 |
| Post-test | 3.49 ± 1.15 | 3.64 ± 0.93 | 4.00 ± 1.89 | 0.39 b | 2 | 0.83 | 0.01 |
| M ± SD | r | p | |
|---|---|---|---|
| RPE * HR_90–95% | 3.88 ± 1.31/30.67 ± 14.33 | 0.01 a | 0.96 |
| RPE * HR_95–200% | 3.88 ± 1.31/27.73 ± 19.66 | −0.05 a | 0.61 |
| RPE * MAX_HR | 3.88 ± 1.31/189.70 ± 18.11 | 0.10 b | 0.35 |
| RPE * AVG_HR | 3.88 ± 1.31/175.35 ± 19.60 | 0.07 b | 0.52 |
Publisher’s Note: MDPI stays neutral with regard to jurisdictional claims in published maps and institutional affiliations. |
© 2021 by the authors. Licensee MDPI, Basel, Switzerland. This article is an open access article distributed under the terms and conditions of the Creative Commons Attribution (CC BY) license (https://creativecommons.org/licenses/by/4.0/).
Share and Cite
Gamero, M.G.; García-Ceberino, J.M.; Ibáñez, S.J.; Feu, S. Influence of the Pedagogical Model and Experience on the Internal and External Task Load in School Basketball. Int. J. Environ. Res. Public Health 2021, 18, 11854. https://0-doi-org.brum.beds.ac.uk/10.3390/ijerph182211854
Gamero MG, García-Ceberino JM, Ibáñez SJ, Feu S. Influence of the Pedagogical Model and Experience on the Internal and External Task Load in School Basketball. International Journal of Environmental Research and Public Health. 2021; 18(22):11854. https://0-doi-org.brum.beds.ac.uk/10.3390/ijerph182211854
Chicago/Turabian StyleGamero, María G., Juan M. García-Ceberino, Sergio J. Ibáñez, and Sebastián Feu. 2021. "Influence of the Pedagogical Model and Experience on the Internal and External Task Load in School Basketball" International Journal of Environmental Research and Public Health 18, no. 22: 11854. https://0-doi-org.brum.beds.ac.uk/10.3390/ijerph182211854