
Analysis of Chinese Consumers’ Nutrition Facts Table Use Behavior Based on Knowledge-Attitude-Practice Model


Abstract
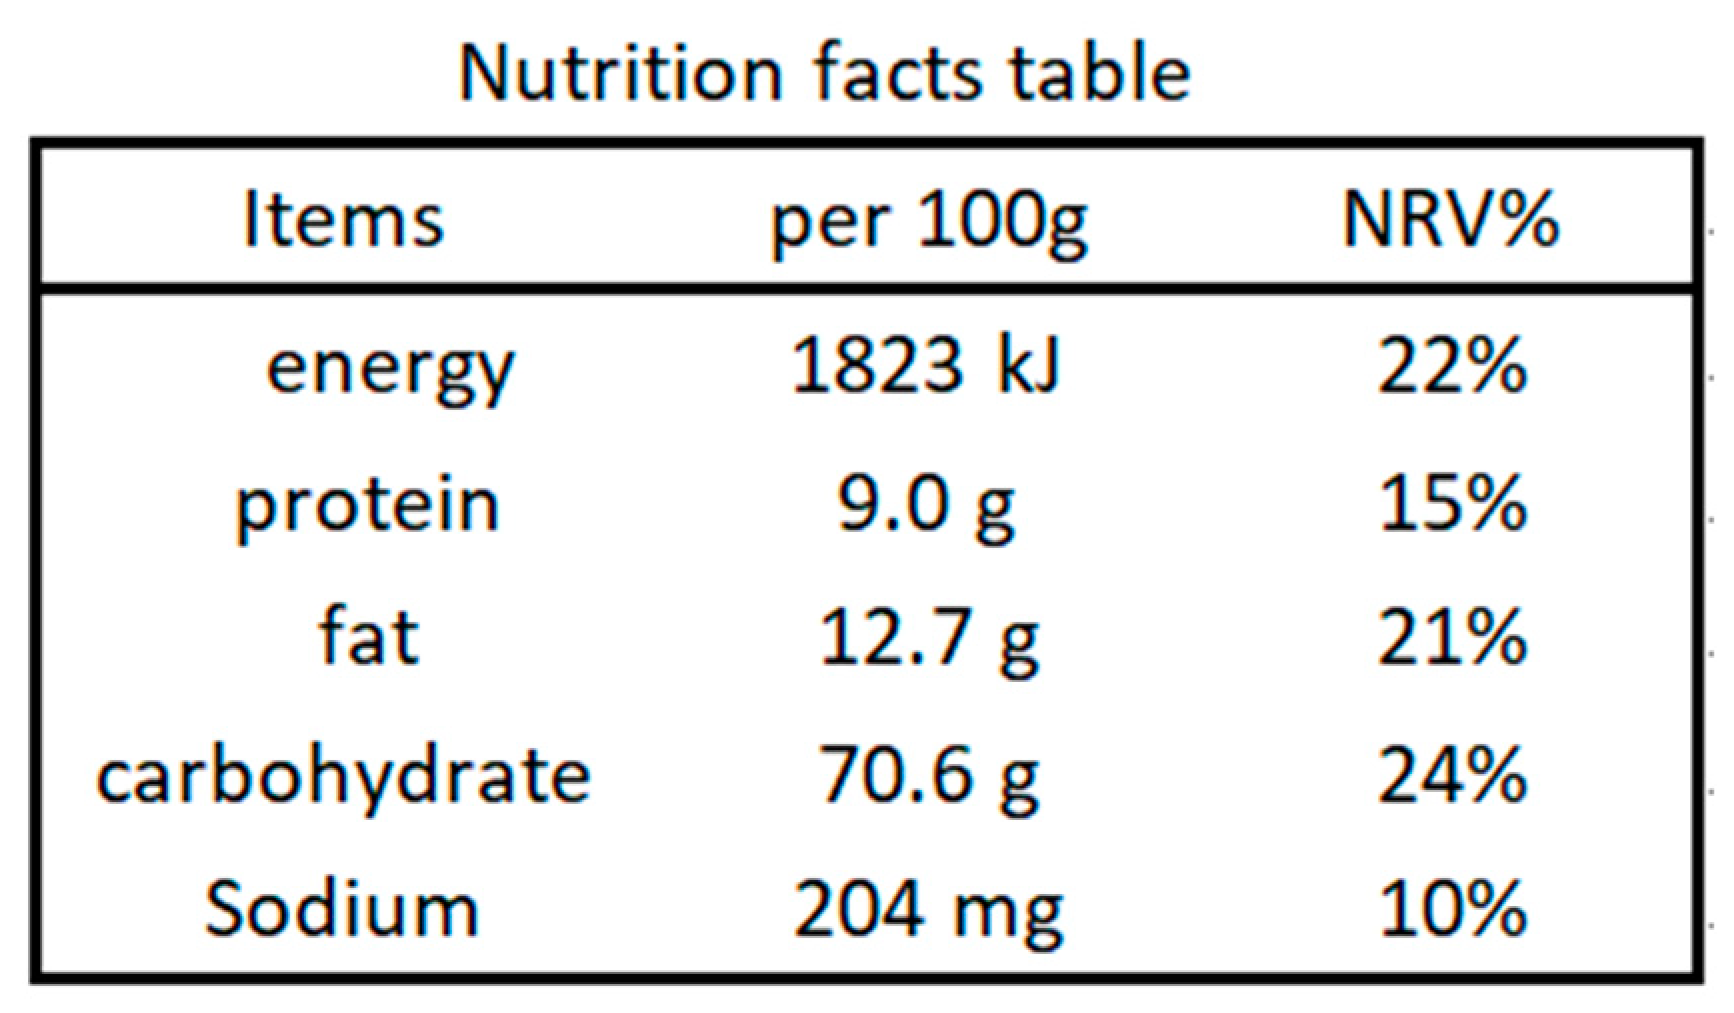
:1. Introduction
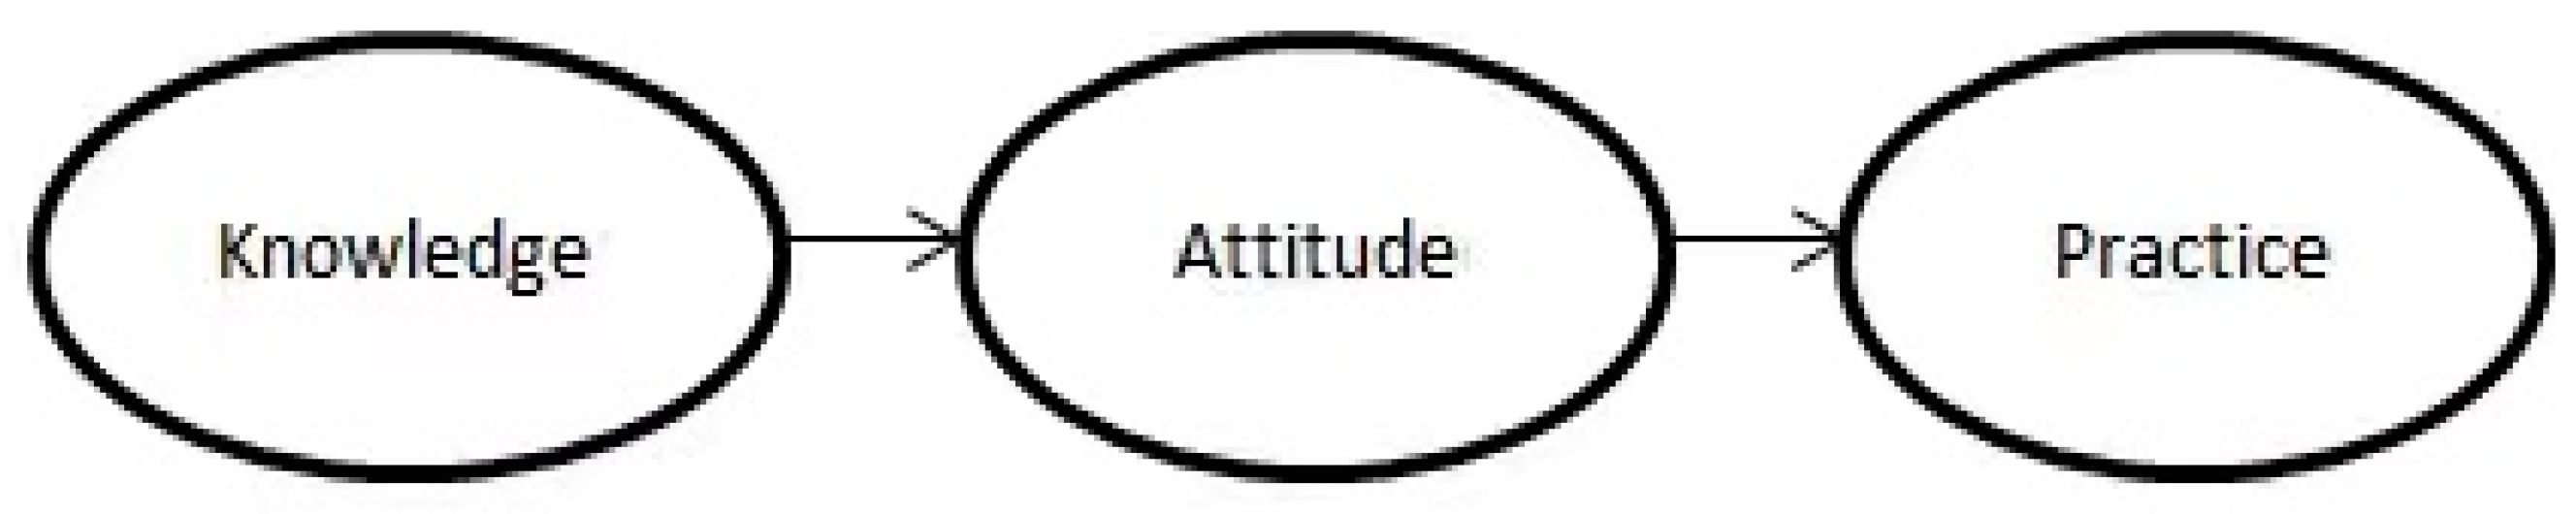
2. Hypotheses of the KAP Model
3. Methods and Materials
3.1. Measures and Collection of Data
3.2. Methods
4. Results
4.1. Analysis of Discriminant Validity
4.2. Goodness-of-Fit Test
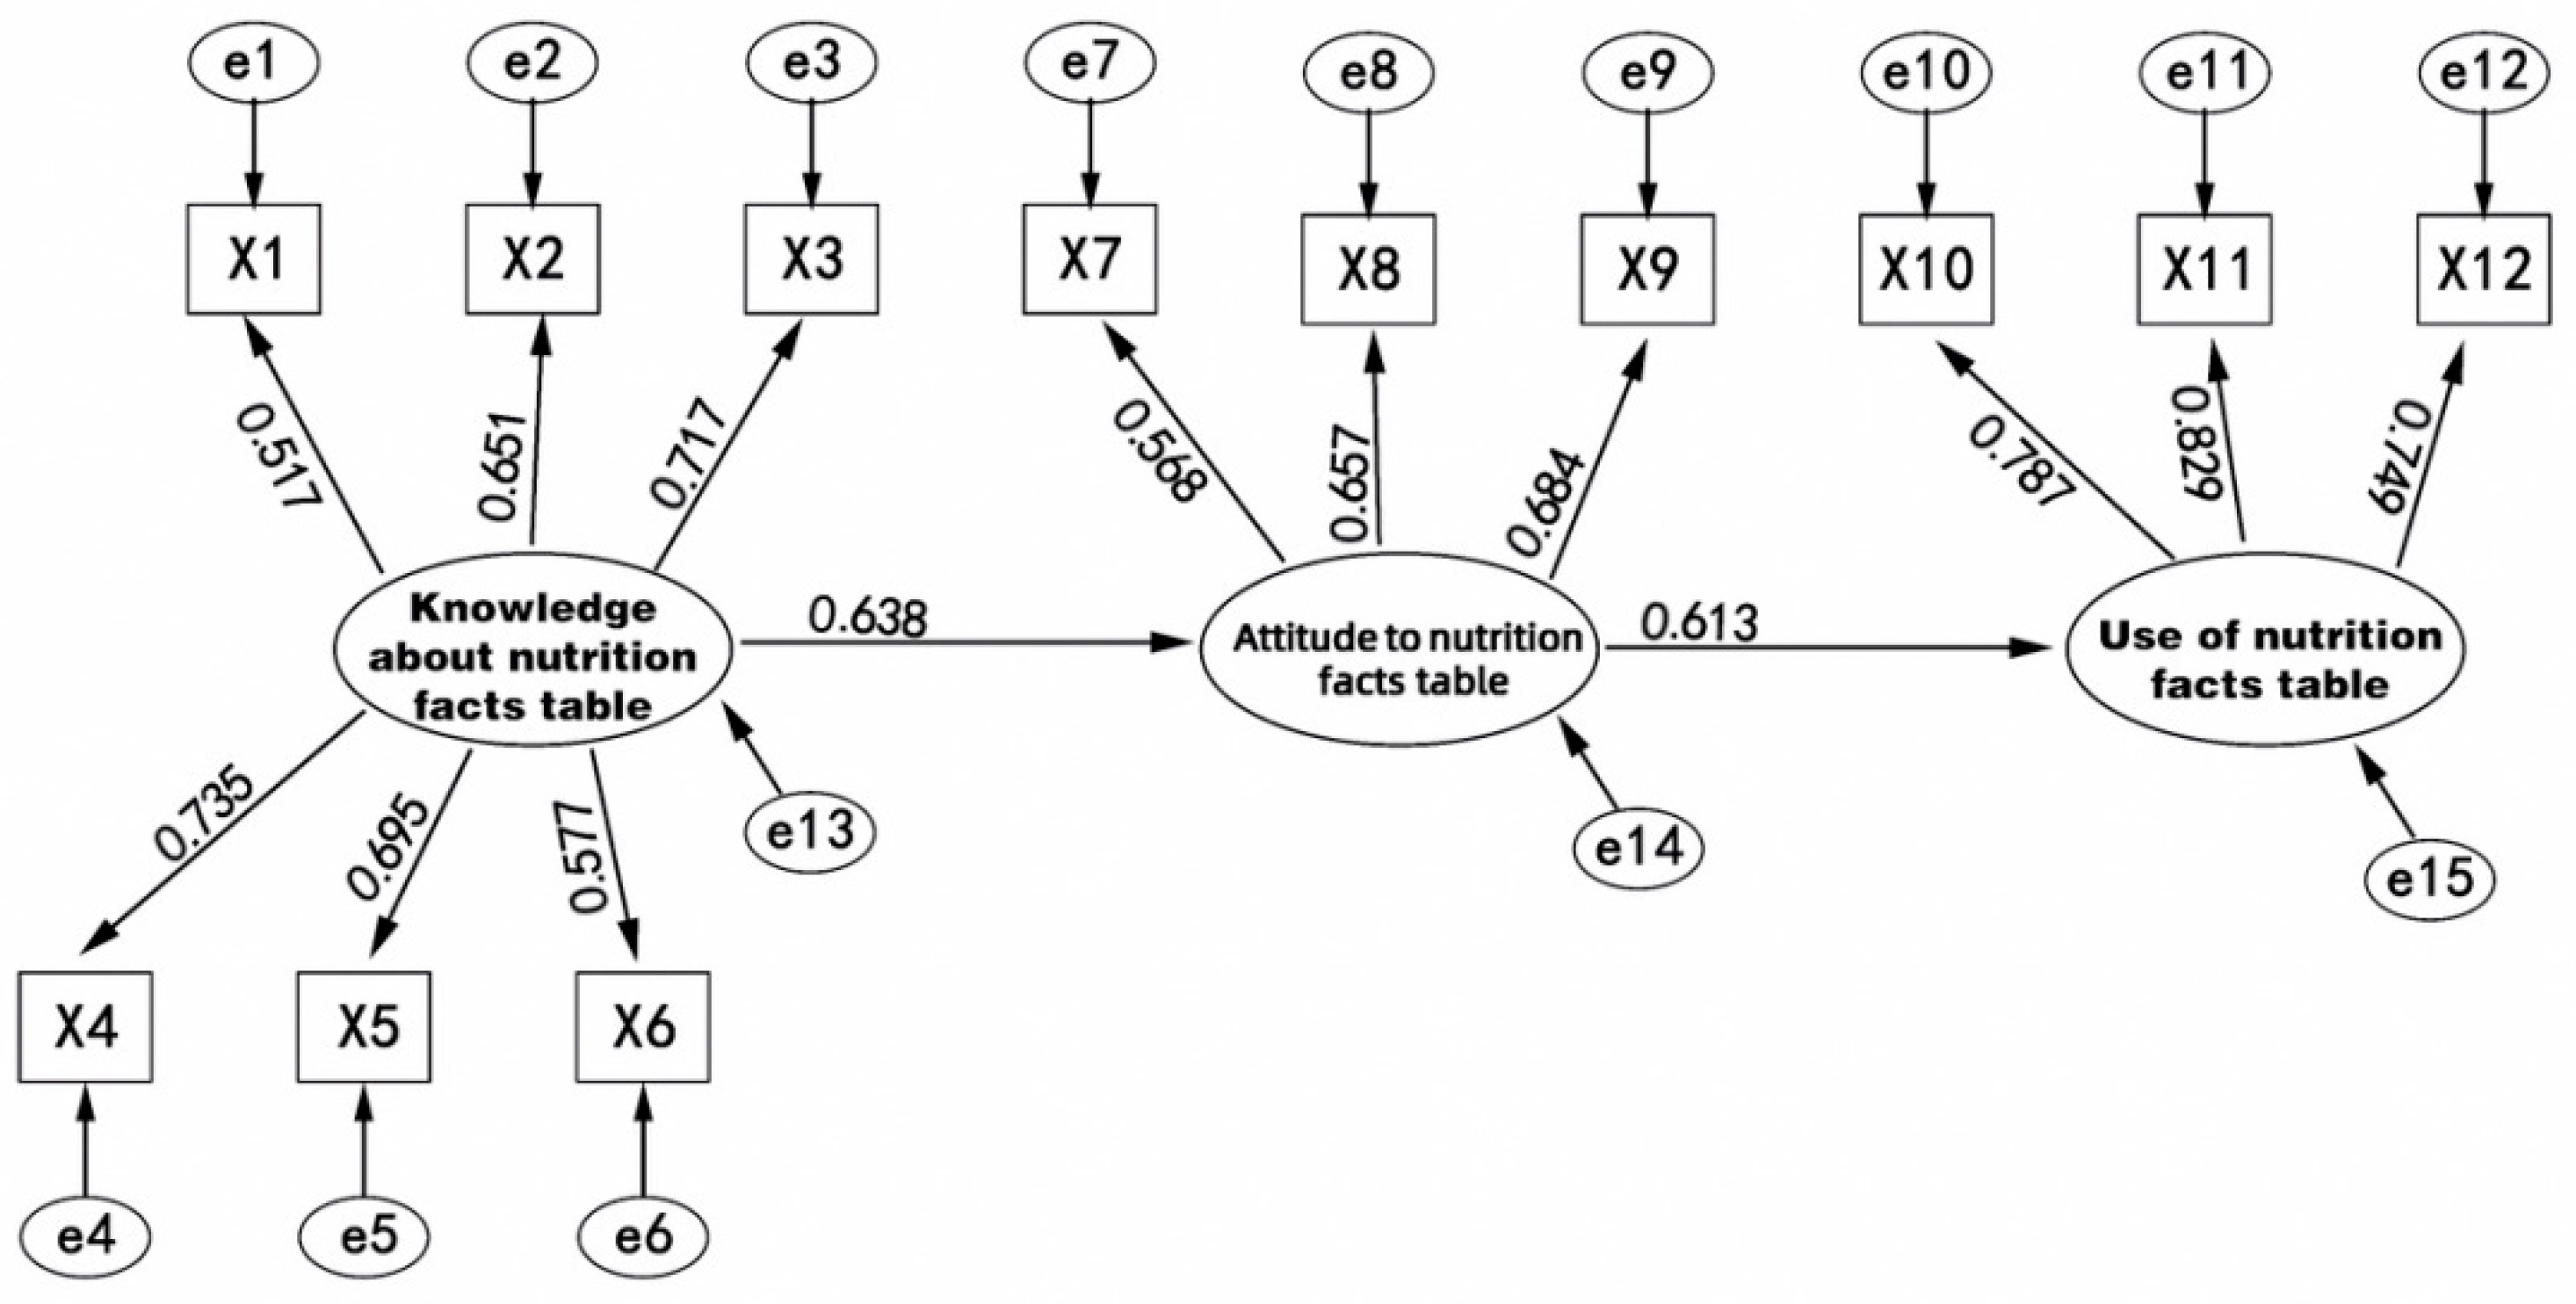
4.3. Valuation of Structural Equation and Hypothesis Testing
5. Discussion
5.1. Association between Knowledge and Attitude of the Nutrition Facts Table
5.2. Association between Attitude and Practice of the Nutrition Facts Table
5.3. Association between Knowledge and Practice of the Nutrition Facts Table
6. Conclusions and Recommendations
Supplementary Materials
Author Contributions
Funding
Institutional Review Board Statement
Informed Consent Statement
Data Availability Statement
Acknowledgments
Conflicts of Interest
References
- Codex Alimentarius Commission. Codex Guidelines on Nutrition Labeling; Codex Alimentarius Commission: Roma, Italy, 1985. [Google Scholar]
- World Health Organization. Global Strategy on Diet, Physical Activity and Health; World Health Organization: Geneva, Switzerland, 2004. [Google Scholar]
- Elfassy, T.; Yi, S.; Eisenhower, D.; Lederer, A.; Curtis, C.J. Use of sodium information on the nutrition facts label in New York city adults with hypertension. J. Am. Acad. Nutr. Diet. 2014, 115, 278–283. [Google Scholar] [CrossRef]
- Živa, K.; Igor, P. Assessing the average sodium content of prepacked foods with nutrition declarations: The importance of sales data. Nutrients 2014, 6, 3501–3515. [Google Scholar]
- Chan, J.Y.M.; Scourboutakos, M.J.; L’Abbé, M.R. Unregulated serving sizes on the Canadian nutrition facts table–an invitation for manufacturer manipulations. BMC Public Health 2017, 17, 418. [Google Scholar] [CrossRef] [Green Version]
- Louie, J.C.Y.; Flood, V.; Rangan, A.; Hector, D.J.; Gill, T. A comparison of two nutrition signposting systems for use in Australia. N. S. W. Public Health Bull. 2008, 19, 121–126. [Google Scholar] [CrossRef]
- Central People’s Government of the People’s Republic of China. Report on Nutrition and Chronic Diseases in China; 2020. Available online: http://www.gov.cn/xinwen/2020-12/24/content_5572983.htm (accessed on 1 October 2021).
- Ministry of Health (MoH), PRC. General Rules for Nutrition Labeling of Pre-Packaged Food; Ministry of Health (MoH), PRC: Beijing, China, 2011.
- Liu, R.; Hoefkens, C.; Verbeke, W. Chinese consumers’ understanding and use of a food nutrition label and their determinants. Food Qual. Prefer. 2015, 41, 103–111. [Google Scholar] [CrossRef]
- Song, J.; Huang, J.; Chen, Y.; Zhu, Y.; Li, H.; Wen, Y.; Yuan, H.; Liang, Y. The understanding, attitude and use of nutrition label among consumers (China). Nutr. Hosp. 2015, 31, 2703–2710. [Google Scholar]
- Gao, C.; Xu, J.; Liu, Y.; Yang, Y. Nutrition policy and healthy China 2030 building. Eur. J. Clin. Nutr. 2021, 75, 238–246. [Google Scholar] [CrossRef] [PubMed]
- Chinese Nutrition Society. Dietary Guidelines for Chinese Residents; People’s Medical Publishing House: Beijing, China, 2016. [Google Scholar]
- Cleland, J. A critique of KAP studies and some suggestions for their improvement. Stud. Family Plan. 1973, 4, 42–47. [Google Scholar] [CrossRef]
- Midzi, N.; Mtapuri-Zinyowera, S.; Mapingure, M.P.; Paul, N.H.; Sangweme, D.; Hlerema, G.; Mutsaka, M.J.; Tongogara, F.; Makware, G.; Chadukura, V. Knowledge attitudes and practices of grade three primary schoolchildren in relation to schistosomiasis, soil transmitted helminthiasis and malaria in Zimbabwe. BMC Infect. Dis. 2011, 11, 169. [Google Scholar] [CrossRef] [Green Version]
- Herbuela, V.; Guzman, F.; Sobrepea, G.D.; Claudio, A.B.F.; Tomas, A.C.V.; Reyes, A.D.; Regalado, R.A.; Teodoro, M.M.; Watanabe, K. Knowledge, attitude, and practices regarding dengue fever among pediatric and adult in-patients in Metro Manila, Philippines. Int. J. Environ. Res. Public Health 2019, 16, 4705. [Google Scholar] [CrossRef] [PubMed] [Green Version]
- Gautam, A.; Bhatta, D.N.; Aryal, U.R. Diabetes related health knowledge, attitude and practice among diabetic patients in Nepal. BMC Endocr. Disord. 2015, 15, 25. [Google Scholar] [CrossRef] [Green Version]
- Eghbali-Babadi, M.; Feizi, A.; Khosravi, A.; Sarrafzadegan, N. The effect of training on knowledge, attitude, and practice in patients with hypertension: The application of the expanded chronic care model, a clinical trial study. Iran. Red Crescent Med. J. 2018, 20, e61693. [Google Scholar] [CrossRef]
- Nurliyana, G.; Norazmir, M.N.; Anuar, M. Knowledge, attitude and practices of university students regarding the use of nutritional information and food labels. Asia. J. Clin. Nutr. 2011, 3, 79–91. [Google Scholar] [CrossRef] [Green Version]
- Evelyn, H.; Aziz A., F.; Sariman, S. Associations of knowledge, attitude and practices of food label on cardiovascular diseases (CVD) risk amongst university students in Selangor, Malaysia. J. Nutr. Sci. Vitaminol. 2020, 66, S275–S282. [Google Scholar] [CrossRef] [PubMed]
- Mahdavi, A.M.; Abdolahi, P.; Mahdavi, R. Knowledge, attitude and practice between medical and non-Medical sciences students about food labeling. Health Promot. Perspect. 2012, 2, 173–179. [Google Scholar]
- Rimpeekool, W.; Banwell, C.; Seubsman, S.A.; Kirk, M.D.; Yieng-Sbirakos, V.; Sleigh, A.C. “I rarely read the label”: Factors that influence Thai consumer responses to nutrition labels. J. Glob. Health 2016, 8, 21–28. [Google Scholar] [CrossRef]
- Farahbod, B.; Rahmati-Najarkolaei, F.; Balvardi, M.; Imanigoghary, Z.; Farahbod, F.; Zeidabadi, R. The effect of education on knowledge, attitude and practice of Sirjan school of medical sciences staff regarding the use of food labels. Iran. J. Public Health 2021, 9, 33–44. [Google Scholar] [CrossRef]
- Ratcliffe, J.W. Analyst biases in KAP surveys: A cross-cultural comparison. Stud. Family Plan. 1976, 7, 322–330. [Google Scholar] [CrossRef]
- Hingson, L.R. Diffusion of family planning innovations: Theoretical and practical issues. Stud. Family Plan. 1974, 5, 189–194. [Google Scholar]
- Wang, J.; Yam, R.C.M.; Tang, E.P.Y. Ecologically conscious behavior of urban Chinese consumers: The implications to public policy in China. J. Environ. Plan. Manag. 2013, 56, 982–1001. [Google Scholar] [CrossRef]
- Kumar, S.; Agarwal, A.K.; Kumar, A.; Agrawal, G.G.; Chaudhary, S.; Dwivedi, V. A study of knowledge, attitude and practice of hospital consultants, resident doctors and private practitioners with regard to pre-hospital and emergency care in Lucknow. Indian J. Surg. 2008, 70, 14–18. [Google Scholar] [CrossRef] [Green Version]
- Graham, D.J.; Roberto, C.A. Evaluating the impact of U.S. food and drug administration–proposed nutrition facts label changes on young adults’ visual attention and purchase intentions. Health Educ. Behav. 2016, 43, 389–398. [Google Scholar] [CrossRef] [PubMed]
- Lei, P.; Wu, Q. Introduction to structural equation modeling: Issues and practical considerations. Educ. Meas. Issues Pract. 2007, 26, 33–43. [Google Scholar] [CrossRef]
- Neale, M.C.; Hunter, M.D.; Pritikin, J.N.; Zahery, M.; Brick, T.R.; Kirkpatrick, R.M.; Estabrook, R.; Bates, T.C.; Maes, H.H.; Boker, S.M. OpenMx20: Extended structural equation and statistical modeling. Psychometrika 2016, 81, 535–549. [Google Scholar] [CrossRef] [PubMed]
- Al-Gahtani, S.S. Empirical investigation of e-learning acceptance and assimilation: A structural equation model. Appl. Comput. Inform. 2016, 12, 27–50. [Google Scholar] [CrossRef] [Green Version]
- Kaiser, H.F. An index of factorial simplicity. Psychometrika 1974, 39, 31–36. [Google Scholar] [CrossRef]
- Anderson, J.C.; Gerbing, D.W. Structural equation modeling in practice: A review and recommended two-step approach. Psychol. Bull. 1988, 103, 411–423. [Google Scholar] [CrossRef]
- Nunnally, J.C. Psychometric Theory; Mcgraw-Hill: New York, NY, USA, 1978. [Google Scholar]
- Byrne, B.M. Structural Equation Modeling with EQS and EQS/Windows: Basic Concepts, Applications, and Programming; Sage: Militas, CA, USA, 1994. [Google Scholar]
- Thompson, B. Exploratory and Confirmatory Factor Analysis: Understanding Concepts and Applications; American Psychological Association: Washington, DC, USA, 2004. [Google Scholar]
- Grunert, K.G.; Wills, J. A review of European research on consumer response to nutrition information on food labels. J. Public Health 2007, 15, 385–399. [Google Scholar] [CrossRef] [Green Version]


| Latent Variables | Scale Items |
|---|---|
| I know the concept and function of nutrient reference values (NRV) from the nutrition facts table. | |
| I know the concept and function of energy information from the nutrition facts table. | |
| Knowledge about the nutrition facts table | I know the concept and function of carbohydrate information from the nutrition facts table. |
| I know the concept and function of fat information from the nutrition facts table. | |
| I know the concept and function of protein information from the nutrition facts table. | |
| I know the concept and function of sodium information from the nutrition facts table. | |
| I believe the nutrition facts table could be used to compare nutrients among similar foods. | |
| Attitude towards the nutrition facts table | I believe the nutrition facts table could be used to choose healthy food. |
| I believe the nutrition facts table could be used to understand nutrients in food. | |
| I read the nutrition facts table when food shopping. | |
| Use of the nutrition facts table | I use the nutrition facts table as a food purchase reference. |
| I use the nutrition facts table to compare nutrients among similar foods. |
| Attributes | Sorts | Numbers | % |
|---|---|---|---|
| Sex | Male | 528 | 56.77 |
| Female | 402 | 43.23 | |
| Age | Below 18 years old | 168 | 18.06 |
| 18–44 | 294 | 31.61 | |
| 45–59 | 275 | 29.57 | |
| 60 years old and above | 193 | 20.76 | |
| Education level | Primary school and below | 127 | 13.66 |
| Junior high school | 283 | 30.43 | |
| High school | 291 | 31.29 | |
| College/Bachelor | 198 | 21.29 | |
| Postgraduate or above | 31 | 3.33 | |
| Annual household income (after tax) | Below 10,000 Yuan | 117 | 12.58 |
| 10,000–50,000 Yuan | 254 | 27.31 | |
| 50,001–100,000 Yuan | 246 | 26.45 | |
| 100,001–150,000 Yuan | 180 | 19.35 | |
| 150,001–200,000 Yuan | 83 | 8.92 | |
| Above 200,000 Yuan | 50 | 5.38 |
| Variables | Scale Items | Strongly Disagree | Disagree | Neither Agree Nor Disagree | Agree | Strongly Agree | |||||
|---|---|---|---|---|---|---|---|---|---|---|---|
| N | Percentage% | N | Percentage% | N | Percentage% | N | Percentage% | N | Percentage% | ||
| Knowledge about the nutrition facts table | I know the concept and function of nutrient reference values (NRV) from the nutrition facts table. | 105 | 11.29 | 388 | 41.72 | 313 | 33.66 | 113 | 12.15 | 11 | 1.18 |
| I know the concept and function of energy information from the nutrition facts table. | 60 | 6.45 | 310 | 33.33 | 375 | 40.32 | 160 | 17.20 | 25 | 2.69 | |
| I know the concept and function of carbohydrate information from the nutrition facts table. | 62 | 6.67 | 208 | 22.37 | 336 | 36.13 | 277 | 29.78 | 47 | 5.05 | |
| I know the concept and function of fat information from the nutrition facts table. | 43 | 4.62 | 179 | 19.25 | 310 | 33.33 | 323 | 34.73 | 75 | 8.06 | |
| I know the concept and function of protein information from the nutrition facts table. | 43 | 4.62 | 159 | 17.10 | 305 | 32.80 | 340 | 36.56 | 83 | 8.92 | |
| I know the concept and function of sodium information from the nutrition facts table. | 112 | 12.04 | 266 | 28.60 | 337 | 36.24 | 163 | 17.53 | 52 | 5.59 | |
| Attitude towards the nutrition facts table | I believe the nutrition facts table could be used to compare nutrients among similar foods. | 28 | 3.01 | 147 | 15.81 | 289 | 31.08 | 404 | 43.44 | 62 | 6.67 |
| I believe the nutrition facts table could be used to choose healthy food. | 21 | 2.26 | 83 | 8.92 | 261 | 28.06 | 431 | 46.34 | 134 | 14.41 | |
| I believe the nutrition facts table could be used to understand nutrients of food. | 29 | 3.12 | 72 | 7.74 | 245 | 26.34 | 411 | 44.19 | 173 | 18.60 | |
| Use of the nutrition facts table | I read the nutrition facts table when food shopping. | 45 | 4.84 | 272 | 29.25 | 258 | 27.74 | 220 | 23.66 | 135 | 14.52 |
| I use the nutrition facts table as a food purchase reference. | 79 | 8.49 | 275 | 29.57 | 274 | 29.46 | 223 | 23.98 | 79 | 8.49 | |
| I use the nutrition facts table to compare nutrients among similar foods. | 90 | 9.68 | 231 | 24.84 | 294 | 31.61 | 233 | 25.05 | 82 | 8.82 | |
| Factors | Knowledge about the Nutrition Facts Table | Attitude to the Nutrition Facts Table | Use of the Nutrition Facts Table |
|---|---|---|---|
| Knowledge about the nutrition facts table | 0.734 | ||
| Attitude to the nutrition facts table | 0.638 ** | 0.710 | |
| Use of the nutrition facts table | 0.391 ** | 0.613 *** | 0.728 |
| Variables | Scale Items Code | Scale Items | Standard Loadings | AVE | Composite Reliability | Cronbach’ s Alpha |
|---|---|---|---|---|---|---|
| Knowledge about the nutrition facts table | X1 | I know the concept and function of nutrient reference values (NRV) from the nutrition facts table. | 0.517 | 0.539 | 0.833 | 0.813 |
| X2 | I know the concept and function of energy information from the nutrition facts table. | 0.651 | ||||
| X3 | I know the concept and function of carbohydrate information from the nutrition facts table. | 0.717 | ||||
| X4 | I know the concept and function of fat information from the nutrition facts table. | 0.735 | ||||
| X5 | I know the concept and function of protein information from the nutrition facts table. | 0.695 | ||||
| X6 | I know the concept and function of sodium information from the nutrition facts table. | 0.577 | ||||
| Attitude to the nutrition facts table | X7 | I believe the nutrition facts table could be used to compare nutrients among similar foods. | 0.568 | 0.504 | 0.757 | 0.798 |
| X8 | I believe the nutrition facts table could be used to choose healthy food. | 0.657 | ||||
| X9 | I believe the nutrition facts table could be used to understand nutrients of food. | 0.684 | ||||
| Use of the nutrition facts table | X10 | I read the nutrition facts table when food shopping. | 0.787 | 0.530 | 0.719 | 0.830 |
| X11 | I use the nutrition facts table as a food purchase reference. | 0.829 | ||||
| X12 | I use the nutrition facts table to compare nutrients among similar foods. | 0.749 |
| Goodness-of-Fit Indices | Fitting Index Values | Fitting |
|---|---|---|
| Standard Chi–Square (SCS) | 2.583 | <3, good |
| Comparative Fit Index (CFI) | 0.916 | >0.9, good |
| Incremental Fit Index (IFI) | 0.916 | >0.9, good |
| Goodness-of-fit Index (GFI) | 0.933 | >0.9, good |
| Adjusted Goodness-of-fit Index (AGFI) | 0.901 | >0.9, good |
| Root Mean Square Error of Approximation (RMSEA) | 0.072 | <0.08, good |
| Non-Normalizing Fitting Index (NNFI) | 0.993 | >0.9, good |
| Norm Fitting Index (NFI) | 0.904 | >0.9, good |
| Hypothesized Paths | Normalized Path Coefficient | T Value | Accepted |
|---|---|---|---|
| H1: Knowledge about the nutrition facts table→ Attitude to the nutrition facts table | 0.638 *** | 2.743 | Yes |
| H2: Attitude to the nutrition facts table→ Use of the nutrition facts table | 0.613 *** | 13.460 | Yes |
| H3: Knowledge about the nutrition facts table→ Use of the nutrition facts table | 0 | 0 | No |
Publisher’s Note: MDPI stays neutral with regard to jurisdictional claims in published maps and institutional affiliations. |
© 2021 by the authors. Licensee MDPI, Basel, Switzerland. This article is an open access article distributed under the terms and conditions of the Creative Commons Attribution (CC BY) license (https://creativecommons.org/licenses/by/4.0/).
Share and Cite
Huang, Z.; Li, H.; Huang, J. Analysis of Chinese Consumers’ Nutrition Facts Table Use Behavior Based on Knowledge-Attitude-Practice Model. Int. J. Environ. Res. Public Health 2021, 18, 12247. https://0-doi-org.brum.beds.ac.uk/10.3390/ijerph182212247
Huang Z, Li H, Huang J. Analysis of Chinese Consumers’ Nutrition Facts Table Use Behavior Based on Knowledge-Attitude-Practice Model. International Journal of Environmental Research and Public Health. 2021; 18(22):12247. https://0-doi-org.brum.beds.ac.uk/10.3390/ijerph182212247
Chicago/Turabian StyleHuang, Zeying, Haijun Li, and Jiazhang Huang. 2021. "Analysis of Chinese Consumers’ Nutrition Facts Table Use Behavior Based on Knowledge-Attitude-Practice Model" International Journal of Environmental Research and Public Health 18, no. 22: 12247. https://0-doi-org.brum.beds.ac.uk/10.3390/ijerph182212247