
Resources and Environment Carrying Capacity, Social Development and Their Decoupling Relationship: A Case Study of Hubei Province, China


Abstract
:1. Introduction
2. Materials and Methods
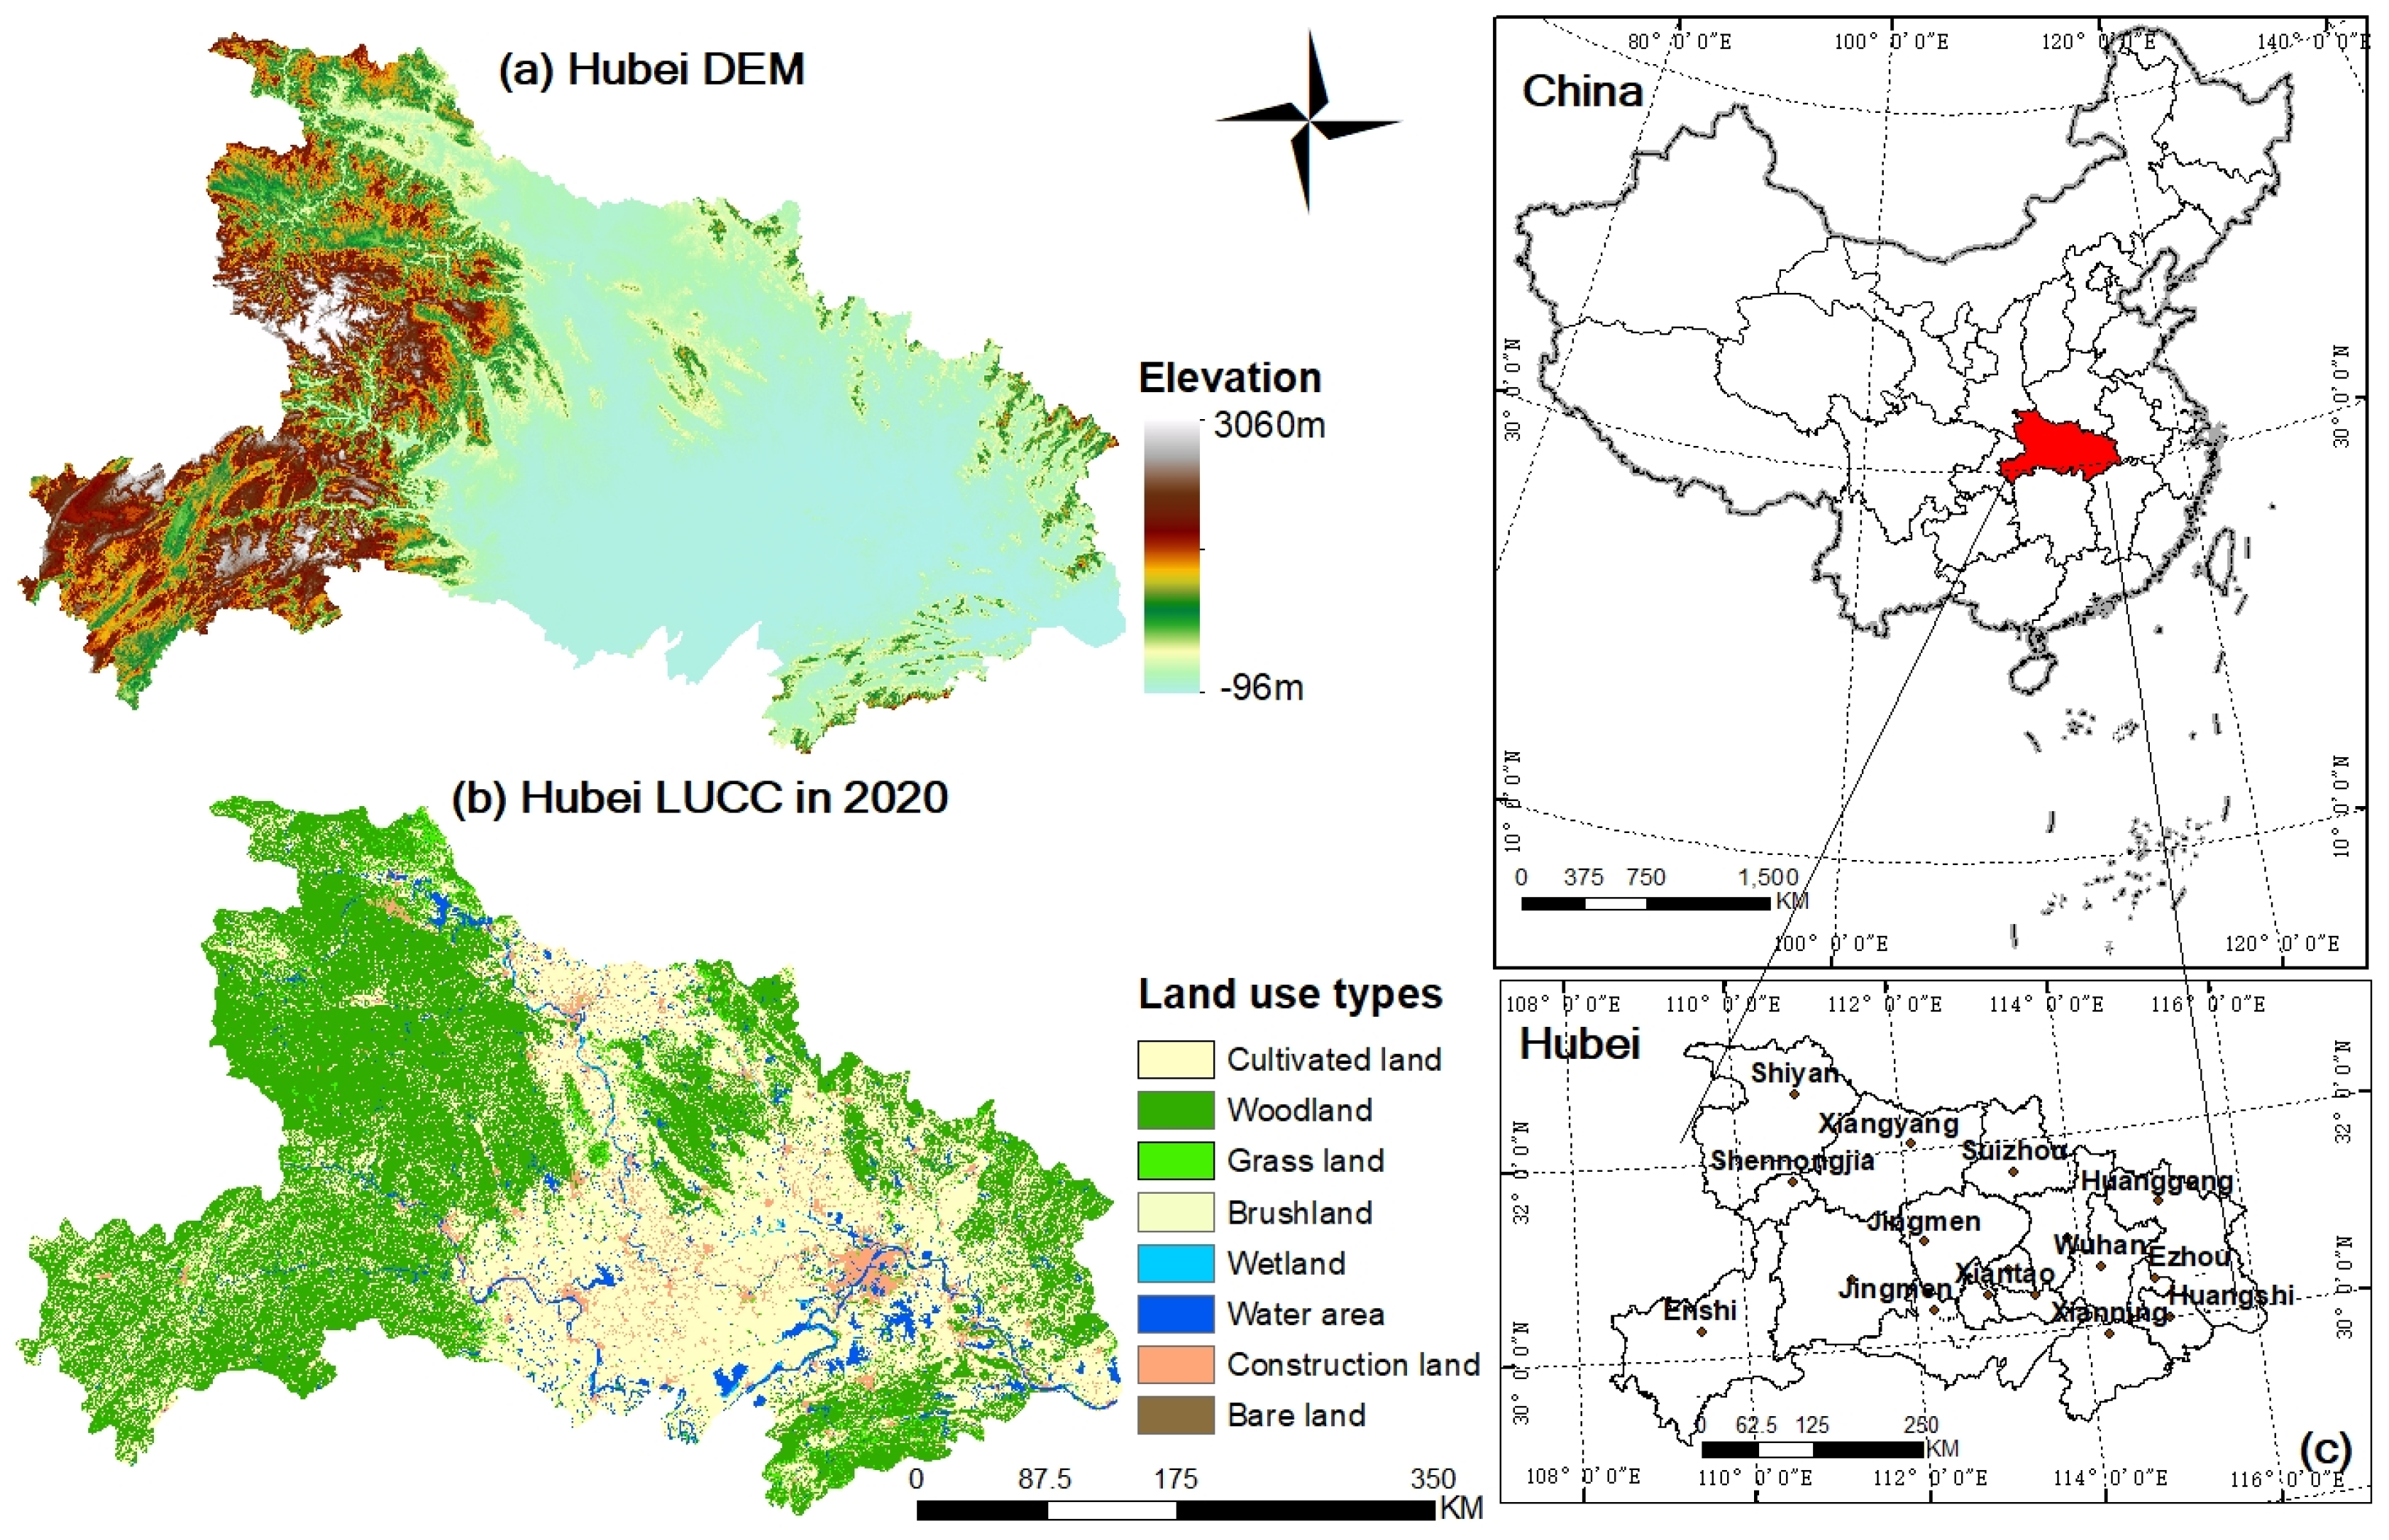
2.1. Study Area
2.2. Data Sources
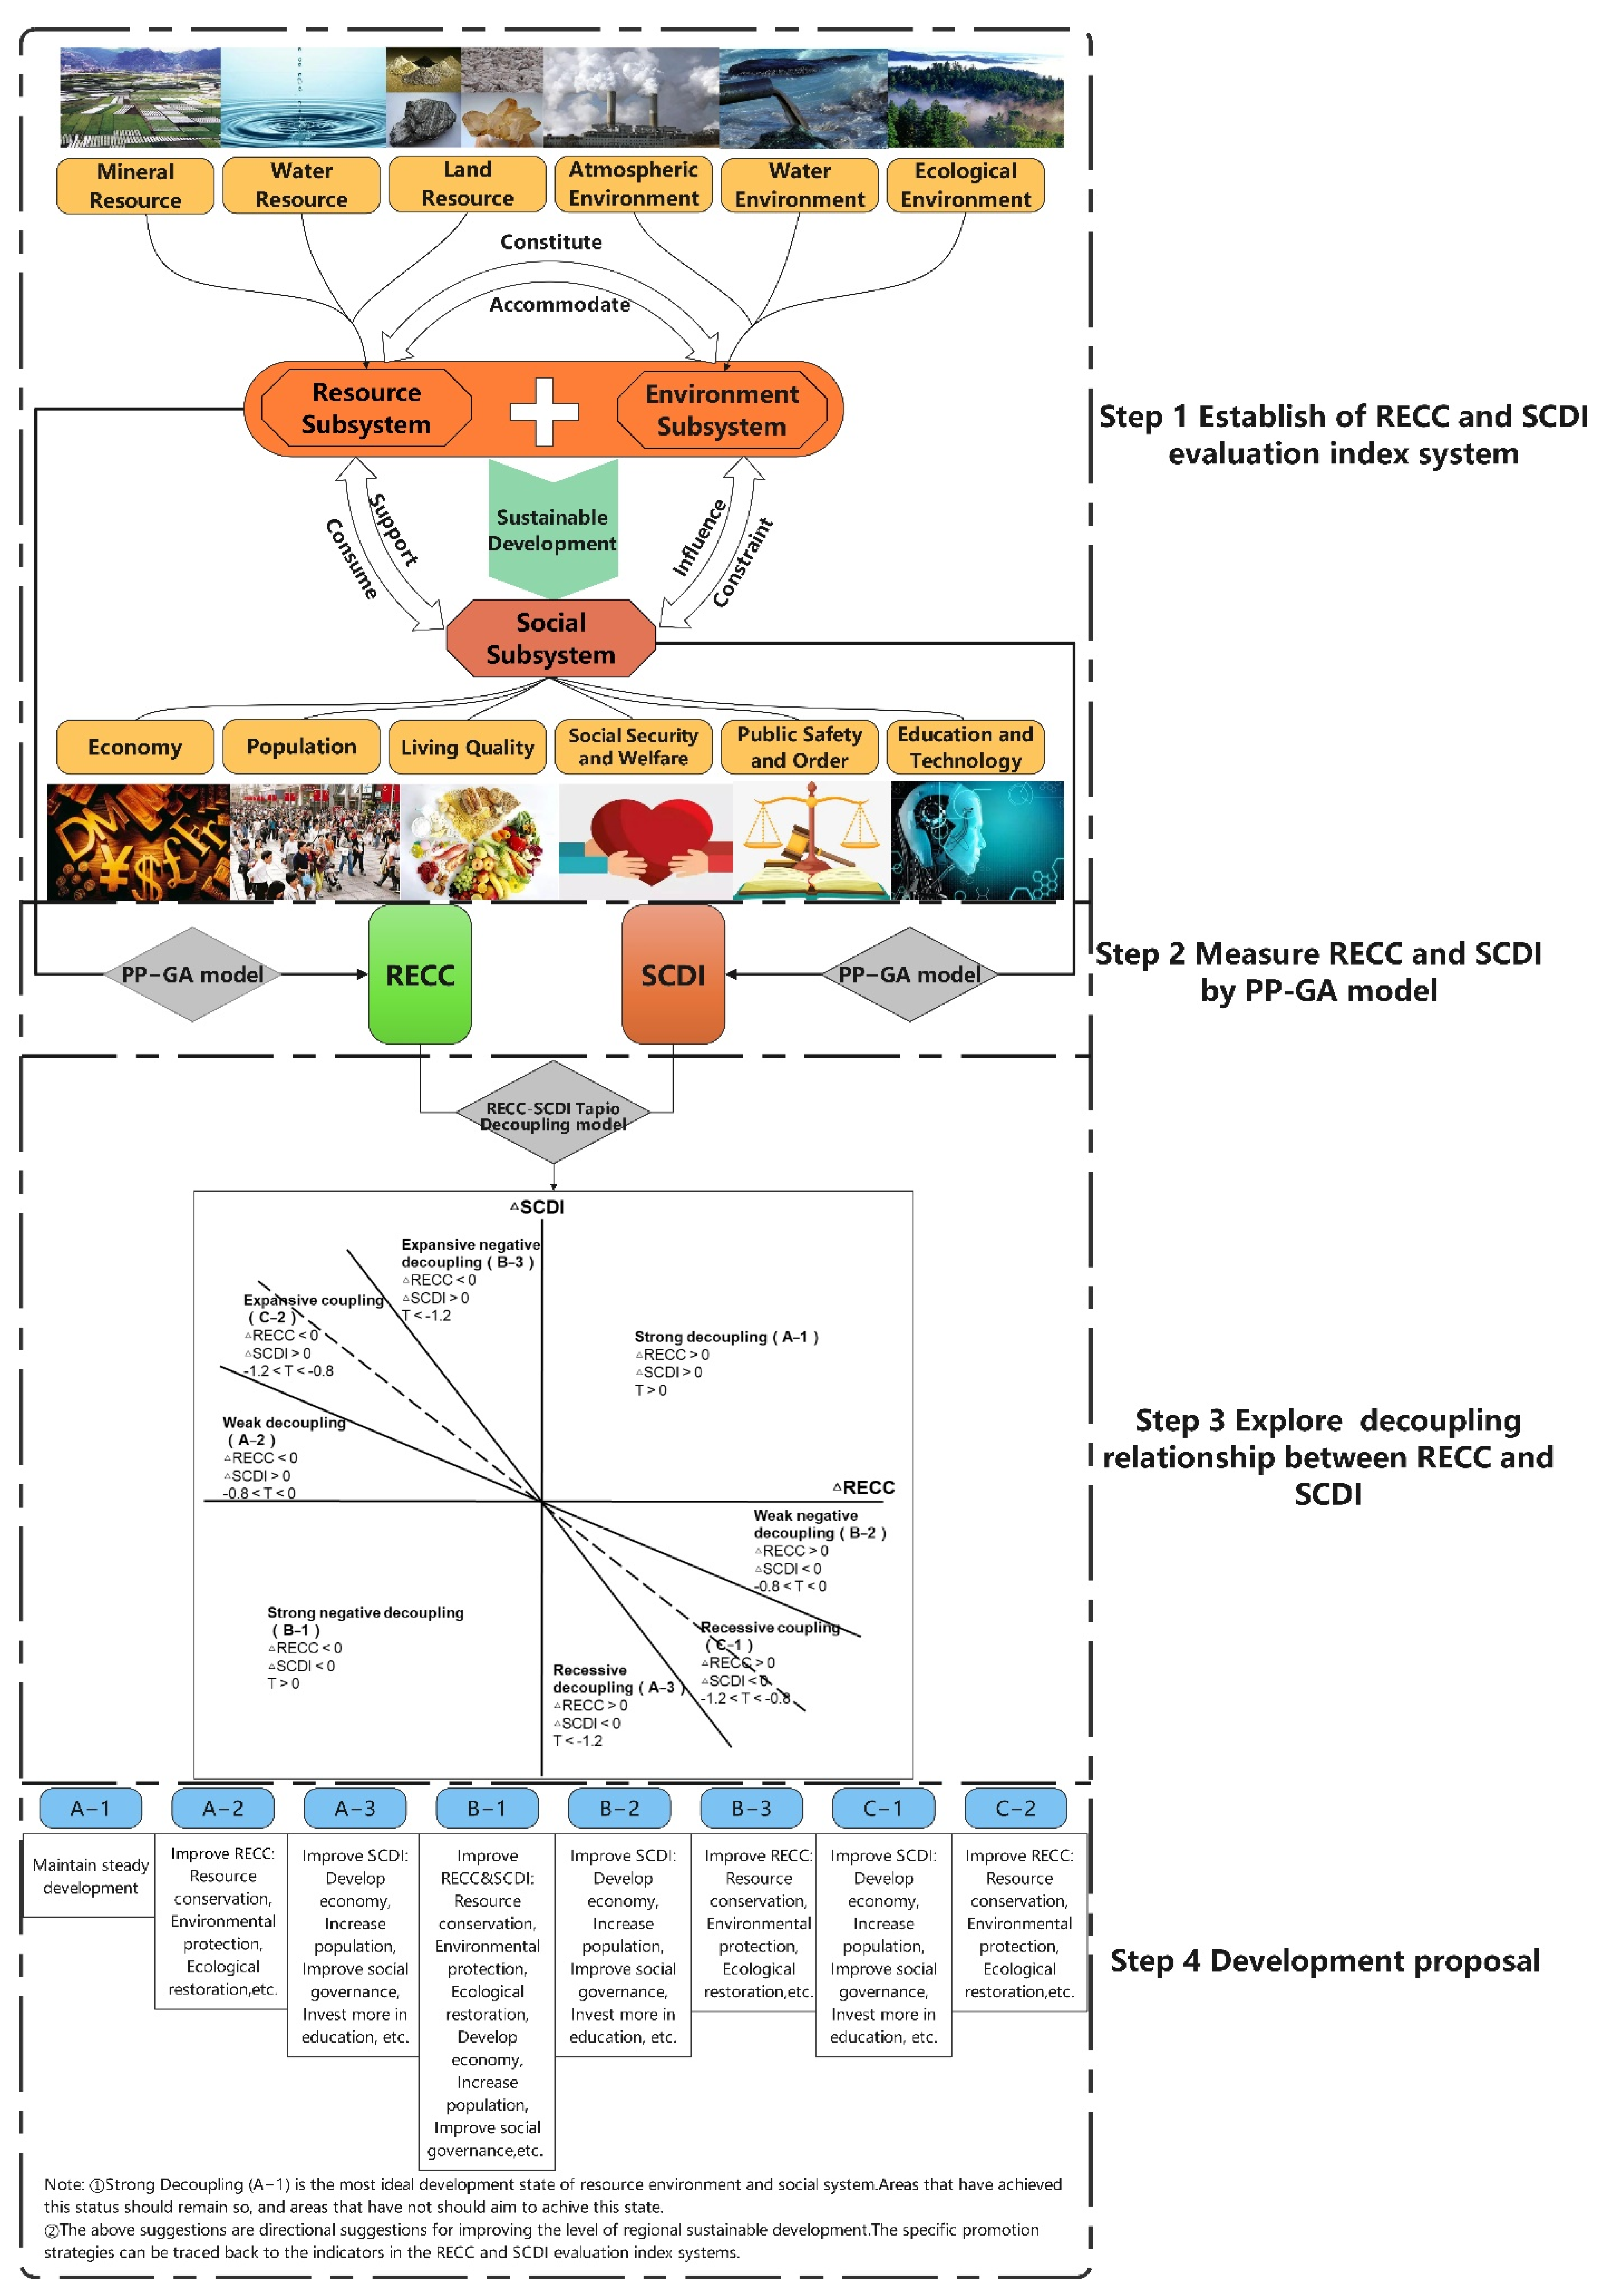
2.3. Index System
2.3.1. RECC Evaluation Indicators System
2.3.2. SCDI Evaluation Indicators System
2.4. Construction of Data Matrix
2.5. Standardization of Indicators
2.6. Projection Pursuit Model Based on Genetic Algorithm
2.6.1. Construction of Projection Indicator Function
2.6.2. Construction of Projection Objective Function
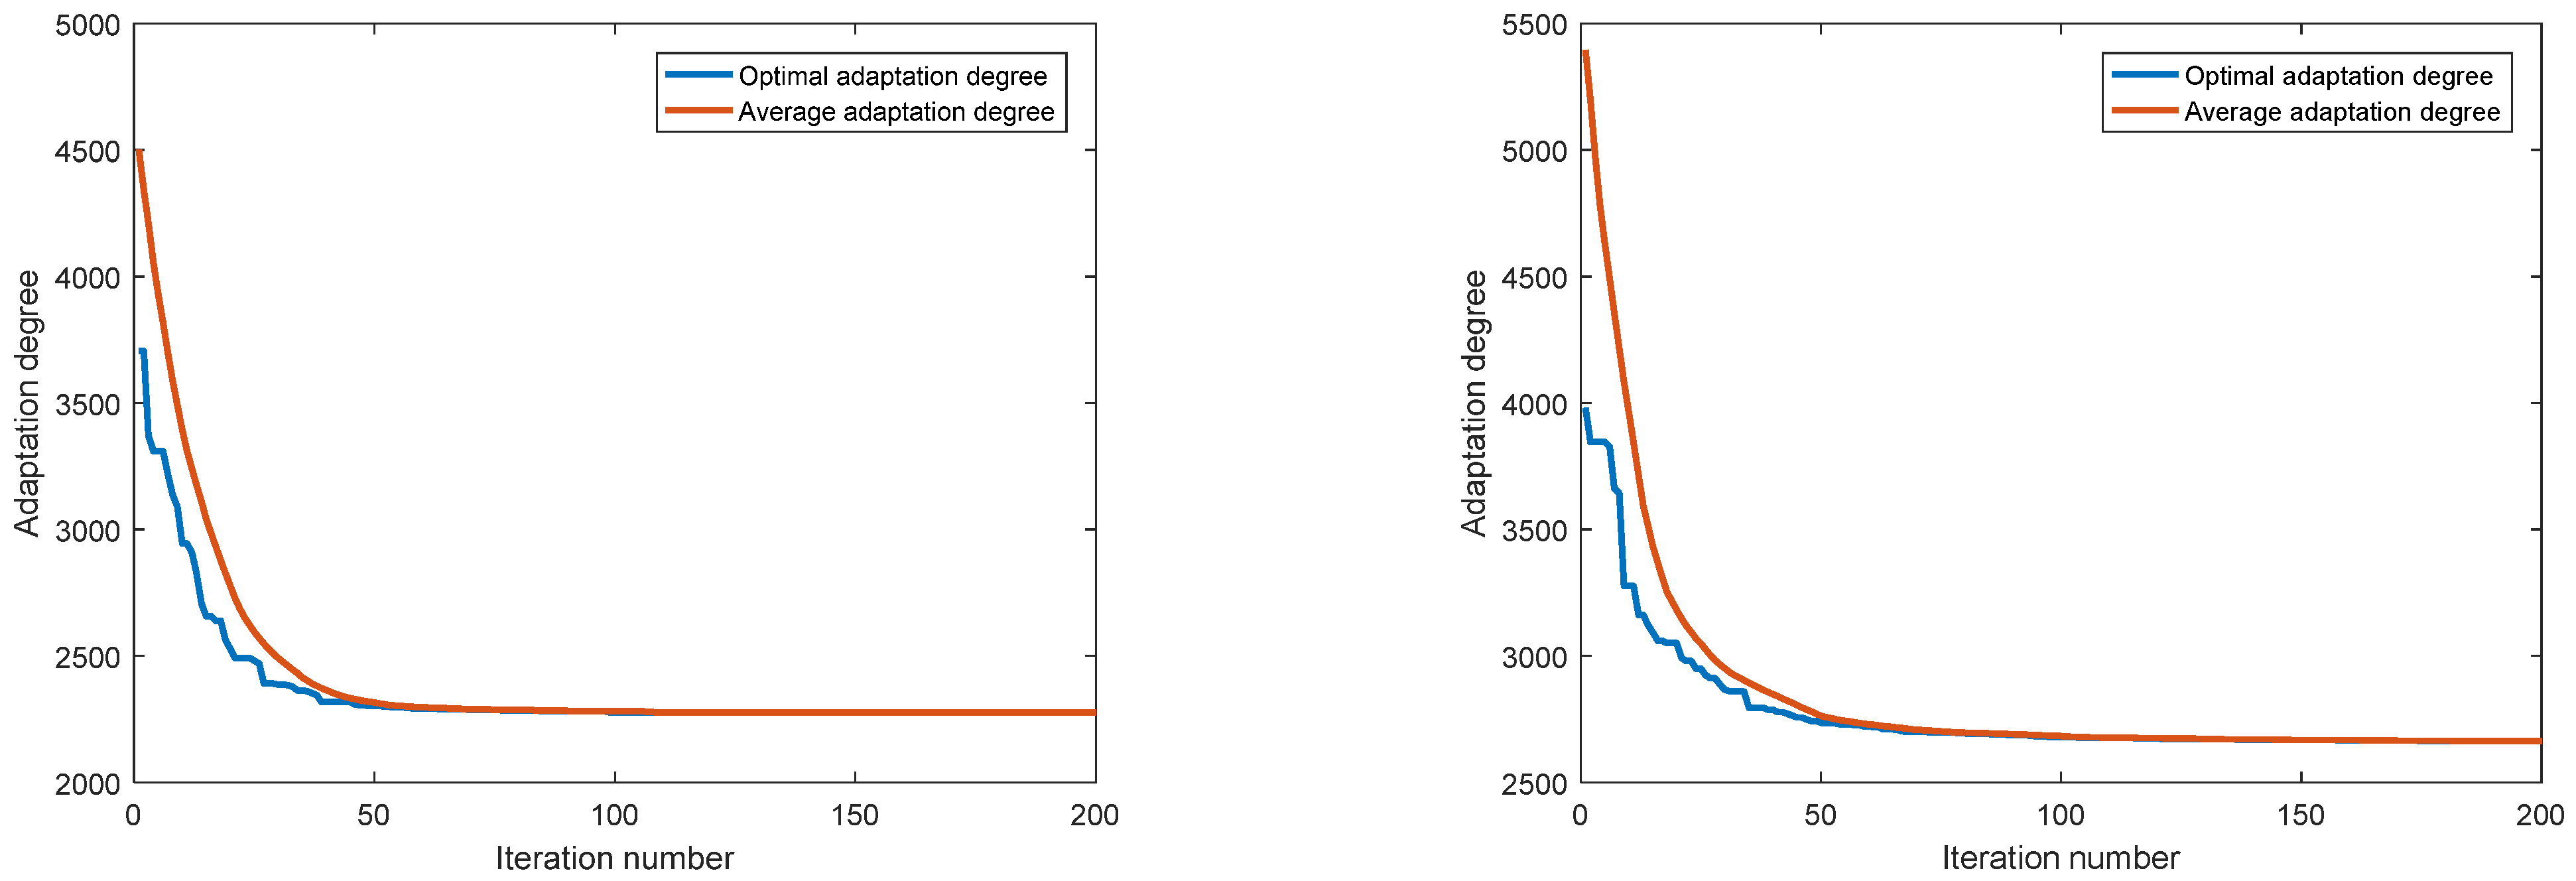
2.6.3. Optimization of Projection Objective Function by Genetic Algorithm
2.6.4. Calculation of Projection Value
2.7. RECC-SCDI Tapio Decoupling Model
3. Results
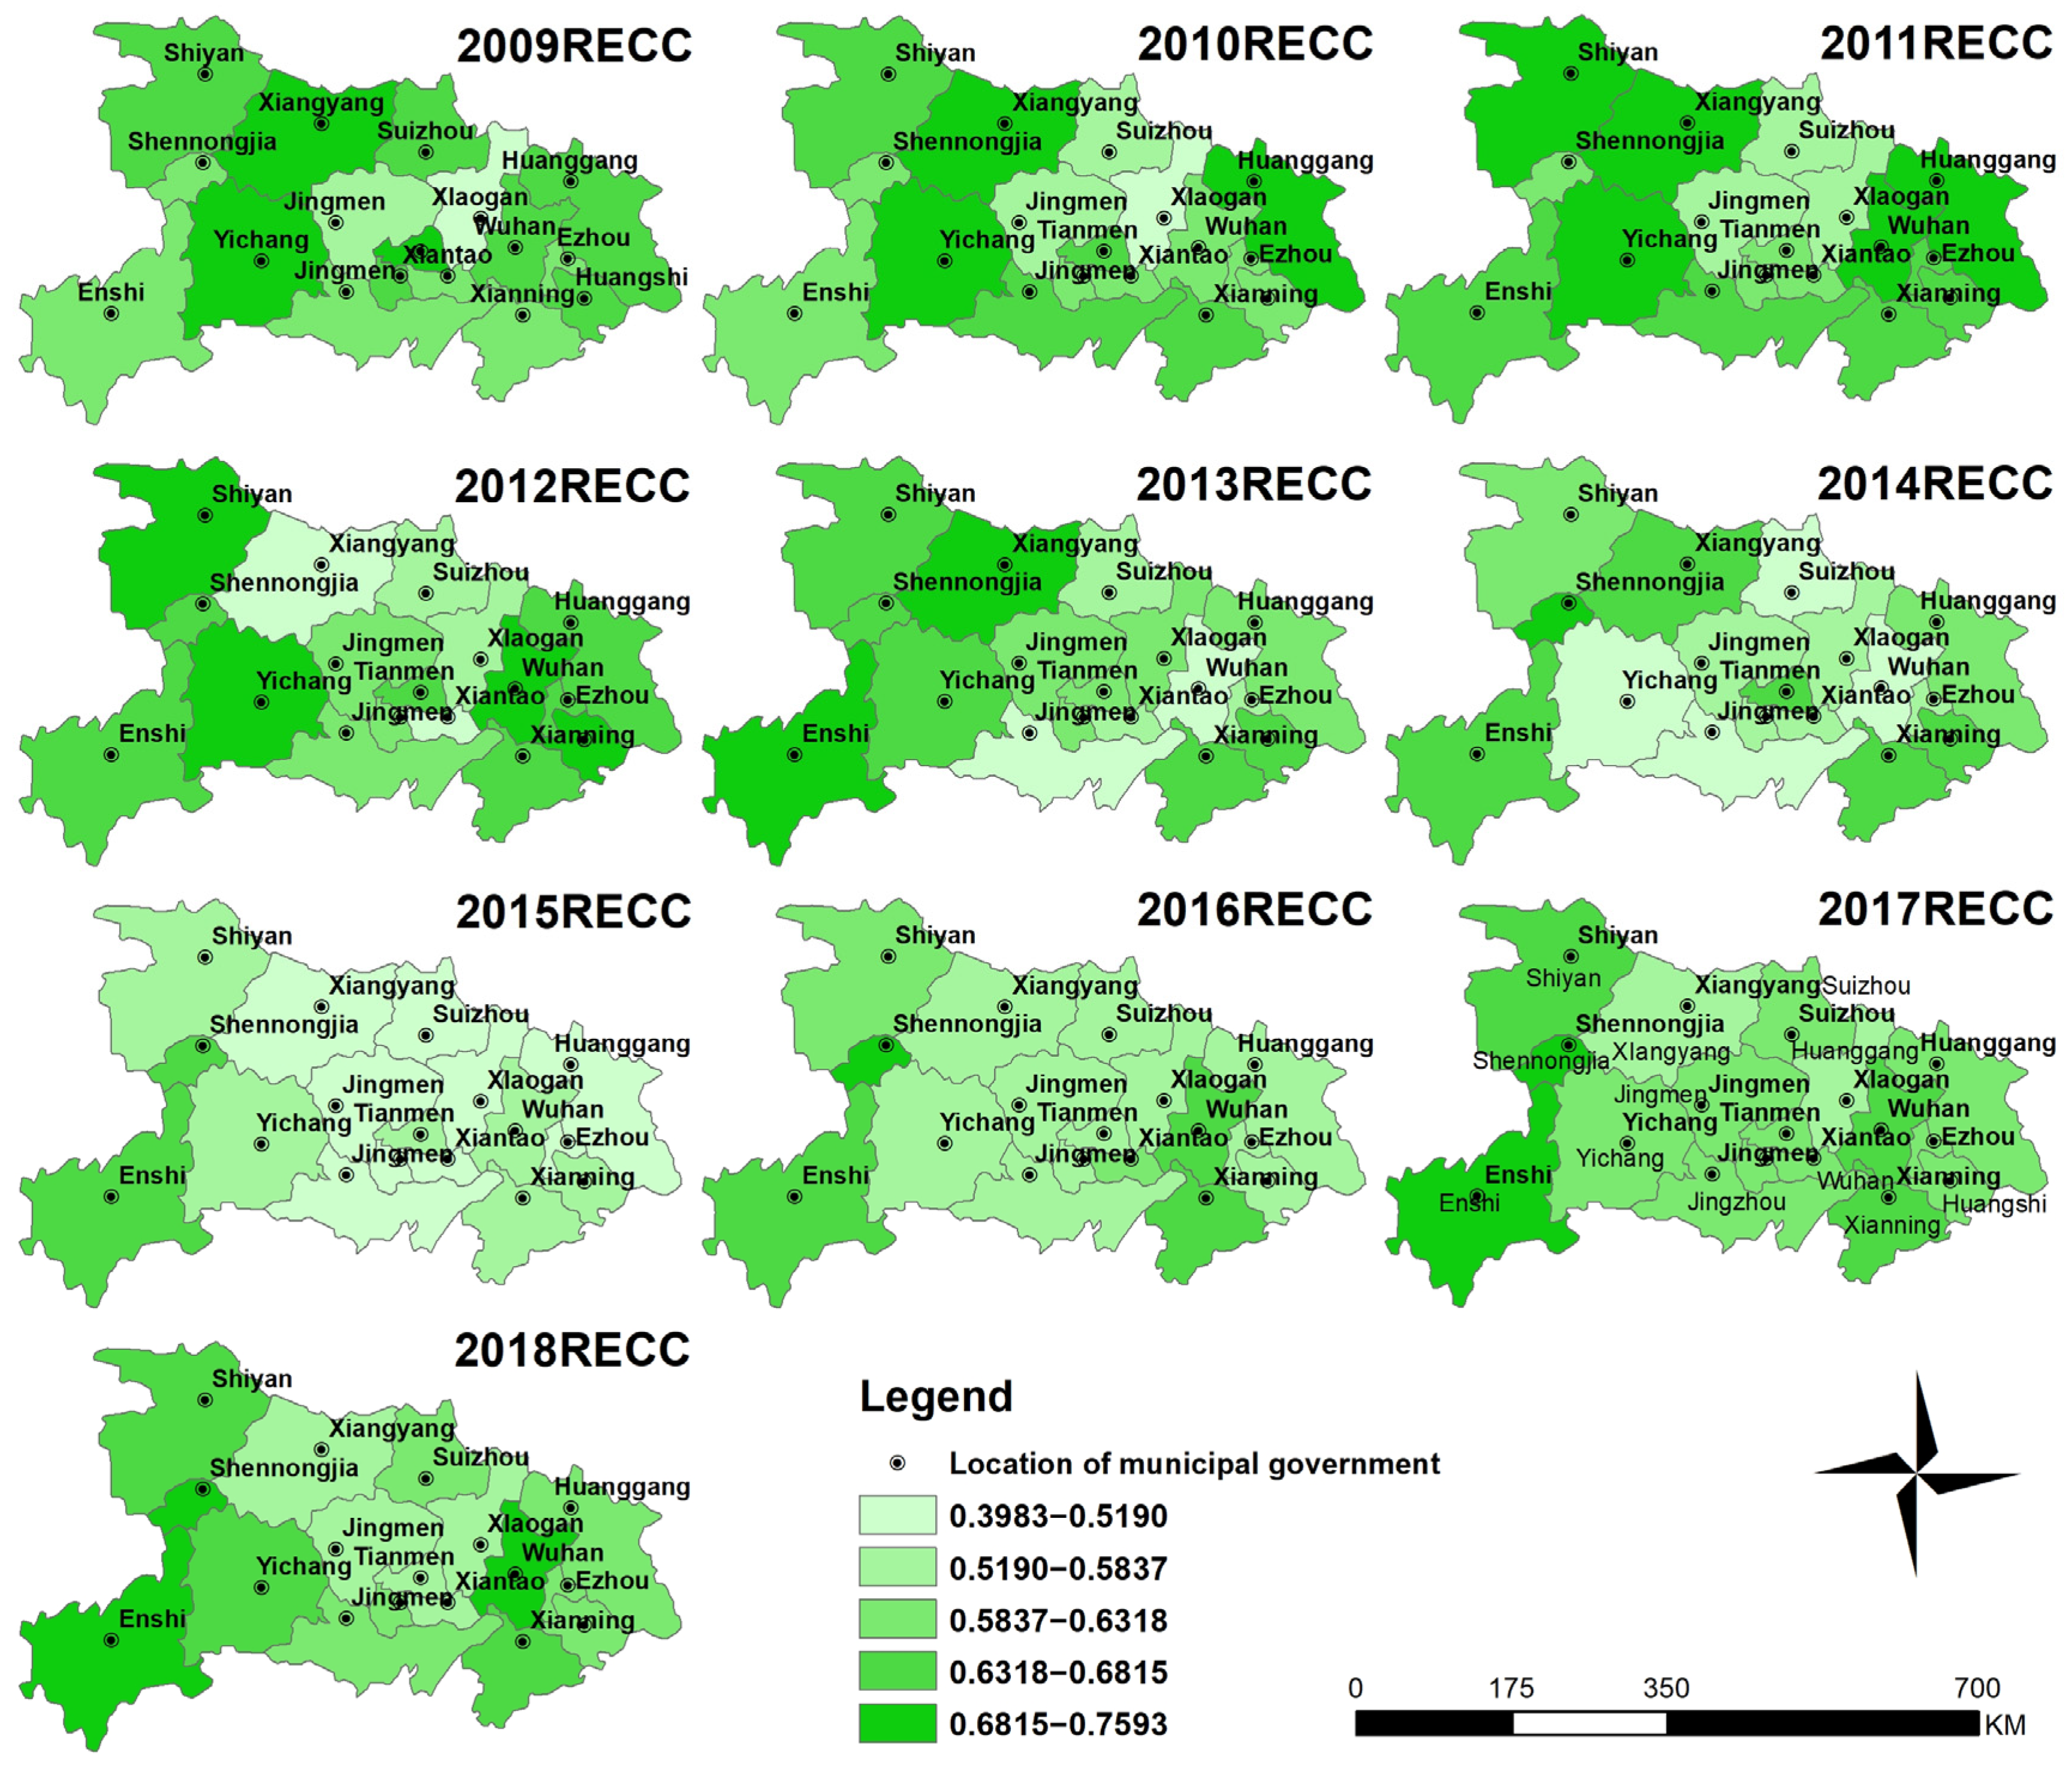
3.1. RECC of Hubei Province
3.1.1. Temporal Evolution Characteristics of RECC
3.1.2. Spatial Distribution Characteristics of RECC
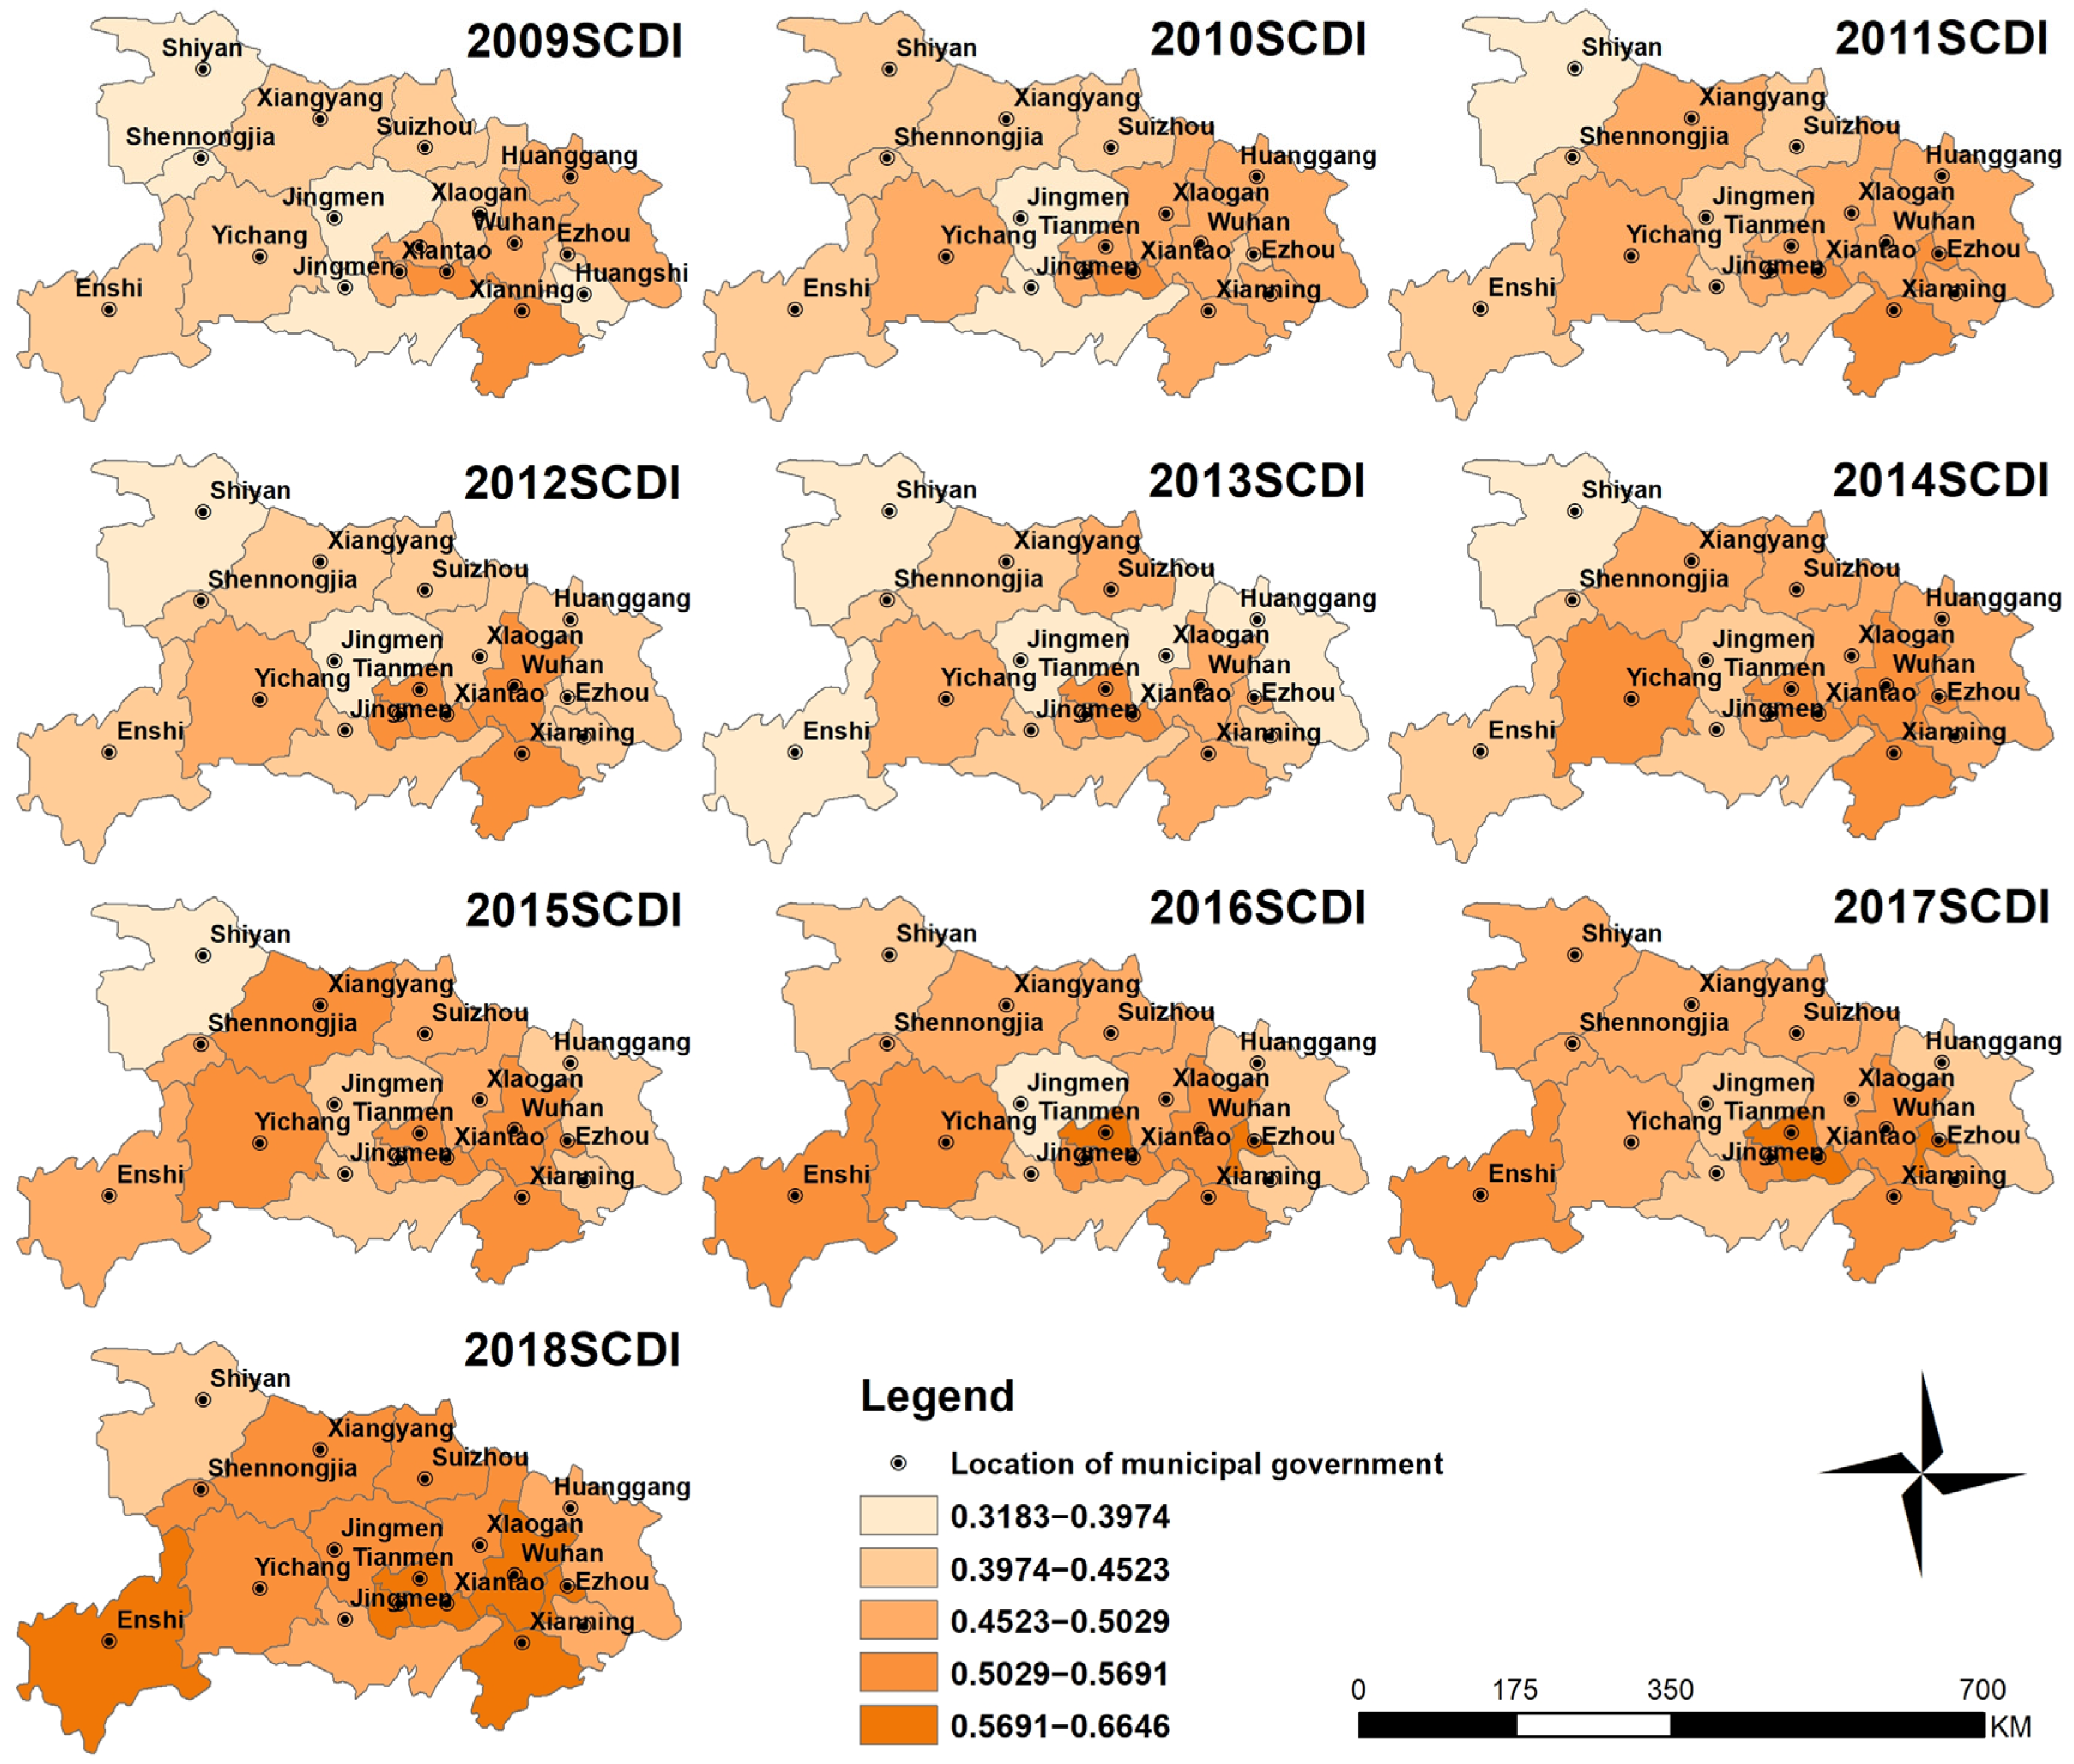
3.2. SCDI of Hubei Province
3.2.1. Temporal Evolution Characteristics of SCDI
3.2.2. Spatial Distribution Characteristics of SCDI
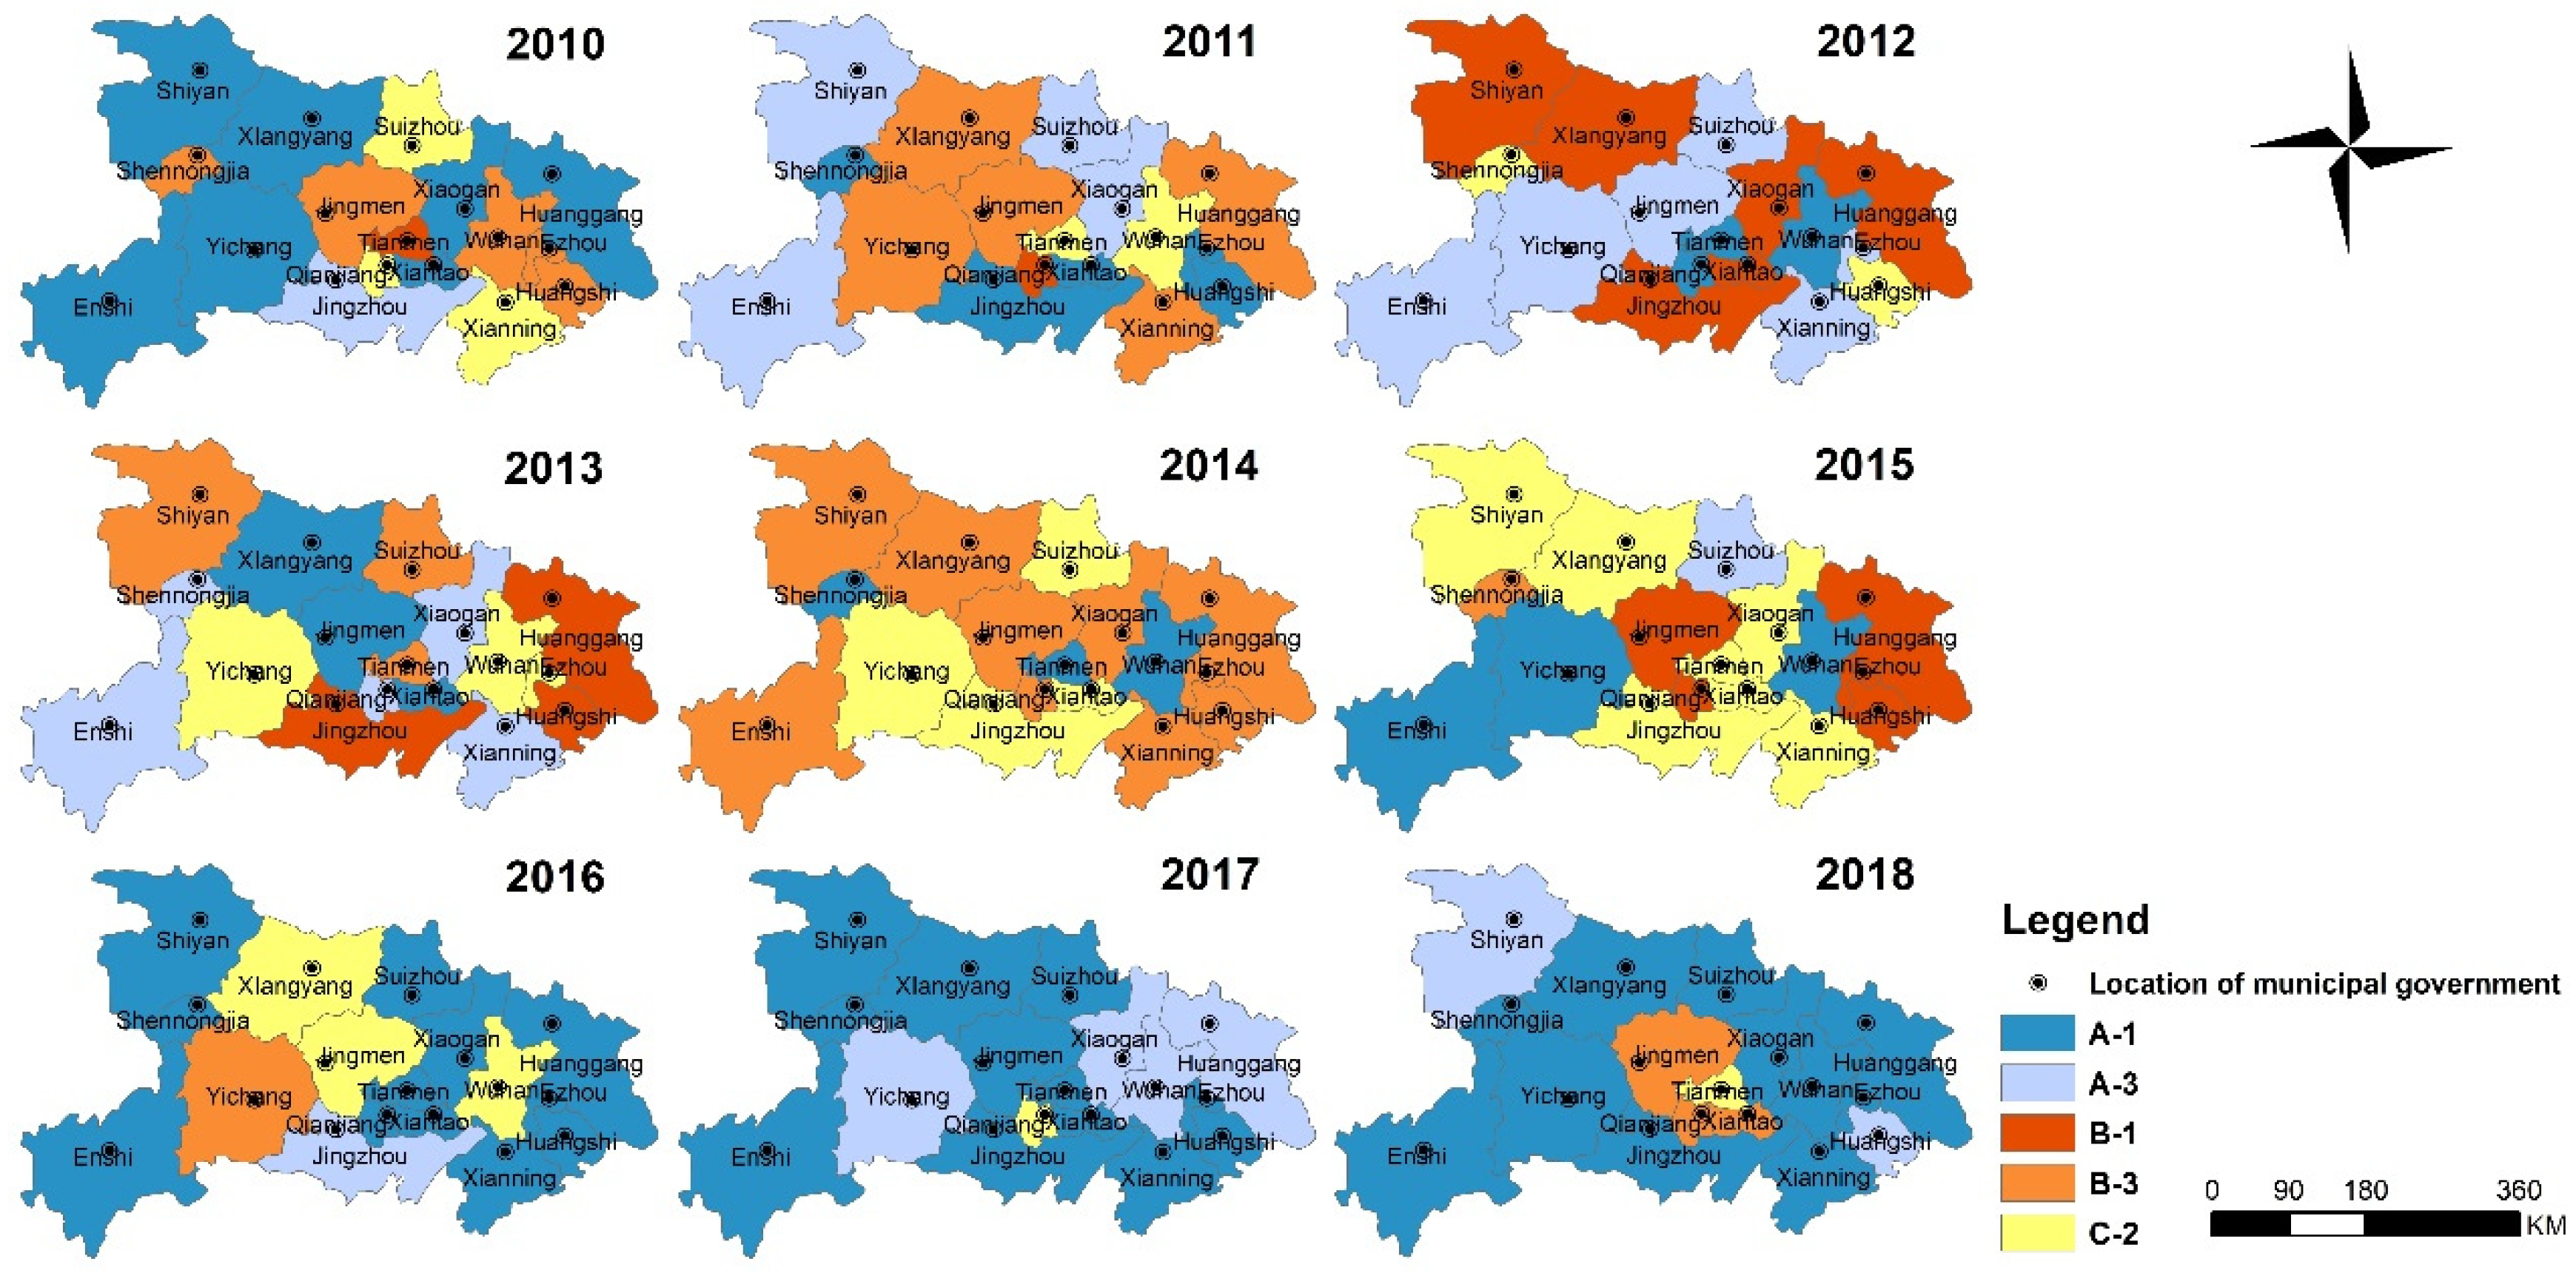
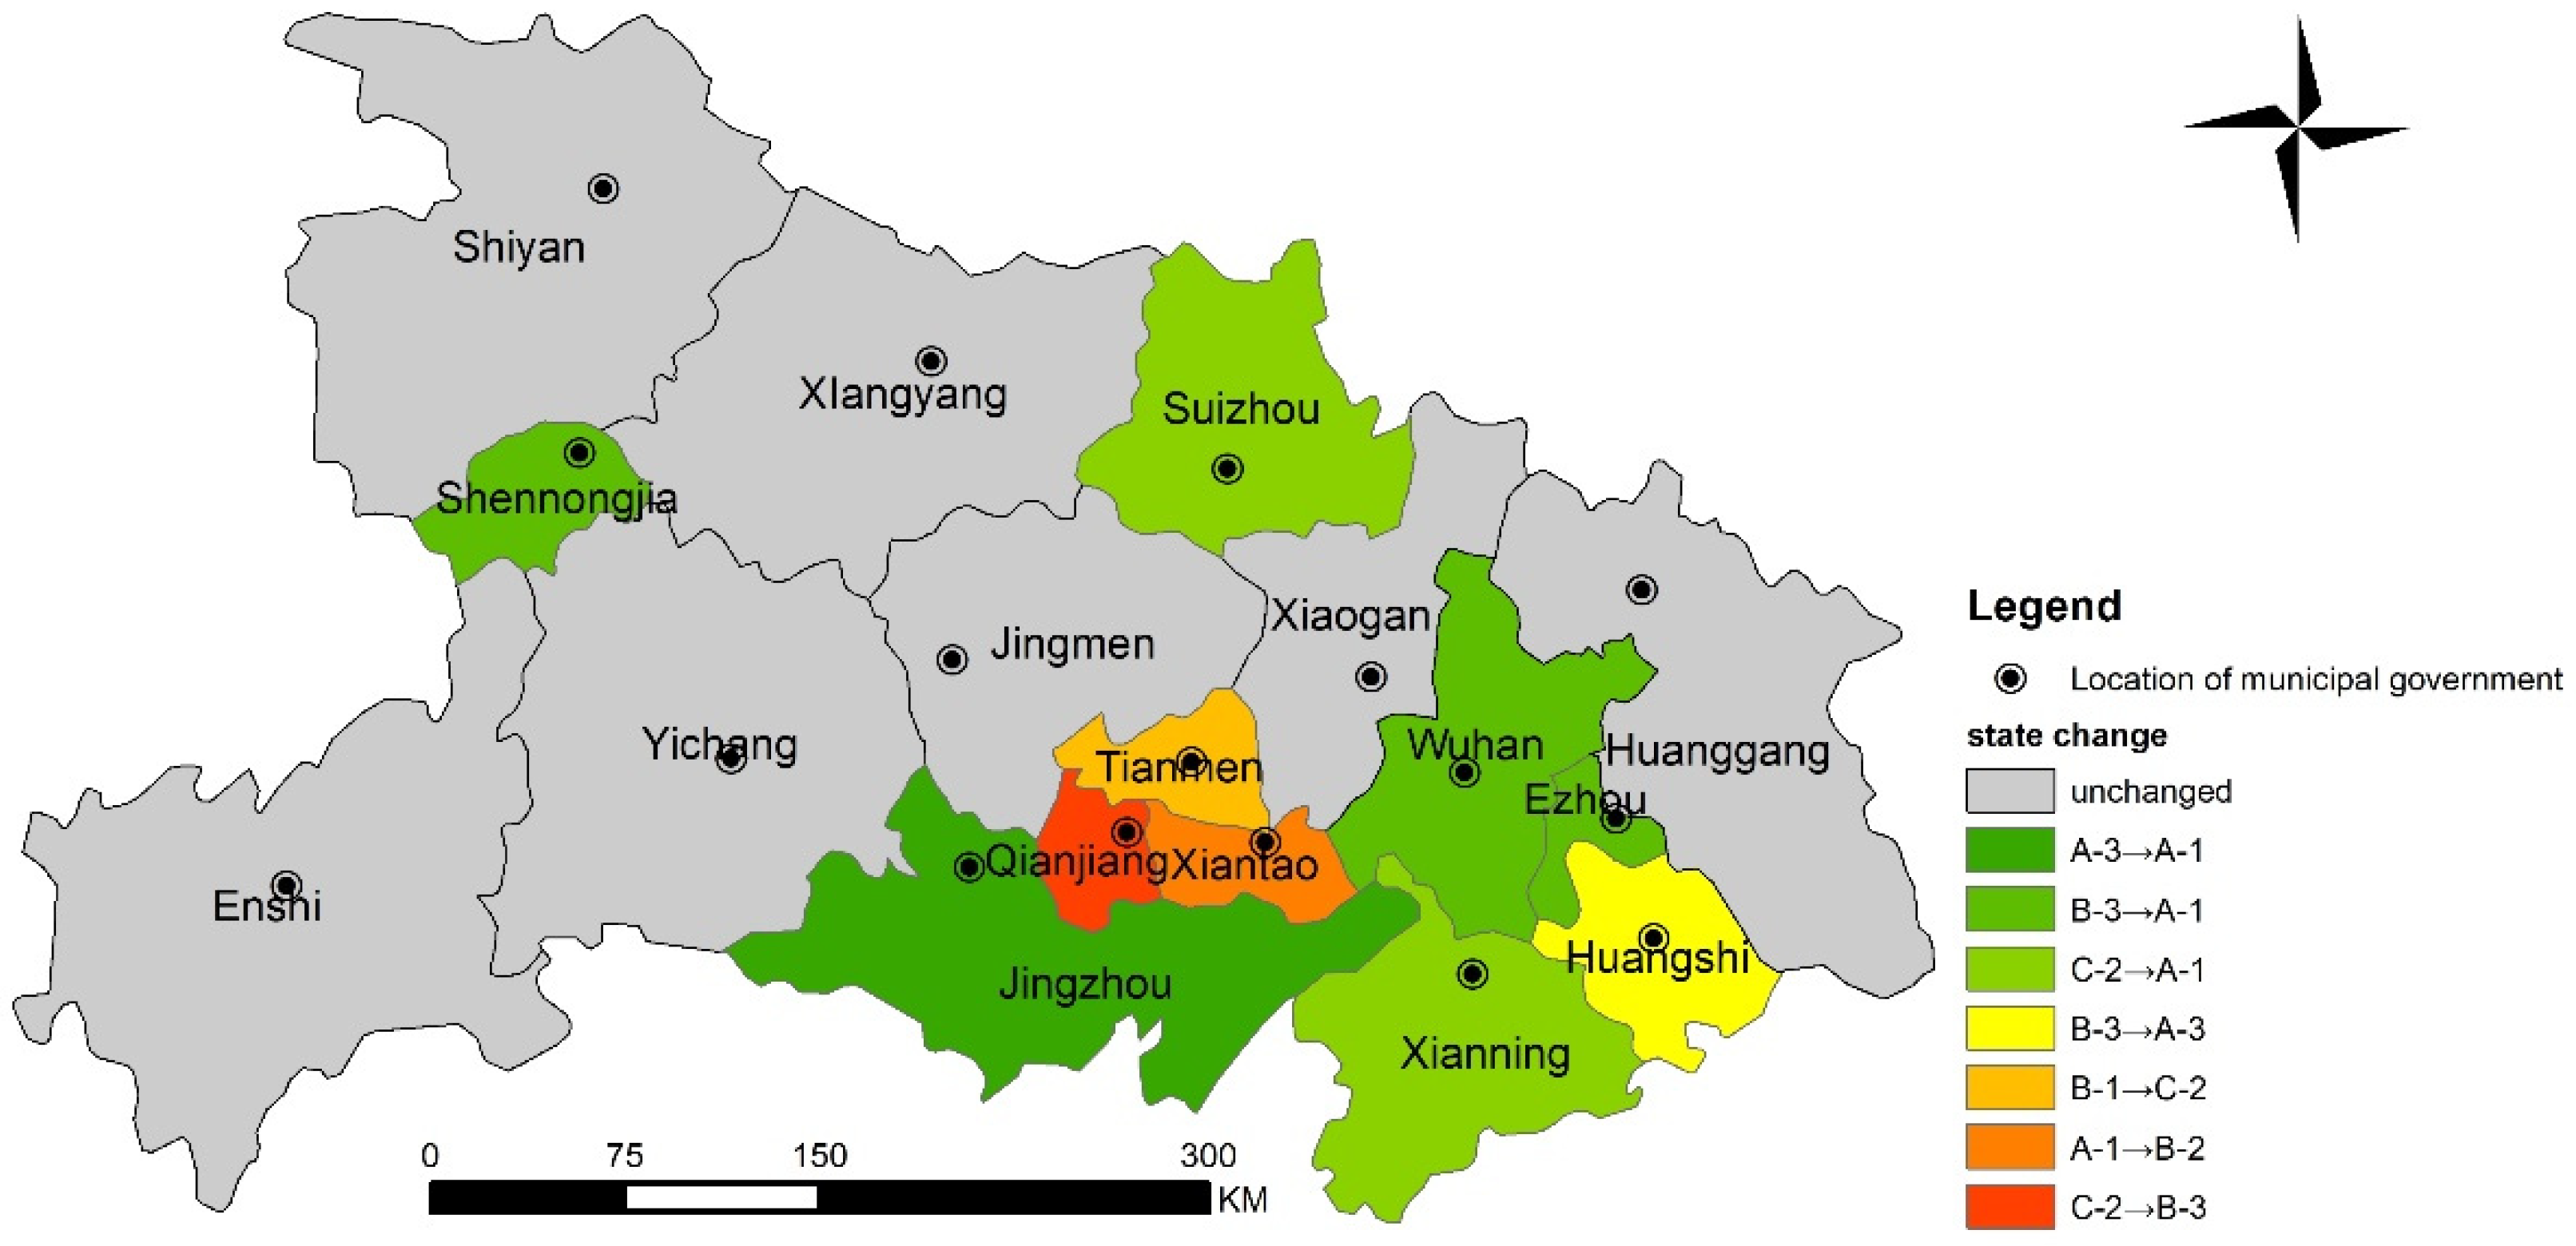
3.3. Decoupling Stage between RECC and SCDI of Hubei Province
4. Discussion
5. Conclusions
Author Contributions
Funding
Institutional Review Board Statement
Informed Consent Statement
Data Availability Statement
Conflicts of Interest
Appendix A


| Cities | Year | RECC | SCDI | Tapio Index | Decoupling State |
|---|---|---|---|---|---|
| Wuhan | 2009 | 0.6512 | 0.4600 | - | - |
| 2010 | 0.6318 | 0.4955 | −0.3033 | B-3 | |
| 2011 | 0.6883 | 0.4817 | −2.2462 | C-2 | |
| 2012 | 0.7381 | 0.4935 | 1.9835 | A-1 | |
| 2013 | 0.4667 | 0.5021 | −22.5700 | C-2 | |
| 2014 | 0.5129 | 0.5363 | 1.5172 | A-1 | |
| 2015 | 0.5238 | 0.5652 | 0.4272 | A-1 | |
| 2016 | 0.6340 | 0.5605 | −22.3052 | C-2 | |
| 2017 | 0.6680 | 0.5385 | −1.1028 | A-3 | |
| 2018 | 0.7011 | 0.6646 | 0.2003 | A-1 | |
| Huangshi | 2009 | 0.6549 | 0.3974 | - | - |
| 2010 | 0.6214 | 0.4628 | −0.2313 | B-3 | |
| 2011 | 0.6386 | 0.4707 | 1.1788 | A-1 | |
| 2012 | 0.7311 | 0.4501 | −2.0308 | C-2 | |
| 2013 | 0.6706 | 0.4285 | 1.1056 | B-1 | |
| 2014 | 0.6377 | 0.4695 | −0.3768 | B-3 | |
| 2015 | 0.5377 | 0.4054 | 0.8657 | B-1 | |
| 2016 | 0.5802 | 0.4425 | 0.6592 | A-1 | |
| 2017 | 0.5989 | 0.4828 | 0.2845 | A-1 | |
| 2018 | 0.6312 | 0.4612 | −0.8826 | A-3 | |
| Shiyan | 2009 | 0.6613 | 0.3255 | - | - |
| 2010 | 0.6643 | 0.4420 | 0.0085 | A-1 | |
| 2011 | 0.7210 | 0.3860 | −0.3606 | A-3 | |
| 2012 | 0.6999 | 0.3183 | 0.0760 | B-1 | |
| 2013 | 0.6456 | 0.3685 | −0.2807 | B-3 | |
| 2014 | 0.6177 | 0.3809 | −0.7912 | B-3 | |
| 2015 | 0.5780 | 0.3937 | −1.3015 | C-2 | |
| 2016 | 0.6302 | 0.4463 | 0.4797 | A-1 | |
| 2017 | 0.6631 | 0.5005 | 0.3237 | A-1 | |
| 2018 | 0.6632 | 0.4299 | −0.0006 | A-3 | |
| Yichang | 2009 | 0.7162 | 0.4031 | - | - |
| 2010 | 0.7211 | 0.4652 | 0.0287 | A-1 | |
| 2011 | 0.6859 | 0.4867 | −0.7490 | B-3 | |
| 2012 | 0.7242 | 0.4624 | −0.7143 | A-3 | |
| 2013 | 0.6728 | 0.4723 | −2.3232 | C-2 | |
| 2014 | 0.4357 | 0.5223 | −3.9930 | C-2 | |
| 2015 | 0.5794 | 0.5569 | 4.7897 | A-1 | |
| 2016 | 0.5782 | 0.5691 | −0.0952 | B-3 | |
| 2017 | 0.6014 | 0.4821 | −0.2108 | A-3 | |
| 2018 | 0.6356 | 0.5074 | 0.8617 | A-1 | |
| Xiangyang | 2009 | 0.6910 | 0.4245 | - | - |
| 2010 | 0.7020 | 0.4380 | 0.3127 | A-1 | |
| 2011 | 0.6933 | 0.4566 | −0.1913 | B-3 | |
| 2012 | 0.4977 | 0.4073 | 2.1356 | B-1 | |
| 2013 | 0.7046 | 0.4361 | 3.6380 | A-1 | |
| 2014 | 0.6428 | 0.4841 | −0.5995 | B-3 | |
| 2015 | 0.4900 | 0.5192 | −3.4693 | C-2 | |
| 2016 | 0.5539 | 0.4879 | −1.9034 | C-2 | |
| 2017 | 0.5584 | 0.4953 | 0.4778 | A-1 | |
| 2018 | 0.5755 | 0.5156 | 0.6719 | A-1 | |
| Ezhou | 2009 | 0.6107 | 0.4420 | - | - |
| 2010 | 0.5967 | 0.4505 | −0.9029 | B-3 | |
| 2011 | 0.6410 | 0.5094 | 0.4496 | A-1 | |
| 2012 | 0.6592 | 0.4432 | −0.1473 | A-3 | |
| 2013 | 0.5736 | 0.4638 | −2.2655 | C-2 | |
| 2014 | 0.5486 | 0.5175 | −0.3543 | B-3 | |
| 2015 | 0.4429 | 0.5099 | 15.0296 | B-1 | |
| 2016 | 0.5341 | 0.5908 | 1.4361 | A-1 | |
| 2017 | 0.5875 | 0.5951 | 13.9362 | A-1 | |
| 2018 | 0.6030 | 0.6500 | 0.3092 | A-1 | |
| Jingmen | 2009 | 0.5762 | 0.3717 | - | - |
| 2010 | 0.5608 | 0.3840 | −0.5531 | B-3 | |
| 2011 | 0.5388 | 0.4244 | −0.2931 | B-3 | |
| 2012 | 0.5837 | 0.3903 | −0.6922 | A-3 | |
| 2013 | 0.5865 | 0.3940 | 0.3327 | A-1 | |
| 2014 | 0.5488 | 0.4173 | −0.8255 | B-3 | |
| 2015 | 0.4968 | 0.4085 | 3.6918 | B-1 | |
| 2016 | 0.5731 | 0.3851 | −1.7990 | C-2 | |
| 2017 | 0.6039 | 0.4212 | 0.4013 | A-1 | |
| 2018 | 0.5687 | 0.5104 | −0.2475 | B-3 | |
| Xiaogan | 2009 | 0.4864 | 0.4501 | - | - |
| 2010 | 0.5148 | 0.4810 | 0.7959 | A-1 | |
| 2011 | 0.5438 | 0.4598 | −1.0770 | A-3 | |
| 2012 | 0.5226 | 0.4430 | 0.9041 | B-1 | |
| 2013 | 0.5895 | 0.3581 | −0.4058 | A-3 | |
| 2014 | 0.5631 | 0.4573 | −0.1310 | B-3 | |
| 2015 | 0.4556 | 0.4658 | −10.5187 | C-2 | |
| 2016 | 0.5653 | 0.4696 | 24.4218 | A-1 | |
| 2017 | 0.5705 | 0.4603 | −0.3781 | A-3 | |
| 2018 | 0.5746 | 0.5365 | 0.0396 | A-1 | |
| Jingzhou | 2009 | 0.6168 | 0.3952 | - | - |
| 2010 | 0.6449 | 0.3650 | −0.3371 | A-3 | |
| 2011 | 0.6526 | 0.4366 | 0.0404 | A-1 | |
| 2012 | 0.6054 | 0.4244 | 1.8208 | B-1 | |
| 2013 | 0.4727 | 0.4241 | 249.7213 | B-1 | |
| 2014 | 0.4274 | 0.4523 | −1.5226 | C-2 | |
| 2015 | 0.4916 | 0.4441 | −7.4873 | C-2 | |
| 2016 | 0.5541 | 0.4066 | −1.1012 | A-3 | |
| 2017 | 0.6065 | 0.4343 | 0.9923 | A-1 | |
| 2018 | 0.6227 | 0.4718 | 0.2352 | A-1 | |
| Huanggang | 2009 | 0.6353 | 0.4547 | - | - |
| 2010 | 0.7394 | 0.4578 | 14.9250 | A-1 | |
| 2011 | 0.6977 | 0.4756 | −0.9864 | B-3 | |
| 2012 | 0.6682 | 0.4354 | 0.3263 | B-1 | |
| 2013 | 0.6023 | 0.3684 | 0.3916 | B-1 | |
| 2014 | 0.5897 | 0.5029 | −0.0488 | B-3 | |
| 2015 | 0.5016 | 0.4507 | 1.2919 | B-1 | |
| 2016 | 0.5828 | 0.4509 | 288.4074 | A-1 | |
| 2017 | 0.6011 | 0.4089 | −0.2292 | A-3 | |
| 2018 | 0.6089 | 0.4885 | 0.0535 | A-1 | |
| Xianning | 2009 | 0.6218 | 0.5038 | - | - |
| 2010 | 0.6547 | 0.4956 | −2.4606 | C-2 | |
| 2011 | 0.6489 | 0.5176 | −0.1597 | B-3 | |
| 2012 | 0.6717 | 0.4858 | −0.4155 | A-3 | |
| 2013 | 0.6815 | 0.4785 | −0.6842 | A-3 | |
| 2014 | 0.6478 | 0.5061 | −0.6725 | B-3 | |
| 2015 | 0.5676 | 0.5203 | −4.0463 | C-2 | |
| 2016 | 0.6371 | 0.5334 | 4.0518 | A-1 | |
| 2017 | 0.6597 | 0.5479 | 1.0834 | A-1 | |
| 2018 | 0.6671 | 0.6031 | 0.1009 | A-1 | |
| Suizhou | 2009 | 0.6557 | 0.4384 | - | - |
| 2010 | 0.5495 | 0.4475 | −6.3906 | C-2 | |
| 2011 | 0.5542 | 0.4425 | −0.6188 | A-3 | |
| 2012 | 0.5625 | 0.4360 | −0.7806 | A-3 | |
| 2013 | 0.5575 | 0.4589 | −0.1382 | B-3 | |
| 2014 | 0.5010 | 0.4872 | −1.5947 | C-2 | |
| 2015 | 0.5136 | 0.4640 | −0.4777 | A-3 | |
| 2016 | 0.5654 | 0.4684 | 8.8176 | A-1 | |
| 2017 | 0.5963 | 0.4742 | 3.4725 | A-1 | |
| 2018 | 0.6204 | 0.5118 | 0.4194 | A-1 | |
| Enshi | 2009 | 0.5943 | 0.4186 | - | - |
| 2010 | 0.6130 | 0.4284 | 0.9349 | A-1 | |
| 2011 | 0.6582 | 0.4100 | −1.0677 | A-3 | |
| 2012 | 0.6602 | 0.4019 | −0.0914 | A-3 | |
| 2013 | 0.6860 | 0.3799 | −0.3959 | A-3 | |
| 2014 | 0.6483 | 0.4259 | −0.2982 | B-3 | |
| 2015 | 0.6548 | 0.4788 | 0.0593 | A-1 | |
| 2016 | 0.6785 | 0.5459 | 0.2076 | A-1 | |
| 2017 | 0.7016 | 0.5488 | 5.0107 | A-1 | |
| 2018 | 0.7132 | 0.6005 | 0.1481 | A-1 | |
| Xiantao | 2009 | 0.6112 | 0.5171 | - | - |
| 2010 | 0.6133 | 0.5373 | 0.0787 | A-1 | |
| 2011 | 0.6225 | 0.5414 | 1.7083 | A-1 | |
| 2012 | 0.3984 | 0.5108 | 8.1675 | B-1 | |
| 2013 | 0.5808 | 0.5193 | 24.5928 | A-1 | |
| 2014 | 0.5293 | 0.5226 | −13.6087 | C-2 | |
| 2015 | 0.4972 | 0.5434 | −1.6638 | C-2 | |
| 2016 | 0.5884 | 0.5645 | 4.5273 | A-1 | |
| 2017 | 0.6188 | 0.5723 | 3.4903 | A-1 | |
| 2018 | 0.5740 | 0.6438 | −0.6487 | B-3 | |
| Qianjiang | 2009 | 0.6440 | 0.4917 | - | - |
| 2010 | 0.6056 | 0.5000 | −2.9050 | C-2 | |
| 2011 | 0.5872 | 0.4915 | 1.5031 | B-1 | |
| 2012 | 0.5936 | 0.4974 | 0.7568 | A-1 | |
| 2013 | 0.6005 | 0.4778 | −0.2365 | A-3 | |
| 2014 | 0.5716 | 0.5001 | −0.9002 | B-3 | |
| 2015 | 0.4920 | 0.4675 | 2.0321 | B-1 | |
| 2016 | 0.5590 | 0.5238 | 1.0602 | A-1 | |
| 2017 | 0.6288 | 0.5103 | −3.9410 | C-2 | |
| 2018 | 0.6148 | 0.6121 | −0.1115 | B-3 | |
| Tianmen | 2009 | 0.6892 | 0.4639 | - | - |
| 2010 | 0.6599 | 0.4555 | 1.6035 | B-1 | |
| 2011 | 0.6038 | 0.4569 | −20.8449 | C-2 | |
| 2012 | 0.6544 | 0.4938 | 0.7822 | A-1 | |
| 2013 | 0.6012 | 0.5256 | −1.1060 | B-3 | |
| 2014 | 0.6591 | 0.5442 | 2.2476 | A-1 | |
| 2015 | 0.5190 | 0.5587 | −8.6164 | C-2 | |
| 2016 | 0.5695 | 0.5823 | 2.3474 | A-1 | |
| 2017 | 0.6285 | 0.6002 | 3.2232 | A-1 | |
| 2018 | 0.5785 | 0.6433 | −1.2331 | C-2 | |
| Shennongjia | 2009 | 0.6143 | 0.3248 | - | - |
| 2010 | 0.6077 | 0.4102 | −0.0278 | B-3 | |
| 2011 | 0.6196 | 0.4384 | 0.2012 | A-1 | |
| 2012 | 0.6552 | 0.4373 | −14.9486 | C-2 | |
| 2013 | 0.6705 | 0.4171 | −0.3154 | A-3 | |
| 2014 | 0.6877 | 0.4373 | 0.3384 | A-1 | |
| 2015 | 0.6773 | 0.4710 | −0.1360 | B-3 | |
| 2016 | 0.7020 | 0.4724 | 8.3796 | A-1 | |
| 2017 | 0.7349 | 0.4928 | 0.7274 | A-1 | |
| 2018 | 0.7593 | 0.5127 | 0.5559 | A-1 |
References
- Bryan, B.A.; Gao, L.; Ye, Y.; Sun, X.; Connor, J.D.; Crossman, N.D.; Stafford-Smith, M.; Wu, J.; He, C.; Yu, D.; et al. China’s response to a national land-system sustainability emergency. Nature 2018, 559, 193–204. [Google Scholar] [CrossRef]
- Lu, Y.; Zhang, Y.; Cao, X.; Wang, C.; Wang, Y.; Zhang, M.; Ferrier, R.C.; Jenkins, A.; Yuan, J.; Bailey, M.J.; et al. Forty years of reform and opening up: China’s progress toward a sustainable path. Sci. Adv. 2019, 5, eaau9413. [Google Scholar] [CrossRef] [Green Version]
- Yue, W.; Wang, T. Logical Problems on the Evaluation of Resources and Environment Carrying Capacity for Territorial Spatial Planning. China Land Sci. 2019, 33, 1–8. [Google Scholar]
- Pan, J. From Industrial Toward Ecological in China. Science 2012, 336, 1397. [Google Scholar] [CrossRef] [Green Version]
- Niva, V.; Cai, J.; Taka, M.; Kummu, M.; Varis, O. China’s sustainable water-energy-food nexus by 2030: Impacts of urbanization on sectoral water demand. J. Clean. Prod. 2020, 251, 119755. [Google Scholar] [CrossRef]
- Xu, Y.; Xu, X.; Tang, Q. Human activity intensity of land surface: Concept, methods and application in China. J. Geogr. Sci. 2016, 26, 1349–1361. [Google Scholar] [CrossRef]
- Huang, X.; Song, Y. Evaluation model of regional resource and environment comprehensive carrying capacity based on the conjugation-wrestling mechanism. J. Nat. Resour. 2019, 34, 2103. [Google Scholar] [CrossRef]
- Zhang, F.; Wang, Y.; Ma, X.; Wang, Y.; Yang, G.; Zhu, L. Evaluation of resources and environmental carrying capacity of 36 large cities in China based on a support-pressure coupling mechanism. Sci. Total Environ. 2019, 688, 838–854. [Google Scholar] [CrossRef] [PubMed]
- Świąder, M.; Szewrański, S.; Kazak, J.K. Environmental Carrying Capacity Assessment—The Policy Instrument and Tool for Sustainable Spatial Management. Front. Environ. Sci. 2020, 8, 579838. [Google Scholar] [CrossRef]
- Feng, Z.; Yang, Y.; Yan, H.; Tao, P.; Peng, L. A review of resources and environment carrying capacity research since the 20th Century: From theory to practice. Resour. Sci. 2017, 39, 379–395. [Google Scholar] [CrossRef]
- Shen, L.; Shu, T.; Liao, X.; Yang, N.; Ren, Y.; Zhu, M.; Cheng, G.; Wang, J. A new method to evaluate urban resources environment carrying capacity from the load-and-carrier perspective. Resour. Conserv. Recycl. 2020, 154, 104616. [Google Scholar] [CrossRef]
- Fu, J.; Zang, C.; Zhang, J. Economic and resource and environmental carrying capacity trade-off analysis in the Haihe River basin in China. J. Clean. Prod. 2020, 270, 122271. [Google Scholar] [CrossRef]
- Su, Y.; Xue, H.; Liang, H. An evaluation model for urban comprehensive carrying capacity: An empirical case from harbin city. Int. J. Environ. Res. Public Health 2019, 16, 367. [Google Scholar] [CrossRef] [Green Version]
- Cheng, X.; Long, R.; Chen, H.; Li, Q. Coupling coordination degree and spatial dynamic evolution of a regional green competitiveness system—A case study from China. Ecol. Indic. 2019, 104, 489–500. [Google Scholar] [CrossRef]
- Xie, X.; Li, X.; He, W. A land space development zoning method based on resource–environmental carrying capacity: A case study of henan, China. Int. J. Environ. Res. Public Health 2020, 17, 900. [Google Scholar] [CrossRef] [PubMed] [Green Version]
- Zhou, J.; Chang, S.; Ma, W.; Wang, D. An unbalance-based evaluation framework on urban resources and environment carrying capacity. Sustain. Cities Soc. 2021, 72, 103019. [Google Scholar] [CrossRef]
- Cheng, J.; Zhou, K.; Chen, D.; Fan, J. Evaluation and analysis of provincial differences in resources and environment carrying capacity in China. Chinese Geogr. Sci. 2016, 26, 539–549. [Google Scholar] [CrossRef]
- Meadows; Donella, H.; Rome, C.O. The Limits to Growth: A Report for the Club of Rome’s Project on the Predicament of Mankind; Universe Books: New York, NY, USA, 1972. [Google Scholar]
- UNESCO; FAO. Carrying Capacity Assessment with a Pilot Study of Kenya: A Resource Accounting Methodology for Exploring National Options for Sustainable Development; Food and Agriculture Organization of the United Nations: Rome, Italy, 1985. [Google Scholar]
- Cohen, J.E. Population growth and earth’s human carrying capacity. Science 1995, 269, 341–346. [Google Scholar] [CrossRef] [PubMed] [Green Version]
- Yang, Z.; Song, J.; Cheng, D.; Xia, J.; Li, Q.; Ahamad, M.I. Comprehensive evaluation and scenario simulation for the water resources carrying capacity in Xi’an city, China. J. Environ. Manag. 2019, 230, 221–233. [Google Scholar] [CrossRef]
- Su, Y.; Yu, Y. Dynamic early warning of regional atmospheric environmental carrying capacity. Sci. Total Environ. 2020, 714, 136684. [Google Scholar] [CrossRef]
- Martire, S.; Castellani, V.; Sala, S. Carrying capacity assessment of forest resources: Enhancing environmental sustainability in energy production at local scale. Resour. Conserv. Recycl. 2015, 94, 11–20. [Google Scholar] [CrossRef]
- Lei, X.; Qiu, G. Empirical study about the carrying capacity evaluation of regional resources and environment based on entropy-weight TOPSIS model. Acta Sci. Circumstantiae 2016, 36, 314–323. [Google Scholar]
- Liao, S.; Wu, Y.; Wong, S.W.; Shen, L. Provincial perspective analysis on the coordination between urbanization growth and resource environment carrying capacity (RECC) in China. Sci. Total Environ. 2020, 730, 138964. [Google Scholar] [CrossRef] [PubMed]
- Lane, M. The carrying capacity imperative: Assessing regional carrying capacity methodologies for sustainable land-use planning. Land Use Policy 2010, 27, 1038–1045. [Google Scholar] [CrossRef] [Green Version]
- Ling, X.; Zhihong, L.; Jing, D. Study on Evaluation of Water Ecological Carrying Capacity. In Proceedinds of the Biology, Environment and Chemistry; Dan, Y., Ed.; International Association of Computer Science and Information Technology Press-IACSIT Press: Singapore, 2011; pp. 458–462. [Google Scholar]
- Liu, H. Comprehensive carrying capacity of the urban agglomeration in the Yangtze River Delta, China. Habitat Int. 2012, 36, 462–470. [Google Scholar] [CrossRef]
- Wang, D.; Shi, Y.; Wan, K. Integrated evaluation of the carrying capacities of mineral resource-based cities considering synergy between subsystems. Ecol. Indic. 2020, 108, 105701. [Google Scholar] [CrossRef]
- Li, K.; Jin, X.; Ma, D.; Jiang, P. Evaluation of Resource and Environmental Carrying Capacity of China’s Rapid-Urbanization AreasA Case Study of Xinbei District, Changzhou. Land 2019, 8, 69. [Google Scholar] [CrossRef] [Green Version]
- Klingebiel, S. Social development and the UN system. Int. Soc. Sci. J. 1999, 51, 593–598. [Google Scholar] [CrossRef]
- Grzebyk, M.; Stec, M. Sustainable Development in EU Countries: Concept and Rating of Levels of Development. Sustain. Dev. 2015, 23, 110–123. [Google Scholar] [CrossRef]
- Ng, T.H.; Lye, C.T.; Chan, K.H.; Lim, Y.Z.; Lim, Y.S. Sustainability in Asia: The Roles of Financial Development in Environmental, Social and Governance (ESG) Performance. Soc. Indic. Res. 2020, 150, 17–44. [Google Scholar] [CrossRef]
- Lane, M.; Dawes, L.; Grace, P. Scalar considerations in carrying capacity assessment: An Australian example. Popul. Environ. 2015, 36, 356–371. [Google Scholar] [CrossRef] [Green Version]
- Luo, W.; Ren, Y.; Shen, L.; Zhu, M.; Jiang, Y.; Meng, C.; Zhang, P. An evolution perspective on the urban land carrying capacity in the urbanization era of China. Sci. Total Environ. 2020, 744, 140827. [Google Scholar] [CrossRef] [PubMed]
- Peng, T.; Deng, H. Study on the division of main functional regions based on relative carrying capacity of resources: A case study of Guiyang, southwest China. Environ. Dev. Sustain. 2021, 23, 9493–9513. [Google Scholar] [CrossRef]
- Wang, X.; Zhan, W.; Wang, S. Uncertain water environment carrying capacity simulation based on the Monte Carlo method–system dynamics model: A case study of Fushun City. Int. J. Environ. Res. Public Health 2020, 17, 5860. [Google Scholar] [CrossRef] [PubMed]
- Qin, G.; Li, H.; Wang, X.; Ding, J. Research on Water Resources Design Carrying Capacity. Water 2016, 8, 157. [Google Scholar] [CrossRef] [Green Version]
- Jia, Z.; Cai, Y.; Chen, Y.; Zeng, W. Regionalization of water environmental carrying capacity for supporting the sustainable water resources management and development in China. Resour. Conserv. Recycl. 2018, 134, 282–293. [Google Scholar] [CrossRef]
- Zhou, X.-Y.; Zheng, B.; Khu, S.-T. Validation of the hypothesis on carrying capacity limits using the water environment carrying capacity. Sci. Total Environ. 2019, 665, 774–784. [Google Scholar] [CrossRef]
- Wang, J.; Wei, X.; Guo, Q. A three-dimensional evaluation model for regional carrying capacity of ecological environment to social economic development: Model development and a case study in China. Ecol. Indic. 2018, 89, 348–355. [Google Scholar] [CrossRef]
- Chapman, E.J.; Byron, C.J. The flexible application of carrying capacity in ecology. Glob. Ecol. Conserv. 2018, 13, e00365. [Google Scholar] [CrossRef]
- Wu, X.; Hu, F. Analysis of ecological carrying capacity using a fuzzy comprehensive evaluation method. Ecol. Indic. 2020, 113, 106243. [Google Scholar] [CrossRef]
- Tapio, P. Towards a theory of decoupling: Degrees of decoupling in the EU and the case of road traffic in Finland between 1970 and 2001. Transp. Policy 2005, 12, 137–151. [Google Scholar] [CrossRef] [Green Version]
- Wang, F.; Xu, H. Decoupling elasticity of carbon emissions and economic growth of transportation industry in Zhejiang province and its influencing factors. J. Environ. Prot. Ecol. 2021, 22, 750–759. [Google Scholar]
- Wu, X.; Wang, L.; Zheng, H. A network effect on the decoupling of industrial waste gas emissions and industrial added value: A case study of China. J. Clean. Prod. 2019, 234, 1338–1350. [Google Scholar] [CrossRef]
- Mao, H.Y.; Yu, D.L. A study on the quantitative research of regional carrying capacity. Adv. Earth Sci. 2001, 16, 549–555. [Google Scholar] [CrossRef]
- Peng, T.; Deng, H. Comprehensive evaluation on water resource carrying capacity based on DPESBR framework: A case study in Guiyang, southwest China. J. Clean. Prod. 2020, 268, 20090–20103. [Google Scholar] [CrossRef]
- Chen, C.H.; Wu, R.S.; Liaw, S.L.; Sue, W.R.; Chiou, I.J. A study of water-land environment carrying capacity for a river basin. Water Sci. Technol. 2000, 42, 389–396. [Google Scholar] [CrossRef]
- Liu, R.Z.; Borthwick, A.G.L. Measurement and assessment of carrying capacity of the environment in Ningbo, China. J. Environ. Manag. 2011, 92, 2047–2053. [Google Scholar] [CrossRef]
- Jung, C.; Kim, C.; Kim, S.; Suh, K. Analysis of environmental carrying capacity with emergy perspective of Jeju Island. Sustainability 2018, 10, 1681. [Google Scholar] [CrossRef] [Green Version]
- Zhou, Y.; Zhou, J. Urban atmospheric environmental capacity and atmospheric environmental carrying capacity constrained by GDP–PM2.5. Ecol. Indic. 2017, 73, 637–652. [Google Scholar] [CrossRef] [Green Version]
- OECD. The OECD List of Social Indicators; OECD: Paris, France, 1982; ISBN 9264123024. [Google Scholar]
- UNDP. HumanDevelopmentReports; UNDP: New York, NY, USA, 2020. [Google Scholar]
- Tang, J. Comparison of Comprehensive Indexes of Social Development. Stat. Decis. 1999, 4, 42–43. [Google Scholar] [CrossRef]
- China National Bureau of Statistics. Comprehensive Evaluation Scheme of Social Development Level; China National Bureau of Statistics: Beijing, China, 1993.
- Friedman, J.H.; Tukey, J.W. A Projection Pursuit Algorithm for Exploratory Data Analysis. IEEE Trans. Comput. 1974, 100, 881–890. [Google Scholar] [CrossRef]
- Zhu, Z.; Chen, Z.; Chen, X.; He, P. Approach for evaluating inundation risks in urban drainage systems. Sci. Total Environ. 2016, 553, 1–12. [Google Scholar] [CrossRef] [PubMed]
- Tang, Q.; Wang, J.; Jing, Z. Tempo-spatial changes of ecological vulnerability in resource-based urban based on genetic projection pursuit model. Ecol. Indic. 2021, 121, 107059. [Google Scholar] [CrossRef]
- Peng, B.; Zhang, X.; Elahi, E.; Wan, A. Evolution of spatial–temporal characteristics and financial development as an influencing factor of green ecology. Environ. Dev. Sustain. 2021. [Google Scholar] [CrossRef]
- State Council of China: Guiding Opinions of the State Council on Promoting the Development of the Yangtze River Economic Belt Based on the Golden Waterway. Available online: http://www.gov.cn/zhengce/content/2014-09/25/content_9092.htm (accessed on 17 August 2021).


| Factor | Indicator | No. | Unit | Attribute |
|---|---|---|---|---|
| Land resource | Cultivated area | R1 | Hectare | + |
| Woodland area | R2 | Hectare | + | |
| Grassland area | R3 | Hectare | + | |
| Construction area | R4 | Hectare | + | |
| Water resource | Total water resources | R5 | 1000 million m3 | + |
| Amount of water supply | R6 | 1000 million m3 | + | |
| Mineral resource | Natural gas supply | R7 | 10,000 m3 | + |
| Energy consumption per unit GDP | R8 | tones of standard coal/10,000 CNY | − | |
| Coal consumption | R9 | 10,000 t | + | |
| Atmospheric environment | Air quality excellent rate | R10 | % | + |
| Annual average PM10 concentration | R11 | mg/m3 | − | |
| Air quality composite index | R12 | / | − | |
| Water environment | Industrial wastewater effluent | R13 | 10,000 t | − |
| Centralized treatment rate of urban sewage | R14 | % | + | |
| City daily sewage treatment capacity | R15 | 10,000 t | + | |
| Ecological environment | Biological abundance index | R16 | / | + |
| Vegetation coverage index | R17 | / | + | |
| Water network density index | R18 | / | + |
| Institution | Document | Index/Model | Indicators (Example) |
|---|---|---|---|
| DECD | The OECD List of Social Indicators [53] | social background; self-sufficiency; fairness; health conditions; social cohesion. | Per capita national income, birth rate, divorce rate; Rate of unemployment, level of education, Basic subsidies; Public social expenditure, level of pensions; Average life, total health expenditure; Subjective well-being, suicide rate. |
| UNDP | Human development report 2020 [54] | HDI (Human Development Index) | Income; Education; Health; Gender development index; Poverty index. |
| ASHA (American Social Health Association) | ASHA Index Model [55] | ASHA Index | Rate of employment; Rate of literacy; Average life; Per capita gross national product; Birth rate; Infant mortality rate. |
| China National Bureau of Statistics | Comprehensive evaluation scheme of social development level [56] | population development; living standard; public services; social harmony. | Population growth rate, average life expectancy; Engel coefficient, disposable income of urban residents, and per capita housing area; Incidence of infectious diseases, basic social insurance coverage, number of beds in welfare units; Urban registered unemployment rate, number of criminal cases, urban-rural income ratio. |
| Factor | Indicator | No. | Unit | Attribute |
|---|---|---|---|---|
| Economy | GDP | S1 | 10,000 million CNY | + |
| GDP growth rate | S2 | % | + | |
| Tertiary industries as a percentage of GDP | S3 | % | + | |
| Fixed asset investment | S4 | 10,000 million CNY | + | |
| Population | Number of resident population | S5 | 10,000 person | + |
| Population density | S6 | Person/hectare | + | |
| Living quality | Urban per capita disposable income | S7 | Yuan | + |
| Rural net income per capita | S8 | Yuan | + | |
| Urban per capita housing construction area | S9 | Person/m2 | + | |
| The green coverage rate of the built district | S10 | % | + | |
| Number of Internet users | S11 | 10,000 households | + | |
| Social security and welfare | Expenditure for general public service | S12 | 10,000 yuan | + |
| Number of social insurance participants | S13 | 10,000 Person | + | |
| Registered urban unemployment rate | S14 | % | − | |
| Number of beds in health services | S15 | 10,000 beds | + | |
| Public safety and order | Number of criminal cases filed | S16 | / | − |
| Number of the death in traffic accidents and fire | S17 | Person | − | |
| Education and technology | Number of full-time teachers | S18 | 10,000 Person | + |
| Number of students in colleges and universities | S19 | 10,000 person | + | |
| Patent number | S20 | / | + | |
| Value-added of high-tech industries | S21 | 1000 million CNY | + |
| Decoupling State | ΔRECC | ΔSCDI | T | Code | |
|---|---|---|---|---|---|
| Decoupling | Strong decoupling | >0 | >0 | >0 | A-1 |
| Weak decoupling | <0 | >0 | −0.8 < t < 0 | A-2 | |
| Recessive decoupling | >0 | <0 | <−1.2 | A-3 | |
| Negative decoupling | Strong negative decoupling | <0 | <0 | >0 | B-1 |
| Weak negative decoupling | >0 | <0 | −0.8 < t < 0 | B-2 | |
| Expansive negative decoupling | <0 | >0 | <−1.2 | B-3 | |
| Coupling | Recessive coupling | >0 | <0 | −1.2 < t < −0.8 | C-1 |
| Expansive coupling | <0 | >0 | −1.2 < t < −0.8 | C-2 | |
Publisher’s Note: MDPI stays neutral with regard to jurisdictional claims in published maps and institutional affiliations. |
© 2021 by the authors. Licensee MDPI, Basel, Switzerland. This article is an open access article distributed under the terms and conditions of the Creative Commons Attribution (CC BY) license (https://creativecommons.org/licenses/by/4.0/).
Share and Cite
Ye, S.; Wei, C.; Wang, Z.; Wang, H.; Chai, J. Resources and Environment Carrying Capacity, Social Development and Their Decoupling Relationship: A Case Study of Hubei Province, China. Int. J. Environ. Res. Public Health 2021, 18, 12312. https://0-doi-org.brum.beds.ac.uk/10.3390/ijerph182312312
Ye S, Wei C, Wang Z, Wang H, Chai J. Resources and Environment Carrying Capacity, Social Development and Their Decoupling Relationship: A Case Study of Hubei Province, China. International Journal of Environmental Research and Public Health. 2021; 18(23):12312. https://0-doi-org.brum.beds.ac.uk/10.3390/ijerph182312312
Chicago/Turabian StyleYe, Sheng, Chao Wei, Zhanqi Wang, Han Wang, and Ji Chai. 2021. "Resources and Environment Carrying Capacity, Social Development and Their Decoupling Relationship: A Case Study of Hubei Province, China" International Journal of Environmental Research and Public Health 18, no. 23: 12312. https://0-doi-org.brum.beds.ac.uk/10.3390/ijerph182312312