
Combined Aerobic and Resistance Training Performed under Conditions of Normobaric Hypoxia and Normoxia Has the Same Impact on Metabolic Control in Men with Type 1 Diabetes

 , , ,
, , ,
Abstract
:1. Introduction
2. Material and Methods
2.1. Experimental Approach to the Problem
- Echocardiographic examination;
- ECG (electrocardiogram) exercise test on a treadmill;
- Ophthalmological evaluation (fundus examination was regarded as valid when performed no longer than a year before training started).
- Training in normoxic conditions—eight patients;
- Training in conditions of altitude hypoxia (normobaric)—eight patients.
- Randomization was carried out in blocks of four people.
2.2. Subjects
- Type 1 diabetic patients aged 30–45 years, diabetes duration at least 10 years, BMI (body mass index) 20–30 kg/m2;
- Treated with multiple insulin injections (at least 4/day) or with a personal insulin pump;
- Negative exercise ECG test;
- HbA1c < 8.0%;
- Treatment with intensive functional insulin therapy, counting carbohydrate exchanges (1 carbohydrate exchange = 10 g of carbohydrates), knowledge of how to manage diabetes during physical exercise;
- Advanced operation of the glucose meter and intermittent scanning glucose monitoring system—the FreeStyle Libre system (Abbott Diabetes Care, Alameda, CA, USA).
- Advanced microvascular complications of diabetes: (pre-proliferative and proliferative retinopathy, state after laser therapy; GFR (glomerular filtration rate) less than 60 mL/min/1.73 m2, microalbuminuria);
- Macrovascular complications: cardiovascular disease;
- Overt autonomic neuropathy (including no increase in heart rate with exercise).

| Variable | Training in Hypoxia at Baseline | Training in Hypoxia in 6th Week | Training in Normoxia at Baseline | Training in Normoxia in 6th Week | p |
|---|---|---|---|---|---|
| Age (years) | 38.8 ± 4.32 | 37.5 ± 5.32 | ns | ||
| Diabetes duration (years) | 21 ± 9 | 16 ± 5 | ns | ||
| Height (cm) | 181 ± 9.0 | 182.5 ± 4.6 | ns | ||
| Weight (kg) | 89.7 ± 16.5 | 89.6 ± 16.7 | 94.1 ± 6.4 | 93.6 ± 6.3 | ns |
| BFM (kg) | 22 ± 4.6 | 21.8 ± 5.12 | 22.8 ± 6.6 | 22.6 ± 7.6 | ns |
| SMM (kg) | 38 ± 7.5 | 38 + 7.6 | 40.4 ± 2.4 | 40.3 ± 2.6 | ns |
| BMI (kg/m2) | 27.1 ± 2.7 | 27.0 ± 2.8 | 28.2 ± 1.5 | 28.1 ± 1.5 | ns |
| PBF (%) | 24.5 ± 2.7 | 24.4 ± 3.3 | 24.05 ± 5.5 | 23.8 ± 6.5 | ns |
| WHR | 0.964 ± 0.06 | 0.962 ± 0.06 | 0.985 ± 0.07 | 0.98 ± 0.08 | ns |
| Circumference of abdomen (cm) | 100 ± 11 | 99 ± 11 | 103 ± 9 | 103 ± 10 | ns |
| Circumference of hip (cm) | 103 ± 6 | 103 ± 6 | 105 ± 2 | 105 ±2 | ns |
| HbA1c (%) | 6.93 ± 0.7 | 6.87 ± 0.7 | 7.0 ± 0.6 | 6.96 ± 0.7 | ns |
| HbA1c (mmol/mol) | 52 ± 8 | 51.6 ± 8 | 53 ± 7 | 52.6 ± 7 | ns |
| Creatinine (μmol/L) | 76 ± 14 | 73 ± 11 | 72 ± 6 | 69 ± 6 | ns |
| ALT (U/L) | 21 ± 6 | 24 ± 7 | 23 ± 11 | 24 ± 12 | ns |
| AST (U/L) | 26 ± 10 | 26 ± 12 | 23 ± 9 | 23 ± 7 | ns |
| EQ-5D VAS (points) | 82 ± 17 | 86 ± 9 | 78 ± 13 | 82 ± 13 | ns |
| Short-acting insulin (U/24 h) | 36 ± 13 | 36 ± 11 | 41 ± 16 | 30 ± 11 * | ns |
| Long-acting insulin (U/24 h) | 24 ± 8 | 23 ± 9 | 29 ± 10 | 28 ± 11 | ns |
| Threshold for hypo signs (mg/dl) | 58 ± 9 | 64 ± 8 | 58 ± 11 | 60 ± 10 | ns |
| Self-reported hypoglycemia (episodes/week) | 2.5 ± 1.8 | 3.2 ± 2.4 | 3.6 ± 3.2 | 4.5 ± 2.8 | ns |
2.3. Instruments and Procedures
2.3.1. Incremental Exercise Test
2.3.2. Muscle Strength Test
2.3.3. Training Sessions
2.3.4. Baseline Assessment
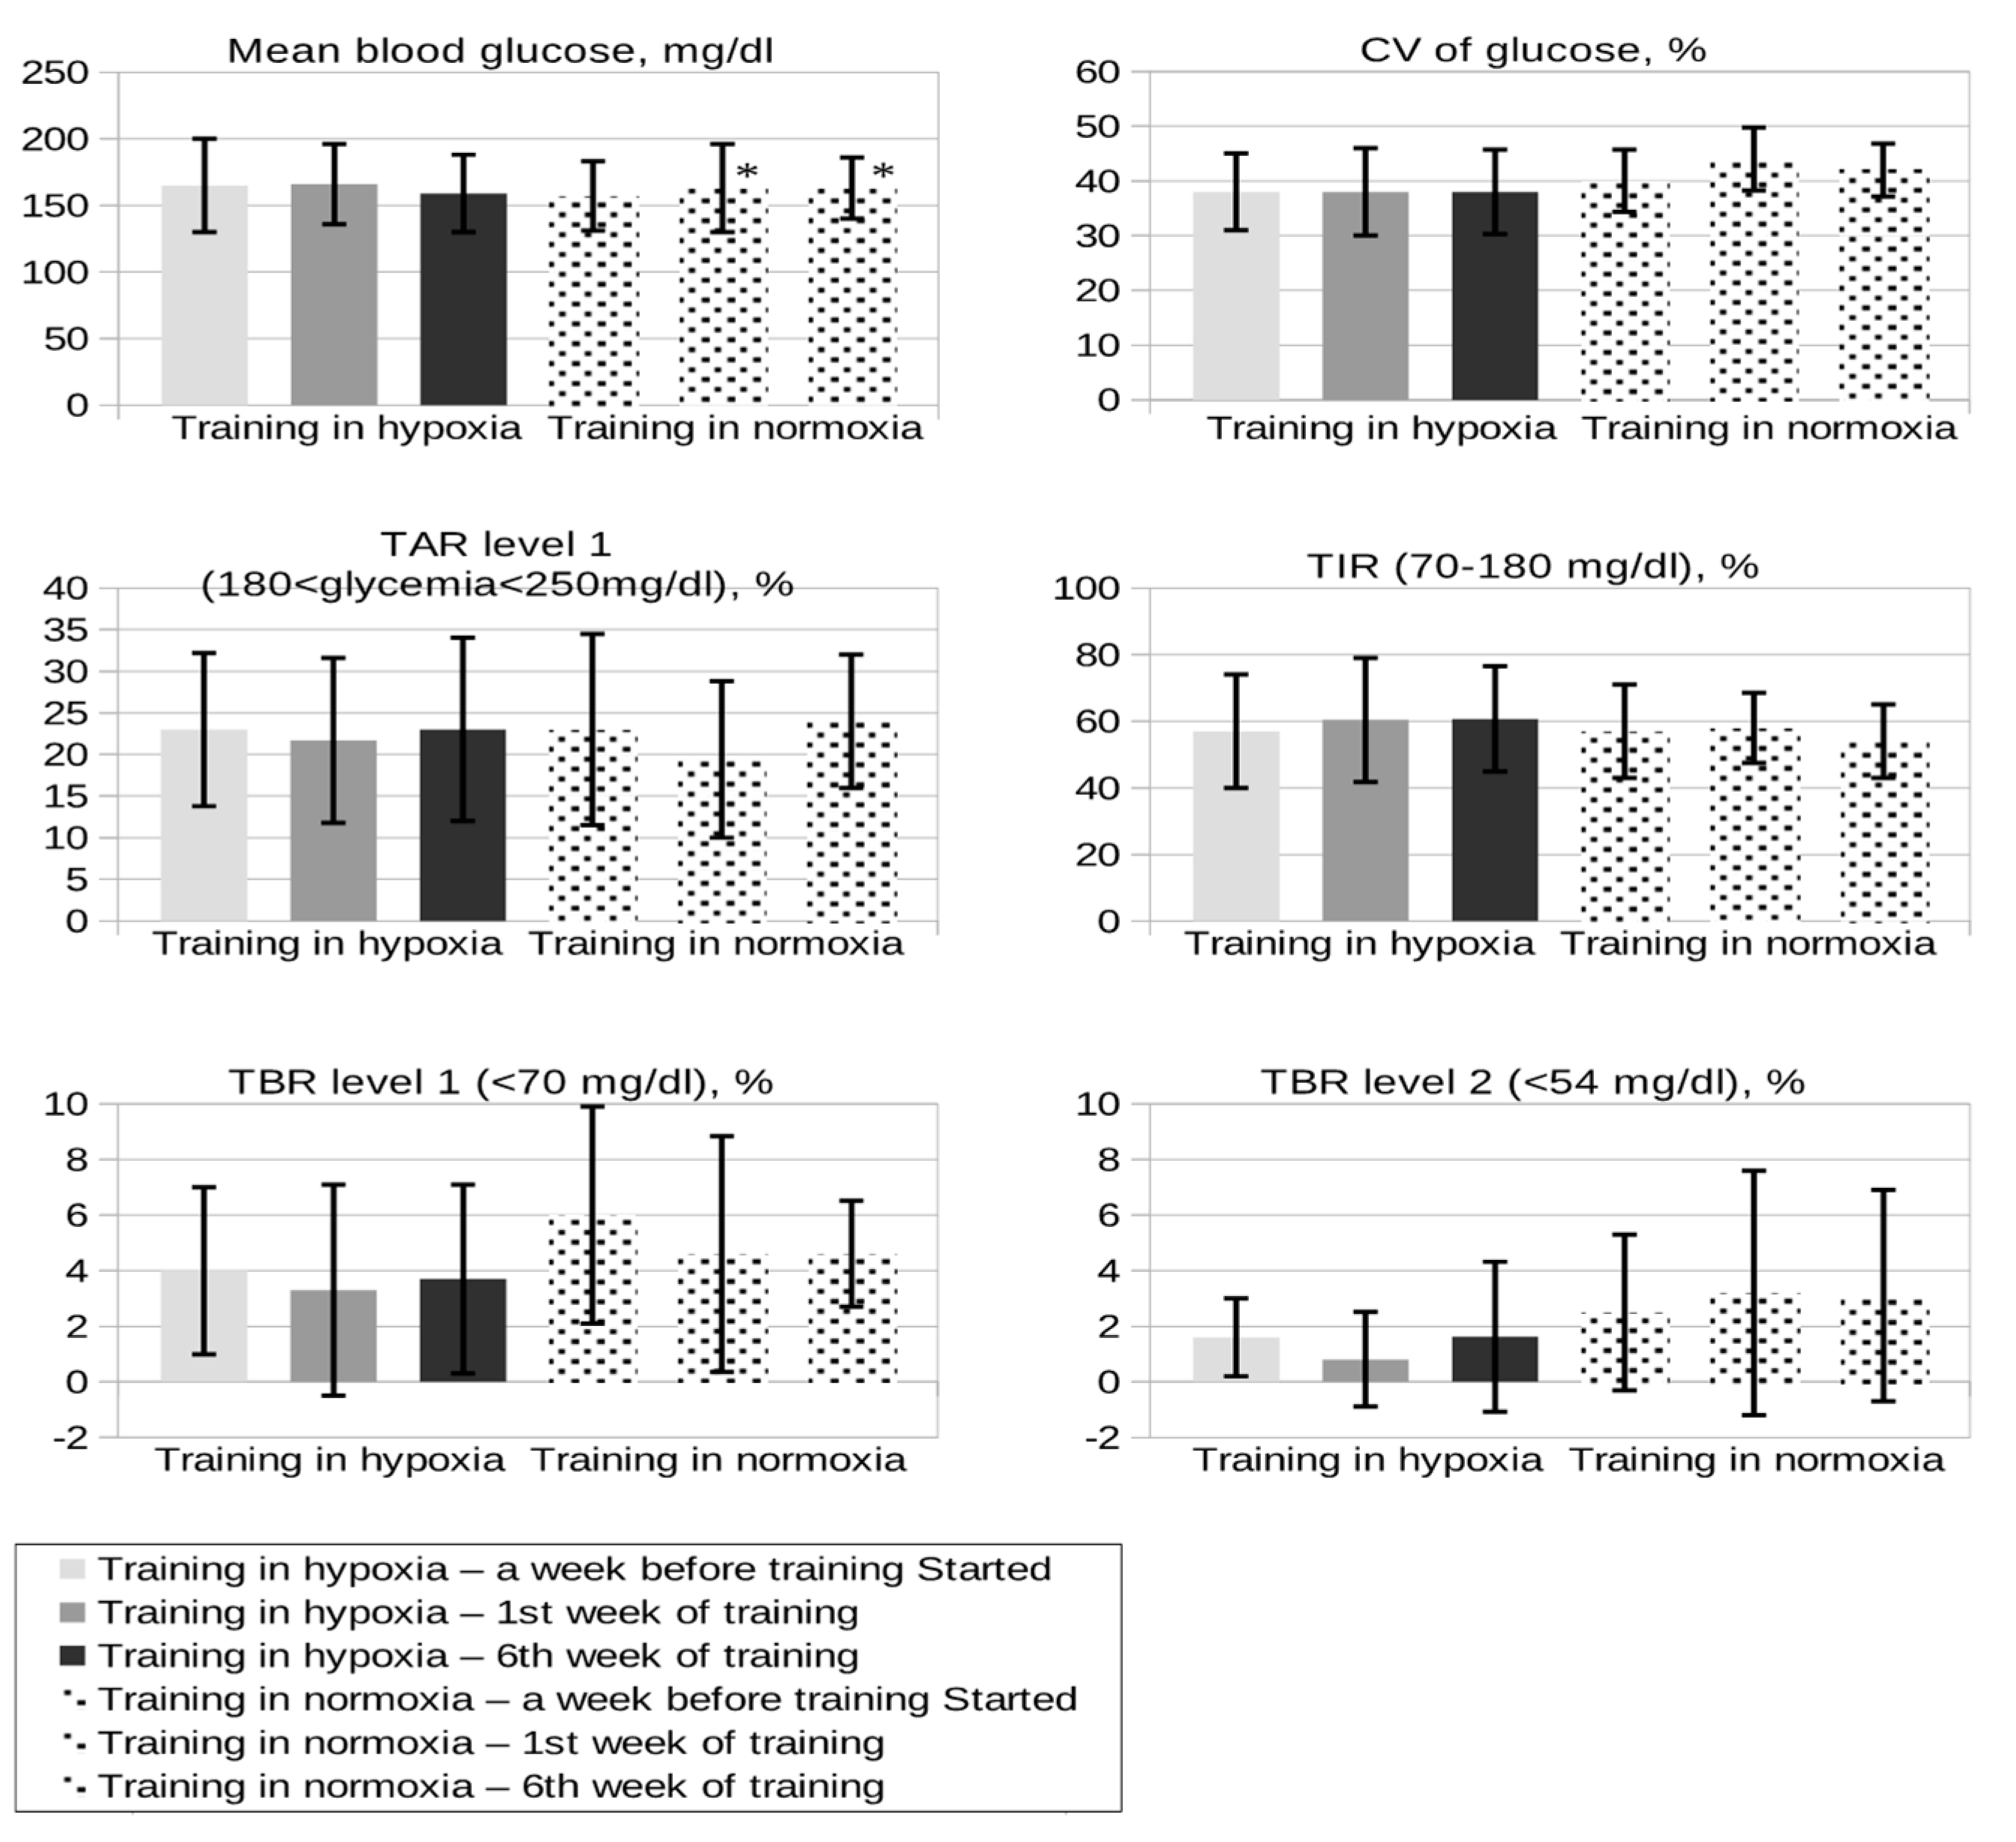
- TIR (time in range; %): the percentage of time that a person spends with their blood glucose levels in the target range: 70–180 mg/dl;
- TBR (time below range): the percentage of readings and time per day below the target glucose range: level 1: (glycemia < 70 mg/dl (range: 54–69 mg/dl)), level 2: (glycemia < 54 mg/dl);
- TAR (time above range): the percentage of readings and time per day above the target glucose range (glycemia > 180 and <250 mg/dl);
- CV (coefficient of variation): [(SD of glucose)/(mean glucose)], value below 36% appears to be a suitable threshold to distinguish between stable and unstable glycemia.
2.3.5. Assessment during the Study Period
- Any type of nutrition on days without training;
- On the day of training, the fixed composition of the meal before exercise (each participant was obliged to eat a carbohydrate–protein meal with a fixed carbohydrate content. This meal had to contain a minimum of 4–5 complex carbohydrate exchanges (40–50 grams of carbohydrates) plus a protein content equivalent to 100 g of poultry meat), a meal eaten no later than 2 h before the exercise;
- Target blood glucose concentration before exercise 140–180 mg/dl;
- Completion of diaries by patients, in which they wrote down the consumed amount of carbohydrate exchanges immediately before, during, and immediately after exercise to keep glycemia at a safe level, and their doses of insulin;
- Reading data from FreeStyle Libre system.
2.3.6. Assessment in 6th Week of the Study
- Incremental exercise test in both groups at Academy of Physical Education in Katowice;
- HbA1c, morphology, AST, ALT, creatinine, body weight, BMI, waist and hip circumference, body composition, quality of life according to the EQ-Worksheet questionnaire, insulin requirement (average dose from 7 days before the end of the study), analysis of hypoglycemia, and the amount of carbohydrates consumed per training session (based on data from the diary);
- Reading data from FreeStyle Libre system.
2.4. Statistical Analysis
3. Results
3.1. Diabetes Control, Hypoglycemia, and Insulin Requirements
3.2. Anthropometric, Biochemical, and Cardiac Parameters
3.3. Incremental Exercise Test
| Variable | Training in Hypoxia | Training in Normoxia | p-Value |
|---|---|---|---|
| Dose reduction of short-acting insulin premeal before training (%) | 10 ± 2.8 * | 25 ± 14 | 0.004 |
| Mean glucose 15 min before training (mg/dl) | 169 ± 36 | 141 ± 40 | 0.2 |
| Mean glucose in 30 min of training (mg/dl) | 157 ± 38 | 115 ± 40 | 0.06 |
| Mean glucose at the end of training (mg/dl) | 132 ± 36 | 114 ± 33 | 0.4 |
| Extra carbs during training (grams) | 10 ± 6 | 18 ± 30 | 0.7 |
| Mean fasting glycemia in the next morning (mg/dl) | 128 ± 62 | 102 ± 36 | 0.8 |
| Variable | Training in Hypoxia at Baseline | Training in Hypoxia in 6th Week | Training in Normoxia at Baseline | Training in Normoxia in 6th Week |
|---|---|---|---|---|
| Ejection fraction (%) biplane | 59.5 ± 3 | 59.7 ± 4 | 63.6 ± 4 | 62 ± 6 |
| RVMODE (mm) | 28.75 ± 2.12 | 29.2 ± 2.6 | 28.8 ± 2 | 28.8 ± 2.5 |
| RVLV4CH (mm) | 34.3 ± 2.7 | 34.3 ± 2.7 | 34 ± 2.5 | 34.6 ± 2.2 |
| RVSP (mmHg) | 15.4 ± 5 | 17.3 ± 2 | 17.8 ± 10 | 19.4 ± 8.5 |
| Variable | Training in Hypoxia at Baseline | Training in Hypoxia in 6th Week | Training in Normoxia at Baseline | Training in Normoxia in 6th Week |
|---|---|---|---|---|
| HR max (bpm) | 172 ± 14 | 168 ± 12 | 178 ± 15 | 171 ± 15 |
| RER | 1.3 ± 0.07 | 1.2 ± 0.07 | 1.2 ± 0.11 | 1.18 ± 0.13 |
| V′O2/kg (mL/min/kg) | 36.6 ± 4.7 | 42.0 ± 6.0 | 38.5 ± 4.5 | 42.4 ± 4.5 |
| V′O2/HR (mL) | 19.5 ± 3.8 | 21.05 ± 4.5 | 22 ± 3.1 | 22.7 ± 3.9 |
| VT | 3.3 ± 0.88 | 3.2 ± 0.6 | 3.1 ± 0.35 | 3.1 ± 0.4 |
3.4. Quality of Life

3.5. Safety
4. Discussion
5. Conclusions
Limitations
Author Contributions
Funding
Institutional Review Board Statement
Informed Consent Statement
Data Availability Statement
Conflicts of Interest
References
- Sluik, D.; Buijsse, B.; Muckelbauer, R.; Kaaks, R.; Teucher, B.; Johnsen, N.F.; Tjønneland, A.; Overvad, K.; Ostergaard, J.N.; Amiano, P.; et al. Physical Activity and Mortality in Individuals With Diabetes Mellitus: A Prospective Study and Meta-analysis. Arch. Intern. Med. 2012, 172, 1285–1295. [Google Scholar] [CrossRef] [PubMed]
- Chimen, M.; Kennedy, A.; Nirantharakumar, K.; Pang, T.; Andrews, R.; Narendran, P. What are the health benefits of physical activity in type 1 diabetes mellitus? A literature review. Diabetologia 2012, 55, 542–551. [Google Scholar] [CrossRef] [Green Version]
- American Diabetes Association Standards of Medical Care in Diabetes—2020. Diabetes Care 2020, 43, 1–212. [CrossRef] [PubMed] [Green Version]
- Garber, C.E.; Blissmer, B.; Deschenes, M.R.; Franklin, B.A.; Lamonte, M.J.; Lee, I.M.; Nieman, D.C.; Swain, D.P. American College of Sports Medicine position stand. Quantity and quality of exercise for developing and maintaining cardiorespiratory, musculoskeletal, and neuromotor fitness in apparently healthy adults: Guidance for prescribing exercise. Med. Sci. Sports Exerc. 2011, 43, 1334–1359. [Google Scholar] [CrossRef]
- Quirk, H.; Blake, H.; Tennyson, R.; Randell, T.L.; Glazebrook, C. Physical activity interventions in children and young people with Type 1 diabetes mellitus: A systematic review with meta-analysis. Diabet. Med. 2014, 31, 1163–1173. [Google Scholar] [CrossRef] [Green Version]
- Dickhuth, H.H.; Scharhag, J.; Rocker, K.; Konig, D. Cardiovascular adaptation and exercise. Int. Sport Med. J. 2012, 12, 1–7. [Google Scholar]
- Millet, G.P.; Roels, B.; Schmitt, L.; Woorons, X.; Richalet, J.P. Combining hypoxic methods for peak performance. Sports Med. 2010, 40, 1–25. [Google Scholar] [CrossRef]
- Weidemann, A.; Johnson, R.S. Biology of HIF-1alpha. Cell Death Differ. 2008, 15, 621–627. [Google Scholar] [CrossRef] [Green Version]
- Tonoli, C.; Heyman, E.; Roelands, B.; Buyse, L.; Piacentini, F.; Berthoin, S.; Bailey, S.; Pattyn, N.; Meeusen, R. BDNF, IGF-I, Glucose and Insulin during Continuous and Interval Exercise in Type 1 Diabetes. Int. J. Sports Med. 2015, 36, 955–959. [Google Scholar] [CrossRef]
- Krause, M.P.; Riddell, M.C.; Hawke, T.J. Effects of type 1 diabetes mellitus on skeletal muscle: Clinical observations and physiological mechanisms. Pediatr. Diabetes 2011, 12, 345–364. [Google Scholar] [CrossRef] [PubMed]
- Żebrowska, A.; Sikora, M.; Konarska, A.; Zwierzchowska, A.; Kamiński, T.; Robins, A.; Hall, B. Moderate intensity exercise in hypoxia increases IGF-1 bioavailability and serum irisin in individuals with type 1 diabetes. Ther. Adv. Endocrinol. Metab. 2020, 27, 11. [Google Scholar] [CrossRef]
- Ladage, D.; Braunroth, C.; Lenzen, E.; Berghöfer, S.; Graf, C.; Bloch, W.; Brixius, K. Influence of intermittent hypoxia interval training on exercise-dependent erythrocyte NOS activation and blood pressure in diabetic patients. Can. J. Physiol. Pharmacol. 2012, 90, 1591–1598. [Google Scholar] [CrossRef] [PubMed]
- Sakagami, H.; Makino, Y.; Mizumoto, K.; Isoe, T.; Takeda, Y.; Watanabe, J.; Fujita, Y.; Takiyama, Y.; Abiko, A.; Haneda, M. Loss of HIF-1α impairs GLUT4 translocation and glucose uptake by the skeletal muscle cells. Am. J. Physiol. Endocrinol. Metab. 2014, 306, 1065–1076. [Google Scholar] [CrossRef]
- Mackenzie, R.; Maxwell, N.; Castle, P.; Elliott, B.; Brickley, G.; Watt, P. Intermittent exercise with and without hypoxia improves insulin sensitivity in individuals with type 2 diabetes. J. Clin. Endocrinol. Metab. 2012, 97, 546–555. [Google Scholar] [CrossRef] [Green Version]
- Mai, K.; Klug, L.; Rakova, N.; Piper, S.K.; Mähler, A.; Bobbert, T.; Schulz-Menger, J.; Spranger, J.; Boschmann, M.; Luft, F.C. Hypoxia and exercise interactions on skeletal muscle insulin sensitivity in obese subjects with metabolic syndrome: Results of a randomized controlled trial. Int. J. Obes. 2020, 44, 1119–1128. [Google Scholar] [CrossRef] [PubMed]
- Santos, J.L.; Pérez-Bravo, F.; Carrasco, E.; Calvillán, M.; Albala, C. Low prevalence of type 2 diabetes despite a high average body mass index in the Aymara natives from Chile. Nutrition 2001, 17, 305–309. [Google Scholar] [CrossRef]
- Woolcott, O.O.; Ader, M.; Bergman, R.N. Glucose homeostasis during short-term and prolonged exposure to high altitudes. Endocr. Rev. 2015, 36, 149–173. [Google Scholar] [CrossRef] [PubMed] [Green Version]
- Baechle, T.R.; Earle, R.W. Essential of Strength Training and Conditioning; Human Kinetics: Champaign, IL, USA, 2008. [Google Scholar]
- EuroQol-5D. Available online: https://euroqol.org (accessed on 1 October 2019).
- Hall, B.; Zebrowska, A.; Kaminski, T.; Stanula, A.; Robins, A. Effects of Hypoxia during Continuous and Intermittent Exercise on Glycaemic Control and Selected Markers of Vascular Function in Type 1 Diabetes. Exp. Clin. Endocrinol. Diabetes 2018, 126, 229–241. [Google Scholar] [CrossRef]
- Frayn, K.N.; Karpe, F. Regulation of human subcutaneous adipose tissue blood flow. Int. J. Obes. 2014, 38, 1019–1026. [Google Scholar] [CrossRef]
- Stanford, K.I.; Goodyear, L.J. Exercise and type 2 diabetes: Molecular mechanisms regulating glucose uptake in skeletal muscle. Adv. Physiol. Educ. 2014, 38, 308–314. [Google Scholar] [CrossRef] [PubMed] [Green Version]
- Riddell, M.C.; Gallen, I.W.; Smart, C.E.; Taplin, C.E.; Adolfsson, P.; Lumb, A.N.; Kowalski, A.; Rabasa-Lhoret, R.; McCrimmon, R.J.; Hume, C.; et al. Exercise management in type 1 diabetes: A consensus statement. Lancet Diabetes Endocrinol. 2017, 5, 377–390. [Google Scholar] [CrossRef] [Green Version]
- Yardley, J.E.; Kenny, G.P.; Perkins, B.A.; Riddell, M.C.; Balaa, N.; Malcolm, J.; Khandwala, F.; Sigal, R.J. Effects of performing resistance exercise before versus after aerobic exercise on glycemia in type 1 diabetes. Diabetes Care 2012, 35, 669–675. [Google Scholar] [CrossRef] [PubMed] [Green Version]
- Yardley, J.E.; Kenny, G.P.; Perkins, B.A.; Riddell, M.C.; Balaa, N.; Malcolm, J.; Boulay, P.; Khandwala, F.; Sigal, R.J. Resistance versus aerobic exercise: Acute effects on glycemia in type 1 diabetes. Diabetes Care 2013, 36, 537–542. [Google Scholar] [CrossRef] [PubMed] [Green Version]
- Bourdon, P.C.; Cardinale, M.; Murray, A.; Gastin, P.; Kellmann, M.; Varley, M.C.; Gabbett, T.J.; Coutts, A.J.; Burgess, D.J.; Gregson, W. Monitoring Athlete Training Loads: Consensus Statement. Int. J. Sports Physiol. Perform. 2017, 12, 2161–2170. [Google Scholar] [CrossRef]
- Nishimura, A.; Sugita, M.; Kato, K.; Fukuda, A.; Sudo, A.; Uchida, A. Hypoxia increases muscle hypertrophy induced by resistance training. Int. J. Sports Physiol. Perform. 2010, 5, 497–508. [Google Scholar] [CrossRef] [Green Version]
Publisher’s Note: MDPI stays neutral with regard to jurisdictional claims in published maps and institutional affiliations. |
© 2021 by the authors. Licensee MDPI, Basel, Switzerland. This article is an open access article distributed under the terms and conditions of the Creative Commons Attribution (CC BY) license (https://creativecommons.org/licenses/by/4.0/).
Share and Cite
Wróbel, M.; Rokicka, D.; Gołaś, A.; Drozd, M.; Nowowiejska-Wiewióra, A.; Pyka, Ł.; Stołtny, T.; Gąsior, M.; Strojek, K. Combined Aerobic and Resistance Training Performed under Conditions of Normobaric Hypoxia and Normoxia Has the Same Impact on Metabolic Control in Men with Type 1 Diabetes. Int. J. Environ. Res. Public Health 2021, 18, 13058. https://0-doi-org.brum.beds.ac.uk/10.3390/ijerph182413058
Wróbel M, Rokicka D, Gołaś A, Drozd M, Nowowiejska-Wiewióra A, Pyka Ł, Stołtny T, Gąsior M, Strojek K. Combined Aerobic and Resistance Training Performed under Conditions of Normobaric Hypoxia and Normoxia Has the Same Impact on Metabolic Control in Men with Type 1 Diabetes. International Journal of Environmental Research and Public Health. 2021; 18(24):13058. https://0-doi-org.brum.beds.ac.uk/10.3390/ijerph182413058
Chicago/Turabian StyleWróbel, Marta, Dominika Rokicka, Artur Gołaś, Miłosz Drozd, Alicja Nowowiejska-Wiewióra, Łukasz Pyka, Tomasz Stołtny, Mariusz Gąsior, and Krzysztof Strojek. 2021. "Combined Aerobic and Resistance Training Performed under Conditions of Normobaric Hypoxia and Normoxia Has the Same Impact on Metabolic Control in Men with Type 1 Diabetes" International Journal of Environmental Research and Public Health 18, no. 24: 13058. https://0-doi-org.brum.beds.ac.uk/10.3390/ijerph182413058