Article

Measurement of Indoor Thoron Gas Concentrations Using a Radon-Thoron Discriminative Passive Type Monitor: Nationwide Survey in Japan

Department of Radiological Technology, Faculty of Health Sciences, Hokkaido University of Science, Sapporo, Hokkaido 006-8585, Japan
Int. J. Environ. Res. Public Health 2021, 18(3), 1299; https://0-doi-org.brum.beds.ac.uk/10.3390/ijerph18031299
Submission received: 31 December 2020 / Revised: 25 January 2021 / Accepted: 29 January 2021 / Published: 1 February 2021

Abstract

:
As part of a nationwide survey of thoron (220Rn) in Japan, the indoor 220Rn gas concentrations in 940 dwellings were measured throughout one year, from 1993 to 1996, using a passive type 222Rn-220Rn discriminative monitor. The monitor was placed in a bedroom or a living room in each house for four successive three-month periods. The mean annual indoor 220Rn concentration was estimated from the four measurements in each house. The arithmetic mean, the median and the geometric mean for indoor 220Rn concentrations in 899 dwellings were 20.1, 9.6 and 10.0 Bq m−3, respectively. The 220Rn concentrations exhibited a log-normal distribution. It was found that the 220Rn concentrations were dependent on the nature of the materials used for wall construction and also on the distance of measurement from the wall. Significant seasonal variations in the 220Rn concentration were not observed. It would seem that the nature of the wall material contributed to the increased indoor 220Rn concentrations.

1. Introduction

Radon (222Rn), thoron (220Rn) and their progeny species are large contributors to the annual exposure of an effective dose to the general population. 222Rn and its progeny species contribute about half of the annual effective dose due to natural radiation based on the world mean dose. According to the United Nations Scientific Committee on the Effects of Atomic Radiation [1], the annual effective dose from natural radiation sources has been calculated to be 2.4 mSv as the worldwide average, whereas 222Rn and 220Rn contribute 1.2 and 0.1 mSv, respectively. 222Rn and 220Rn are products of the decay chains of natural radionuclides, such as the 238U and 232Th series, and have half-lives of 3.825 days and 55 s, respectively. The 220Rn half-life is very short compared with 222Rn. Thus, only a very small amount of 220Rn can enter a room from the outside. It is considered that a 220Rn concentration gradient exists near the mud-based walls and floors in low ventilated houses [2]. Therefore, if a mud mortar wall is present in housing materials which have high concentrations of thorium, 220Rn and its decay products may enter houses and cause potential health problems. In particular, traditional wooden houses with mud mortar walls are a common house type in Japan.
The International Commission on Radiological Protection (ICRP) [3] have issued new dose conversion factors for 222Rn and 220Rn progeny species based on a dosimetric approach in Publication 137. The values specified are 16.8 and 107 nSv (Bq m−3 h)−1, respectively. This means that even small amounts of 220Rn progeny species will cause higher radiation exposure compared to 222Rn [4]. Therefore, interest in 220Rn exposure is growing among the health sciences communities. Recently, a number of 220Rn surveys have been carried out in local regions and nationwide, and the results have been published enabling an evaluation of exposures from 220Rn [5,6,7,8,9,10,11,12,13,14,15,16,17,18,19,20,21]. Also, the need to adopt reliable 220Rn measurement techniques has been argued in several papers [22].
An indoor 222Rn survey was conducted on 940 houses nationwide in Japan from 1993 to 1996 using 222Rn–220Rn discriminative passive type monitors [23]. The passive monitor, developed by Doi and Kobayashi [2], was placed in either a bedroom or a living room where residents spent most of their time. Indoor 222Rn concentrations were determined at 20 dwellings in each prefecture for four successive three-month periods to cover an entire year. In the survey, to eliminate the influence of 220Rn on 222Rn measurement, the 220Rn concentration was performed at the same time for referencing purposes. The 222Rn and 220Rn calibration experiments were performed in a standard radon chamber at the National Radiological Protection Board (Didcot, UK) and using the 222Rn–220Rn mixed chamber of Waseda University (Tokyo, Japan), respectively. This study is concerned with the results for the indoor 220Rn concentrations using the reference data from the nationwide survey which was conducted to determine the 222Rn concentrations in Japan [23]. Furthermore, the seasonal and regional variations were investigated, and the influence of the type of house structure was examined as mentioned previously. However, this study does not include a dose assessment of 220Rn because the 220Rn concentration varies widely in rooms and it is not easy to measure the activity concentration given the short half-life of the radioisotope [22].

2. Materials and Methods

2.1. 220Rn Monitor and Measurement Periods

The solid-state nuclear track detector (SSNTD) was developed at the National Institute of Radiological Sciences (Chiba, Japan) as a 222Rn and 220Rn discriminative monitor [2]. The monitor consists of two electroconductive hemispheres and there are two polycarbonate films installed in the center of the two hemispheres. To isolate and separate the progeny species of 222Rn and 220Rn, a glass fiber filter is located in the first hemisphere. Therefore, only gaseous 222Rn and 220Rn can pass through the filter and enter the first hemisphere. This monitor has two different diffusion chambers which have relatively large and small ventilation rates. This system has been developed based on the large difference in half-lives of 222Rn and 220Rn. After being exposed, the film was first subjected to chemical etching with a mixed solution of 8 mol L−1 KOH and 20% C2H5OH at 30 °C for 30 min [23]. Then the films were electrochemically etched at 800 V and 2000 Hz for 2 h. A control film, which was exposed to particles from an 241Am source and which had been etched simultaneously with the sample films, was also prepared to assure the stability of the etching condition. The track density was converted to the average 220Rn concentration by the calibration factor after subtraction of the background track density, i.e., 3.5 ± 1.8 tracks cm−2. In the case of the three month long exposure period, the detection limit (DL) for the concentration of 220Rn was estimated to be 7.4 Bq m−3 (k = 1.65), the definition of DL being based on the definition of Currie [24]. Four monitors were used in the survey to determine the mean annual 220Rn concentration. Consequently, the DL for the mean annual 220Rn concentration was estimated to be about 1/2 of DL value specified above. The measurements were carried out for four successive three-month periods to cover a whole year (i.e., January–March, April–June, July–September and October–December) for estimation of the mean annual indoor 220Rn concentration. The survey was carried out for four years (January 1993–June 1996) and conducted in the same manner as reported previously [23].

2.2. 220Rn Calibration Experiments

The 222Rn and 220Rn calibration experiments were performed in a standard radon chamber at the National Radiological Protection Board in the UK and at the 222Rn–220Rn mixed chamber of Waseda University, Tokyo, respectively [25]. 220Rn conversion factor was evaluated to be 0.0098 ± 0.0016 (tracks cm−2 per Bq m−3 d).

3. Results and Discussion

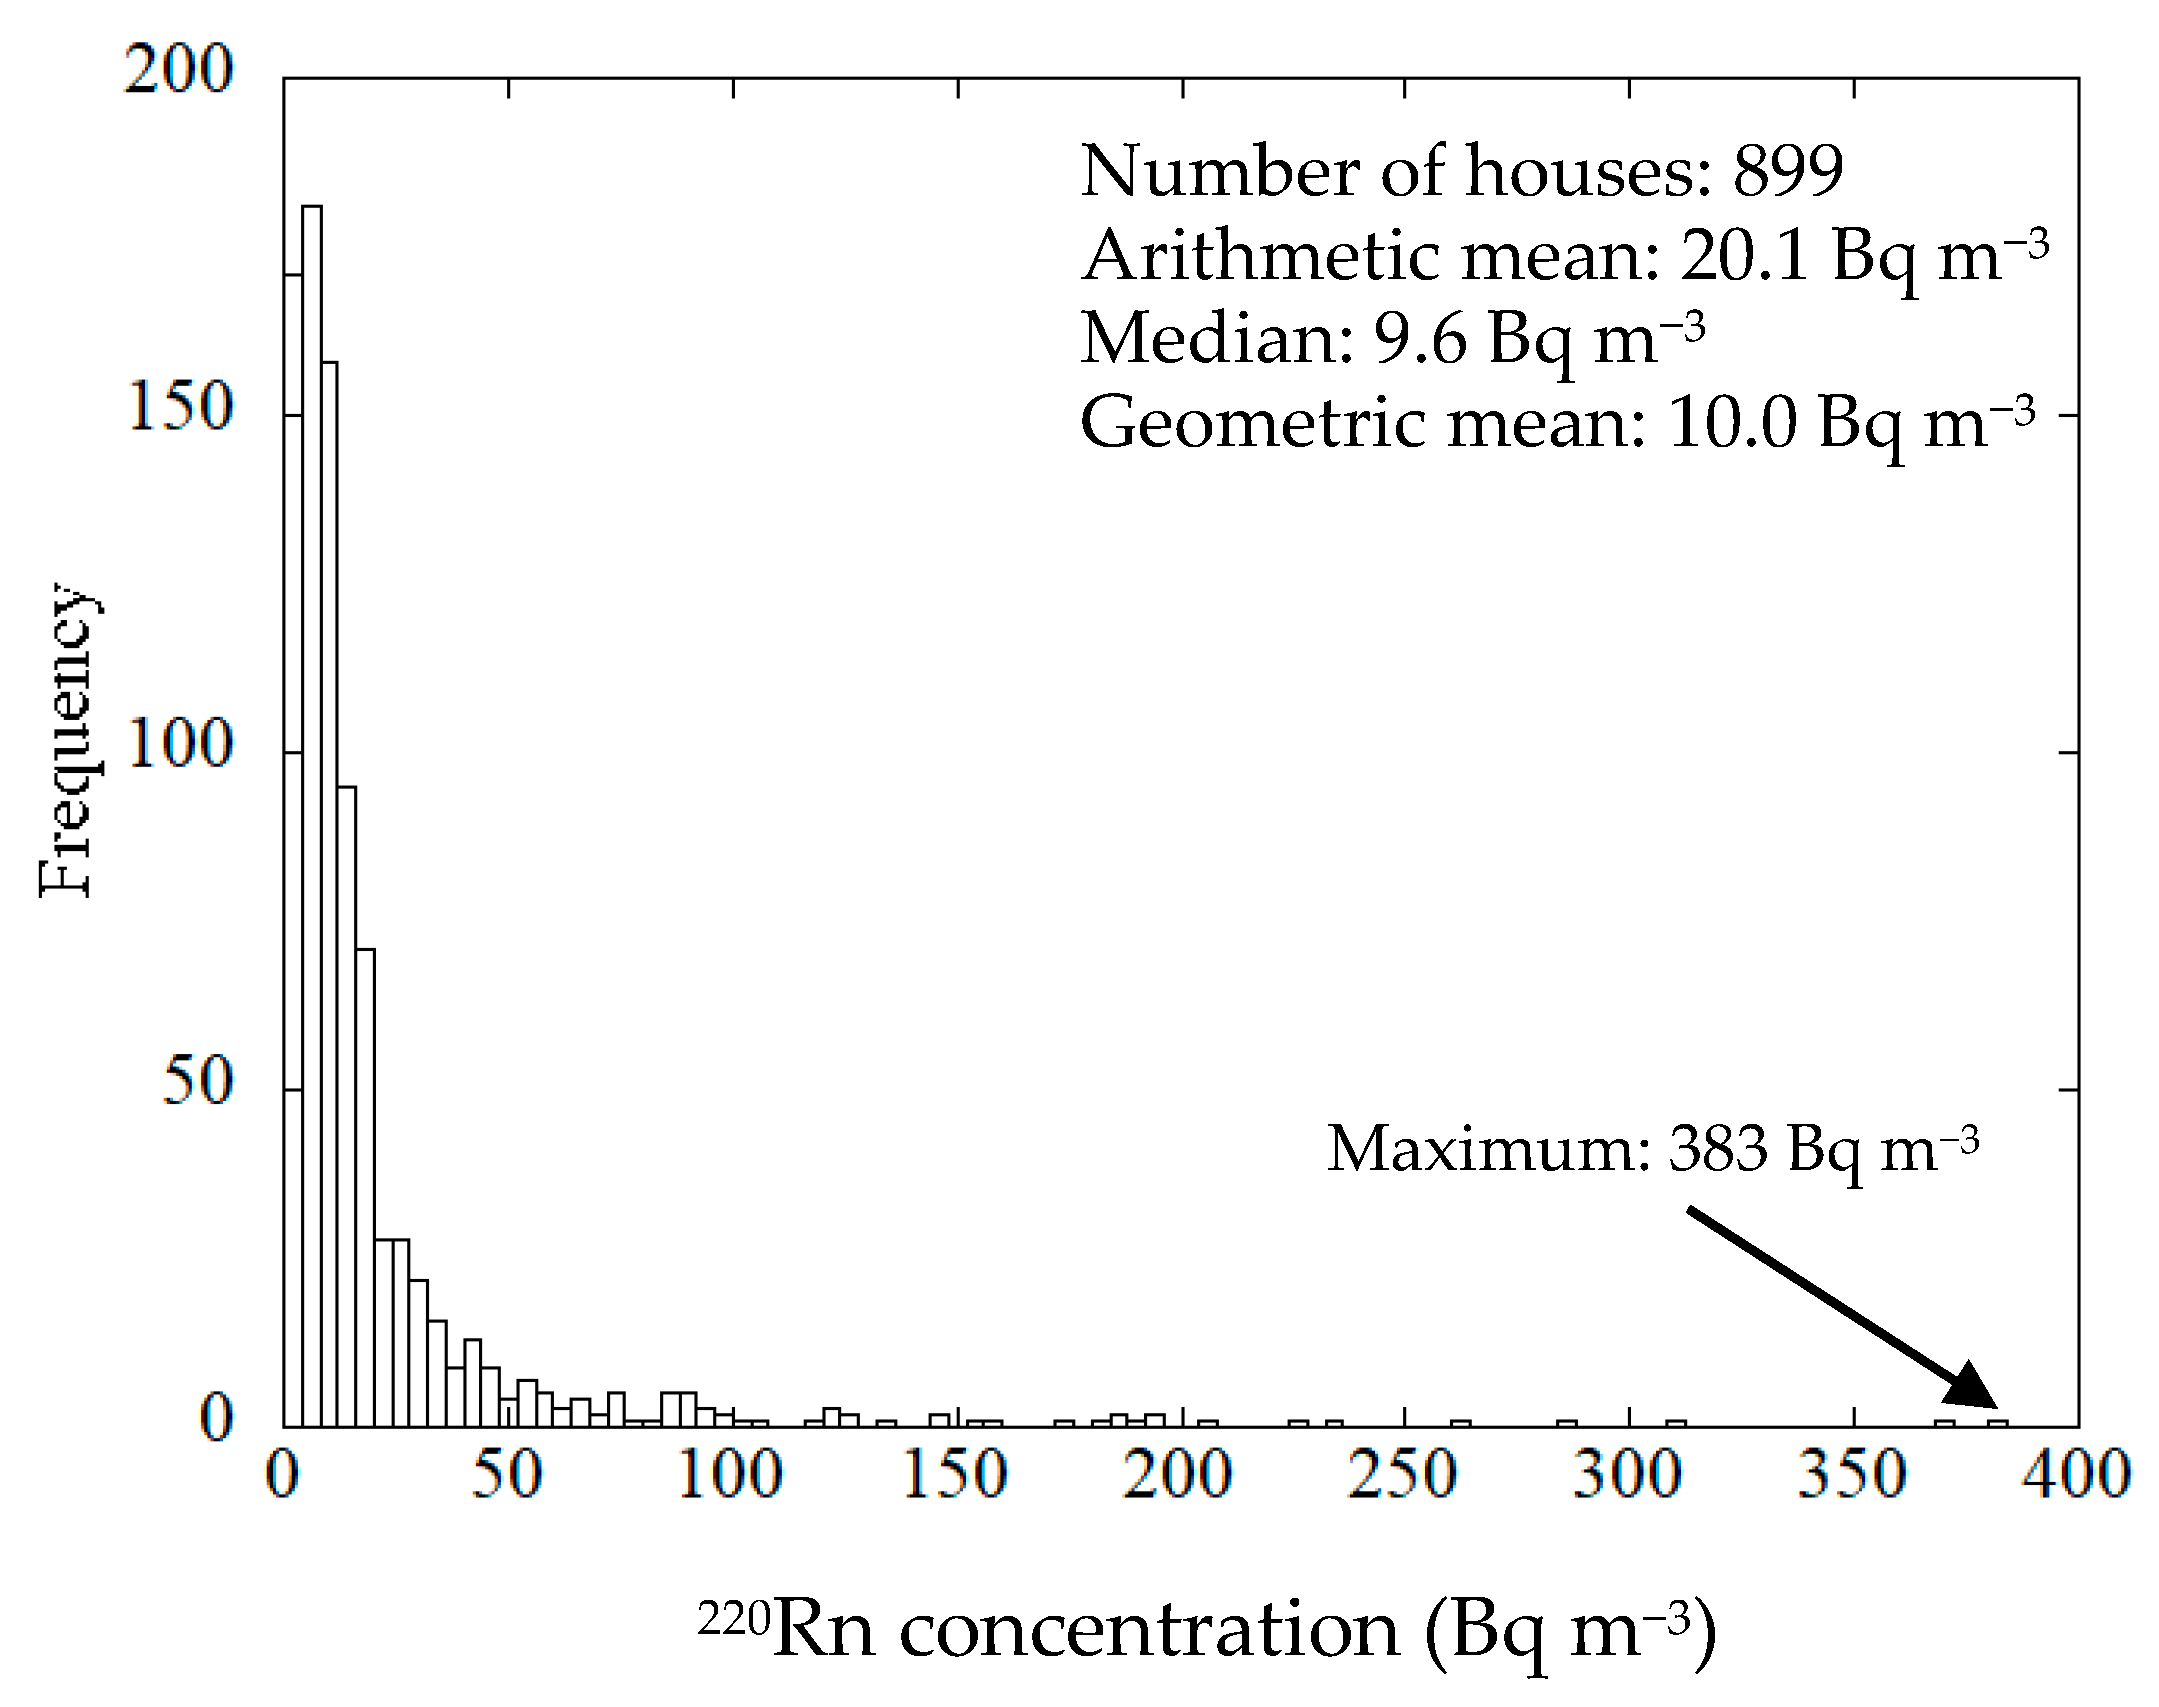
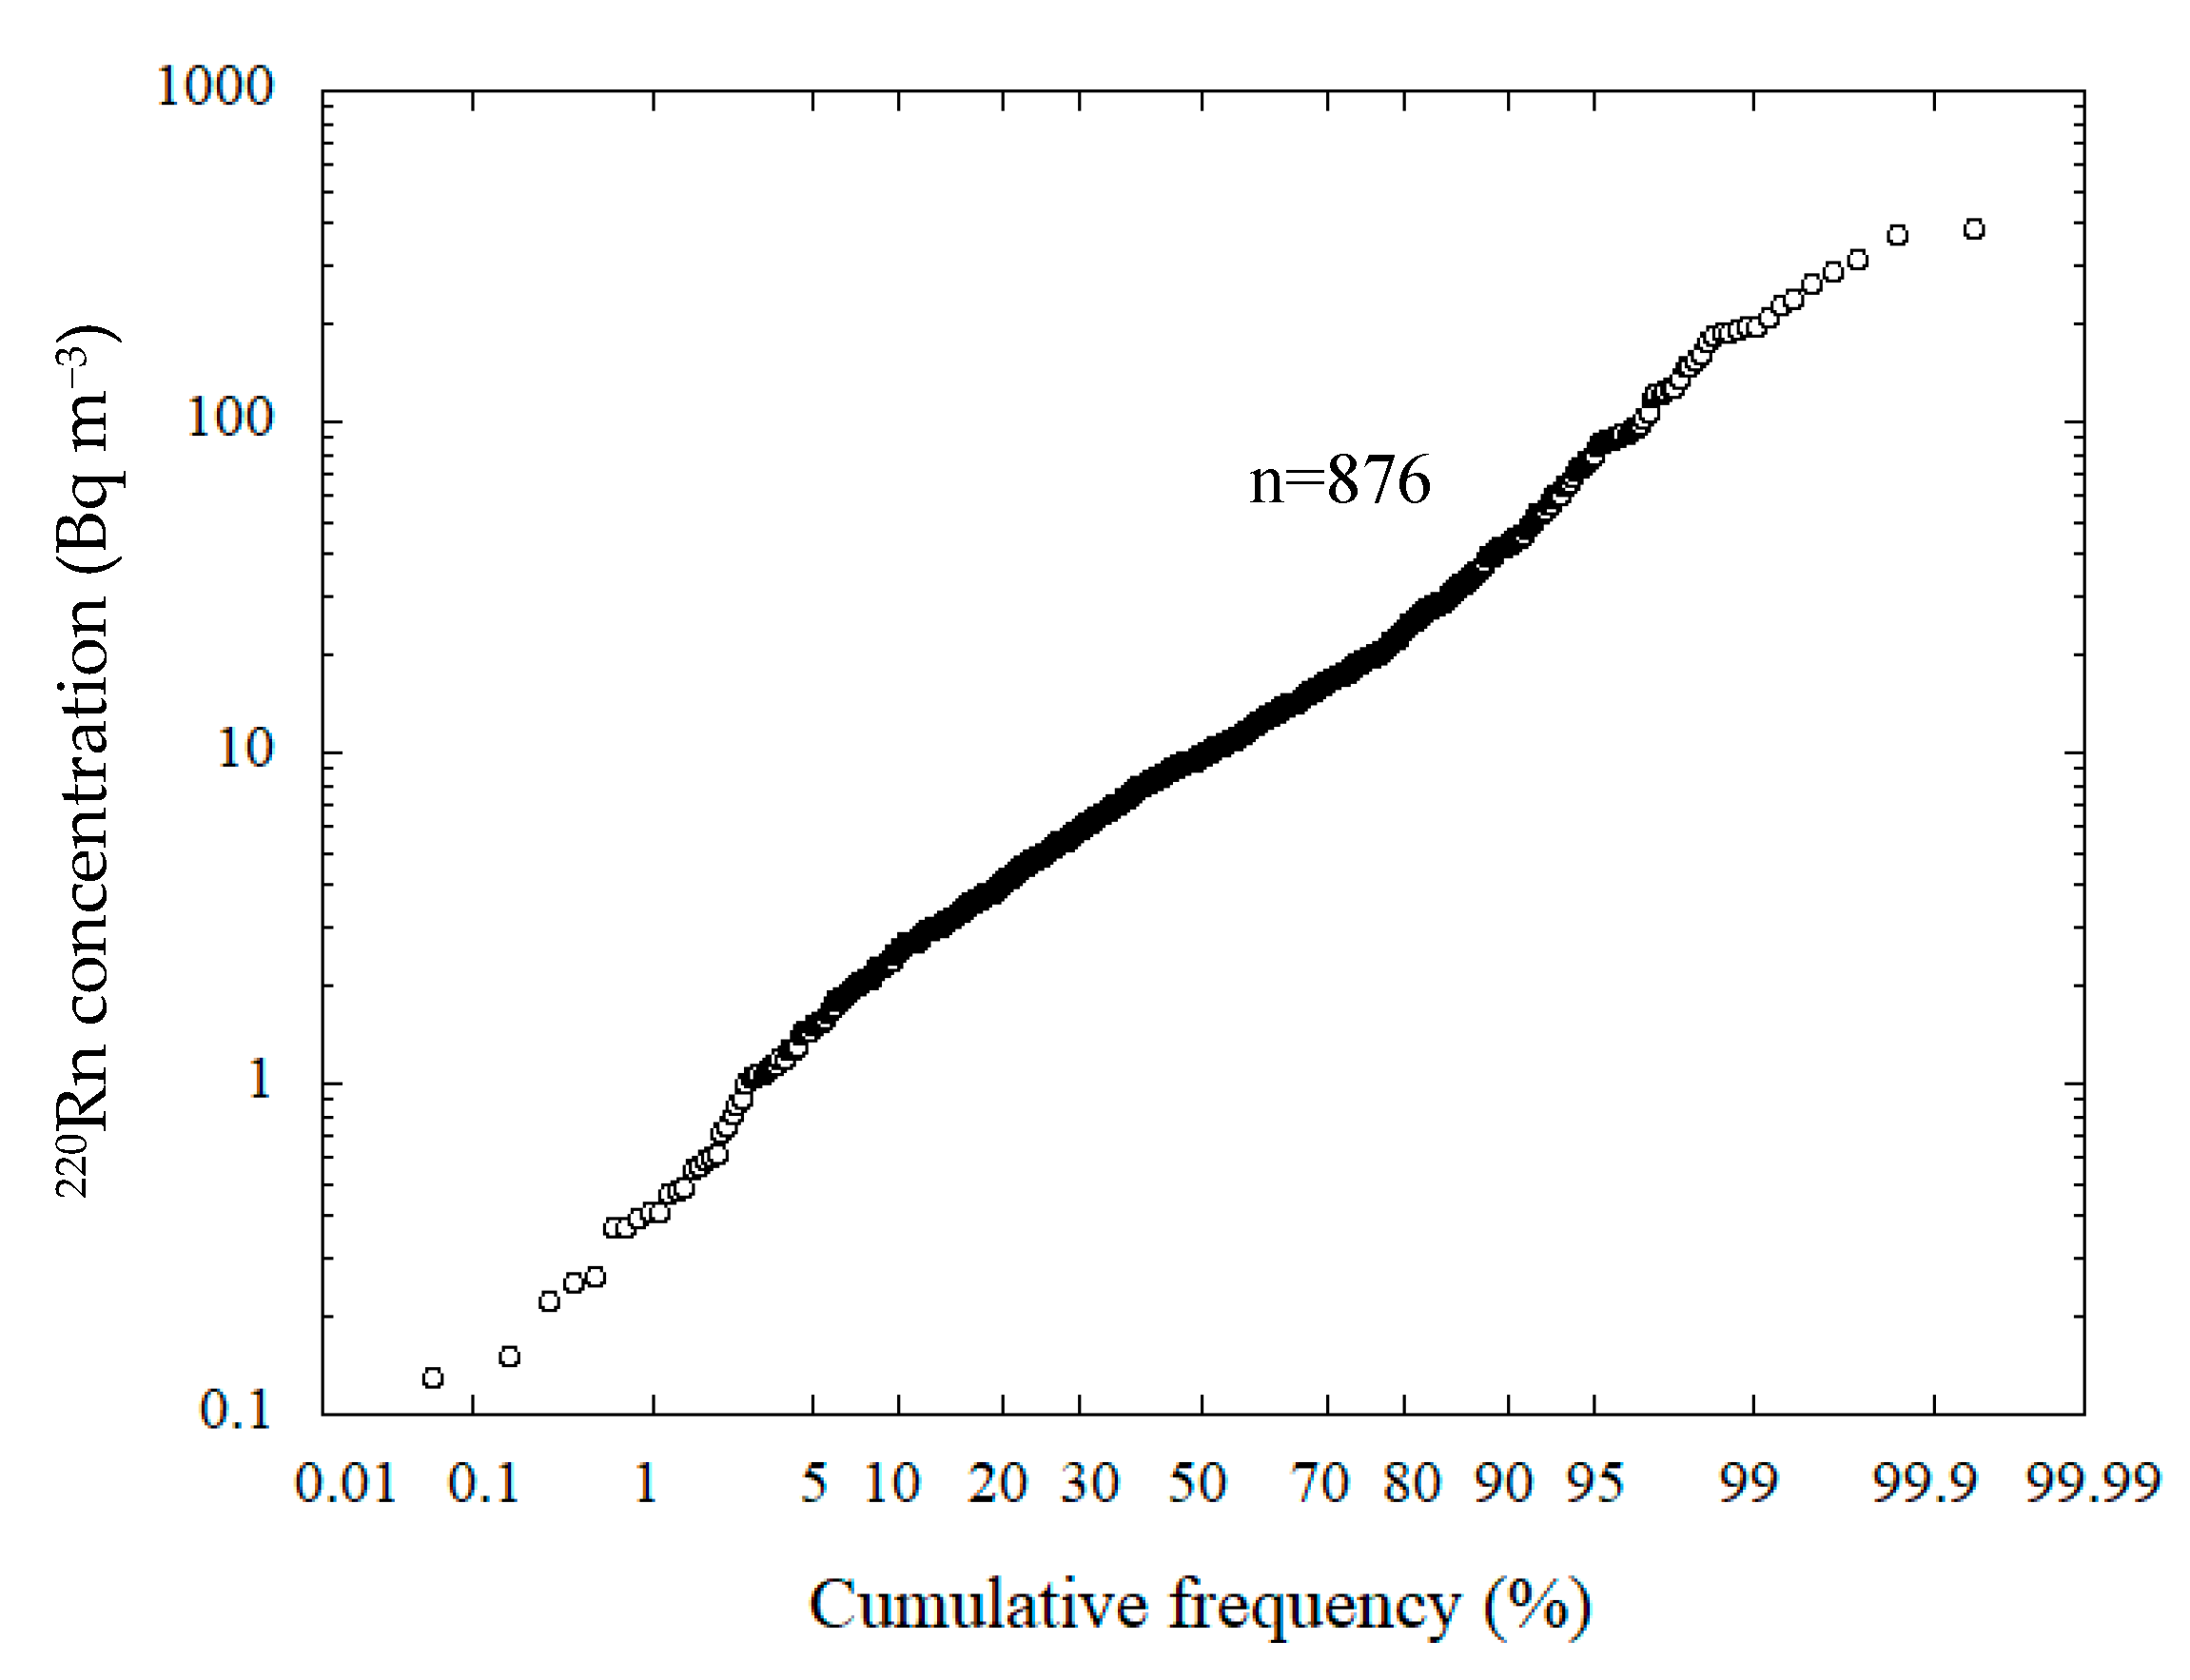
3.1. Distribution of 220Rn Concentration

The mean annual 220Rn concentrations were obtained for 899 houses, the number of houses monitored being reduced from the original 940 houses as was the case for 222Rn [23]. The annual arithmetic mean, and the median were calculated and values less than the DL (<4 Bq m−3) were included in each quarter value. In addition, if a negative value was obtained due to statistical variation as a result of background subtraction, this value was assigned as a zero. The histogram for the mean annual indoor 220Rn concentrations is presented in Figure 1. The mean annual 220Rn concentration was found to vary from <4 to 383 Bq m−3. The arithmetic mean, the median, the geometric mean and the geometric standard deviation were 20.1 ± 36.8, 9.6, 10.0 Bq m−3 and 3.2, respectively. The 222Rn concentrations varied from 3.1 to 208 Bq m−3. The arithmetic mean, the median, the geometric mean and the geometric standard deviation were 15.5 ± 13.5, 11.7, 12.7 Bq m−3 and 1.78, respectively [23]. As a comparison, Kim et al. reported that the geometric mean for 220Rn concentrations in Korea was 10.7 Bq m−3. The log-normal cumulative frequency distribution for the indoor 220Rn concentrations is shown in Figure 2. The 220Rn concentration distribution would appear to be close to a log-normal distribution. The distribution of the mean annual indoor 220Rn concentrations was accepted as a log-normal distribution based on the Kolmogorov–Smirnov test at a significance level of 95%.

3.2. Seasonal Variation

The indoor 220Rn concentration data for each season are presented in Table 1. Negative values in this dataset were eliminated for calculation of the geometric mean. A significant seasonal variation in the 220Rn concentrations for the four seasons was not found. According to Kim et al. [15] and Stjanovska et al. [16], a temporal pattern in the 220Rn concentration data was observed with values in the winter and spring seasons being higher than those in the summer and autumn. Martinez et al. [17] found that the highest concentrations for Mexico City were in the autumn season and the lowest concentrations were in summer.
In the present study, slight differences were noted in the 220Rn concentrations depending on the periods of exposure. The lowest 220Rn concentrations for all types of houses were observed in the winter season (October–December). However, a different relationship was noted for the 222Rn concentrations, namely, that the 222Rn concentrations tended to be higher in winter compared to the other seasons [23]. This was probably because the residents used domestic heaters to maintain a comfortable room temperature in winter, and consequently there would have been increased ventilation rates due to the contribution of convection and/or stack effect in the rooms.
The variation of the 220Rn concentration in the rooms was slightly different from that of 222Rn, which may reflect the differences in the half-lives and sources of 220Rn, despite the fact that there were large fluctuations in the standard deviations for the seasonal variations of 220Rn concentrations. The reason why the indoor 220Rn concentrations did not display a variation similar to 222Rn is unclear at this time.

3.3. Nature of Housing

Indoor 220Rn concentrations were categorized in terms of the structural features of the housing. The annual mean, the standard deviation, and the geometric mean for the indoor 220Rn concentrations together with number of houses monitored are given in Table 2. The arithmetic and geometric mean concentrations for wooden and concrete-based houses have higher values than those of other structures, although there were large fluctuations in the data. The maximum value was found for a wooden house with a mud wall, the highest 220Rn concentration being 383 Bq m−3. The cause of the high 220Rn concentration of wooden houses is that they have relatively high ratio of the mud wall in comparison to other house structure types. Table 3 lists the ratio of the mud wall in each housing type. Accordingly, the 220Rn concentrations in wooden houses are higher than those for other housing types.
With respect to the 220Rn concentrations by region, the overall ratios for wooden houses with mud walls in the Hokkaido—Tohoku, Kanto and Kyushu—Okinawa areas are lower than for those in other areas of Japan. Therefore, the 220Rn concentrations in these former areas also tends to be lower than the values found in the other areas.

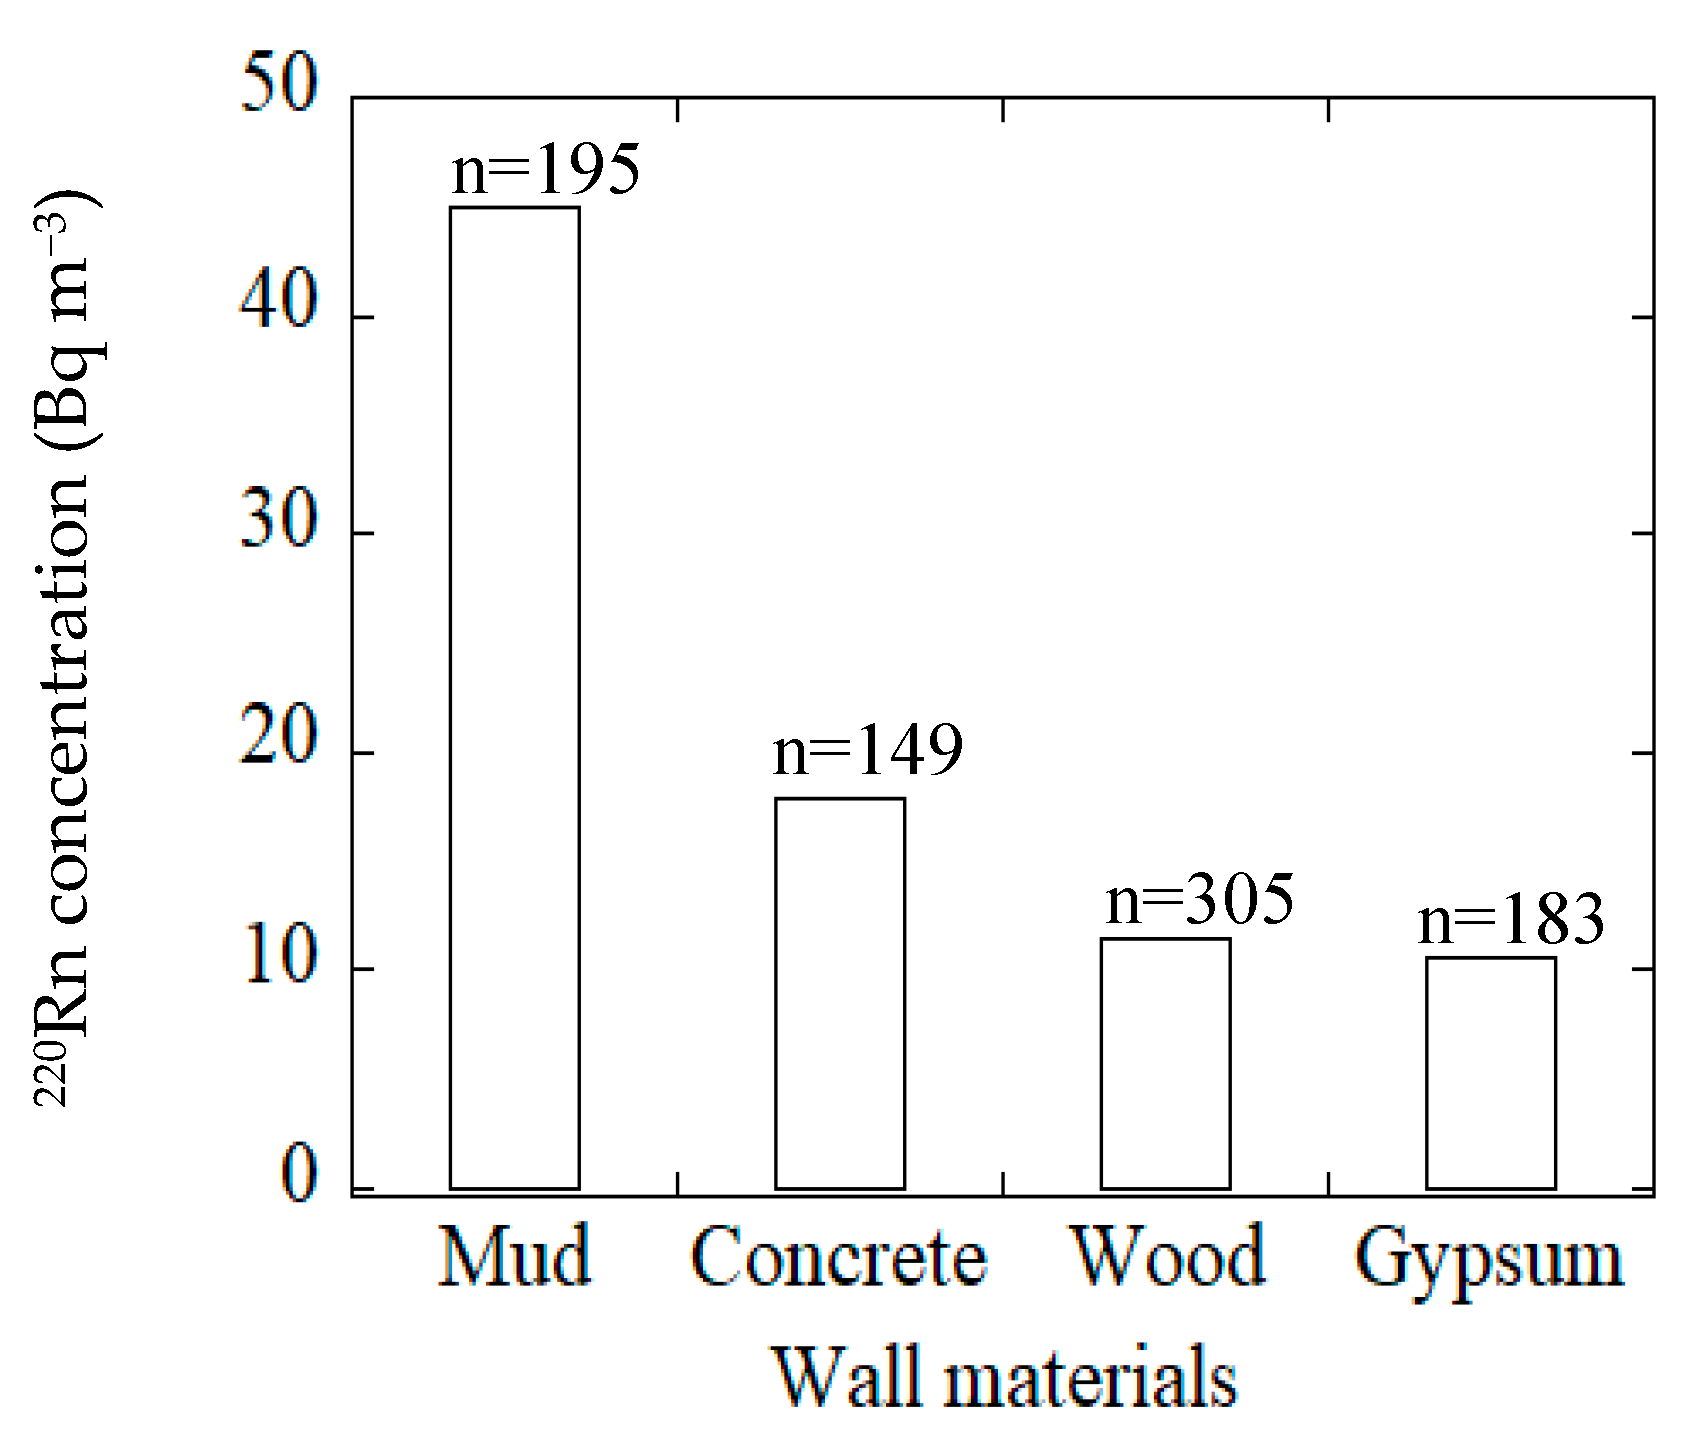
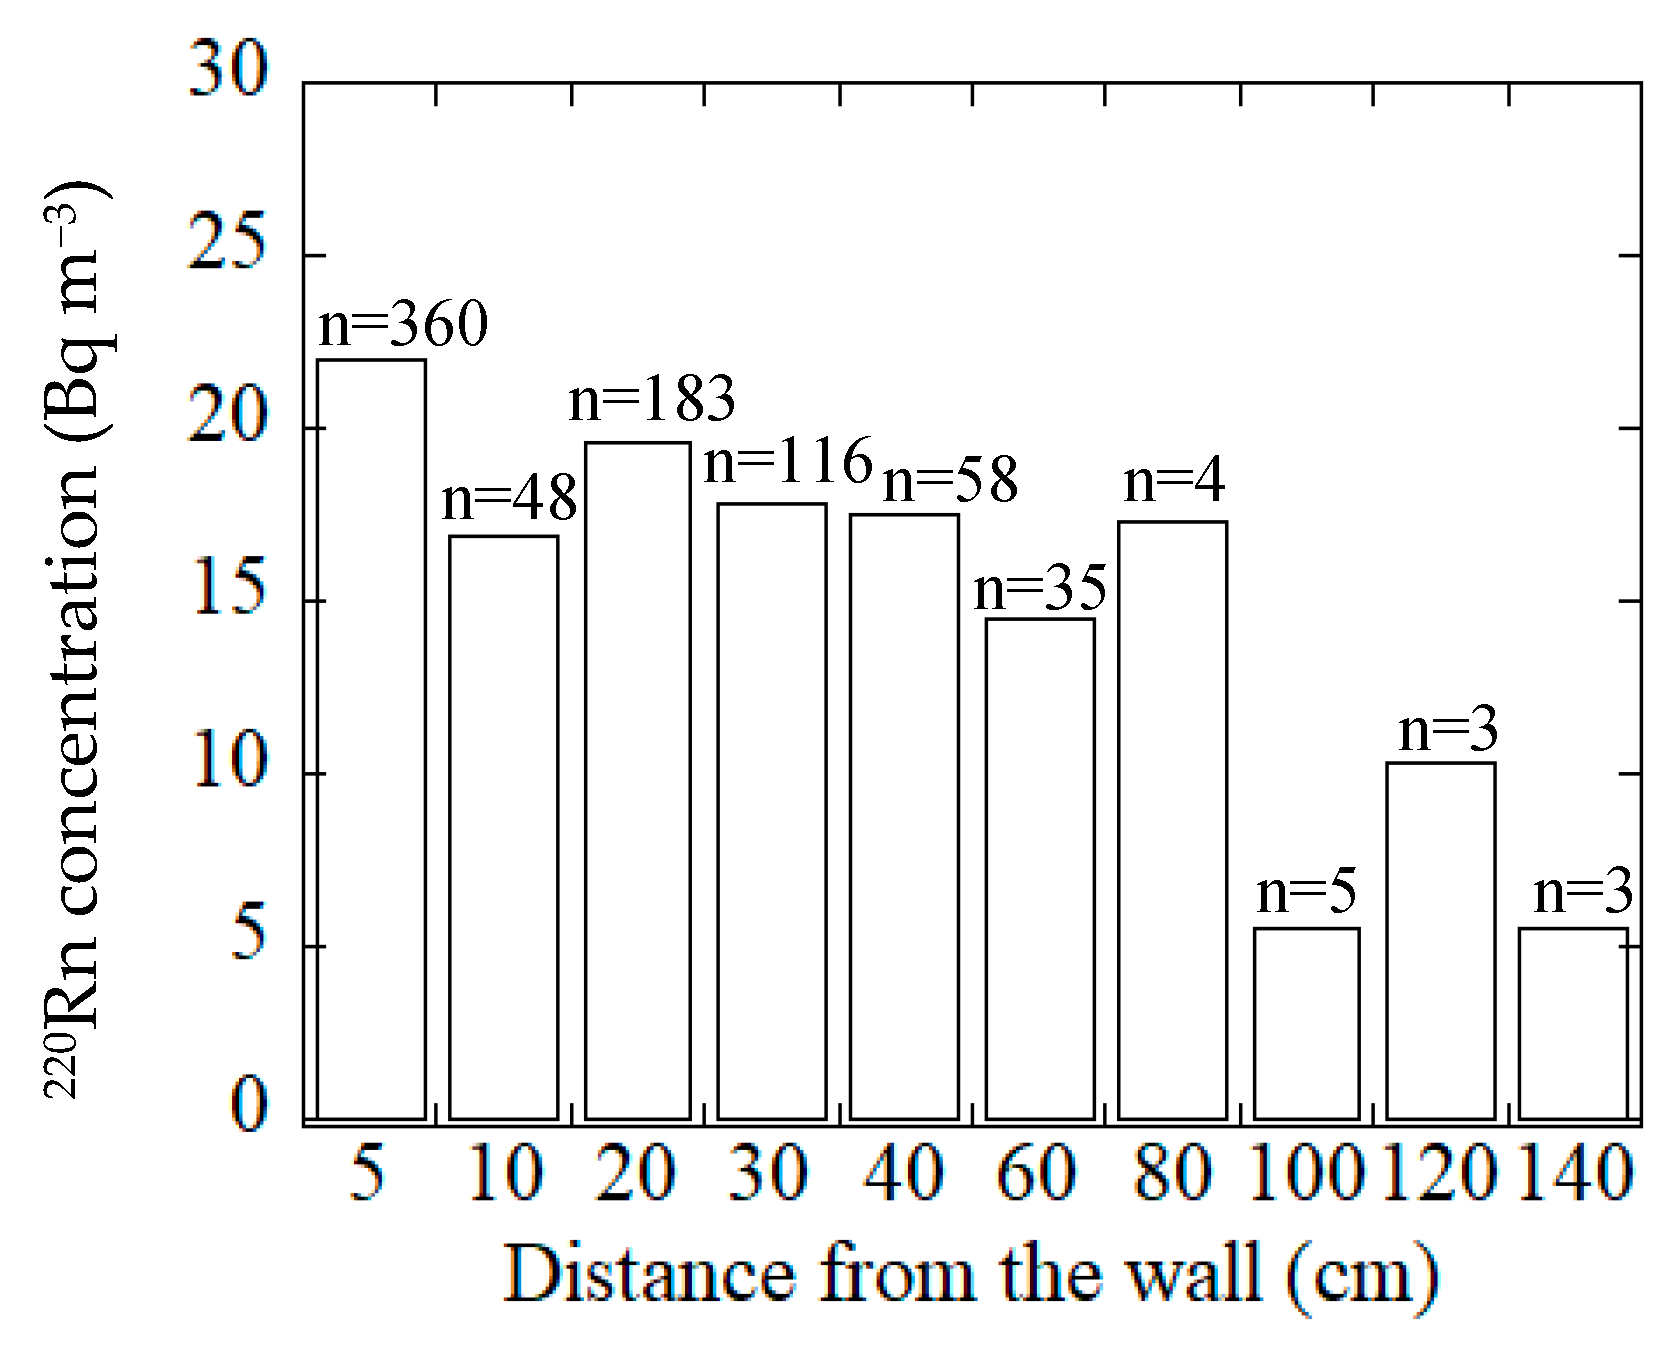
3.4. Dependency of 220Rn Concentration on Wall Structure and Distance from Wall

The present survey on 220Rn concentrations considered four categories of material which were used for wall construction in the houses. The mean annual 220Rn concentrations obtained by passive measurement for the different wall materials in the houses are presented in Figure 3. Inspection of the results (Figure 3) reveals that high 220Rn concentrations occurred for houses with mud walls, and the values decreased gradually with distance from the surface of the wall as shown in Figure 4. Yonehara et al. reported similar behavior for 220Rn concentrations at locations near the wall surfaces in Japanese dwellings [26].

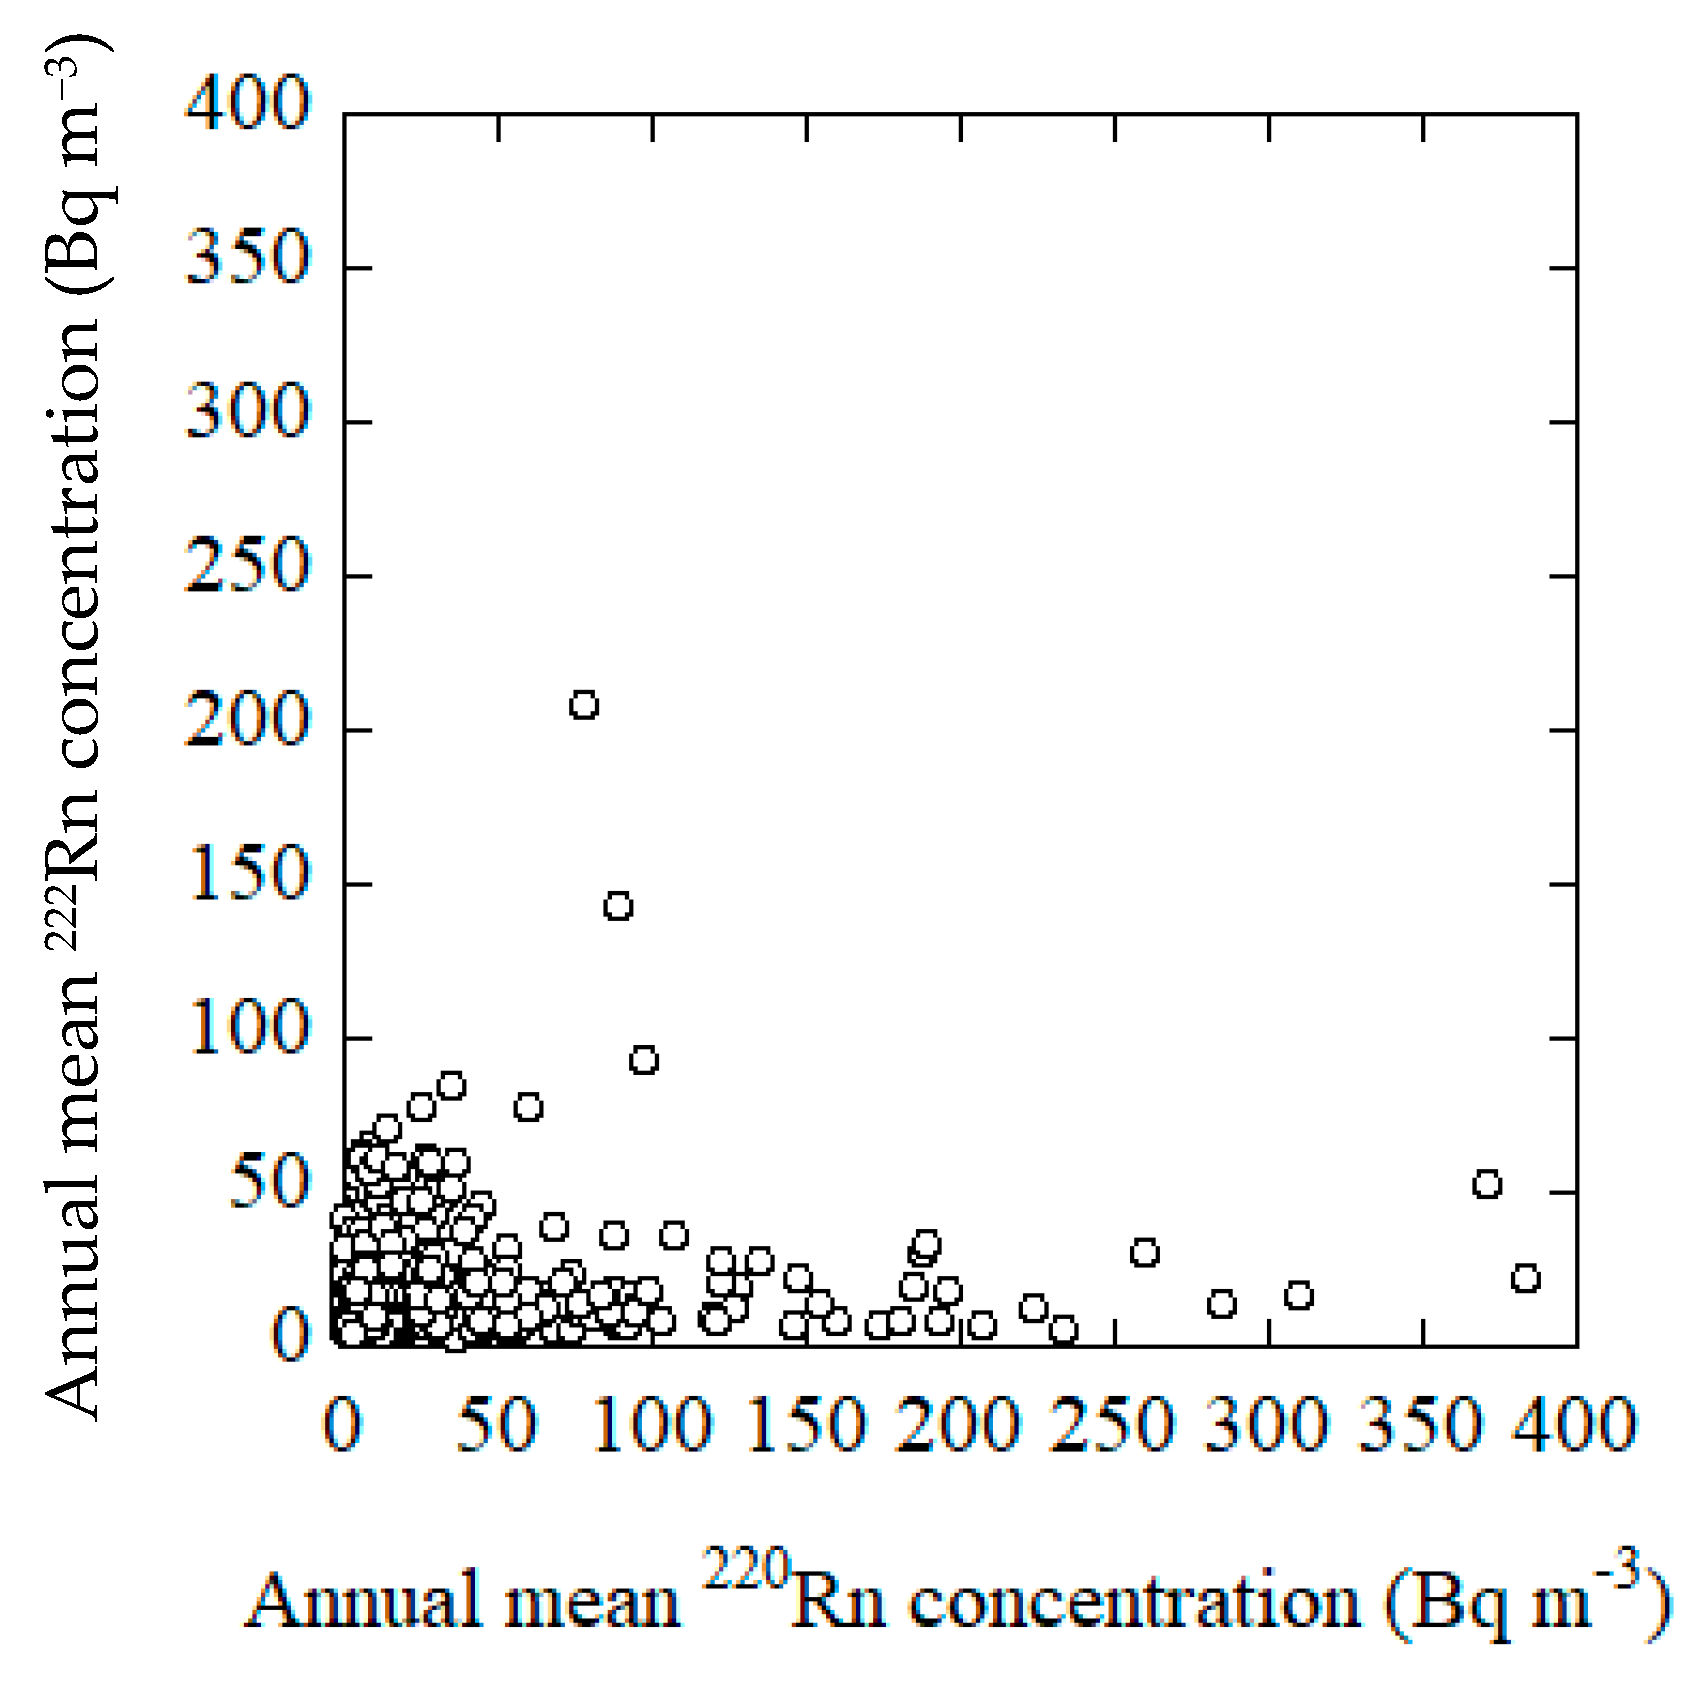
3.5. 220Rn and 222Rn Correlation

The correlation between the indoor 220Rn and 222Rn concentrations was investigated. The relationship between the 220Rn and the 222Rn concentrations is illustrated in Figure 5. The concentration distributions for both radioisotopes follow approximately a log-normal distribution. Consequently, both datasets were calculated after taking the logarithms of the respective data. The linear regression analysis shows a weak positive correlation (R = 0.25). The ratio for the concentrations of 220Rn/222Rn ranged from 0.007 to 40.3 and reveal a log-normal plot. The arithmetic mean for 220Rn/222Rn was 1.64 and geometric mean was 0.78.

4. Conclusions

The mean annual indoor 220Rn concentrations were measured in 899 houses using a passive 222Rn–220Rn discriminative monitor. The arithmetic mean, the median and the geometric mean were 20.1, 9.6 and 10.0 Bq m−3, respectively. The 220Rn concentration plot exhibited a log-normal distribution. The maximum 220Rn concentration found in the present survey was 383 Bq m−3 for a wooden house with mud walls. The survey data for the indoor 220Rn concentrations in Japan did not exhibit a significant seasonal variation. There was a marked difference in the 220Rn concentration depending on the nature of the house structure. Relatively higher concentrations of 220Rn were found in wooden and concrete block houses compared to other housing types. In general, the 220Rn concentrations in traditional wooden houses with mud walls tended to be higher than those for houses with different wall types. Further, it was demonstrated that the 220Rn concentrations decreased with distance of measurement from the wall.

Funding

This research was carried out in collaboration with 47 prefectural institutes under the auspices of the former Science and Technology Agency of Japan.

Institutional Review Board Statement

Not applicable for studies not involving humans or animals.

Informed Consent Statement

Not applicable for studies not involving humans.

Data Availability Statement

The data presented in this study are available on request from the corresponding author.

Conflicts of Interest

The author declares no conflict of interest.

References

  1. United Nations Scientific Committee on the Effects of Atomic Radiation. Volume I: Annex B Exposures of the Public and Workers from Various Sources of Radiation. In UNSCEAR 2008 Report, Sources and Effects of Ionizing Radiation; UNSCEAR: New York, NY, USA, 2010. [Google Scholar]
  2. Doi, M.; Kobayashi, S. The passive radon-thoron discriminative dosimeter for practical use. Hoken Butsuri. 1994, 29, 155–166. [Google Scholar] [CrossRef]
  3. International Commission on Radiological Protection. Occupational intakes of radionuclides: Part 3. In Annals of the ICRP 46 (3/4); ICRP Publication 137: London, UK, 2017. [Google Scholar]
  4. Tokonami, S. Characteristic of Thoron (220Rn) and its progeny in the indoor environment. Int. J. Environ. Res. Public Health 2020, 17, 8769. [Google Scholar] [CrossRef]
  5. Bineng, G.S.; Saïdou, S.T.; Hosoda, M.; Siaka, Y.F.; Issa, H.; Suzuki, T.; Kudo, H.; Bouba, O. The importance of direct progeny measurements for correct estimation of effective dose due to radon and thoron. Front. Public Health 2020, 8, 17. [Google Scholar] [CrossRef] [PubMed] [Green Version]
  6. Chen, J.; Moir, D.; Sorimachi, A.; Janik, M.; Tokonami, S. Determination of thoron equilibrium factor from simultaneous long-term thoron and its progeny measurements. Radiat. Prot. Dosim. 2012, 149, 155–158. [Google Scholar] [CrossRef] [Green Version]
  7. Chen, J.; Bergman, L.; Falcomer, R.; Whyte, J. Results of simultaneous radon and thoron measurements in 33 metropolitan areas of Canada. Radiat. Prot. Dosim. 2015, 163, 210–216. [Google Scholar] [CrossRef] [PubMed] [Green Version]
  8. Kudo, H.; Tokonami, S.; Omori, Y.; Ishikawa, T.; Iwaoka, K.; Sahoo, S.K.; Akata, N.; Hosoda, M.; Pornnumpa, C.; Sun, Q.; et al. Comparative dosimetry for radon and thoron in high background radiation areas in China. Radiat. Prot. Dosim. 2015, 167, 155–159. [Google Scholar] [CrossRef] [PubMed]
  9. Shang, B.; Tschiersch, J.; Cui, H.; Xia, Y. Radon survey in dwellings of Gansu, China: The influence of thoron and an attempt for correction. Radiat. Environ. Biophys. 2008, 47, 367–373. [Google Scholar] [CrossRef]
  10. Tokonami, S.; Sun, Q.; Akiba, S.; Zhuo, W.; Furukawa, M.; Ishikawa, T.; Hou, C.; Zhang, S.; Narazaki, Y.; Ohji, B.; et al. Radon and thoron exposures for cave residents in Shanxi and Shaanxi Provinces. Radiat. Res. 2004, 162, 390–396. [Google Scholar] [CrossRef]
  11. Kovacs, T. Thoron measurements in Hungary. Radiat. Prot. Dosim. 2010, 141, 328–334. [Google Scholar] [CrossRef]
  12. Omori, Y.; Tokonami, S.; Sahoo, S.K.; Ishikawa, T.; Sorimachi, A.; Hosoda, M.; Kudo, H.; Pornnumpa, C.; Nair, R.R.K.; Jayalekshmi, P.A.; et al. Radiation dose due to radon and thoron progeny inhalation in high-level natural radiation areas of Kerala, India. J. Radiol. Prot. 2017, 37, 111–126. [Google Scholar] [CrossRef]
  13. Mc Laughlin, J.P.; Murray, M.; Currivan, L.; Pollard, D.; Smith, V.; Tokonami, S.; Sorimachi, A.; Janik, M. Thoron and its airborne progeny in Irish dwellings. In Proceedings of the Third European IRPA Congress, Helsinki, Finland, 14–18 June 2010; pp. 2607–2612. [Google Scholar]
  14. Nyambura, C.; Tokonami, S.; Hashim, N.O.; Chege, M.W.; Suzuki, T.; Hosoda, M. Annual effective dose assessment due to radon and thoron progenies in dwellings of Kilimanbogo, Kenya. Radiat. Prot. Dosim. 2019, 184, 430–434. [Google Scholar] [CrossRef] [PubMed]
  15. Kim, C.K.; Kim, Y.J.; Lee, H.Y.; Chang, B.U.; Tokonami, S. 220Rn and its progeny in dwellings of Korea. Radiat. Meas. 2007, 42, 1409–1414. [Google Scholar] [CrossRef]
  16. Stojanovska, Z.; Bossew, P.; Tokonami, S.; Zunic, Z.; Bochicchio, F.; Boev, B.; Ristova, M.; Januseski, J. National survey of indoor thoron concentration in FYR of Macedonia (continental Europe–Balkan region). Radiat. Meas. 2013, 49, 57–66. [Google Scholar] [CrossRef]
  17. Martinez, T.; Navarrete, M.; Gonzalez, P.; Ramirez, A. Variation in indoor thoron levels in Mexico City dwellings. Radiat. Prot. Dosim. 2004, 111, 111–113. [Google Scholar] [CrossRef]
  18. Smetsers, R.C.G.M.; Blaauboer, R.O.; Dekkers, F.; Slaper, H. Radon and thoron progeny in Dutch dwellings. Radiat. Prot. Dosim. 2018, 181, 11–14. [Google Scholar] [CrossRef]
  19. Vaupotic, J.; Kavasi, N. Preliminary study of thoron and radon levels in various indoor environments in Slovenia. Radiat. Prot. Dosim. 2010, 141, 383–385. [Google Scholar] [CrossRef]
  20. Saputra, M.A.; Nugraha, E.D.; Purwanti, T.; Arifianto, R.; Laksmana, R.I.; Hutabarat, R.P.; Hosoda, M.; Tokonami, S. Exposures from radon, thoron, and thoron progeny in high background radiation area in Takandeang, Mamuju, Indonesia. Nukleonika 2020, 65, 89–94. [Google Scholar] [CrossRef]
  21. Wang, Z.; Lubin, J.; Wang, L.; Zhang, S.; Boice, J.; Cui, H.; Zhang, S.; Conrath, S.; Xia, Y.; Shang, B.; et al. Residential radon and lung cancer risk in a high-exposure area of Gansu Province, China. Am. J. Epidemiol. 2002, 155, 554–564. [Google Scholar] [CrossRef] [Green Version]
  22. Hosoda, M.; Kudo, H.; Iwaoka, K.; Yamada, R.; Suzuki, T.; Tamakuma, Y.; Tokonami, S. Characteristic of thoron (220Rn) in environment. Appl. Radiat. Isot. 2017, 120, 7–10. [Google Scholar] [CrossRef]
  23. Sanada, T.; Fujimoto, K.; Miyano, K.; Doi, M.; Tokonami, S.; Uesugi, M.; Takata, Y. Measurement of nationwide indoor Rn concentration in Japan. J. Environ. Radioact. 1999, 129–137. [Google Scholar] [CrossRef]
  24. Currie, L.A. Limits for qualitative detection and quantitative determination. Anal. Chem. 1968, 40, 586–593. [Google Scholar] [CrossRef]
  25. Kurosawa, R.; Tokonami, S.; Kamota, F. On the convenient test chamber for calibration of passive integrating radon-thoron monitor, environmental radon. In Proceedings of the ‘91 Radon Symposium, Kumatori, Japan, 8–10 August 1992; pp. 464–475. [Google Scholar]
  26. Yonehara, H.; Tokonami, S.; Zhuo, W.; Ishikawa, T.; Fukutsu, K.; Yamada, Y. Thoron in the living environments of Japan. Int. Congr. Ser. 2005, 1276, 58–61. [Google Scholar] [CrossRef]
Figure 1. Histogram for indoor 220Rn concentrations.
Ijerph 18 01299 g001
Figure 2. Cumulative frequency distribution for indoor 220Rn concentrations. This figure has been prepared using the mean annual 220Rn concentrations in excess of zero Bq m−3.
Ijerph 18 01299 g002
Figure 3. 220Rn concentrations for various wall materials.
Ijerph 18 01299 g003
Figure 4. 220Rn concentrations at different distances from the wall surface for all wall materials.
Ijerph 18 01299 g004
Figure 5. Correlation between the mean annual concentrations of 220Rn and 222Rn.
Ijerph 18 01299 g005
Table 1. 220Rn concentrations measured in the different seasons.
Measurement PeriodNumber of
Houses
220Rn (Bq m−3)GSD
AMSDGM
(Number of Houses)
January–March89918.940.014.6 (576)3.5
April–June22.839.214.4 (733)3.5
July–September21.942.314.0 (713)3.3
October–December16.641.013.0 (492)3.9
AM: Arithmetic mean; SD: Standard deviation; GM: Geometric mean; GSD: Geometric standard deviation (dimensionless).
Table 2. The mean annual 220Rn concentration for each type of house.
StructureNumber of Houses220Rn (Bq m−3)
AMSDGM
Wooden59723.140.710.8
Concrete18216.332.59.6
Steel frame908.68.96.1
Concrete block1621.825.613.8
Prefabricated63.42.62.7
AM: Arithmetic mean; SD: Standard deviation; GM: Geometric mean.
Table 3. Ratio of mud wall in each structure type.
Structure TypeTotal Number of HousesNumber of Mud Wall HousesRatio of Mud Wall in the House (%)
Wooden59719031.8
Concrete18231.6
Steel frame9000
Concrete block1616.3
Prefabricated600
Publisher’s Note: MDPI stays neutral with regard to jurisdictional claims in published maps and institutional affiliations.

