Identification of Nutritional Targets in Spanish Children Belonging to the LAyDI Cohort for the Development of Health Promotion Strategies in the First Two Years of Life


Abstract
:1. Introduction
2. Subjects and Methods
2.1. Nutritional Assessment
2.2. Anthropometric Measures
2.3. Statistical Analyses
3. Results
3.1. Description of the Sample
3.2. Dietary Intake and Related Factors
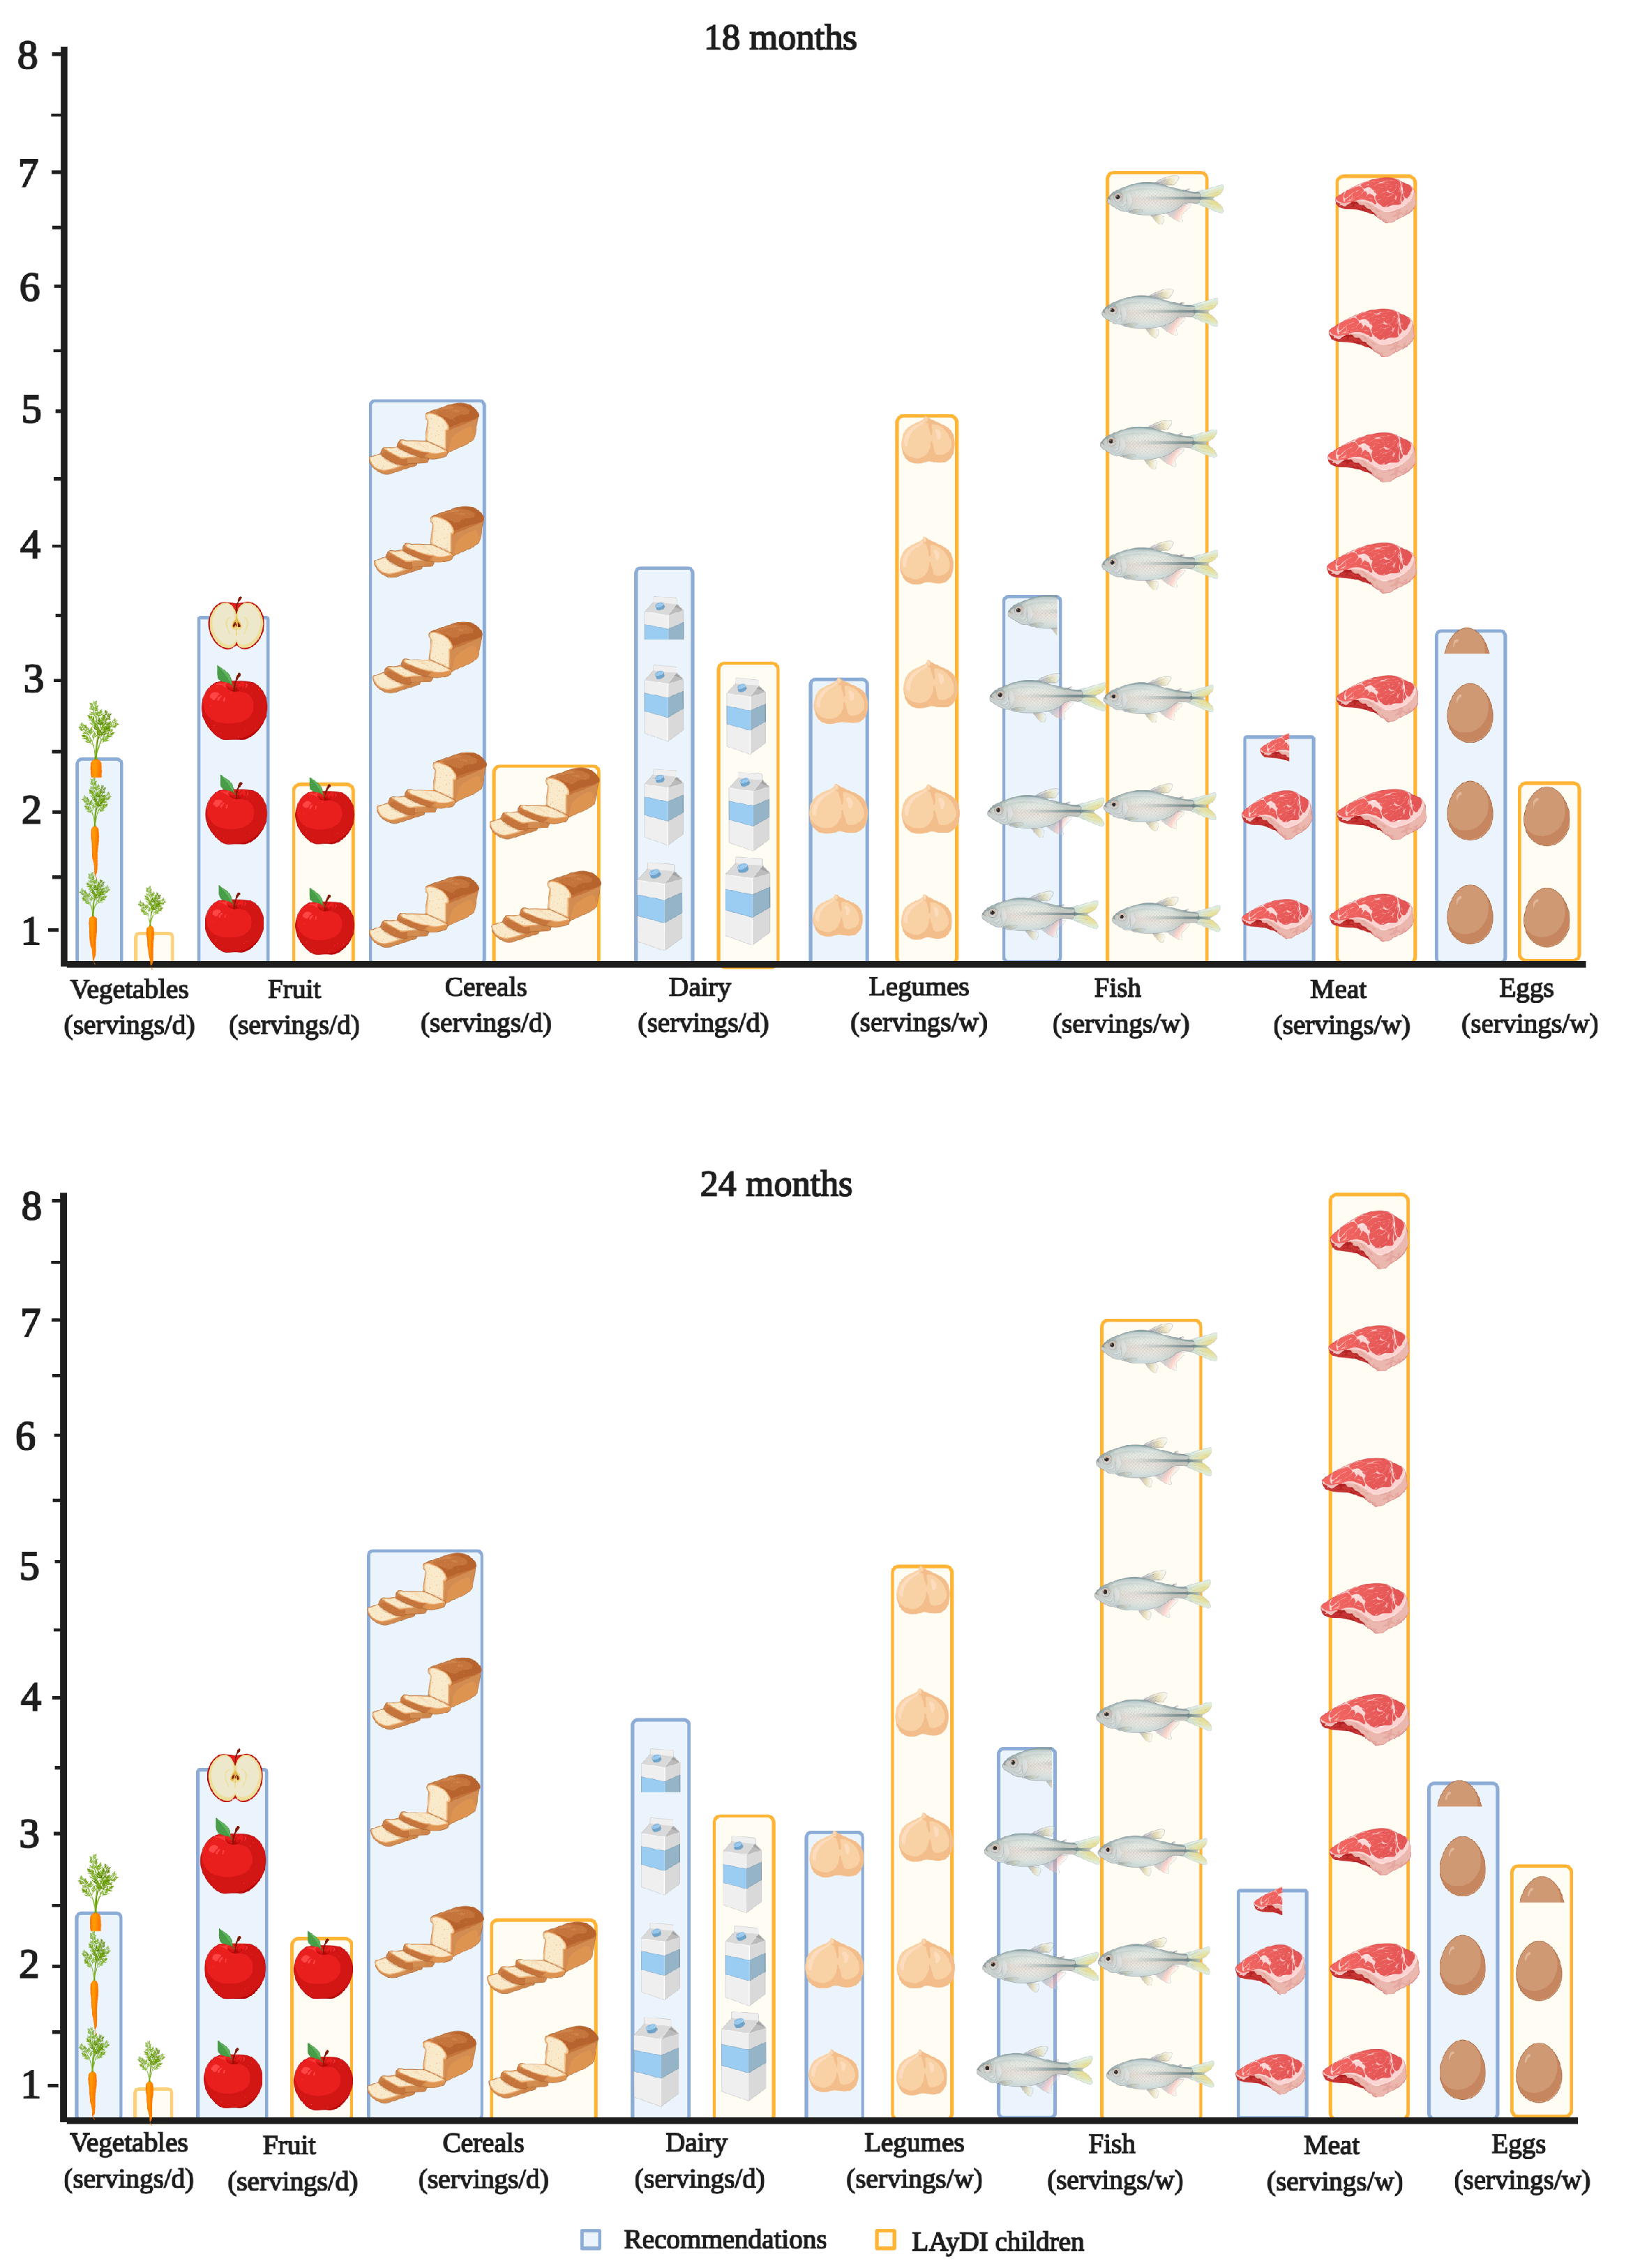
3.3. Nutritional Targets in Children
3.4. Bioactive Compounds
4. Discussion
5. Conclusions
Supplementary Materials
Author Contributions
Funding
Institutional Review Board Statement
Informed Consent Statement
Data Availability Statement
Acknowledgments
Conflicts of Interest
References
- Emmett, P.M.; Jones, L.R. Diet, growth, and obesity development throughout childhood in the Avon Longitudinal Study of Parents and Children. Nutr. Rev. 2015, 73, 175–206. [Google Scholar] [CrossRef] [PubMed] [Green Version]
- Mameli, C.; Mazzantini, S.; Zuccotti, G. Nutrition in the First 1000 Days: The origin of childhood obesity. Int. J. Environ. Res. Public Health 2016, 13, 838. [Google Scholar] [CrossRef] [PubMed] [Green Version]
- Schwarzenberg, S.J.; Georgieff, M.K. Advocacy for improving nutrition in the first 1000 days to support childhood development and Adult Health. Pediatrics 2018, 141, e20173716. [Google Scholar] [CrossRef] [Green Version]
- Schack-Nielsen, L.; Sørensen, T.I.; Mortensen, E.L.; Michaelsen, K.F. Late introduction of complementary feeding, rather than duration of breastfeeding, may protect against adult overweight. Am. J. Clin. Nutr. 2010, 91, 619–627. [Google Scholar] [CrossRef] [PubMed] [Green Version]
- Weng, S.F.; Redsell, S.A.; Swift, J.A.; Yang, M.; Glazebrook, C.P. Systematic review and meta-analyses of risk factors for childhood overweight identifiable during infancy. Arch. Dis. Child. 2012, 97, 1019–1026. [Google Scholar] [CrossRef] [Green Version]
- Taveras, E.M. Childhood obesity risk and prevention: Shining a lens on the first 1000 days. Child. Obes. 2016, 12, 159–161. [Google Scholar] [CrossRef] [Green Version]
- Woo Baidal, J.A.; Locks, L.M.; Cheng, E.R.; Blake-Lamb, T.L.; Perkins, M.E.; Taveras, E.M. Risk factors for childhood cbesity in the first 1,000 days. Am. J. Prev. Med. 2016, 50, 761–779. [Google Scholar] [CrossRef]
- Beluska-Turkan, K.; Korczak, R.; Hartell, B.; Moskal, K.; Maukonen, J.; Alexander, D.E.; Salem, N.; Harkness, L.; Ayad, W.; Szaro, J.; et al. Nutritional gaps and supplementation in the first 1000 days. Nutrients 2019, 11, 2891. [Google Scholar] [CrossRef] [Green Version]
- World Health Organisation (WHO). Appropriate Complementary Feeding. Available online: https://www.who.int/elena/titles/complementary_feeding/en/ (accessed on 6 December 2020).
- Lázaro, A. Alimentación del lactante sano. Hosp. Tarrasa Hosp. Clínica Zaragoza 2011, I, 287–295. [Google Scholar] [CrossRef]
- Nicklaus, S.; Boggio, V.; Chabanet, C.; Issanchou, S. A prospective study of food variety seeking in childhood, adolescence and early adult life. Appetite 2005, 44, 289–297. [Google Scholar] [CrossRef]
- Brisbois, T.D.; Farmer, A.P.; McCargar, L.J. Early markers of adult obesity: A review. Obes. Rev. 2012, 13, 347–367. [Google Scholar] [CrossRef] [PubMed] [Green Version]
- Livingstone, M.B.E.; Robson, P.J.; Wallace, J.M.W. Issues in dietary intake assessment of children and adolescents. Br. J. Nutr. 2004, 92, S213–S222. [Google Scholar] [CrossRef] [PubMed]
- Livingstone, M.B.E.; Robson, P.J. Measurement of dietary intake in children. Proc. Nutr. Soc. 2000, 59, 279–293. [Google Scholar] [CrossRef] [PubMed] [Green Version]
- Ortiz-Andrellucchi, A.; Henríquez-Sánchez, P.; Sánchez-Villegas, A.; Peña-Quintana, L.; Mendez, M.; Serra-Majem, L. Dietary assessment methods for micronutrient intake in infants, children and adolescents: A systematic review. Br. J. Nutr. 2009, 102, S87–S117. [Google Scholar] [CrossRef] [Green Version]
- Ruiz, E.; Ávila, J.; Valero, T.; del Pozo, S.; Rodriguez, P.; Aranceta-Bartrina, J.; Gil, Á.; González-Gross, M.; Ortega, R.; Serra-Majem, L.; et al. Macronutrient Distribution and Dietary Sources in the Spanish Population: Findings from the ANIBES Study. Nutrients 2016, 8, 177. [Google Scholar] [CrossRef]
- Hörnell, A.; Lagström, H.; Lande, B.; Thorsdottir, I. Protein intake from 0 to 18 years of age and its relation to health: A systematic literature review for the 5th Nordic Nutrition Recommendations. Food Nutr. Res. 2013, 57, 21083. [Google Scholar] [CrossRef] [Green Version]
- Madrigal, C.; Soto-Méndez, M.J.; Hernández-Ruiz, Á.; Valero, T.; Ávila, J.M.; Ruiz, E.; Lara Villoslada, F.; Leis, R.; Martínez de Victoria, E.; Moreno, J.M.; et al. Energy intake, macronutrient profile and food sources of spanish children aged one to <10 years—results from the EsNuPI Study. Nutrients 2020, 12, 893. [Google Scholar] [CrossRef] [Green Version]
- Dalmau, J.; Moráis, A.; Martínez, V.; Peña-Quintana, L.; Varea, V.; Martínez, M.J.; Soler, B. Evaluación de la alimentación y consumo de nutrientes en menores de 3 años. Estudio piloto ALSALMA. An. Pediatr. 2014, 81, 22–31. [Google Scholar] [CrossRef]
- Zuccotti, G.; Cassatella, C.; Morelli, A.; Cucugliato, M.; Catinello, G.; del Balzo, V.; Guidarelli, L.; Agostoni, C.; Mameli, C.; Troiano, E.; et al. Nutrient intake in Italian infants and toddlers from north and south Italy: The Nutrintake 636 Study. Nutrients 2014, 6, 3169–3186. [Google Scholar] [CrossRef] [Green Version]
- Demmer, E.; Cifelli, C.; Houchins, J.; Fulgoni, V. The Pattern of Complementary Foods in American Infants and Children Aged 0–5 Years Old—A Cross-Sectional Analysis of Data from the NHANES 2011–2014. Nutrients 2018, 10, 827. [Google Scholar] [CrossRef] [Green Version]
- Huysentruyt, K.; Laire, D.; Van Avondt, T.; De Schepper, J.; Vandenplas, Y. Energy and macronutrient intakes and adherence to dietary guidelines of infants and toddlers in Belgium. Eur. J. Nutr. 2016, 55, 1595–1604. [Google Scholar] [CrossRef] [PubMed]
- Finn, K.; Jacquier, E.; Kineman, B.; Storm, H.; Carvalho, R. Nutrient intakes and sources of fiber among children with low and high dietary fiber intake: The 2016 feeding infants and toddlers study (FITS), a cross-sectional survey. BMC Pediatr. 2019, 19, 446. [Google Scholar] [CrossRef] [PubMed] [Green Version]
- Wisnuwardani, R.W.; De Henauw, S.; Forsner, M.; Gottrand, F.; Huybrechts, I.; Knaze, V.; Kersting, M.; Le Donne, C.; Manios, Y.; Marcos, A.; et al. Polyphenol intake and metabolic syndrome risk in European adolescents: The HELENA study. Eur. J. Nutr. 2020, 59, 801–812. [Google Scholar] [CrossRef] [PubMed] [Green Version]
- Scaglioni, S.; De Cosmi, V.; Ciappolino, V.; Parazzini, F.; Brambilla, P.; Agostoni, C. Factors influencing children’s eating behaviours. Nutrients 2018, 10, 706. [Google Scholar] [CrossRef] [Green Version]
- Instituto Nacional de Estadística. Movimiento Natural de la Población; Instituto Nacional de Estadística: Madrid, Spain, 2015; Volume 303, pp. 1–12. Available online: www.ine.es (accessed on 6 December 2020).
- González, C.A.; Argilaga, S.; Agudo, A.; Amiano, P.; Barricarte, A.; Beguiristain, J.M.; Chirlaque, M.D.; Dorronsoro, M.; Martinez, C.; Navarro, C.; et al. Diferencias sociodemográficas en la adhesión al patrón de dieta mediterránea en poblaciones de España. Gac. Sanit. 2002, 16, 214–221. [Google Scholar] [CrossRef] [Green Version]
- Ocké, M.; de Boer, E.; Brants, H.; van der Laan, J.; Niekerk, M.; van Rossum, C.; Temme, L.; Freisling, H.; Nicolas, G.; Casagrande, C.; et al. PANCAKE—Pilot study for the assessment of nutrient intake and food consumption among kids in Europe. EFSA Support. Publ. 2012, 9. [Google Scholar] [CrossRef]
- Slimani, N.; Fahey, M.; Welch, A.; Wirfält, E.; Stripp, C.; Bergström, E.; Linseisen, J.; Schulze, M.; Bamia, C.; Chloptsios, Y.; et al. Diversity of dietary patterns observed in the European Prospective Investigation into Cancer and Nutrition (EPIC) project. Public Health Nutr. 2002, 5, 1311–1328. [Google Scholar] [CrossRef]
- Dirección General de Salud Púlbica y Consumo. La Alimentación de 1 a 3 años, 4th ed.; Dirección General de Salud Púlbica y Consumo: La Rioja, Spain, 2019; pp. 1–20. [Google Scholar]
- Centro de Ensenanza Superior de Nutricion Humana y Dietetica (CESNID). Tablas de Composicion de Alimentos por Medidas Caseras de Consumo Habitual en España; McGrawHill, Ed.; Publicaciones y Ediciones de la Universidad de Barcelona: Barcelona, Spain, 2008. [Google Scholar]
- U.S. Department of Agriculture Agricultural Research Service. FoodData Central. Available online: www.fdc.nal.usda.gov (accessed on 6 December 2020).
- Neveu, V.; Perez-Jimenez, J.; Vos, F.; Crespy, V.; du Chaffaut, L.; Mennen, L.; Knox, C.; Eisner, R.; Cruz, J.; Wishart, D.; et al. Phenol-Explorer: An online comprehensive database on polyphenol contents in foods. Database 2010, 2010, bap024. [Google Scholar] [CrossRef]
- Marlett, J.A.; Cheung, T.F. Database and quick methods of assessing typical dietary fiber intakes using data for 228 commonly consumed foods. J. Am. Diet. Assoc. 1997, 97, 1139–1151. [Google Scholar] [CrossRef]
- Gómez-Martín, M.; Arboleya, S.; Gueimonde, M.; González, S. Nutritional composition of processed baby foods targeted at infants from 0–12 months. J. Food Compos. Anal. 2019, 79, 55–62. [Google Scholar] [CrossRef]
- World Health Organisation (WHO). WHO child growth standards. Rev. Chil. Pediatría 2009, 80. [Google Scholar] [CrossRef] [Green Version]
- World Health Organisation (WHO). WHO Anthro for Personal Computers 2010. Available online: http://www.who.int/childgrowth/software/en/ (accessed on 6 December 2020).
- European Food Safety Authority (EFSA) Panel on dietetic products nutrition and allergies (NDA) overview on Dietary Reference Values for the EU population as derived by the EFSA Panel on Dietetic Products, Nutrition and Allergies (NDA). EFSA J. 2017, 4, 1–15.
- Children, A.C.; Male, G.; Ai, F.; Na, N.A.; Na, P.; Ri, N.A.; Na, N.A.; Na, U.L.; Ar, N.A.; Children, A.C.; et al. Scientific Opinion on Dietary Reference Values for energy. EFSA J. 2013, 11, 1–7. [Google Scholar] [CrossRef] [Green Version]
- Bell, L.K.; Jansen, E.; Mallan, K.; Magarey, A.M.; Daniels, L. Poor dietary patterns at 1–5 years of age are related to food neophobia and breastfeeding duration but not age of introduction to solids in a relatively advantaged sample. Eat. Behav. 2018, 31, 28–34. [Google Scholar] [CrossRef] [PubMed]
- Husk, J.S.; Keim, S.A. Breastfeeding and dietary variety among preterm children aged 1–3 years. Appetite 2016, 99, 130–137. [Google Scholar] [CrossRef]
- Siega-Riz, A.M.; Deming, D.M.; Reidy, K.C.; Fox, M.K.; Condon, E.; Briefel, R.R. Food consumption patterns of infants and toddlers: Where are we now? J. Am. Diet. Assoc. 2010, 110, S38–S51. [Google Scholar] [CrossRef]
- Yu, P.; Denney, L.; Zheng, Y.; Vinyes-Parés, G.; Reidy, K.C.; Eldridge, A.L.; Wang, P.; Zhang, Y. Food groups consumed by infants and toddlers in urban areas of China. Food Nutr. Res. 2016, 60, 30289. [Google Scholar] [CrossRef] [Green Version]
- Kyttälä, P.; Erkkola, M.; Kronberg-Kippilä, C.; Tapanainen, H.; Veijola, R.; Simell, O.; Knip, M.; Virtanen, S.M. Food consumption and nutrient intake in Finnish 1–6-year-old children. Public Health Nutr. 2010, 13, 947–956. [Google Scholar] [CrossRef] [Green Version]
- Manios, Y.; Grammatikaki, E.; Papoutsou, S.; Liarigkovinos, T.; Kondaki, K.; Moschonis, G. Nutrient Intakes of Toddlers and Preschoolers in Greece: The GENESIS Study. J. Am. Diet. Assoc. 2008, 108, 357–361. [Google Scholar] [CrossRef]
- Zheng, M.; Campbell, K.J.; Scanlan, E.; McNaughton, S.A. Development and evaluation of a food frequency questionnaire for use among young children. PLoS ONE 2020, 15, e0230669. [Google Scholar] [CrossRef]
- Lim, H.X.; Toh, J.Y.; Tan, K.H.; Chong, Y.-S.; Yap, F.; Godfrey, K.M.; Lee, Y.S.; Chong, M.F.-F. Validation of a semi-quantitative FFQ for 18-month-old toddlers: The Growing Up in Singapore Towards Healthy Outcomes (GUSTO) study. Public Health Nutr. 2019, 22, 1990–2000. [Google Scholar] [CrossRef] [PubMed]
- Jung, C.-H.; Choi, K.M. Impact of high-carbohydrate diet on metabolic parameters in patients with Type 2 Diabetes. Nutrients 2017, 9, 322. [Google Scholar] [CrossRef] [PubMed]
- Foterek, K.; Hilbig, A.; Kersting, M.; Alexy, U. Age and time trends in the diet of young children: Results of the DONALD study. Eur. J. Nutr. 2016, 55, 611–620. [Google Scholar] [CrossRef] [PubMed]
- Castro, P.D.; Kearney, J.; Layte, R. A study of early complementary feeding determinants in the Republic of Ireland based on a cross-sectional analysis of the Growing Up in Ireland infant cohort. Public Health Nutr. 2015, 18, 292–302. [Google Scholar] [CrossRef] [Green Version]
- Guthrie, J.F.; Anater, A.S.; Hampton, J.C.; Catellier, D.J.; Eldridge, A.L.; Johnson, W.L.; Quann, E.E. The special supplemental nutrition program for women, infants, and children is associated with several changes in nutrient intakes and food consumption patterns of participating infants and young children, 2008 compared with 2016. J. Nutr. 2020, 11, 2985–2993. [Google Scholar] [CrossRef]
- Davis, K.E.; Li, X.; Adams-Huet, B.; Sandon, L. Infant feeding practices and dietary consumption of US infants and toddlers: National Health and Nutrition Examination Survey (NHANES) 2003–2012. Public Health Nutr. 2018, 21, 711–720. [Google Scholar] [CrossRef] [Green Version]
- Marcelino, G.; Hiane, P.A.; Freitas, K.D.C.; Santana, L.F.; Pott, A.; Donadon, J.R.; Guimarães, R.D.C.A. Effects of olive oil and Its minor components on cardiovascular diseases, inflammation, and gut microbiota. Nutrients 2019, 11, 1826. [Google Scholar] [CrossRef] [Green Version]
- Hay, G.; Trygg, K.; Whitelaw, A.; Johnston, C.; Refsum, H. Folate and cobalamin status in relation to diet in healthy 2-y-old children. Am. J. Clin. Nutr. 2011, 93, 727–735. [Google Scholar] [CrossRef]
- Bailey, R.L.; Catellier, D.J.; Jun, S.; Dwyer, J.T.; Jacquier, E.F.; Anater, A.S.; Eldridge, A.L. Total usual nutrient intakes of US children (Under 48 Months): Findings from the Feeding Infants and Toddlers Study (FITS) 2016. J. Nutr. 2018, 148, 1557S–1566S. [Google Scholar] [CrossRef]
- Gong, R.; Wang, Z.-P.; Wang, M.; Gao, L.-J.; Zhao, Z.-T. Effects of folic acid supplementation during different pregnancy periods and relationship with the other primary prevention measures to neural tube defects. J. Matern. Neonatal Med. 2016, 29, 3894–3901. [Google Scholar] [CrossRef]
- Prietl, B.; Treiber, G.; Pieber, T.; Amrein, K. Vitamin D and immune function. Nutrients 2013, 5, 2502–2521. [Google Scholar] [CrossRef] [PubMed]
- Akkermans, M.D.; van der Horst-Graat, J.M.; Eussen, S.R.B.M.; van Goudoever, J.B.; Brus, F. Iron and vitamin D deficiency in healthy young children in Western Europe despite current nutritional recommendations. J. Pediatr. Gastroenterol. Nutr. 2016, 62, 635–642. [Google Scholar] [CrossRef] [PubMed]
- Brunner, T.A.; Casetti, L.; Haueter, P.; Müller, P.; Nydegger, A.; Spalinger, J. Nutrient intake of Swiss toddlers. Eur. J. Nutr. 2018, 57, 2489–2499. [Google Scholar] [CrossRef] [PubMed]
- Manzano, A.S.; Rodriguez, B.; Piñeiro, R.; Nuñez, E.; Escrig, R.; Cabrera, L.; Calvo, C. Utilización de Vitamina D en Pediatria; Asociación Española de Pedriatría: Madrid, Spain, 2019. [Google Scholar]
- Wang, Y.; Wu, Y.; Li, T.; Wang, X.; Zhu, C. Iron metabolism and brain development in premature infants. Front. Physiol. 2019, 10, 463–476. [Google Scholar] [CrossRef]
- Walton, J.; Kehoe, L.; McNulty, B.A.; Nugent, A.P.; Flynn, A. Nutrient intakes and compliance with nutrient recommendations in children aged 1-4 years in Ireland. J. Hum. Nutr. Diet. 2017, 30, 665–676. [Google Scholar] [CrossRef]
- Ziauddeen, N.; Rosi, A.; Del Rio, D.; Amoutzopoulos, B.; Nicholson, S.; Page, P.; Scazzina, F.; Brighenti, F.; Ray, S.; Mena, P. Dietary intake of (poly)phenols in children and adults: Cross-sectional analysis of UK National Diet and Nutrition Survey Rolling Programme (2008–2014). Eur. J. Nutr. 2019, 58, 3183–3198. [Google Scholar] [CrossRef] [PubMed]
- Rossi, M.C.; Bassett, M.N.; Sammán, N.C. Dietary nutritional profile and phenolic compounds consumption in school children of highlands of Argentine Northwest. Food Chem. 2018, 238, 111–116. [Google Scholar] [CrossRef]
- Rosi, A.; Mena, P.; Castello, F.; Del Rio, D.; Scazzina, F. Comprehensive dietary evaluation of Italian primary school children: Food consumption and intake of energy, nutrients and phenolic compounds. Int. J. Food Sci. Nutr. 2020, 21, 1–12. [Google Scholar] [CrossRef]
- Wisnuwardani, R.W.; De Henauw, S.; Androutsos, O.; Forsner, M.; Gottrand, F.; Huybrechts, I.; Knaze, V.; Kersting, M.; Le Donne, C.; Marcos, A.; et al. Estimated dietary intake of polyphenols in European adolescents: The HELENA study. Eur. J. Nutr. 2019, 58, 2345–2363. [Google Scholar] [CrossRef]
- Stephen, A.M.; Champ, M.M.-J.; Cloran, S.J.; Fleith, M.; van Lieshout, L.; Mejborn, H.; Burley, V.J. Dietary fibre in Europe: Current state of knowledge on definitions, sources, recommendations, intakes and relationships to health. Nutr. Res. Rev. 2017, 30, 149–190. [Google Scholar] [CrossRef]
- EFSA Panel on Dietetic Products, Nutrition, and Allergies (NDA). Scientific Opinion on Dietary Reference Values for carbohydrates and dietary fibre. EFSA J. 2010, 8, 1462. [Google Scholar]
- Marriott, L.D.; Robinson, S.M.; Poole, J.; Borland, S.E.; Godfrey, K.M.; Law, C.M. What do babies eat? Evaluation of a food frequency questionnaire to assess the diets of infants aged 6 months. Public Health Nutr. 2007, 11, 751–756. [Google Scholar] [CrossRef] [PubMed] [Green Version]


| Characteristics | 18 Months (N 426) | 24 Months (N 336) | |
|---|---|---|---|
| Gender | Boys | 213 (50) | 170 (50.6) |
| Girls | 213 (50) | 166 (49.4) | |
| Health status 1 | |||
| Complete immunization | Yes | 422 (99.3) | - |
| Illness in the last 6 months | No | 415 (97.6) | - |
| Sleep duration (hours/day) | <11 | 46 (10.8) | - |
| 11–14 | 337 (79.3) | - | |
| 14–16 | 41 (9.6) | - | |
| >16 | 1 (0.2) | - | |
| Diet | |||
| Special diet 2,3 | Yes | 29 (6.9) | 12 (3.6) * |
| Diet consistency 1 | Mashed foods | 3 (0.7) | 1 (0.3) |
| Semi-solid | 192 (45.2) | 94 (28) * | |
| Regular | 230 (54.1) | 241 (71.7) * | |
| Breastfeeding 1 | Yes | 141 (33.2) | 95 (28.4) |
| Anthropometric data | |||
| Weight (kg) 1,4 | 10.9 ± 1.2 | 12.3 ± 1.6 * | |
| Height (cm) 1,3 | 81.6 ± 3.2 | 86.9 ± 4.8 * | |
| BMI z-score 1,4 | Underweight (−5.0 to <−1) | 54 (12.7) | 52 (16.1) |
| Normal weight (−1 to 1) | 302 (70.9) | 214 (63.7) * | |
| Overweight (>1 to 2) | 57 (13.4) | 54 (16.1) | |
| Obese (>2) | 12 (2.8) | 14 (4.2) | |
| (A) | Oils (mL/Day) | Vegetables (g/Day) | Legumes (g/Day) | Fruit (g/Day) | Potato and Tubers (g/Day) | Cereals and Cereal Products (g/Day) | Meat and Meat Products (g/Day) | Fish (g/Day) | Eggs (g/Day) | Processed Infant Products 1 | Milk and Dairy Products 2 | Sweets and Desserts (g/Day) | |
|---|---|---|---|---|---|---|---|---|---|---|---|---|---|
| Total | 12.2 ± 5.4 | 131.8 ± 112.9 | 23.8 ± 19.5 | 237.4 ± 149.8 | 26.3 ± 19.9 | 67.8 ± 40.3 | 33.8 ± 25.7 | 46.5 ± 31.5 | 20.2 ± 8.8 | 183.8 ± 229.0 | 340.4 ± 246.7 | 15.1 ± 15.7 | |
| Gender | Boys | 12.2 ± 5.6 a | 135.3 ± 121.4 a | 24.4 ± 20.2 a | 238.9 ± 143.2 a | 28.1 ± 20.5 a | 66.7 ± 39.0 a | 34.0 ± 28.1 a | 46.8 ± 30.9 a | 19.7 ± 8.6 a | 176.2 ± 208.0 a | 354.9 ± 259.6 a | 15.2 ± 12.0 a |
| Girls | 12.2 ± 5.2 a | 128.4 ± 103.8 a | 23.2 ± 18.9 a | 236.0 ± 156.4 a | 24.5 ± 19.0 a | 68.9 ± 41.5 a | 33.6 ± 23.2 a | 46.1 ± 32.1 a | 20.8 ± 9.0 a | 191.4 ± 248.8 a | 325.6 ± 232.5 a | 15.0 ± 17.5 a | |
| Region | North | 11.8 ± 5.0 a | 127.4 a ±110.9 a,b | 23.0 ± 18.9 a | 238.3 ± 138.0 a | 27.2 ± 20.0 a | 65.5 ± 38.4 a | 37.2 ± 28.4 a | 47.3 ± 29.2 a | 20.4 ± 8.9 a | 183.6 ± 217.3 a | 321.4 ± 295.0 a | 15.3 ± 16.5 a |
| Central | 12.6 ± 6.2 a | 116.8 ± 91.5 a | 21.3 ± 18.0 a | 244.7 ± 170.6 a | 25.0 ± 20.7 a | 67.8 ± 35.4 a | 33.5 ± 24.5 a,b | 44.5 ± 30.3 a,b | 20.8 ± 9.1 a | 172.4 ± 235.2 a | 385.0 ± 263.9 a | 16.3 ± 16.2 a | |
| South | 12.7 ± 5.8 a | 163.5 ± 144.3 b | 28.0 ± 21.8 a | 215.8 ± 140.5 a | 27.9 ± 20.9 a | 71.6 ± 44.2 a | 31.6 ± 24.5 a,b | 55.6 ± 36.8 a | 18.8 ± 7.1 a | 195.9 ± 231.4 a | 303.3 ± 201.9 a | 14.3 ± 10.5 a | |
| Islands | 11.0 ± 3.1 a | 135.1 ± 102.8 a,b | 26.3 ± 20.9 a | 253.9 ± 146.8 a | 22.9 ± 13.8 a | 70.4 ± 53.8 a | 23.5 ± 13.7 b | 30.6 ± 27.2 b | 20.5 ± 11 a | 201.7 ± 266.3 a | 354.0 ± 244.5 a | 12.5 ± 12.9 a | |
| BF | No | 12.1 ± 5.3 a | 133.5 ± 111.8 a | 24.2 ± 20.1 a | 247.0 ± 152.7 a | 26.8 ± 19.3 a | 69.7 ± 40.6 a | 35.2 ± 25.5 a | 48.4 ± 32.0 a | 19.6 ± 8.5 a | 188.0 ± 237.3 a | 416.9 ± 243.4 a | 16.2 ± 16.4 a |
| Yes | 12.3 ± 5.6 a | 128.8 ± 155.9 a | 22.9 ± 18.3 a | 219.2 ± 142.5 a | 24.9 ± 20.9 a | 63.5 ± 38.8 a | 31.0 ± 26.0 a | 42.9 ± 30.0 a | 21.5 ± 9.5 b | 170.9 ± 203.2 a | 184.0 ± 167.6 b | 12.4 ± 11.0 b | |
| BMI | −5 to −1 | 12.5 ± 6.2 a | 104.7 ± 96.3 a | 23.8 ± 17.8 a | 217.3 ± 141.0 a | 23.8 ± 17.1 a | 66.6 ± 40.0 a | 31.5 ± 21.9 a | 43.5 ± 30.3 a | 22.1 ± 8.8 a | 181.3 ± 249.5 a | 30.7 ± 238.6 a | 14.3 ± 10.5 a |
| −1 to 1 | 12.3 ± 5.5 a | 121.2 ± 102.3 a | 24.0 ± 19.3 a | 242.5 ± 154.4 a | 26.3 ± 19.9 a | 68.2 ± 39.9 a | 35.2 ± 27.6 a | 47.3 ± 31.9 a | 19.9 ± 8.9 a | 187.8 ± 225.7 a | 304.5 ± 251.0 a | 15.3 ± 16.6 a | |
| 1 to 2 | 11.5 ± 4.2 a | 155.0 ± 149.4 a,b | 23.5 ± 23.7 a | 219.4 ± 120.5 a | 26.6 ± 22.0 a | 62.9 ± 38.3 a | 28.5 ± 19.0 a | 46.7 ± 32.6 a | 21.5 ± 8.5 a | 163.3 ± 240.3 a | 383.6 ± 241.8 a | 15.4 ± 10.9 a | |
| > 2 | 10.9 ± 3.0 a | 250.6 ± 159.5 b | 20.5 ± 12.9 a | 270.0 ± 189.5 a | 33.1 ± 21.5 a | 87.8 ± 57.7 a | 35.6 ± 17.2 a | 36.6 ± 22.0 a | 16.5 ± 8.4 a | 213.2 ± 209.4 a | 320.6 ± 192.3 a | 13.9 ± 10.5 a | |
| (B) | |||||||||||||
| Total | 12.5 ± 5.3 | 107.8 ± 88.6 | 24.2 ± 19.0 | 177.5 ± 118.0 | 23.0 ± 16.8 | 75.4 ± 44.9 | 43.4 ± 25.5 | 45.4 ±29.4 | 22.7 ± 9.8 | 128.3 ± 192.7 | 356.1 ± 223.0 | 22.7 ± 24.5 | |
| Gender | Boys | 12.4 ± 5.5 a | 109.7 ± 90.0 a | 26.0 ± 21.3 a | 196.0 ± 121.0 a | 24.2 ± 16.2 a | 70.9 ± 37.9 a | 43.4 ± 26.8 a | 43.6 ± 28.1 a | 23.4 ± 9.9 a | 117.0 ± 174.1 a | 355.9 ± 238.0 a | 25.14 ± 28.5 a |
| Girls | 12.5 ± 5.1 a | 105.8 ± 87.4 a | 22.3 ± 16.0 a | 191.9 ± 94.0 a | 21.6 ± 17.3 a | 80.0 ± 50.7 a | 43.3 ± 24.2 a | 47.1 ±30.6 a | 22.0 ± 9.6 a | 140.4 ± 211.6 a | 356.4 ± 207.8 a | 20.2 ± 19.5 a | |
| Region | North | 12.4 ± 5.0 a | 113.2 ± 94.4 a | 25.7 ± 21.7 a | 198.0 ± 125.1 a,b,c | 24.3 ± 16.3 a | 75.5 ± 44.2 a | 47.0 ± 28.1 a | 46.0 ± 28.1 a | 23.0 ± 10.8 a,b | 148.7 ± 211.0 a | 339.2 ± 228.4 a | 22.3 ± 27.2 a |
| Central | 12.4 ± 5.3 a | 108.9 ± 90.8 a | 22.3 ± 17.0 a | 199.6 ± 95.8 a,b | 19.7 ± 13.2 a | 77.2 ± 41.9 a | 44.4 ± 25.4 a | 46.7 ± 29.5 a | 22.0 ± 8.6 a,b | 80.6 ± 134.6 a | 395.7 ± 228.6 a | 25.3 ± 24.8 a | |
| South | 11.8 ± 5.4 a | 82.6 ± 59.9 a | 24.8 ± 15.3 a | 159.9 ± 76.9 c | 25.01 ± 22.1 a | 86.3 ± 52.9 a | 41.1 ± 17.6 a | 46.6 ± 27.1 a | 20.1 ± 8.9 a | 109.8 ± 157.1 a | 350.0 ± 204.3 a | 21.2 ± 17.9 a | |
| Islands | 13.4 ± 7.0 a | 119.4 ± 89.3 a | 21.2 ± 16.3 a | 223.9 ± 96.7 b,d | 23.5 ± 17.6 a | 66.1 ± 40.3 a | 26.3 ±15.0 a | 35.4 ± 31.2 a | 26.8 ± 7.9 b | 202.0 ± 260.4 a | 335.9 ± 206.8 a | 20.3 ± 19.3 a | |
| BF | No | 12.3 ± 4.9 a | 108.7 ± 83.9 a | 24.7 ± 19.9 a | 196.2 ± 98.7 a | 24.5 ± 17.2 a | 73.3 ± 44.3 a | 45.4 ± 26.1 a | 48.4 ± 30.8 a | 22.12 ± 8.8 a | 133.4 ± 204.0 a | 414.8 ± 217.5 a | 24.3 ± 26.7 a |
| Yes | 12.7 ± 6.3 a | 104.4 ± 99.8 a | 22.9 ± 16.8 a | 188.8 ± 132.2 a | 19.4 ± 15.3 b | 79.7 ± 45.2 a | 38.1 ± 23.3 b | 37.5 ± 23.7 b | 23.9 ± 11.8 a | 100.4 ± 112.3 a | 198.0 ± 151.0 b | 18.3 ± 16.3 a | |
| BMI | −5 to −1 | 12.7 ± 5.5 a | 102.8 ± 78.2 a | 26.1 ± 14.0 a | 182.0 ± 143.9 a | 28.6 ± 22.1 a | 84.3 ± 46.1 a | 42.9 ± 24.7 a | 46.5 ± 31.0 a | 21.8 ± 8.8 a | 70.0 ± 95.0 a | 283.6 ± 200.3 a | 24.26 ± 20.6 a |
| −1 to 1 | 12.3 ± 5.0 a | 107.4 ± 87.7 a | 22.3 ± 17.8 a | 197.8 ± 98.2 a | 21.6 ± 16.0 a | 73.2 ± 45.2 a | 42.6 ± 23.5 a | 44.2 ± 28 9 a | 23.2 ± 10.3 a | 142.3 ± 206.8 a | 359.6 ± 226.1 a,b | 23.3 ± 24.7 a | |
| 1 to 2 | 12.6 ± 6.1 a | 119.0 ± 100.9 a | 30.0 ± 26.7 a | 191.3 ± 108.4 a | 22.0 ± 12.6 a | 78.2 ± 44.7 a | 48.7 ± 33.3 a | 51.4 ± 31.2 a | 22.1 ± 9.1 a | 98.1 ±169.3 a | 426.0 ±208.2 b | 18.3 ± 12.6 a | |
| > 2 | 13.6 ± 6.3 a | 91.6 ± 97.1 a | 23.5 ± 13.7 a | 204.0 ± 122.4 a | 26.3 ± 13.8 a | 64.5 ± 32.4 a | 36.0 ± 22.1 a | 36.5 ± 14.9 a | 21.1 ± 7.8 a | 238.0 ±270.4 a | 320.7 ± 247.2 a,b | 26.5 ± 28.9 a | |
| DRV | 18 Months (N 426) | DRV Compliance 18 Months (%) | 24 Months (N 336) | DRV Compliance 24 Months (%) | |||||||||
|---|---|---|---|---|---|---|---|---|---|---|---|---|---|
| AI | AR | RI | P25 | Mean ± SD | P75 | >AI | <AR | P25 | Mean ± SD | P75 | >AI | <AR | |
| Energy (kcal/day) | - | - | - | 899.4 | 1093.4 ± 291.7 | 1279.9 | - | - | 890.6 | 1094.2 ± 291.0 | 1281.8 | - | - |
| Macronutrients | - | - | - | - | |||||||||
| Fat (g/day) (kcal) (%) | - | - | 35–40% | 28.8 | 37.3 ± 11.5 (30.7) | 44.6 | - | - | 30.2 | 38.3 ± 11.4 (31.5) | 45.6 | - | - |
| Saturated fatty acids (g/day) | ALAP | - | - | 6.0 | 14.4 ± 9.2 | 21.3 | - | - | 8.3 | 15.5 ± 8.5 | 21.3 | - | - |
| Monounsaturated fatty acids (g/day) | - | - | - | 11.7 | 16.5 ± 6.1 | 19.6 | - | - | 13.3 | 17.7 ± 5.8 * | 20.9 | - | - |
| Polyunsaturated fatty acids (g/day) | - | - | - | 3.7 | 4.8 ± 1.2 | 5.7 | - | - | 4.0 | 5 ± 1.5 | 6.2 | - | - |
| ALA (g/day) | - | - | 0.5 | 0.02 | 0.05 ± 0.05 | 0.06 | - | - | 0.02 | 0.05 ± 0.05 | 0.06 | - | - |
| LA (g/day) | - | - | 4 | 2.8 | 3.8 ± 1.2 | 4.5 | - | - | 3.1 | 3.9 ± 1.2 | 4.6 | - | - |
| Carbohydrate (g/day) (kcal) (%) | - | - | 45–60% | 107.6 | 138.2 ± 43.9 (50.6) | 163.14 | - | - | 105.3 | 136.2 ± 43.8 (49.8) | 160.3 | - | - |
| Dietary fiber (g/day) | 10 | 11.7 | 15.9 ± 5.7 | 19.0 | 85 | 10.7 | 14.5 ± 5.5 * | 17.4 | 81 | ||||
| Protein (g/day) (kcal) (%) | - | - | - | 40.0 | 50.3 ± 15.9 (18.4) | 60.2 | - | - | 39.9 | 50.4 ± 15.9 (18.4) | 60.4 | - | - |
| Animal protein (g/day) | - | - | - | 21.6 | 31.4 ± 13.5 | 38.9 | - | - | 23.3 | 32.2 ± 12.6 | 40.6 | - | - |
| Vegetal protein (g/day) | - | - | - | 11.7 | 16.2 ± 6.6 | 19.5 | - | - | 11.4 | 16.4 ± 6.7 | 20.0 | - | - |
| Micronutrients | |||||||||||||
| Vitamin A (μg RAE/day) | - | 205 | - | 431.6 | 796.7 ± 478.5 | 990.6 | - | 5.4 | 369.9 | 684.7 ± 466.9 * | 834.9 | - | 6.2 |
| Thiamin (mg/day) | - | 0.072 | - | 0.8 | 1.0 ± 0.3 | 1.2 | - | 0 | 0.7 | 0.9 ± 0.3 * | 1.1 | - | 0 |
| Riboflavin (mg/day) | - | 0.5 | - | 1.0 | 1.4 ± 0.6 | 1.7 | - | 3.8 | 0.9 | 1.3 ± 0.5 | 1.7 | - | 3.6 |
| Niacin (mg/day) | - | 1.3 | - | 8.8 | 12.3 ± 4.7 | 14.8 | - | 0.2 | 8.6 | 11.5 ± 4.2 * | 13.9 | - | 0 |
| Vitamin B-6 (mg/day) | - | 0.5 | - | 1.2 | 1.6 ± 0.5 | 1.9 | - | 1.2 | 1.1 | 1.4 ± 0.5 * | 1.7 | - | 0.3 |
| Folate (μg DFE/day) | - | 90 | - | 357.8 | 555.3 ± 279.5 | 698.37 | - | 0.2 | 343.4 | 496.9 ± 222.0 * | 632.5 | - | 0.3 |
| Vitamin B-12 (μg/day) | 1.5 | - | 1.9 | 2.74 ± 1.3 | 3.4 | 85.2 | - | 1.9 | 2.8 ± 1.3 | 3.7 | 84.2 | - | |
| Vitamin C (mg/day) | 15 | - | 78.6 | 125.5 ± 63.9 | 159.2 | - | 0 | 64.8 | 109.3 ± 59.7 * | 137.8 | - | 0.3 | |
| Vitamin D (μg/day) | 15 | - | - | 0.7 | 2.9 ± 2.9 | 3.7 | 0.7 | - | 0.7 | 2.1 ± 2.3 * | 2.7 | 0 | - |
| Vitamin E (mg/day) | 6 | - | - | 4.2 | 6.2 ± 4.0 | 7.0 | 38.7 | - | 3.9 | 5.4 ± 3.0 * | 6.0 | 25.6 | - |
| Calcium (mg/day) | - | 390 | - | 440.9 | 665.3 ± 294.5 | 862.2 | - | 20.2 | 418.7 | 643.5 ± 281.4 | 846.6 | - | 22 |
| Phosphorus (mg/day) | 250 | - | - | 672.5 | 889.5 ± 306.4 | 1088.5 | 99.1 | - | 661.4 | 871.7 ± 285.8 | 1071.8 | 99.4 | - |
| Iron (mg/day) | - | 5 | - | 6.0 | 8.4 ± 3.2 | 10.3 | 12.2 | 5.6 | 7.6 ± 2.7 * | 9.0 | - | 15.8 | |
| Magnesium (mg/day) | 170 | - | - | 162.8 | 210.4 ± 68.5 | 256.3 | 70.9 | - | 160.9 | 199.9 ± 60.7 * | 235.7 | 67.9 | - |
| Manganese (mg/day) | 0.5 | - | - | 1.6 | 2.4 ± 1.0 | 2.9 | 99.8 | - | 1.6 | 2.2 ± 0.9 * | 2.7 | 99.7 | - |
| Zinc (mg/day) | - | 3.6 | - | 4.7 | 7.0 ± 3.0 | 9.1 | - | 11.7 | 5.1 | 6.9 ± 2.6 | 8.6 | - | 8.9 |
| 18 Months | 24 Months | |||||
|---|---|---|---|---|---|---|
| Bioactive Compounds | Mean ± SD | P25 | P75 | Mean ± SD | P25 | P75 |
| Total phenols (mg/day) | 659.4 ± 335.0 | 436.4 | 830.0 | 654.2 ± 322.5 | 432.0 | 842.8 |
| Total (poly)phenols (mg/day) 1 | 153.7 ± 84.1 | 97.3 | 195.4 | 151.0 ± 81.7 | 97.6 | 188.2 |
| Flavonoids (mg/day) | 109.2 ± 67.2 | 62.3 | 142.3 | 104.9 ± 61.4 | 63.4 | 134.3 |
| Anthocyanins | 23.9 ± 23.1 | 8.6 | 29.5 | 25.3 ± 28.6 | 6.7 | 3.7 |
| Dihydrochalcones | 1.7 ± 1.0 | 1.1 | 1.7 | 1.8 ± 1.0 | 1.1 | 2.2 |
| Flavanols | 42.2 ± 31.9 | 17.3 | 55.9 | 42.8 ± 31.0 | 20.7 | 56.5 |
| Flavanones | 27.9 ± 25.3 | 6.8 | 38.3 | 27.8 ± 25.4 | 4.0 | 41.7 |
| Flavones | 0.6 ± 0.8 | 0.2 | 0.7 | 0.5 ± 0.8 | 0.1 | 0.5 |
| Flavonols | 19.0 ± 26.8 | 7.1 | 20.3 | 14.0 ± 11.0 * | 7.2 | 17.8 |
| Isoflavanoids | 0.7 ± 2 | 0.08 | 0.6 | 0.8 ± 2.9 | 0.1 | 0.6 |
| Phenolic acids (mg/day) | 40.9 ± 21.9 | 26.2 | 53.5 | 42.0 ± 23.0 | 25.8 | 53.7 |
| Lignans (mg/day) | 0.1 ± 0.2 | 0.02 | 0.3 | 0.1 ± 0.2 | 0.02 | 0.3 |
| Non-phenolic metabolites (mg/day) | 1.7 ± 0.7 | 1.2 | 2.1 | 1.8 ± 0.7 | 1.3 | 2.3 |
| Other polyphenols (mg/day) | 4.3 ± 2.5 | 3.3 | 4.9 | 4.8 ± 2.8 | 3.3 | 6.8 |
| Dietary fiber (g/day) | 15.7 ± 5.7 | 11.7 | 19.0 | 14.5 ± 5.5 * | 10.7 | 17.4 |
| Insoluble | 10.4 ± 4.3 | 7.4 | 12.7 | 9.3 ± 4.03 * | 6.4 | 11.5 |
| Soluble | 2.1 ± 1.0 | 1.5 | 2.5 | 1.9 ± 0.9 * | 1.3 | 2.2 |
Publisher’s Note: MDPI stays neutral with regard to jurisdictional claims in published maps and institutional affiliations. |
© 2021 by the authors. Licensee MDPI, Basel, Switzerland. This article is an open access article distributed under the terms and conditions of the Creative Commons Attribution (CC BY) license (http://creativecommons.org/licenses/by/4.0/).
Share and Cite
Gómez-Martín, M.; Domínguez, B.; Gueimonde, M.; González, S. Identification of Nutritional Targets in Spanish Children Belonging to the LAyDI Cohort for the Development of Health Promotion Strategies in the First Two Years of Life. Int. J. Environ. Res. Public Health 2021, 18, 939. https://0-doi-org.brum.beds.ac.uk/10.3390/ijerph18030939
Gómez-Martín M, Domínguez B, Gueimonde M, González S. Identification of Nutritional Targets in Spanish Children Belonging to the LAyDI Cohort for the Development of Health Promotion Strategies in the First Two Years of Life. International Journal of Environmental Research and Public Health. 2021; 18(3):939. https://0-doi-org.brum.beds.ac.uk/10.3390/ijerph18030939
Chicago/Turabian StyleGómez-Martín, María, Begoña Domínguez, Miguel Gueimonde, and Sonia González. 2021. "Identification of Nutritional Targets in Spanish Children Belonging to the LAyDI Cohort for the Development of Health Promotion Strategies in the First Two Years of Life" International Journal of Environmental Research and Public Health 18, no. 3: 939. https://0-doi-org.brum.beds.ac.uk/10.3390/ijerph18030939