
The Role of Societal Aspects in the Formation of Official COVID-19 Reports: A Data-Driven Analysis

 , , and
Abstract
:1. Introduction
2. Data and Methodology
2.1. Joint Dataset of GovData360, TCdata360, and COVID-19 Reports
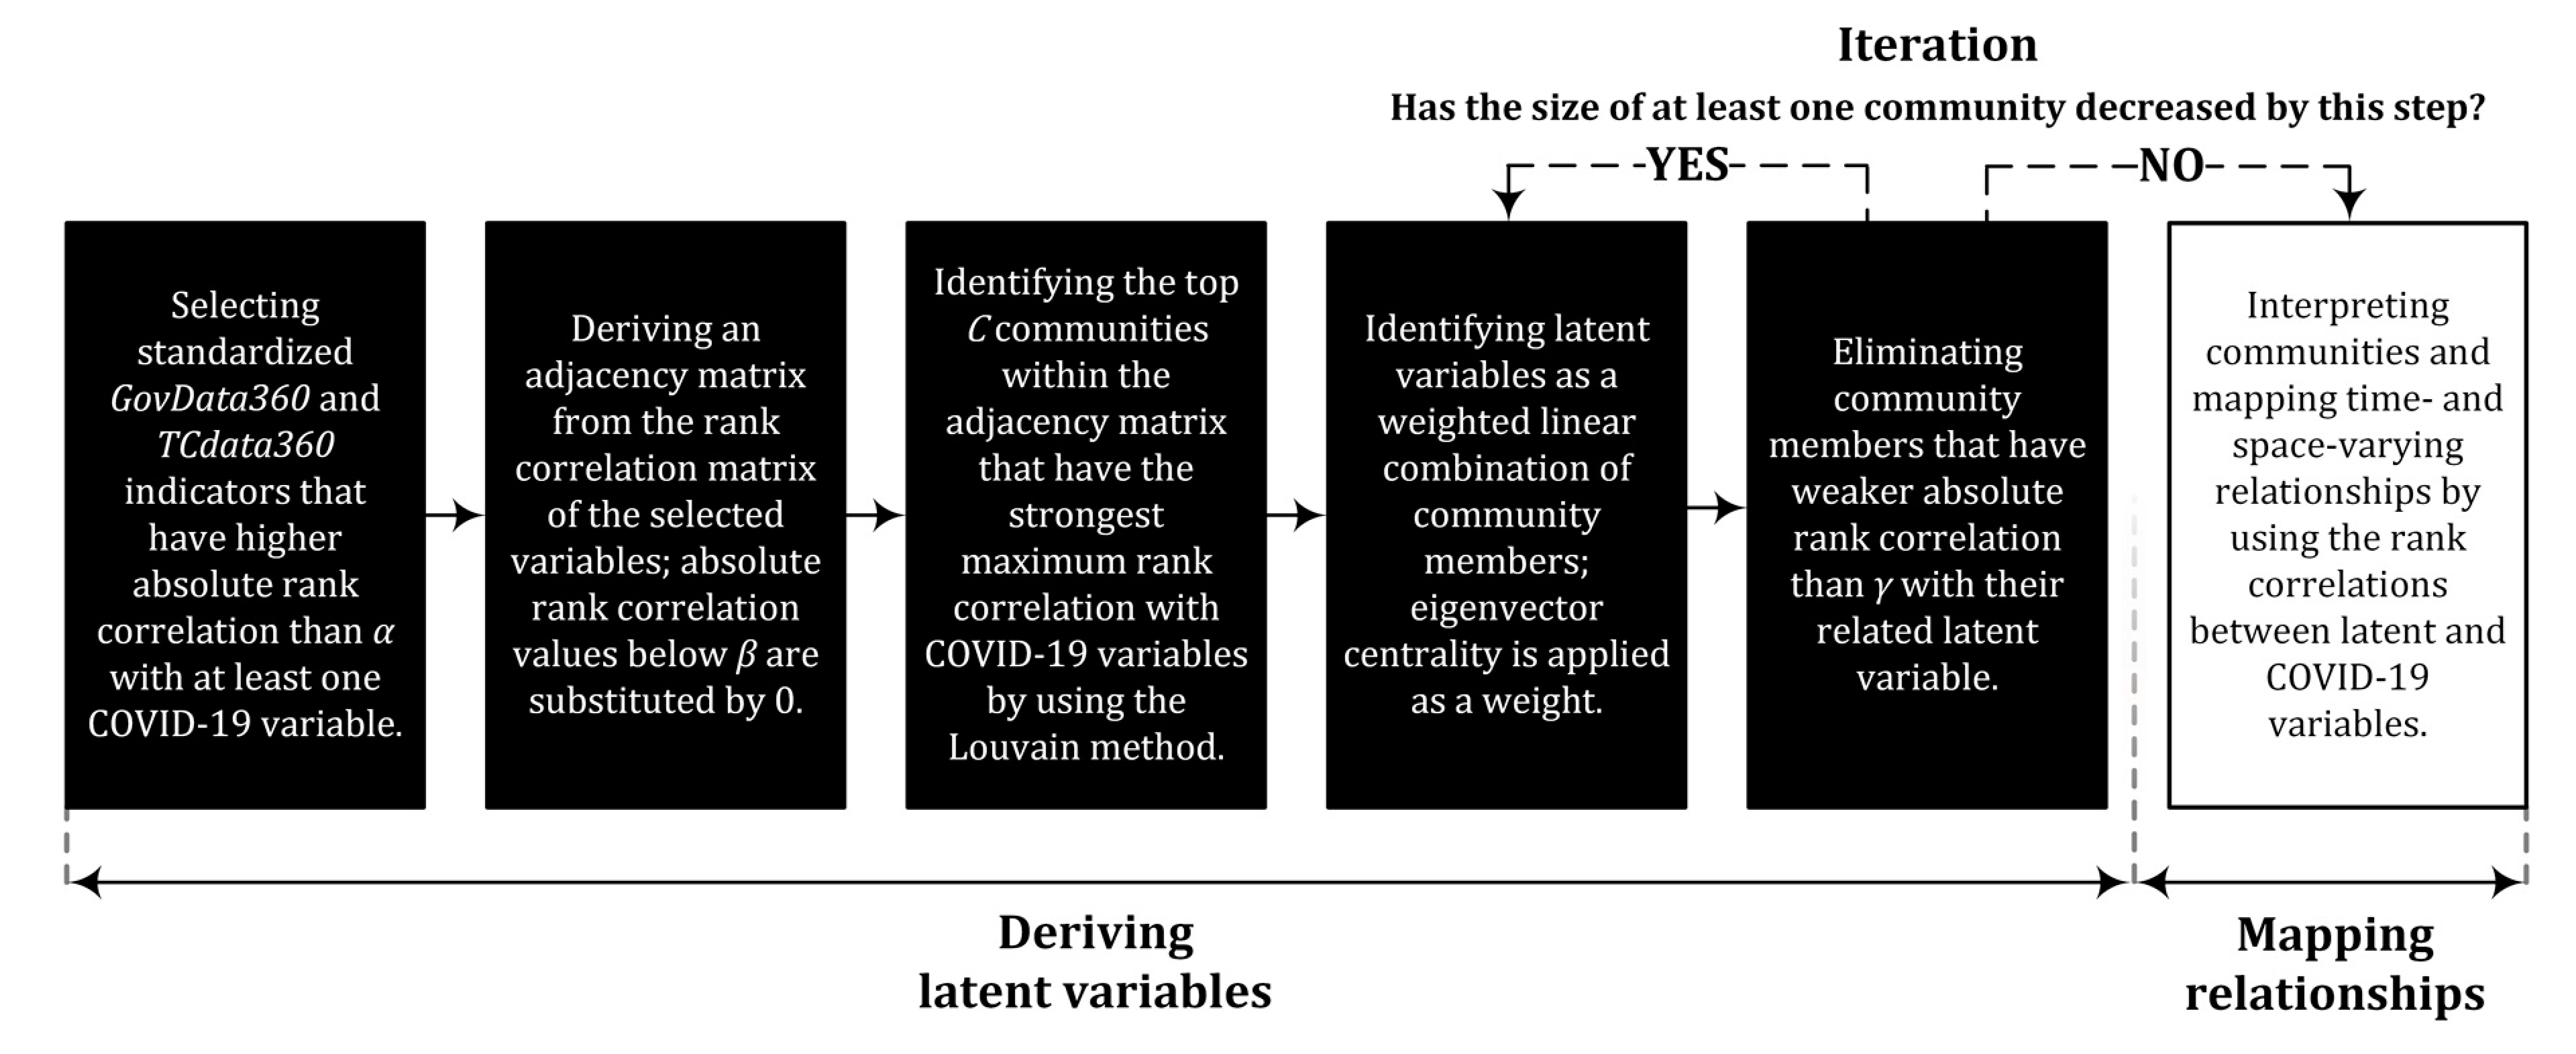
2.2. Community-Based Model Reduction
3. Results and Discussion
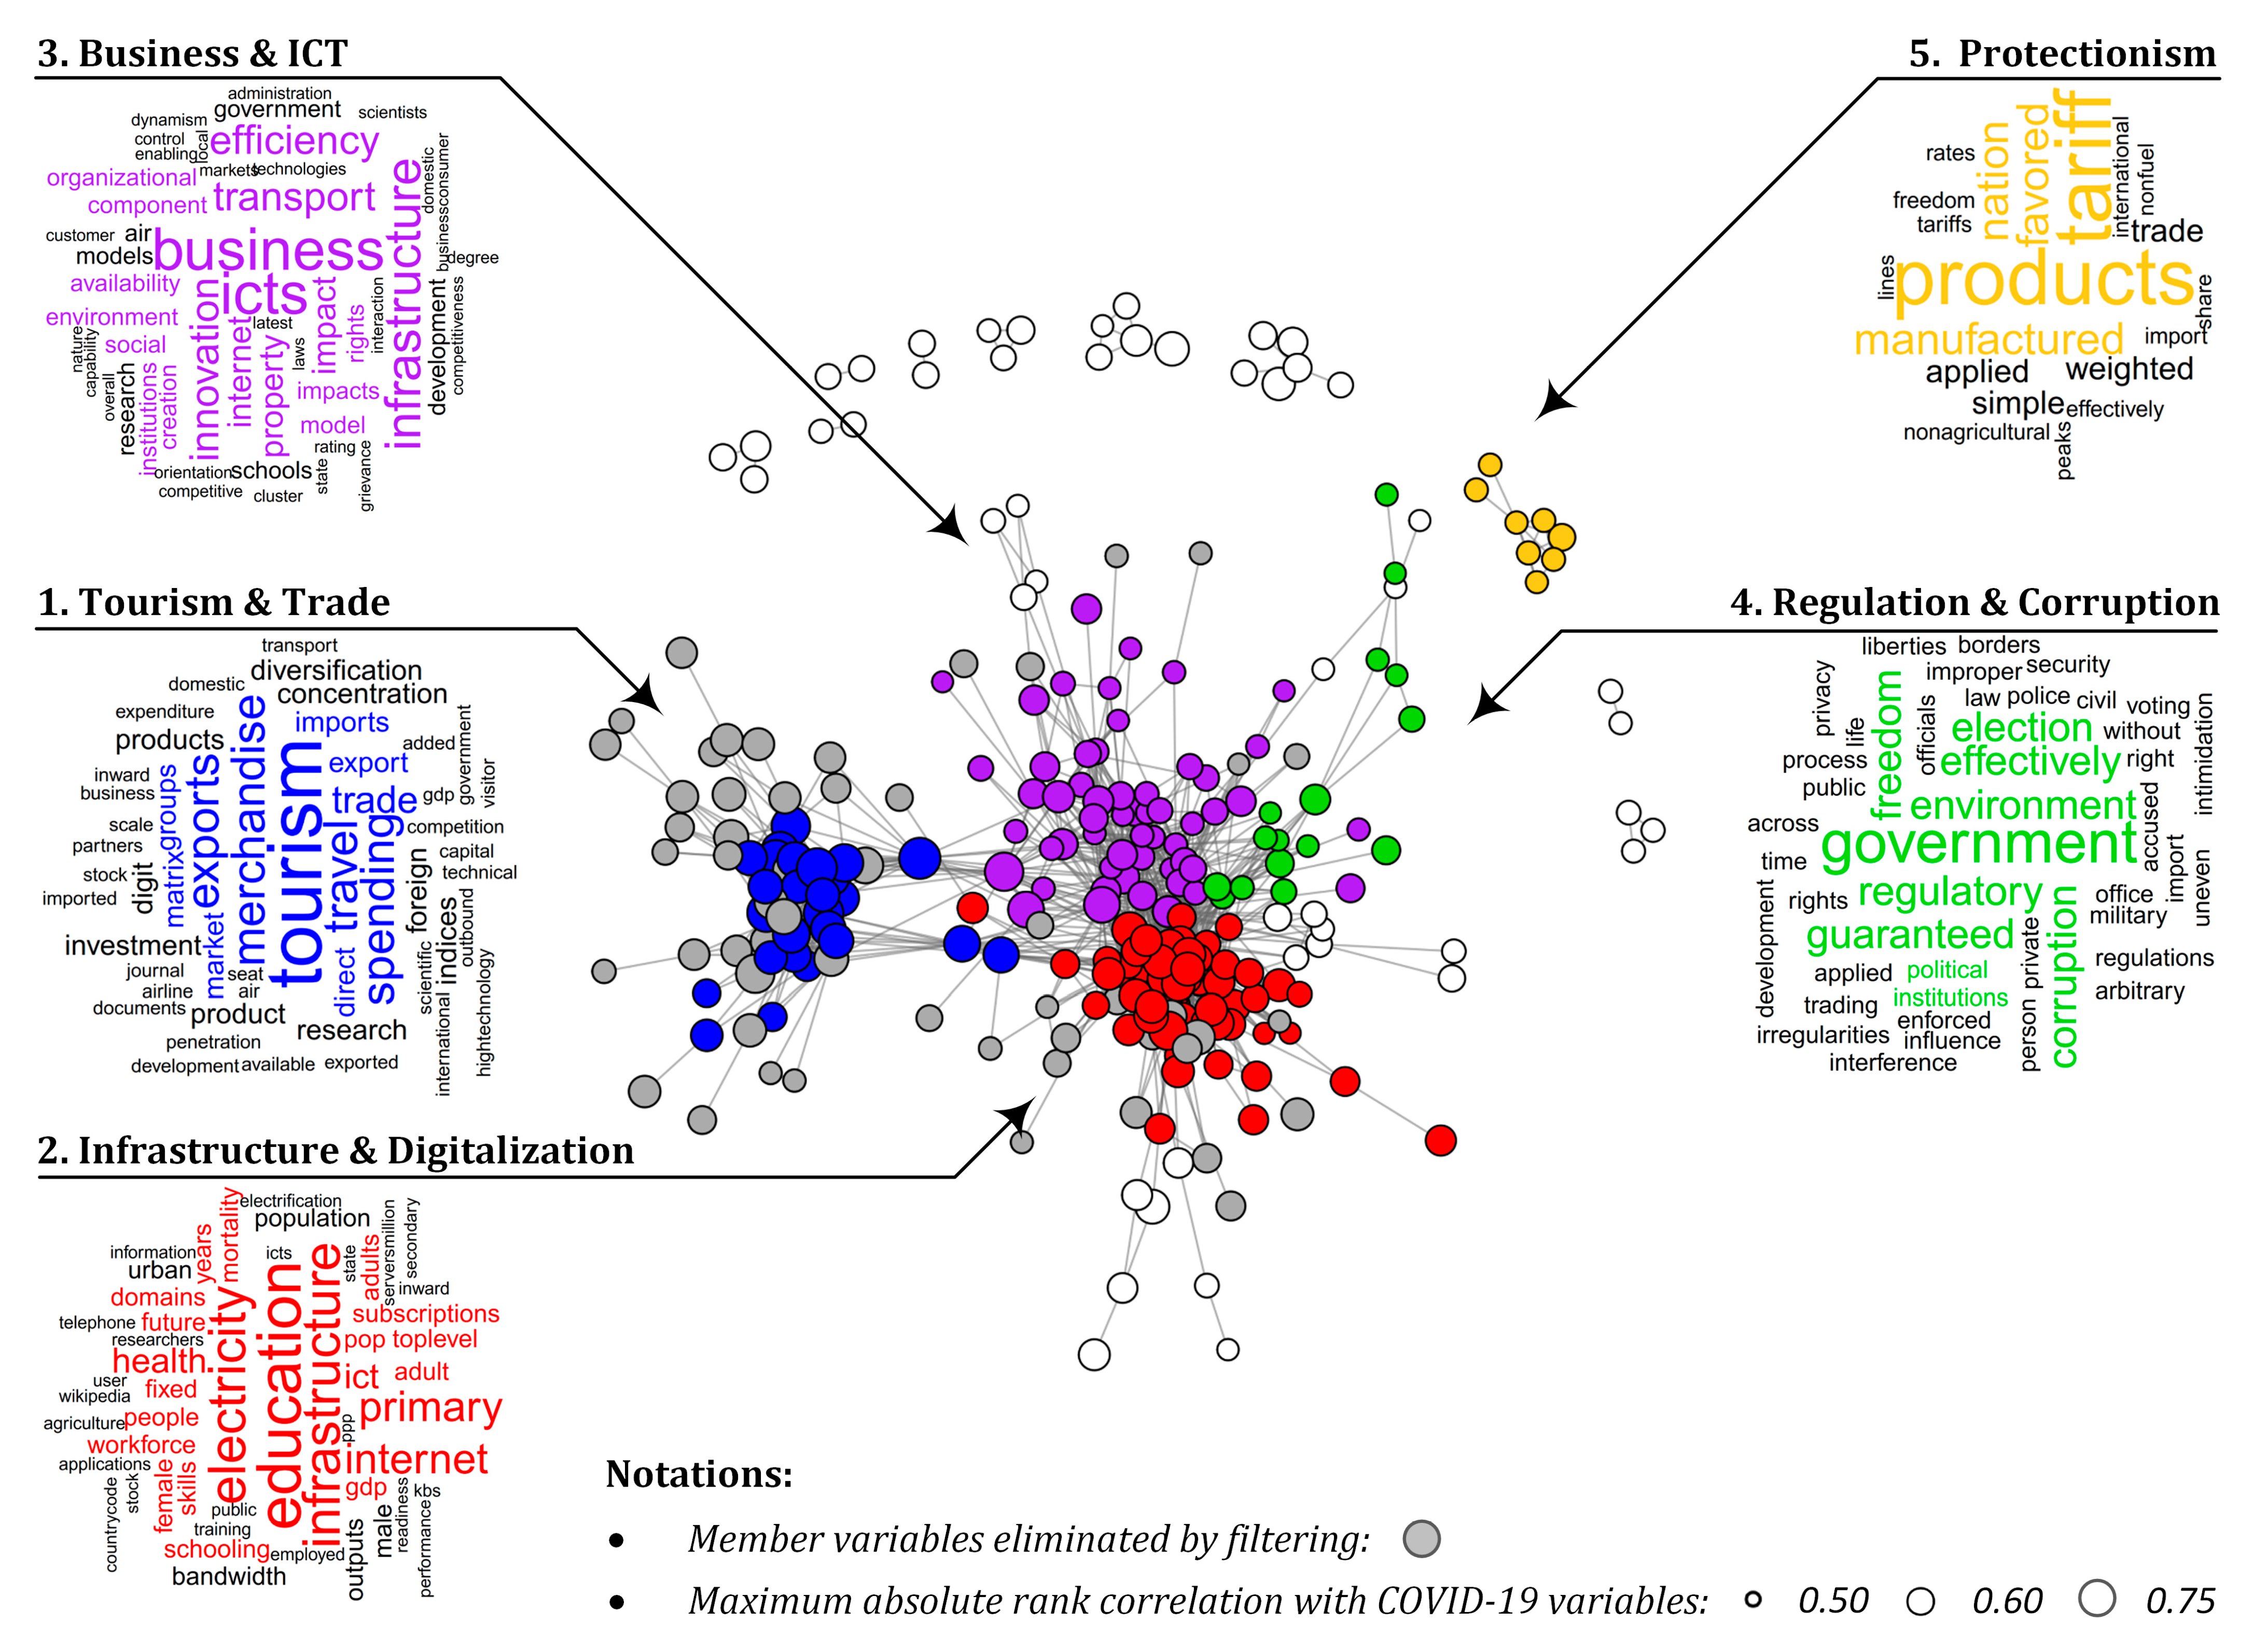
3.1. Topics Most Related to COVID-19 Reports
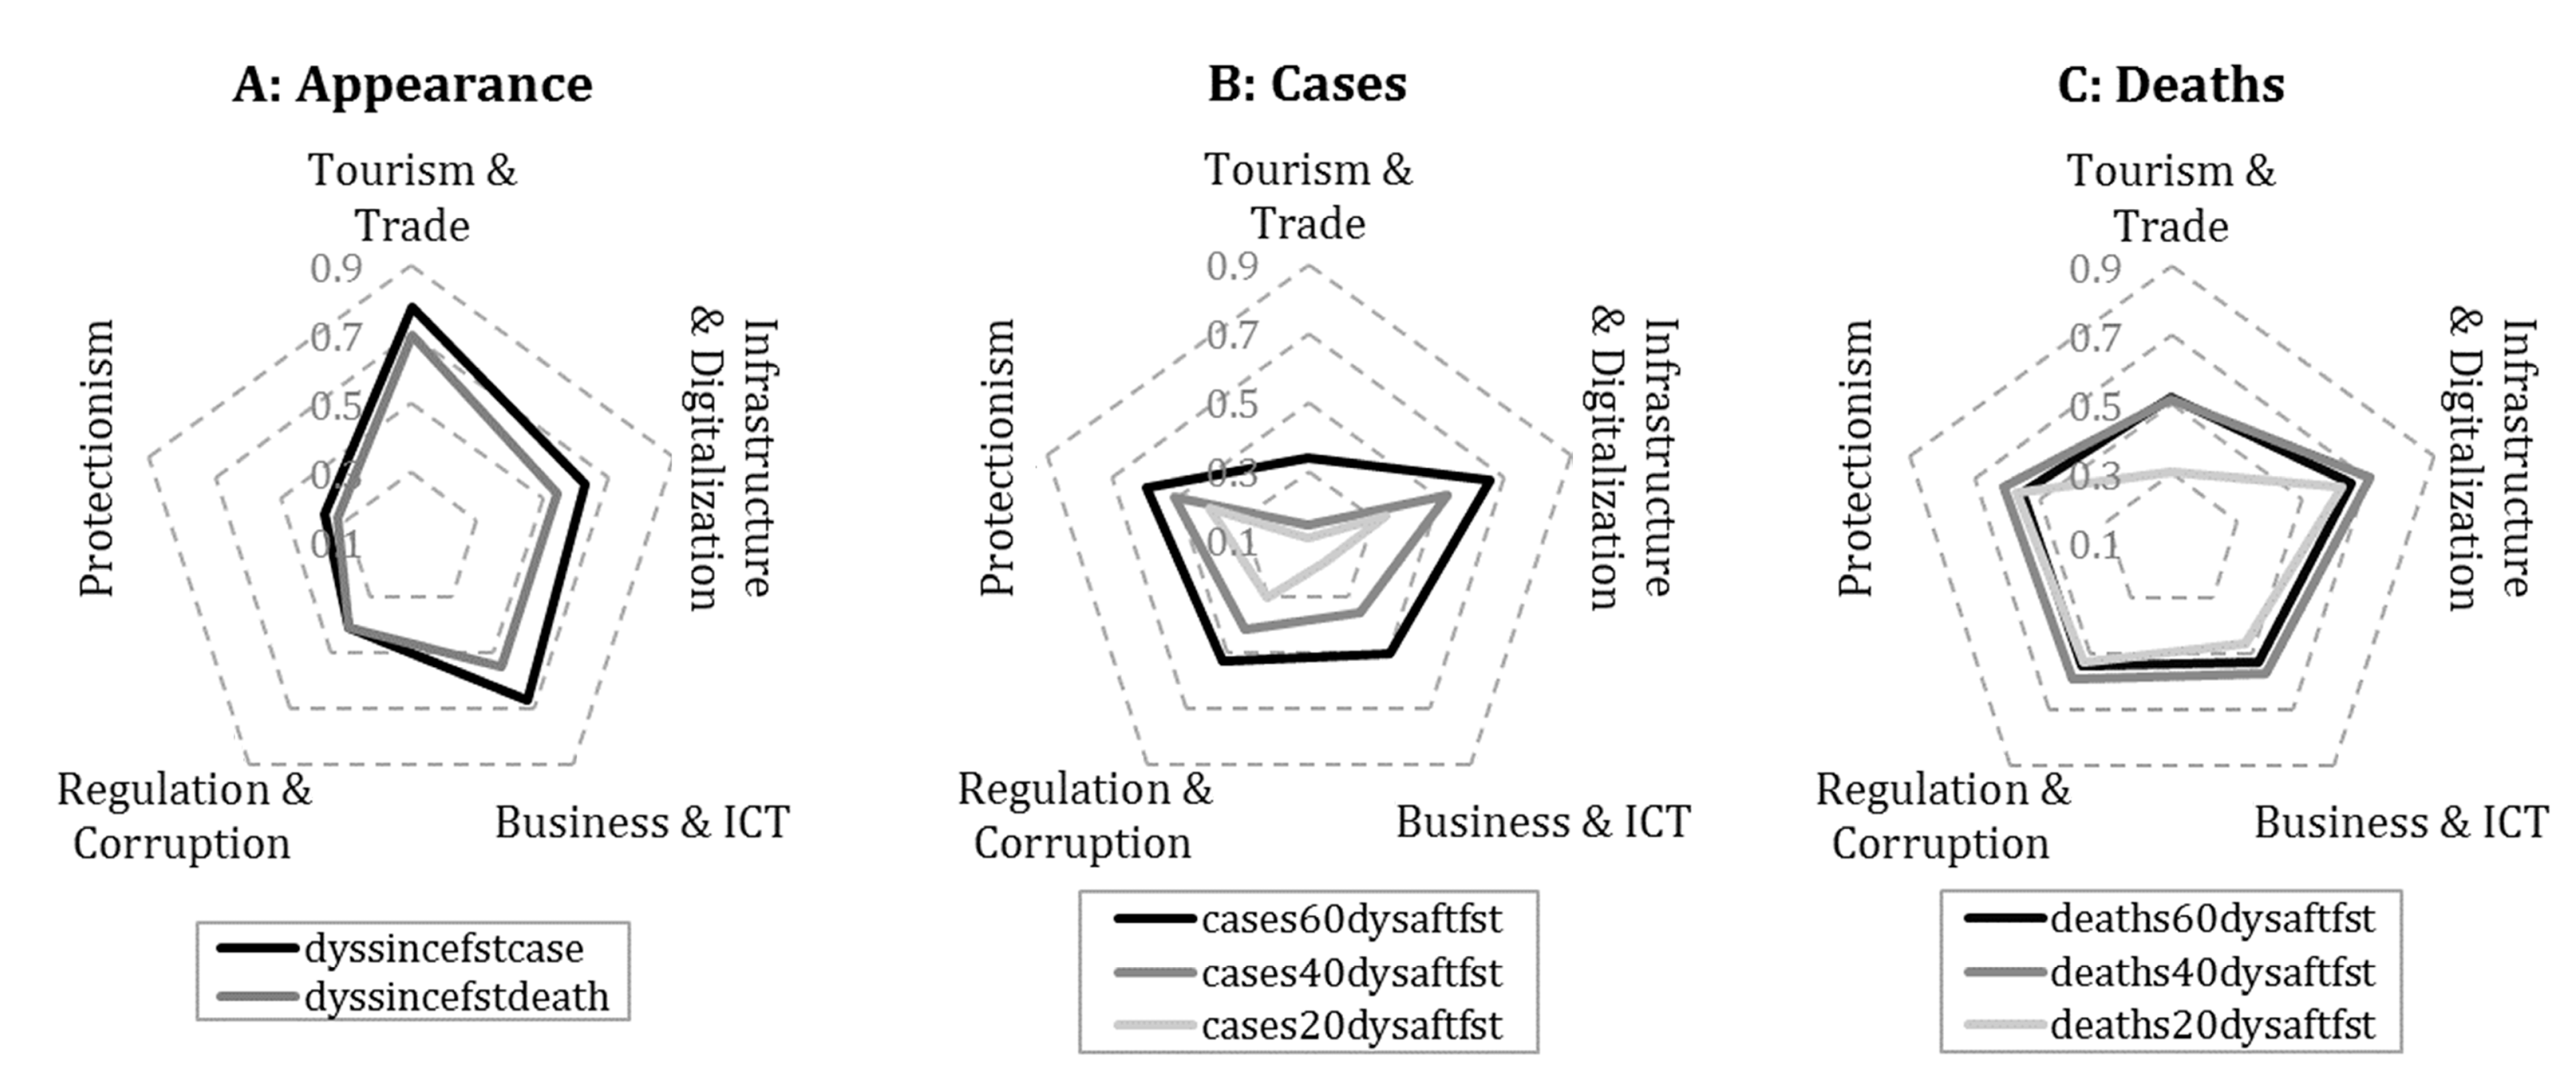
3.2. Relations with COVID-19 Reports
3.3. Regional Differences
4. Measurement Error Analysis
5. Conclusions and Future Work
Supplementary Materials
Author Contributions
Funding
Institutional Review Board Statement
Informed Consent Statement
Data Availability Statement
Conflicts of Interest
Appendix A. Standalone Correlations

| Name | Type | dyssincefstcase | cases20dysaftfst | cases40dysaftfst | cases60dysaftfst | dyssincefstdeath | deaths20dysaftfst | deaths40dysaftfst | deaths60dysaftfst |
|---|---|---|---|---|---|---|---|---|---|
| Trade, competition, & market scale | rank * | 0.69 | −0.15 | 0.07 | 0.28 | 0.68 | 0.19 | 0.42 | 0.43 |
| Scientific and technical journal articles | value | 0.77 | −0.19 | 0.07 | 0.25 | 0.69 | 0.20 | 0.43 | 0.44 |
| Travel and Tourism direct contribution to GDP | usd nominal | 0.75 | −0.28 | −0.04 | 0.15 | 0.66 | 0.08 | 0.32 | 0.35 |
| Outbound Travel & Tourism Expenditure | usd nominal | 0.78 | −0.19 | 0.04 | 0.25 | 0.70 | 0.18 | 0.41 | 0.44 |
| Index Of Export Market Penetration | value | 0.74 | −0.19 | 0.06 | 0.27 | 0.71 | 0.30 | 0.51 | 0.53 |
| Merchandise: Trade matrix by product groups, imports | value | 0.76 | −0.27 | −0.01 | 0.20 | 0.67 | 0.16 | 0.40 | 0.41 |
| Government spending on travel and Tourism service | usd nominal | 0.67 | −0.18 | 0.05 | 0.23 | 0.68 | 0.17 | 0.41 | 0.42 |
| Capital investment in Travel and Tourism | usd real | 0.71 | −0.21 | −0.03 | 0.15 | 0.62 | 0.09 | 0.32 | 0.35 |
| Services, etc., value added (current US$) | value | 0.70 | −0.27 | −0.02 | 0.17 | 0.66 | 0.08 | 0.33 | 0.36 |
| Business Tourism Spending | usd_nominal | 0.74 | −0.29 | −0.06 | 0.15 | 0.64 | 0.08 | 0.32 | 0.37 |
| Number of export partners | value | 0.71 | −0.15 | 0.08 | 0.29 | 0.66 | 0.32 | 0.51 | 0.53 |
| Foreign Direct Investment: Inward stock | percentage of world | 0.69 | −0.14 | 0.09 | 0.28 | 0.65 | 0.20 | 0.42 | 0.45 |
| Domestic Tourism Spending | usd nominal | 0.70 | −0.36 | −0.12 | 0.08 | 0.63 | 0.04 | 0.29 | 0.34 |
| Available airline seat | rank * | 0.76 | −0.22 | 0.00 | 0.20 | 0.64 | 0.11 | 0.33 | 0.35 |
| High-technology exports (current US$) | value | 0.69 | −0.14 | 0.08 | 0.27 | 0.63 | 0.25 | 0.45 | 0.45 |
| Visitor Exports (Foreign spending) | usd real | 0.74 | −0.11 | 0.10 | 0.27 | 0.66 | 0.23 | 0.42 | 0.43 |
| No. Of Imported HS6 Digit Products | value | 0.68 | −0.17 | 0.06 | 0.27 | 0.66 | 0.29 | 0.50 | 0.51 |
| Citable documents H index | rank * | 0.71 | −0.19 | 0.06 | 0.25 | 0.67 | 0.25 | 0.47 | 0.49 |
| No. Of Exported HS6 Digit Products | value | 0.65 | −0.13 | 0.10 | 0.30 | 0.64 | 0.32 | 0.51 | 0.52 |
| GCI 4.0: Air transport | score | 0.79 | −0.07 | 0.16 | 0.35 | 0.66 | 0.28 | 0.47 | 0.46 |
| International tourism, number of arrivals | value | 0.72 | −0.16 | 0.05 | 0.24 | 0.64 | 0.18 | 0.40 | 0.43 |
| Research and development (R&D) | rank * | 0.72 | 0.01 | 0.23 | 0.39 | 0.65 | 0.36 | 0.53 | 0.51 |
| GCI 4.0: Research | rank * | 0.72 | 0.03 | 0.26 | 0.42 | 0.62 | 0.37 | 0.55 | 0.54 |
| Merchandise: Concentration and diversification indices of exports by country | diversification index * | 0.63 | −0.04 | 0.18 | 0.34 | 0.60 | 0.39 | 0.56 | 0.53 |
| Merchandise: Trade matrix by product groups, exports | value | 0.62 | −0.28 | −0.06 | 0.12 | 0.56 | 0.09 | 0.32 | 0.34 |
| Merchandise: Concentration and diversification indices of imports by country | diversification index * | 0.67 | 0.00 | 0.23 | 0.42 | 0.64 | 0.38 | 0.57 | 0.58 |
| Name | Type | dyssincefstcase | cases20dysaftfst | cases40dysaftfst | cases60dysaftfst | dyssincefstdeath | deaths20dysaftfst | deaths40dysaftfst | deaths60dysaftfst |
|---|---|---|---|---|---|---|---|---|---|
| Public Services | score * | 0.59 | 0.38 | 0.53 | 0.65 | 0.49 | 0.60 | 0.67 | 0.61 |
| ICT access | rank * | 0.59 | 0.38 | 0.54 | 0.65 | 0.51 | 0.63 | 0.69 | 0.62 |
| Country rank and value in the UNCTAD B2C E-commerce Index | rank * | 0.61 | 0.30 | 0.46 | 0.59 | 0.52 | 0.59 | 0.67 | 0.61 |
| 3rd pillar: Infrastructure | rank * | 0.56 | 0.33 | 0.49 | 0.62 | 0.50 | 0.60 | 0.69 | 0.64 |
| Secure Internet servers/million pop. | rank * | 0.53 | 0.38 | 0.52 | 0.64 | 0.48 | 0.63 | 0.69 | 0.65 |
| Fixed broadband subscriptions (per 100 people) | value | 0.56 | 0.30 | 0.50 | 0.61 | 0.53 | 0.61 | 0.71 | 0.66 |
| GCI 4.0: Exposure to unsafe drinking water | score * | −0.57 | −0.34 | −0.53 | −0.66 | −0.53 | −0.64 | −0.72 | −0.68 |
| GCI 4.0: 6.B Future workforce | score | 0.59 | 0.33 | 0.51 | 0.64 | 0.52 | 0.59 | 0.67 | 0.60 |
| B. Readiness subindex | value | 0.61 | 0.30 | 0.49 | 0.62 | 0.51 | 0.60 | 0.69 | 0.63 |
| B. Electricity and telephony infrastructure | rank * | 0.56 | 0.35 | 0.50 | 0.62 | 0.50 | 0.58 | 0.66 | 0.61 |
| 5th pillar Higher education and training | value | 0.61 | 0.28 | 0.45 | 0.57 | 0.60 | 0.54 | 0.64 | 0.57 |
| GDP per person employed (constant 2011 PPP $) | value | 0.60 | 0.33 | 0.50 | 0.64 | 0.55 | 0.59 | 0.69 | 0.65 |
| Infrastructure | rank * | 0.65 | 0.24 | 0.44 | 0.59 | 0.57 | 0.52 | 0.64 | 0.60 |
| Information and communication technologies (ICTs) | score (0–100) | 0.67 | 0.19 | 0.40 | 0.56 | 0.60 | 0.50 | 0.62 | 0.58 |
| GCI 4.0: International co-inventions | score | 0.61 | 0.27 | 0.44 | 0.56 | 0.54 | 0.55 | 0.64 | 0.59 |
| GCI 4.0: Pillar 2: Infrastructure | rank * | 0.71 | 0.20 | 0.43 | 0.59 | 0.61 | 0.54 | 0.66 | 0.62 |
| 5th pillar: Skills | value | 0.58 | 0.32 | 0.47 | 0.59 | 0.51 | 0.57 | 0.63 | 0.56 |
| GNI per capita (constant 2010 US$) | value | 0.57 | 0.33 | 0.48 | 0.64 | 0.54 | 0.60 | 0.70 | 0.66 |
| 4th pillar Health and primary education | value | 0.60 | 0.29 | 0.45 | 0.57 | 0.52 | 0.56 | 0.61 | 0.53 |
| GCI 4.0: Internet users | rank * | 0.62 | 0.33 | 0.50 | 0.63 | 0.50 | 0.60 | 0.66 | 0.61 |
| Wikipedia monthly edits | value | 0.50 | 0.34 | 0.54 | 0.67 | 0.51 | 0.69 | 0.75 | 0.71 |
| GCI 4.0: Pillar 3: ICT adoption | rank * | 0.61 | 0.30 | 0.44 | 0.56 | 0.44 | 0.53 | 0.59 | 0.53 |
| ICT PCT patents, applications/million pop. | rank * | 0.62 | 0.18 | 0.38 | 0.51 | 0.53 | 0.50 | 0.61 | 0.56 |
| GCI 4.0: Electricity infrastructure | rank * | 0.65 | 0.28 | 0.46 | 0.56 | 0.52 | 0.52 | 0.57 | 0.50 |
| Online creativity | score (0–100) | 0.51 | 0.33 | 0.50 | 0.60 | 0.46 | 0.62 | 0.70 | 0.65 |
| Researchers | rank * | 0.63 | 0.14 | 0.37 | 0.52 | 0.53 | 0.57 | 0.67 | 0.61 |
| Mortality rate, adult, female (per 1000 female adults) | value | −0.65 | −0.35 | −0.53 | −0.65 | −0.55 | −0.60 | −0.66 | −0.61 |
| Human capital and research | score (0–100) | 0.62 | 0.18 | 0.35 | 0.50 | 0.54 | 0.49 | 0.61 | 0.56 |
| Quality of electricity supply | 1–7 best | 0.57 | 0.28 | 0.42 | 0.55 | 0.50 | 0.53 | 0.62 | 0.58 |
| Legitimacy of the State | score * | 0.61 | 0.21 | 0.40 | 0.54 | 0.50 | 0.50 | 0.61 | 0.58 |
| GCI 4.0: Mean years of schooling | rank * | 0.50 | 0.34 | 0.48 | 0.57 | 0.44 | 0.54 | 0.61 | 0.55 |
| GCI 4.0: Trademark applications | score | 0.53 | 0.36 | 0.53 | 0.63 | 0.50 | 0.60 | 0.68 | 0.64 |
| Generic top-level domains (gTLDs) | score (0–100) | 0.49 | 0.33 | 0.48 | 0.59 | 0.51 | 0.58 | 0.68 | 0.63 |
| Foreign Direct Investment: Inward stock | usd per capita | 0.42 | 0.43 | 0.54 | 0.63 | 0.37 | 0.60 | 0.63 | 0.58 |
| GCI 4.0: Skills of future workforce | rank * | 0.57 | 0.32 | 0.48 | 0.60 | 0.48 | 0.55 | 0.60 | 0.52 |
| Int’l Internet bandwidth, kb/s per user | value | 0.48 | 0.38 | 0.53 | 0.65 | 0.47 | 0.62 | 0.70 | 0.67 |
| GCI 4.0: Electrification rate | rank * | 0.57 | 0.35 | 0.53 | 0.61 | 0.50 | 0.60 | 0.66 | 0.59 |
| Secondary education gross enrollment rate, % | rank * | 0.52 | 0.31 | 0.52 | 0.65 | 0.52 | 0.59 | 0.67 | 0.63 |
| Mean years of schooling | scale (0 to 1) | 0.49 | 0.29 | 0.45 | 0.57 | 0.47 | 0.54 | 0.62 | 0.56 |
| Fixed telephone subscriptions (per 100 people) | value | 0.48 | 0.36 | 0.52 | 0.62 | 0.51 | 0.60 | 0.67 | 0.63 |
| Internet bandwidth | rank * | 0.46 | 0.43 | 0.54 | 0.62 | 0.40 | 0.62 | 0.66 | 0.61 |
| Self-employed, total (% of total employment) | percent | −0.50 | −0.35 | −0.46 | −0.60 | −0.40 | −0.56 | −0.63 | −0.60 |
| School life expectancy | rank * | 0.50 | 0.25 | 0.45 | 0.58 | 0.50 | 0.58 | 0.67 | 0.63 |
| Creative outputs | rank * | 0.59 | 0.24 | 0.42 | 0.53 | 0.51 | 0.49 | 0.60 | 0.54 |
| Environmental performance | index | 0.53 | 0.29 | 0.48 | 0.60 | 0.54 | 0.57 | 0.66 | 0.61 |
| Agriculture, value added (% of GDP) | value | −0.46 | −0.34 | −0.46 | −0.60 | −0.42 | −0.54 | −0.61 | −0.58 |
| A. Health | rank * | 0.59 | 0.30 | 0.48 | 0.60 | 0.57 | 0.55 | 0.62 | 0.58 |
| Innovation Output Sub-Index | rank * | 0.63 | 0.13 | 0.33 | 0.46 | 0.54 | 0.46 | 0.59 | 0.56 |
| GCI 4.0: Pupil-to-teacher ratio in primary education | score | 0.51 | 0.43 | 0.59 | 0.67 | 0.43 | 0.62 | 0.64 | 0.56 |
| B. Primary education | rank * | 0.54 | 0.24 | 0.37 | 0.48 | 0.41 | 0.47 | 0.51 | 0.44 |
| Health equality | scale (0 to 1) | 0.51 | 0.32 | 0.45 | 0.58 | 0.41 | 0.54 | 0.58 | 0.52 |
| Mortality rate, adult, male (per 1000 male adults) | value | −0.64 | −0.32 | −0.49 | −0.60 | −0.58 | −0.57 | −0.64 | −0.59 |
| B. Primary education | value | 0.54 | 0.21 | 0.34 | 0.44 | 0.43 | 0.44 | 0.48 | 0.41 |
| Country-code top-level domains (ccTLDs) | score (0–100) | 0.41 | 0.31 | 0.48 | 0.58 | 0.42 | 0.57 | 0.65 | 0.60 |
| Fertility rate, total (births per woman) | value | −0.55 | −0.30 | −0.47 | −0.55 | −0.50 | −0.58 | −0.64 | −0.58 |
| Access to electricity (% of population) | value | 0.60 | 0.35 | 0.53 | 0.62 | 0.53 | 0.56 | 0.63 | 0.58 |
| Knowledge and technology outputs | rank * | 0.65 | 0.04 | 0.25 | 0.40 | 0.56 | 0.39 | 0.53 | 0.50 |
| Access to electricity, urban (% of urban population) | value | 0.65 | 0.29 | 0.47 | 0.55 | 0.52 | 0.51 | 0.58 | 0.52 |
| Name | Type | dyssincefstcase | cases20dysaftfst | cases40dysaftfst | cases60dysaftfst | dyssincefstdeath | deaths20dysaftfst | deaths40dysaftfst | deaths60dysaftfst |
|---|---|---|---|---|---|---|---|---|---|
| Global Competitiveness Index | value | 0.69 | 0.17 | 0.33 | 0.48 | 0.57 | 0.43 | 0.56 | 0.52 |
| Laws relating to ICTs, 1–7 (best) | value | 0.54 | 0.26 | 0.39 | 0.53 | 0.41 | 0.48 | 0.56 | 0.53 |
| 9th pillar: Economic impacts | value | 0.61 | 0.23 | 0.41 | 0.55 | 0.54 | 0.52 | 0.63 | 0.59 |
| Impact of ICTs on access to basic services, 1–7 (best) | value | 0.56 | 0.26 | 0.39 | 0.52 | 0.41 | 0.48 | 0.55 | 0.50 |
| 7th pillar: Business usage | rank * | 0.55 | 0.16 | 0.28 | 0.42 | 0.45 | 0.37 | 0.47 | 0.44 |
| Availability of latest technologies, 1–7 (best) | value | 0.52 | 0.27 | 0.40 | 0.53 | 0.44 | 0.53 | 0.60 | 0.56 |
| GCI 4.0: Enabling environment component | rank * | 0.66 | 0.26 | 0.43 | 0.58 | 0.51 | 0.54 | 0.64 | 0.58 |
| 10th pillar: Social impacts | value | 0.61 | 0.21 | 0.36 | 0.49 | 0.46 | 0.44 | 0.53 | 0.49 |
| GCI 4.0: Pillar 1: Institutions | score | 0.56 | 0.26 | 0.40 | 0.51 | 0.43 | 0.47 | 0.54 | 0.48 |
| Business-to-consumer Internet use, 1–7 (best) | rank * | 0.65 | 0.14 | 0.31 | 0.45 | 0.51 | 0.41 | 0.54 | 0.51 |
| Property rights score | value | 0.53 | 0.30 | 0.43 | 0.56 | 0.42 | 0.54 | 0.61 | 0.56 |
| ICTs and business model creation | rank * | 0.63 | 0.11 | 0.31 | 0.46 | 0.54 | 0.40 | 0.52 | 0.49 |
| GCI 4.0: Pillar 12: Innovation capability | rank * | 0.72 | 0.12 | 0.33 | 0.49 | 0.61 | 0.43 | 0.58 | 0.55 |
| ICTs and organizational model creation | rank * | 0.65 | 0.08 | 0.26 | 0.41 | 0.51 | 0.37 | 0.50 | 0.47 |
| 2nd pillar: Business and innovation environment | value | 0.54 | 0.32 | 0.44 | 0.57 | 0.43 | 0.54 | 0.61 | 0.54 |
| Impact of ICTs on new organizational models, 1–7 (best) | value | 0.59 | 0.14 | 0.29 | 0.44 | 0.45 | 0.39 | 0.50 | 0.48 |
| ICT use for business-to-business transactions, 1–7 (best) | value | 0.55 | 0.18 | 0.29 | 0.42 | 0.38 | 0.40 | 0.48 | 0.46 |
| Internet access in schools, 1–7 (best) | value | 0.54 | 0.33 | 0.43 | 0.53 | 0.40 | 0.52 | 0.57 | 0.50 |
| Impact of ICTs on business models, 1–7 (best) | rank * | 0.57 | 0.17 | 0.32 | 0.46 | 0.47 | 0.41 | 0.50 | 0.48 |
| Local supplier quality, 1–7 (best) | rank * | 0.55 | 0.20 | 0.38 | 0.53 | 0.59 | 0.51 | 0.62 | 0.56 |
| Internet access in schools | 1–7 best | 0.55 | 0.28 | 0.39 | 0.49 | 0.45 | 0.46 | 0.51 | 0.45 |
| GCI 4.0: 1.F Property rights | score | 0.53 | 0.24 | 0.40 | 0.51 | 0.41 | 0.50 | 0.56 | 0.51 |
| A. Transport infrastructure | value | 0.66 | 0.08 | 0.25 | 0.42 | 0.56 | 0.39 | 0.52 | 0.50 |
| Value chain breadth, 1–7 (best) | rank * | 0.67 | 0.05 | 0.24 | 0.38 | 0.60 | 0.34 | 0.46 | 0.42 |
| GCI 4.0: Interaction and diversity | rank * | 0.60 | 0.09 | 0.26 | 0.40 | 0.47 | 0.34 | 0.45 | 0.40 |
| GCI 4.0: Markets component | score | 0.75 | 0.01 | 0.22 | 0.40 | 0.62 | 0.33 | 0.50 | 0.48 |
| 12th pillar Innovation | rank * | 0.60 | 0.07 | 0.23 | 0.37 | 0.51 | 0.31 | 0.43 | 0.39 |
| Quality of air transport infrastructure | rank * | 0.53 | 0.22 | 0.36 | 0.48 | 0.49 | 0.47 | 0.55 | 0.51 |
| Quality of overall infrastructure | 1–7 best | 0.55 | 0.24 | 0.37 | 0.49 | 0.47 | 0.47 | 0.55 | 0.50 |
| Ease of doing business | dtf | 0.60 | 0.17 | 0.32 | 0.45 | 0.46 | 0.43 | 0.52 | 0.46 |
| Country credit rating, 0–100 (best) * | rank * | 0.64 | 0.14 | 0.30 | 0.48 | 0.54 | 0.44 | 0.57 | 0.54 |
| GCI 4.0: Pillar 11: Business dynamism | rank * | 0.62 | 0.12 | 0.30 | 0.44 | 0.52 | 0.42 | 0.52 | 0.47 |
| GCI 4.0: Efficiency of air transport services | rank * | 0.57 | 0.18 | 0.35 | 0.47 | 0.49 | 0.43 | 0.51 | 0.48 |
| 8th pillar: Government usage | value | 0.59 | 0.11 | 0.25 | 0.39 | 0.41 | 0.33 | 0.41 | 0.39 |
| GCI 4.0: Pillar 9: Financial system | rank * | 0.64 | 0.13 | 0.26 | 0.41 | 0.49 | 0.41 | 0.51 | 0.47 |
| Control of international distribution, 1–7 (best) | rank * | 0.64 | 0.07 | 0.25 | 0.40 | 0.54 | 0.38 | 0.49 | 0.46 |
| Quality of scientific research institutions | rank * | 0.58 | 0.10 | 0.27 | 0.40 | 0.54 | 0.37 | 0.50 | 0.46 |
| A. Transport infrastructure | rank * | 0.72 | 0.05 | 0.29 | 0.46 | 0.59 | 0.41 | 0.56 | 0.54 |
| Capacity for innovation | rank * | 0.55 | 0.04 | 0.19 | 0.32 | 0.50 | 0.25 | 0.37 | 0.33 |
| Nature of competitive advantage, 1–7 (best) | rank * | 0.54 | 0.15 | 0.26 | 0.37 | 0.43 | 0.34 | 0.41 | 0.36 |
| GCI 4.0: Border clearance efficiency | score | 0.56 | 0.13 | 0.28 | 0.42 | 0.45 | 0.40 | 0.52 | 0.49 |
| State of cluster development | rank * | 0.64 | −0.06 | 0.12 | 0.30 | 0.49 | 0.23 | 0.37 | 0.35 |
| GCI 4.0: Quality of land administration | rank * | 0.51 | 0.28 | 0.44 | 0.53 | 0.43 | 0.50 | 0.56 | 0.52 |
| Group Grievance | score | −0.54 | −0.18 | −0.32 | −0.49 | −0.51 | −0.44 | −0.56 | −0.53 |
| GCI 4.0: 7.A Domestic competition | rank * | 0.55 | 0.10 | 0.25 | 0.39 | 0.42 | 0.31 | 0.40 | 0.35 |
| Government Online Service Index, 0-1 (best) | rank * | 0.64 | 0.06 | 0.24 | 0.40 | 0.49 | 0.36 | 0.48 | 0.47 |
| Company spending on Research & Development | rank * | 0.57 | −0.02 | 0.12 | 0.26 | 0.48 | 0.21 | 0.34 | 0.31 |
| GCI 4.0: Digital skills among population | rank * | 0.59 | 0.18 | 0.32 | 0.41 | 0.45 | 0.37 | 0.42 | 0.36 |
| GCI 4.0: Efficiency of seaport services | rank * | 0.58 | 0.06 | 0.24 | 0.39 | 0.51 | 0.35 | 0.46 | 0.44 |
| Getting electricity: Cost | % of income per capita | −0.62 | −0.19 | −0.32 | −0.44 | −0.57 | −0.38 | −0.49 | −0.45 |
| Degree of customer orientation, 1–7 (best) | value | 0.54 | 0.11 | 0.26 | 0.39 | 0.54 | 0.33 | 0.43 | 0.38 |
| Use of virtual social networks, 1–7 (best) | value | 0.55 | 0.26 | 0.38 | 0.47 | 0.43 | 0.50 | 0.53 | 0.48 |
| Registering property: Reliability of infrastructure index | 0–8 | 0.53 | 0.23 | 0.39 | 0.49 | 0.41 | 0.47 | 0.54 | 0.51 |
| Availability of scientists and engineers | rank * | 0.64 | 0.00 | 0.17 | 0.29 | 0.57 | 0.26 | 0.39 | 0.34 |
| A. Efficiency | value | 0.54 | 0.11 | 0.17 | 0.32 | 0.36 | 0.27 | 0.36 | 0.35 |
| Name | Type | dyssincefstcase | cases20dysaftfst | cases40dysaftfst | cases60dysaftfst | dyssincefstdeath | deaths20dysaftfst | deaths40dysaftfst | deaths60dysaftfst |
|---|---|---|---|---|---|---|---|---|---|
| Regulatory quality | rank * | 0.47 | 0.32 | 0.44 | 0.56 | 0.40 | 0.57 | 0.61 | 0.56 |
| Political environment | score (0–100) | 0.42 | 0.33 | 0.41 | 0.52 | 0.33 | 0.53 | 0.56 | 0.51 |
| Institutions | score (0–100) | 0.48 | 0.31 | 0.42 | 0.53 | 0.39 | 0.52 | 0.58 | 0.52 |
| Freedom from corruption score | value | 0.43 | 0.32 | 0.41 | 0.53 | 0.36 | 0.51 | 0.56 | 0.52 |
| Government officials in the police and the military do not use public office for private gain | total | 0.50 | 0.20 | 0.35 | 0.49 | 0.43 | 0.52 | 0.59 | 0.52 |
| Due process of law and the rights of the accused | total | 0.46 | 0.23 | 0.40 | 0.55 | 0.45 | 0.55 | 0.62 | 0.56 |
| Government regulations are applied and enforced without improper influence | total | 0.42 | 0.17 | 0.28 | 0.43 | 0.40 | 0.46 | 0.54 | 0.49 |
| The right to life and security of the person is effectively guaranteed | total | 0.32 | 0.30 | 0.47 | 0.61 | 0.38 | 0.60 | 0.65 | 0.59 |
| Corruption | scale (0 to 1) * | −0.46 | −0.21 | −0.32 | −0.47 | −0.37 | −0.48 | −0.54 | −0.49 |
| Regulatory environment | score (0–100) | 0.36 | 0.26 | 0.36 | 0.45 | 0.25 | 0.49 | 0.55 | 0.50 |
| Trading across borders: Time to import | days | −0.55 | −0.23 | −0.38 | −0.52 | −0.45 | −0.56 | −0.62 | −0.59 |
| Civil Liberties | 1 to 7 scale * | 0.22 | 0.28 | 0.40 | 0.47 | 0.34 | 0.50 | 0.54 | 0.50 |
| Freedom from arbitrary interference with privacy is effectively guaranteed | total | 0.38 | 0.19 | 0.39 | 0.54 | 0.42 | 0.52 | 0.59 | 0.54 |
| Uneven Development | score | −0.29 | −0.28 | −0.39 | −0.47 | −0.38 | −0.48 | −0.55 | −0.52 |
| Election government intimidation | scale (0 to 1) * | −0.34 | −0.25 | −0.36 | −0.43 | −0.42 | −0.47 | −0.54 | −0.49 |
| Election other voting irregularities | scale (0 to 1) * | −0.42 | −0.23 | −0.34 | −0.45 | −0.40 | −0.47 | −0.55 | −0.51 |
| Name | Type | dyssincefstcase | cases20dysaftfst | cases40dysaftfst | cases60dysaftfst | dyssincefstdeath | deaths20dysaftfst | deaths40dysaftfst | deaths60dysaftfst |
|---|---|---|---|---|---|---|---|---|---|
| Tariff rate, applied, simple mean, all products (%) | value | −0.28 | −0.39 | −0.48 | −0.54 | −0.29 | −0.52 | −0.55 | −0.50 |
| Tariff rate, most favored nation, weighted mean, manufactured products (%) | value | −0.40 | −0.35 | −0.45 | −0.54 | −0.35 | −0.50 | −0.56 | −0.51 |
| GCI 4.0: Trade tariffs | rank | −0.30 | −0.36 | −0.47 | −0.56 | −0.30 | −0.52 | −0.56 | −0.51 |
| Tariff rate, most favored nation, simple mean, manufactured products (%) | value | −0.36 | −0.37 | −0.47 | −0.55 | −0.32 | −0.51 | −0.56 | −0.50 |
| Tariff rate, most favored nation, weighted mean, all products (%) | value | −0.37 | −0.32 | −0.46 | −0.56 | −0.35 | −0.55 | −0.61 | −0.56 |
| Trade freedom score | value | 0.39 | 0.34 | 0.44 | 0.51 | 0.34 | 0.53 | 0.55 | 0.49 |
| Effectively applied import tariff rates on non−agricultural and non−fuel products | average | −0.34 | −0.33 | −0.42 | −0.47 | −0.36 | −0.52 | −0.56 | −0.49 |
| Share of tariff lines with international peaks, manufactured products (%) | value | −0.34 | −0.39 | −0.47 | −0.56 | −0.27 | −0.50 | −0.53 | −0.49 |
References
- Anastassopoulou, C.; Russo, L.; Tsakris, A.; Siettos, C. Data-based analysis, modelling and forecasting of the COVID-19 outbreak. PLoS ONE 2020, 15, e0230405. [Google Scholar] [CrossRef] [PubMed] [Green Version]
- Modi, C.; Boehm, V.; Ferraro, S.; Stein, G.; Seljak, U. How deadly is COVID-19? A rigorous analysis of excess mortality and age-dependent fatality rates in Italy. medRxiv 2020. [Google Scholar] [CrossRef] [Green Version]
- Shivendu, S.; Chakraborty, S.; Onuchowska, A.; Patidar, A.; Srivastava, A. Is There Evidence that BCG Vaccination Has Non-Specific Protective Effects for COVID-19 Infections or Is It An Illusion Created by Lack of Testing? medRxiv 2020. [Google Scholar] [CrossRef]
- Hollyer, J.R.; Rosendorff, B.P.; Vreeland, J.R. Measuring transparency. Political Anal. 2014, 413–434. [Google Scholar] [CrossRef]
- Lim, V.V.X.; Prem, K.; Teo, A.K.J.; Tan, R.K.J. A Latent Class Analysis of COVID-19 Testing Response, Globalisation, and Democracy with National COVID-19 Outcomes: A Global Ecological Study. LANGLH-D-20-02931. 2020. Available online: https://ssrn.com/abstract=3661324 (accessed on 4 February 2021).
- Vadlamannati, K.C.; Cooray, A.; de Soya, I. Healthcare Equity and COVID-19; Working Paper 2020/89; WIDER: Helsinki, Finland, 2020. [Google Scholar]
- Cepaluni, G.; Dorsch, M.; Branyiczki, R. Political Regimes and Deaths in the Early Stages of the COVID-19 Pandemic. Available online: https://ssrn.com/abstract=3586767 (accessed on 4 February 2021).
- Stojkoski, V.; Utkovski, Z.; Jolakoski, P.; Tevdovski, D.; Kocarev, L. The socio-economic determinants of the coronavirus disease (COVID-19) pandemic. arXiv 2020, arXiv:2004.07947. [Google Scholar] [CrossRef]
- Kurbucz, M.T. A Joint Dataset of Official COVID-19 Reports and the Governance, Trade and Competitiveness Indicators of World Bank Group Platforms; Data in Brief; Elsevier: Amsterdam, The Netherlands, 2020. [Google Scholar] [CrossRef]
- Kurbucz, M.T. A Joint Dataset of Official COVID-19 Reports and the Governance, Trade and Competitiveness Indicators of World Bank Group Platforms. Mendeley Data. 2020. Available online: https://data.mendeley.com/datasets/hzdnxph8vg/6 (accessed on 4 February 2021). [CrossRef]
- Ramin, R.; Onglao-Drilon, P. ‘data360r’: Wrapper for ‘TCdata360’ and ‘Govdata360’ API. R Package Version 1.0.8. R Package. 2020. Available online: https://cran.r-project.org/web/packages/data360r/index.html (accessed on 4 February 2021).
- European Centre for Disease Prevention and Control. Today’s Data on the Geographic Distribution of COVID-19 Cases Worldwide. Dataset. 2020. Available online: https://opendata.ecdc.europa.eu/covid19/casedistribution/csv (accessed on 4 February 2021).
- Kuhn, M. The Caret Package; R Package, R Foundation for Statistical Computing: Vienna, Austria, 2012; Available online: https://cran.r-project.org/package=caret (accessed on 4 February 2021).
- World Bank Group. Dataset on the Total Population of Countries. Dataset. 2019. Available online: https://data.worldbank.org/indicator/sp.pop.totl (accessed on 4 February 2021).
- Sebestyén, V.; Bulla, M.; Rédey, Á.; Abonyi, J. Data-Driven Multilayer Complex Networks of Sustainable Development Goals; Data in Brief; Elsevier: Amsterdam, The Netherlands, 2019; Volume 25, p. 104049. [Google Scholar]
- Sebestyén, V.; Bulla, M.; Rédey, Á.; Abonyi, J. Network model-based analysis of the goals, targets and indicators of sustainable development for strategic environmental assessment. J. Environ. Manag. 2019, 238, 126–135. [Google Scholar] [CrossRef] [PubMed]
- Newman, M. Networks: An Introduction; OUP Oxford: Oxford, UK, 2010; Google-Books-ID: q7HVtpYVfC0C; ISBN 978-0-19-920665-0. [Google Scholar]
- Gadár, L.; Kosztyán, Z.T.; Abonyi, J. The settlement structure is reflected in personal investments: Distance-dependent network modularity-based measurement of regional attractiveness. Complexity 2018, 2018. [Google Scholar] [CrossRef] [Green Version]
- Tian, Y.; Gel, Y.R. Fusing data depth with complex networks: Community detection with prior information. Comput. Stat. Data Anal. 2019, 139, 99–116. [Google Scholar] [CrossRef]
- Blondel, V.D.; Guillaume, J.-L.; Lambiotte, R.; Lefebvre, E. Fast unfolding of communities in large networks. J. Stat. Mech. Theory Exp. 2008, 2008, P10008. [Google Scholar] [CrossRef] [Green Version]
- Csardi, G.; Nepusz, T. The igraph software package for complex network research. InterJournal Complex Syst. 2006, 1695, 1–9. [Google Scholar]
- Fellows, I. Package ‘Wordcloud’. R Package, Maintainer Ian and Rcpp, Linking To and Rcpp. 2018. Available online: https://cran.r-project.org/web/packages/wordcloud/wordcloud.pdf (accessed on 4 February 2021).


| Note | Group | Description and Short Name of Variables | NA | Source | |
|---|---|---|---|---|---|
| ID | Country ID; | 0% | a | ||
| Region ID; | 0% | b | |||
| COVID-19 | Cases | The number of days since the first case. (dyssincefstcase) | 0% | a | |
| The total number of cases per capita after 20 days from the first case. (cases20dysaftfst) | 0% | a | |||
| The total number of cases per capita after 40 days from the first case. (cases40dysaftfst) | 0% | a | |||
| The total number of cases per capita after 60 days from the first case. (cases60dysaftfst) | 0% | a | |||
| Deaths | The number of days since the first death. (dyssincefstdeath) | 0% | a | ||
| The total number of deaths per capita after 20 days from the first death. (deaths20dysaftfst) | 1% | a | |||
| The total number of deaths per capita after 40 days from the first death. (deaths40dysaftfst) | 1% | a | |||
| The total number of deaths per capita after 60 days from the first death. (deaths60dysaftfst) | 3% | a | |||
| Gov | The complete list of standardized GovData360 and TCdata360 indicators is contained in the Supplementary Materials; , | 5% * | c | ||
| TC | 6% * | c | |||
| Number of... | Size of Community... | |||||||
|---|---|---|---|---|---|---|---|---|
| Vertices | Edges | 1 | 2 | 3 | 4 | 5 | ||
| 0.00 * | 321.0 | 1656.0 | 5.0 | 26.0 | 58.0 | 55.0 | 13.0 | 7.0 |
| 0.01 | 313.7 | 1655.9 | 5.0 | 26.0 | 57.7 | 55.8 | 13.2 | 7.0 |
| 0.03 | 309.5 | 1638.2 | 5.0 | 26.0 | 56.1 | 56.3 | 13.2 | 7.0 |
| 0.05 | 298.5 | 1594.7 | 5.0 | 26.0 | 55.7 | 51.9 | 13.2 | 7.0 |
| 0.10 | 275.8 | 1515.4 | 4.9 | 45.1 | 35.5 | 43.3 | 13.1 | 7.0 |
| 0.15 | 202.7 | 1173.0 | 5.0 | 47.3 | 17.0 | 23.3 | 15.0 | 7.0 |
| 0.20 | 208.3 | 1203.1 | 4.6 | 49.6 | 19.8 | 25.1 | 10.9 | 7.0 |
| 0.30 | 186.0 | 1049.0 | 5.2 | 36.0 | 17.7 | 18.4 | 16.4 | 9.4 |
Publisher’s Note: MDPI stays neutral with regard to jurisdictional claims in published maps and institutional affiliations. |
© 2021 by the authors. Licensee MDPI, Basel, Switzerland. This article is an open access article distributed under the terms and conditions of the Creative Commons Attribution (CC BY) license (http://creativecommons.org/licenses/by/4.0/).
Share and Cite
Kurbucz, M.T.; Katona, A.I.; Lantos, Z.; Kosztyán, Z.T. The Role of Societal Aspects in the Formation of Official COVID-19 Reports: A Data-Driven Analysis. Int. J. Environ. Res. Public Health 2021, 18, 1505. https://0-doi-org.brum.beds.ac.uk/10.3390/ijerph18041505
Kurbucz MT, Katona AI, Lantos Z, Kosztyán ZT. The Role of Societal Aspects in the Formation of Official COVID-19 Reports: A Data-Driven Analysis. International Journal of Environmental Research and Public Health. 2021; 18(4):1505. https://0-doi-org.brum.beds.ac.uk/10.3390/ijerph18041505
Chicago/Turabian StyleKurbucz, Marcell Tamás, Attila Imre Katona, Zoltán Lantos, and Zsolt Tibor Kosztyán. 2021. "The Role of Societal Aspects in the Formation of Official COVID-19 Reports: A Data-Driven Analysis" International Journal of Environmental Research and Public Health 18, no. 4: 1505. https://0-doi-org.brum.beds.ac.uk/10.3390/ijerph18041505