
Water Availability–Demand Balance under Climate Change Scenarios in an Overpopulated Region of Mexico

 , ,
, , 
 and
and
Abstract
:1. Introduction
2. Materials and Methods
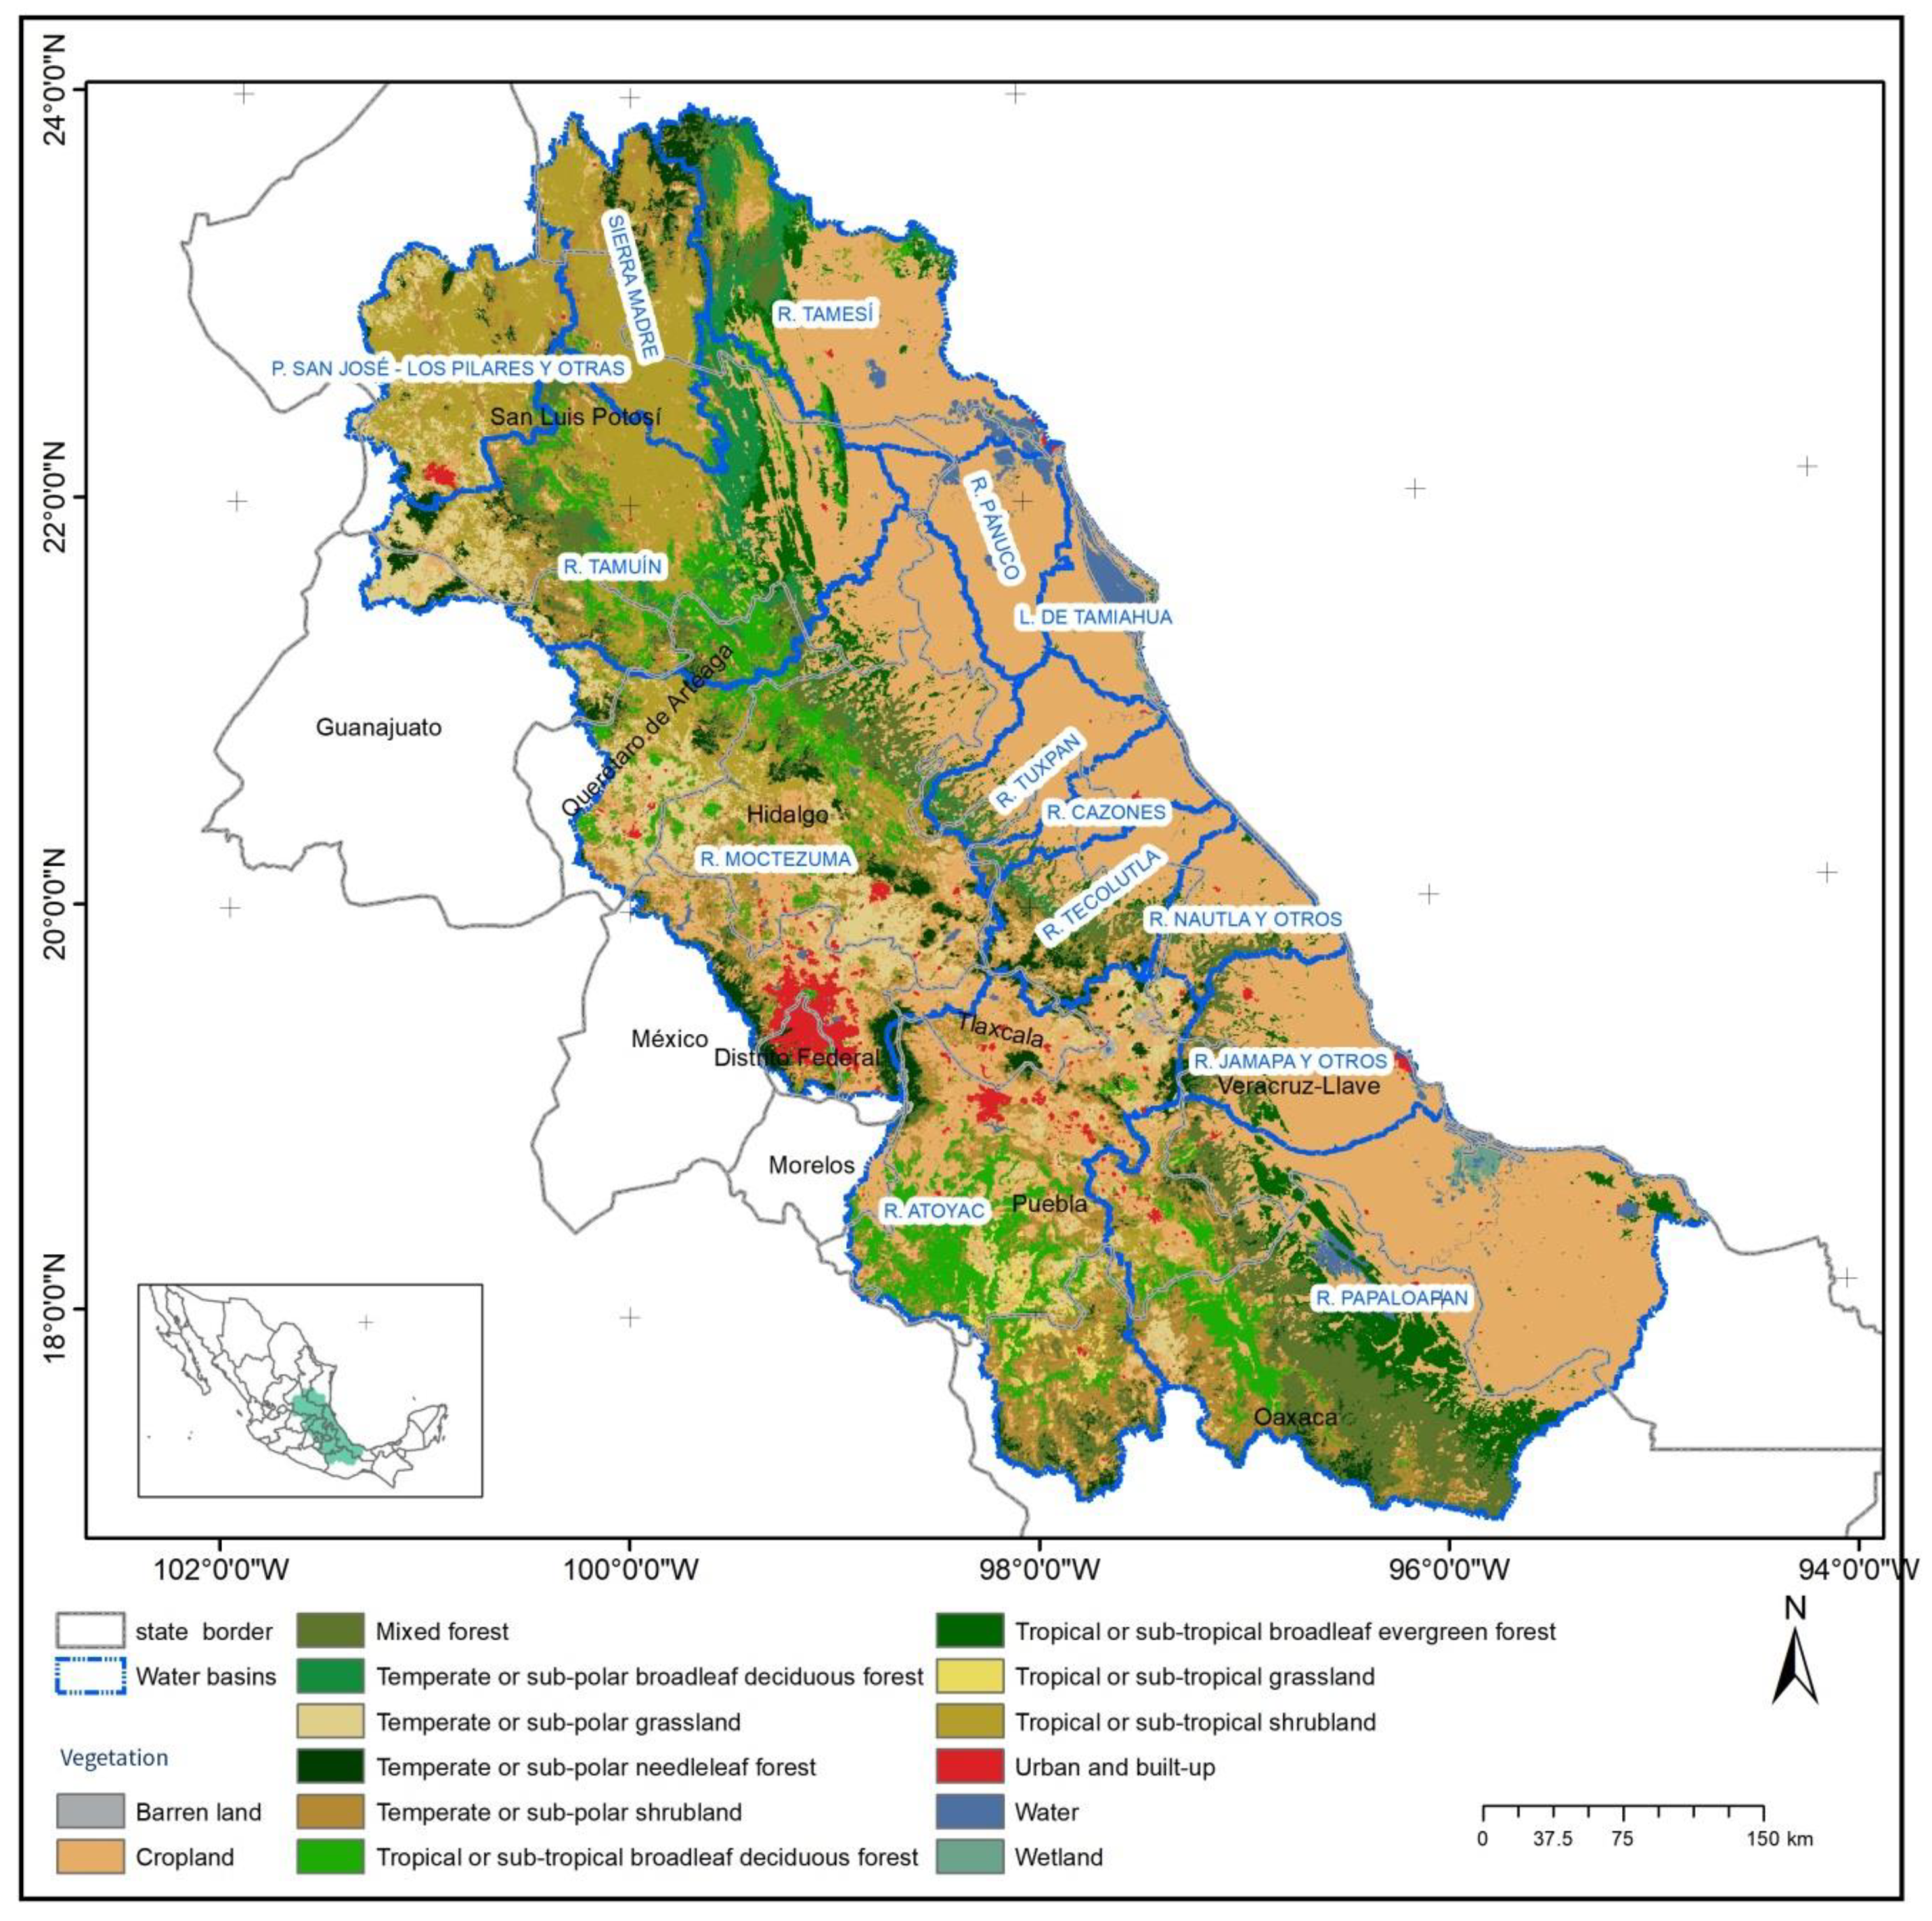
2.1. Study Area
2.2. Surface Water Availability
2.3. Water Demand
2.4. Climate Change Scenarios for 2060 and 2080
2.5. Water Deficit
3. Results
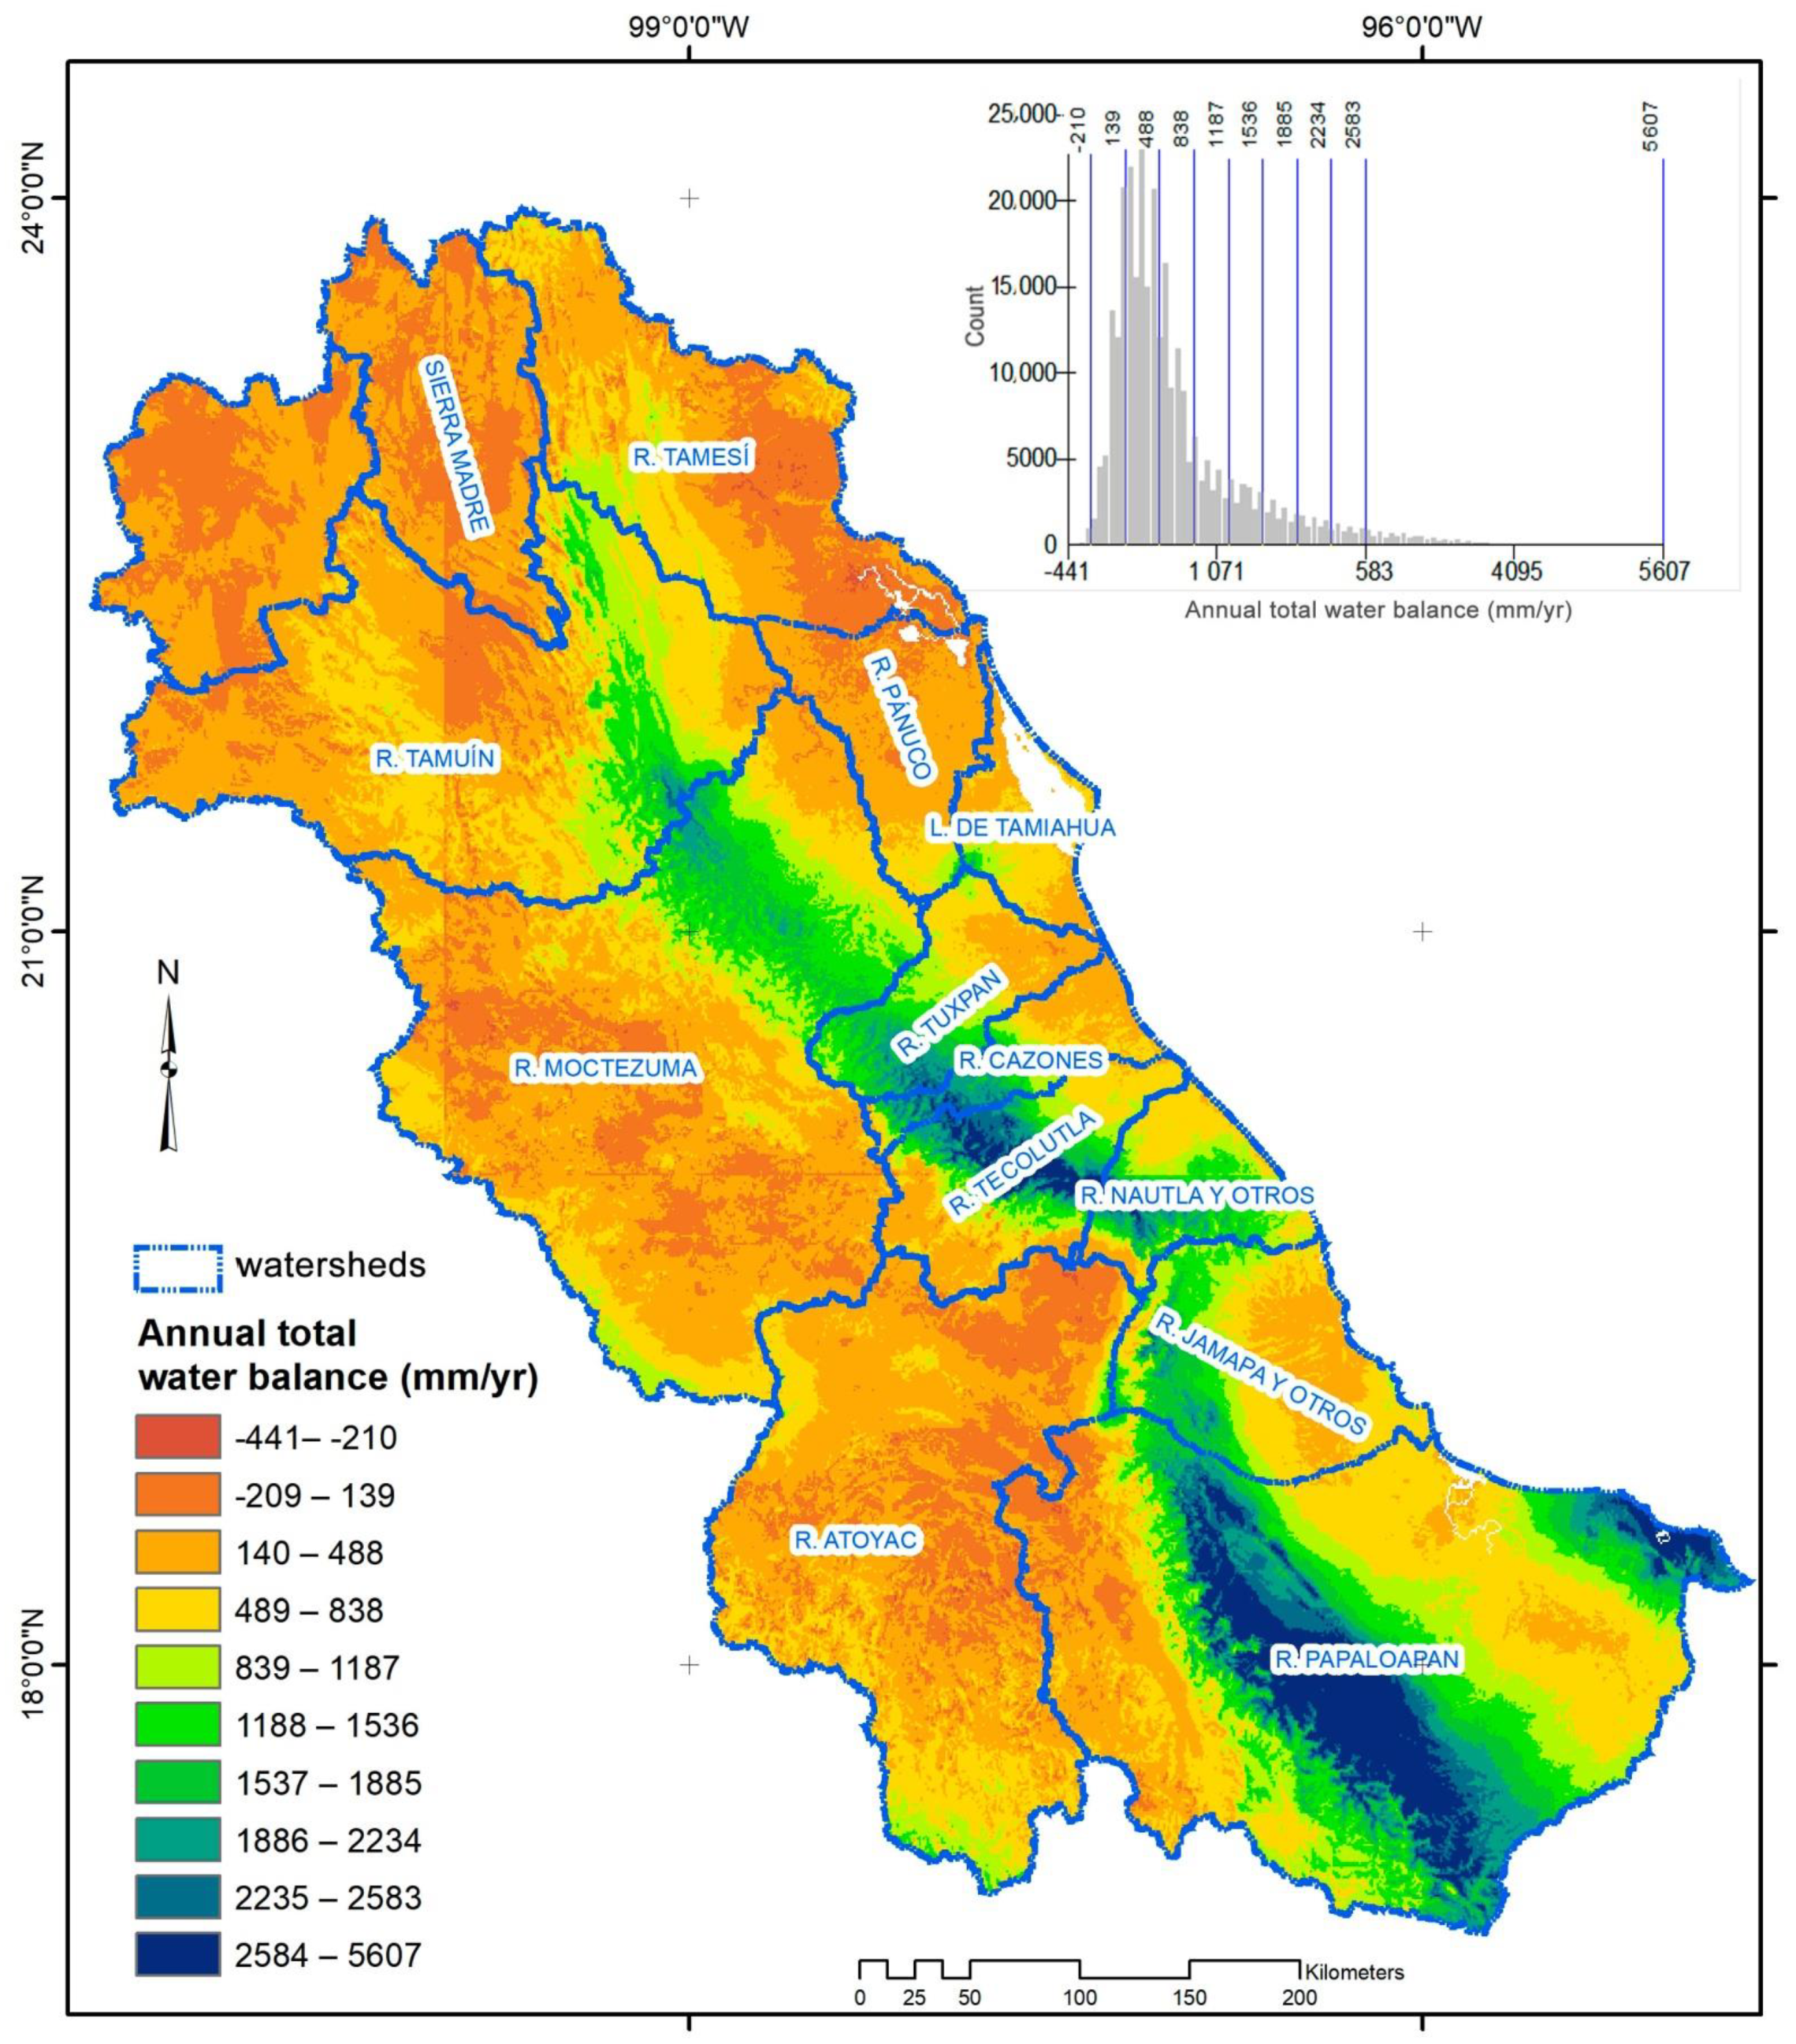
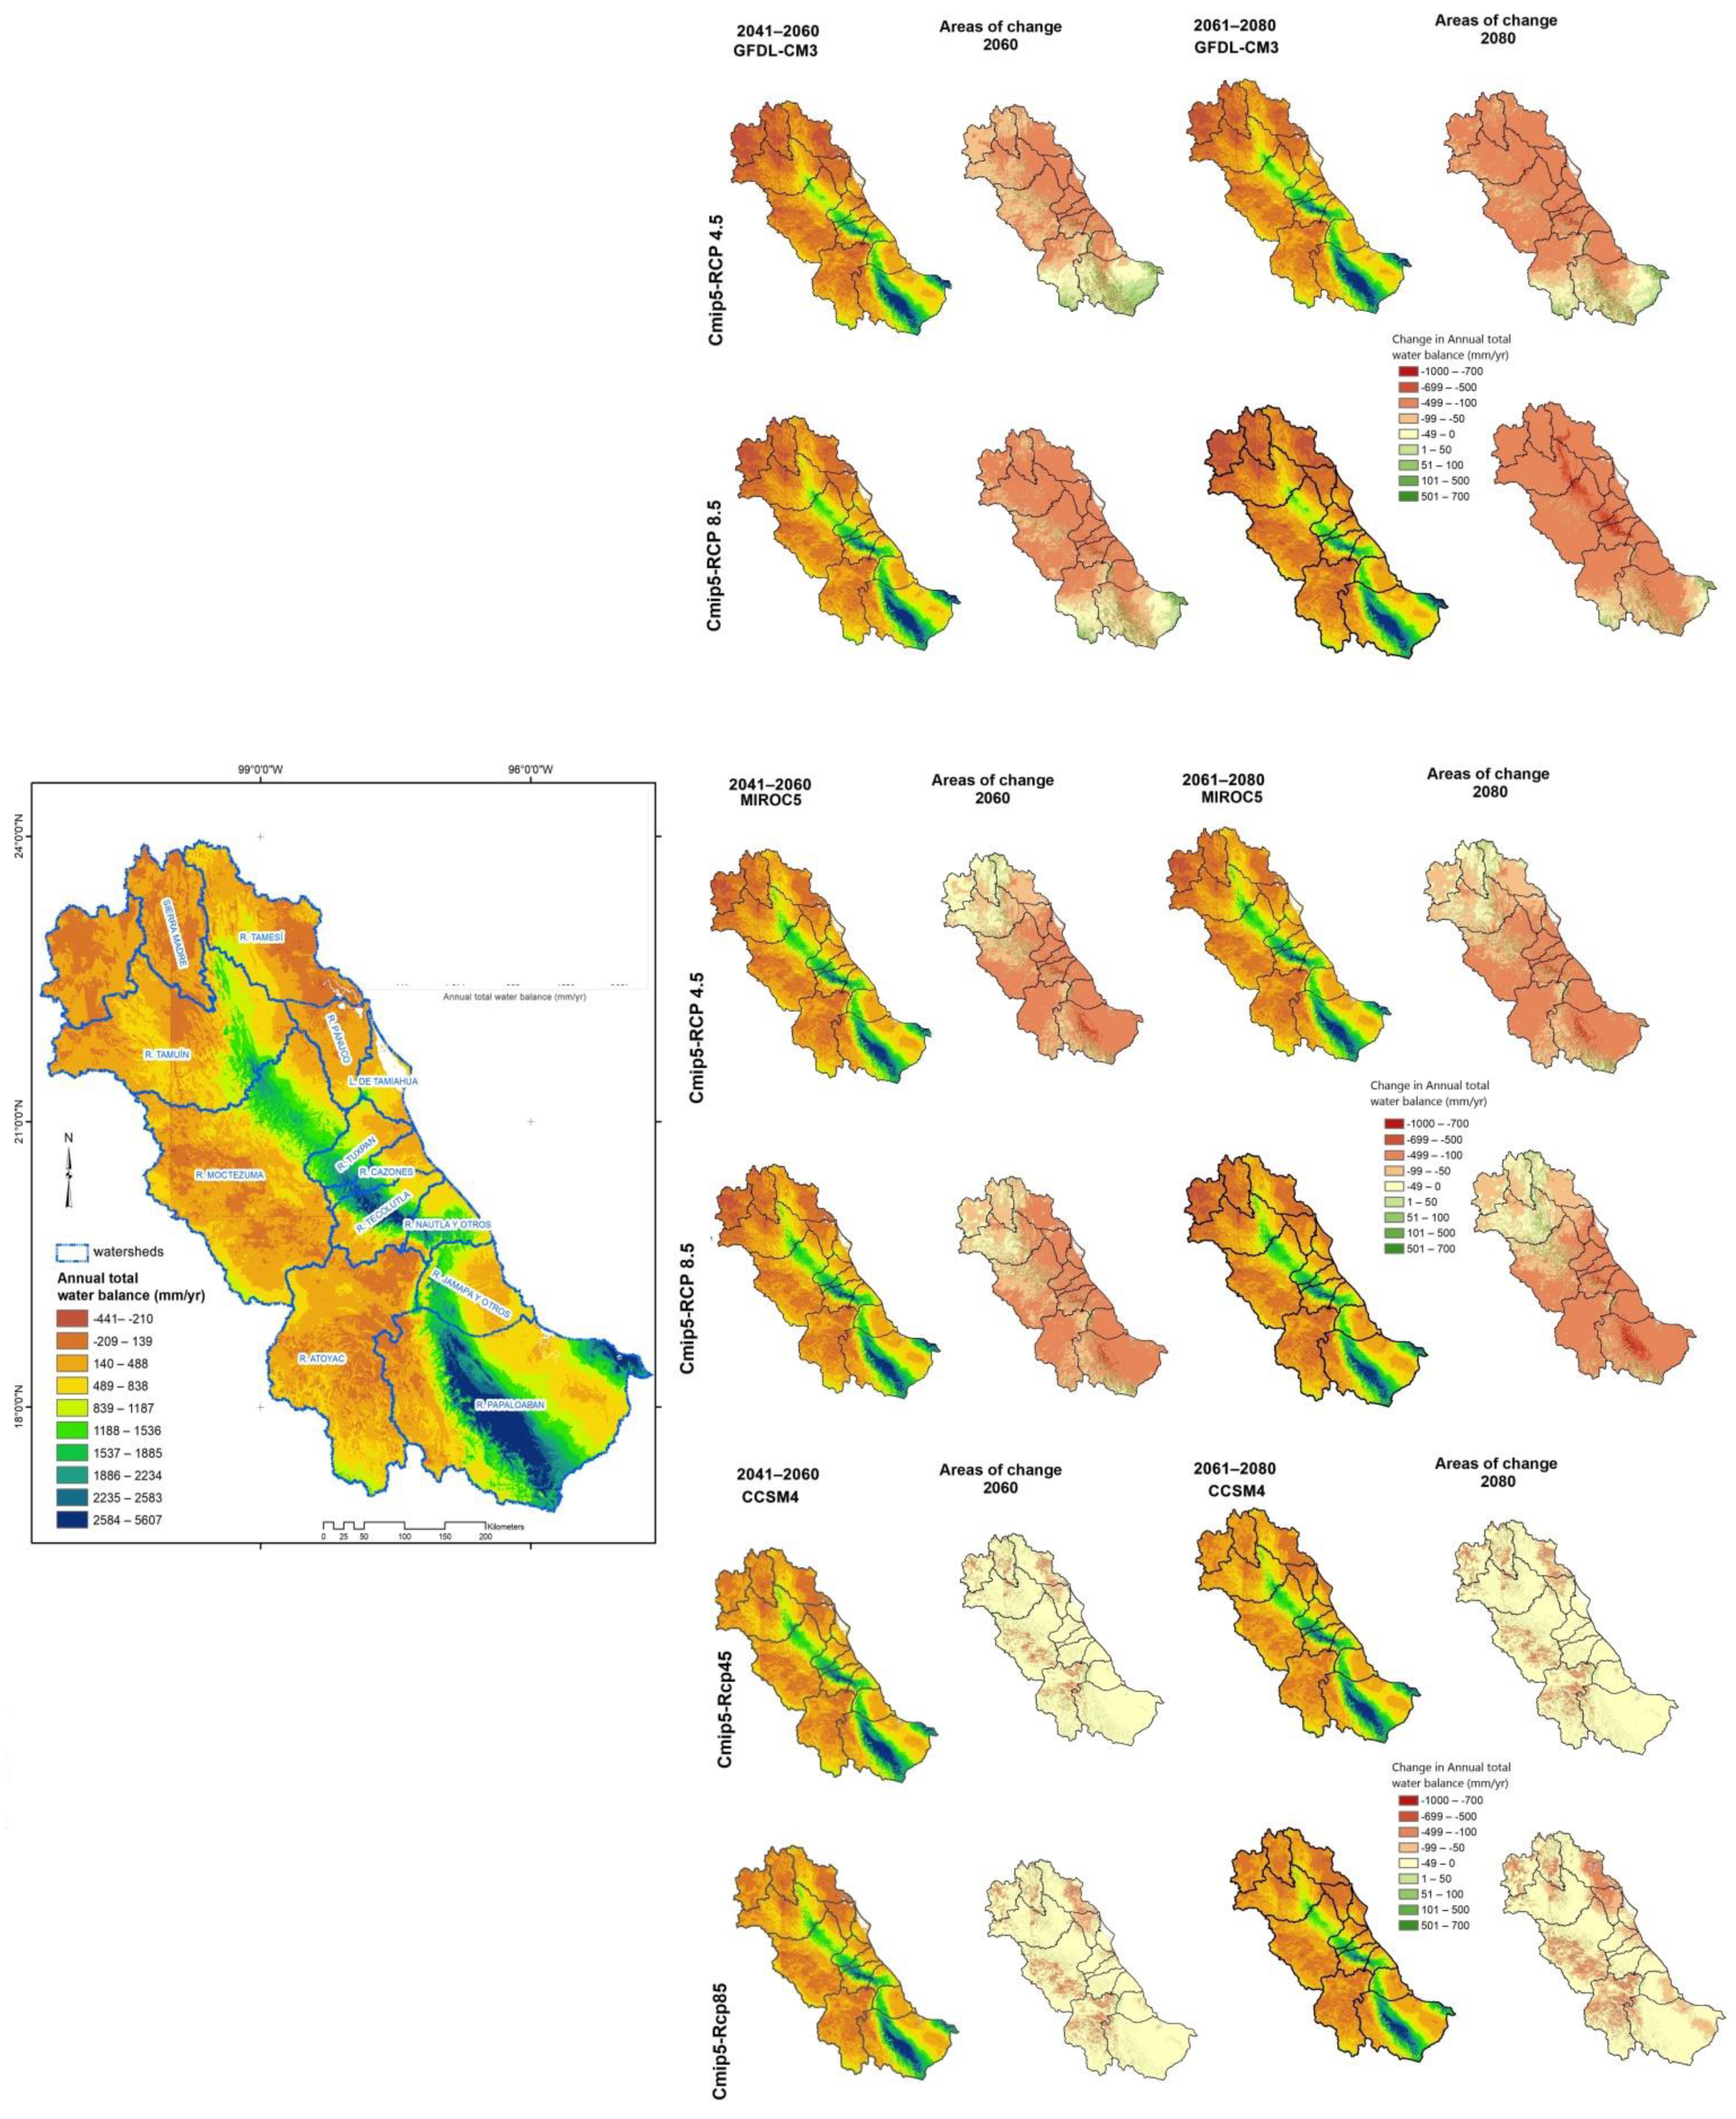
3.1. Surface Water Availability
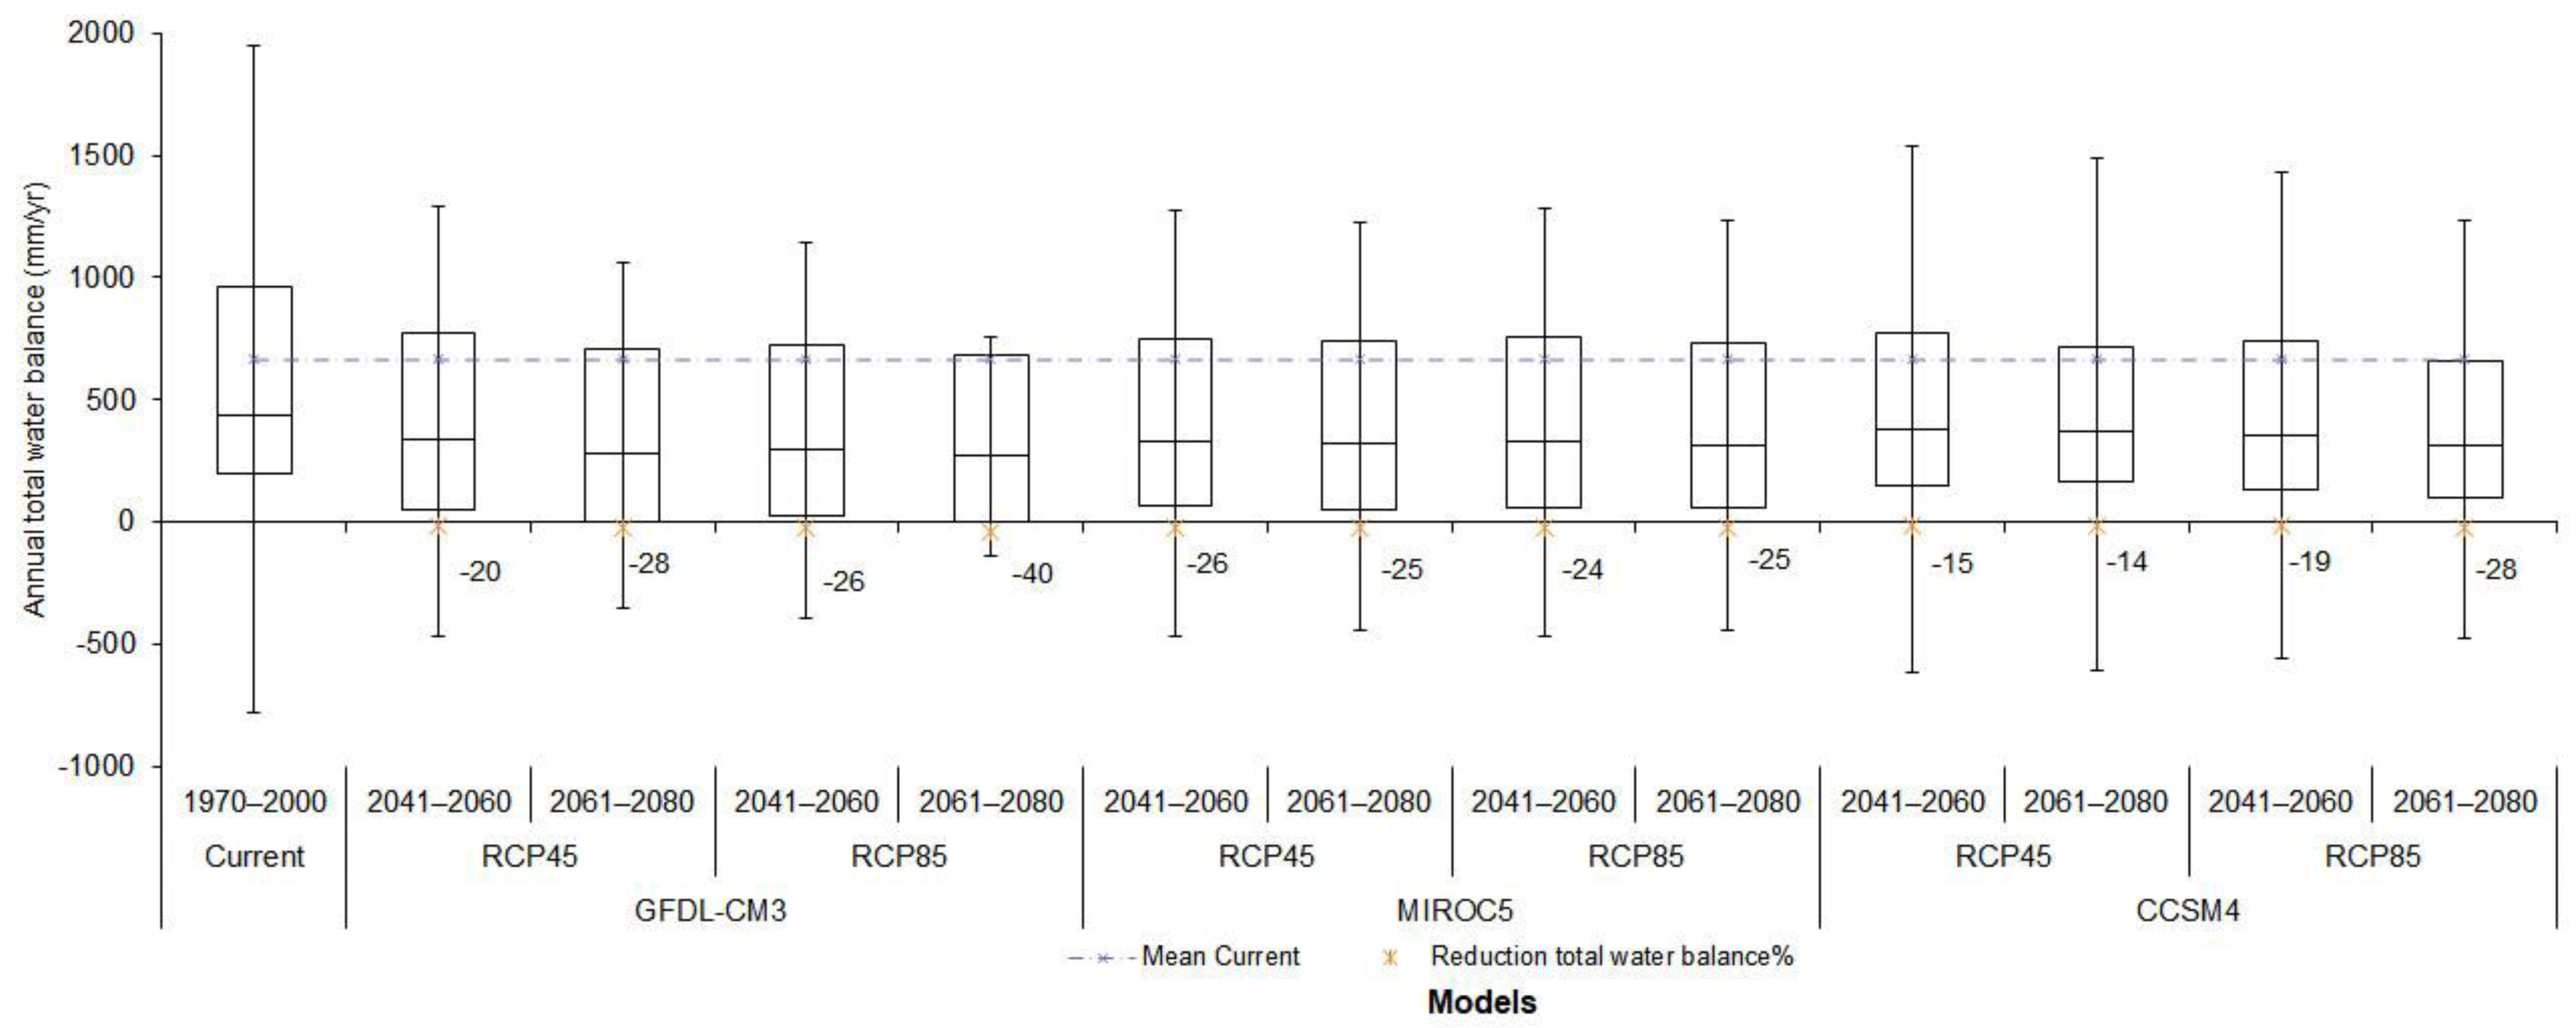
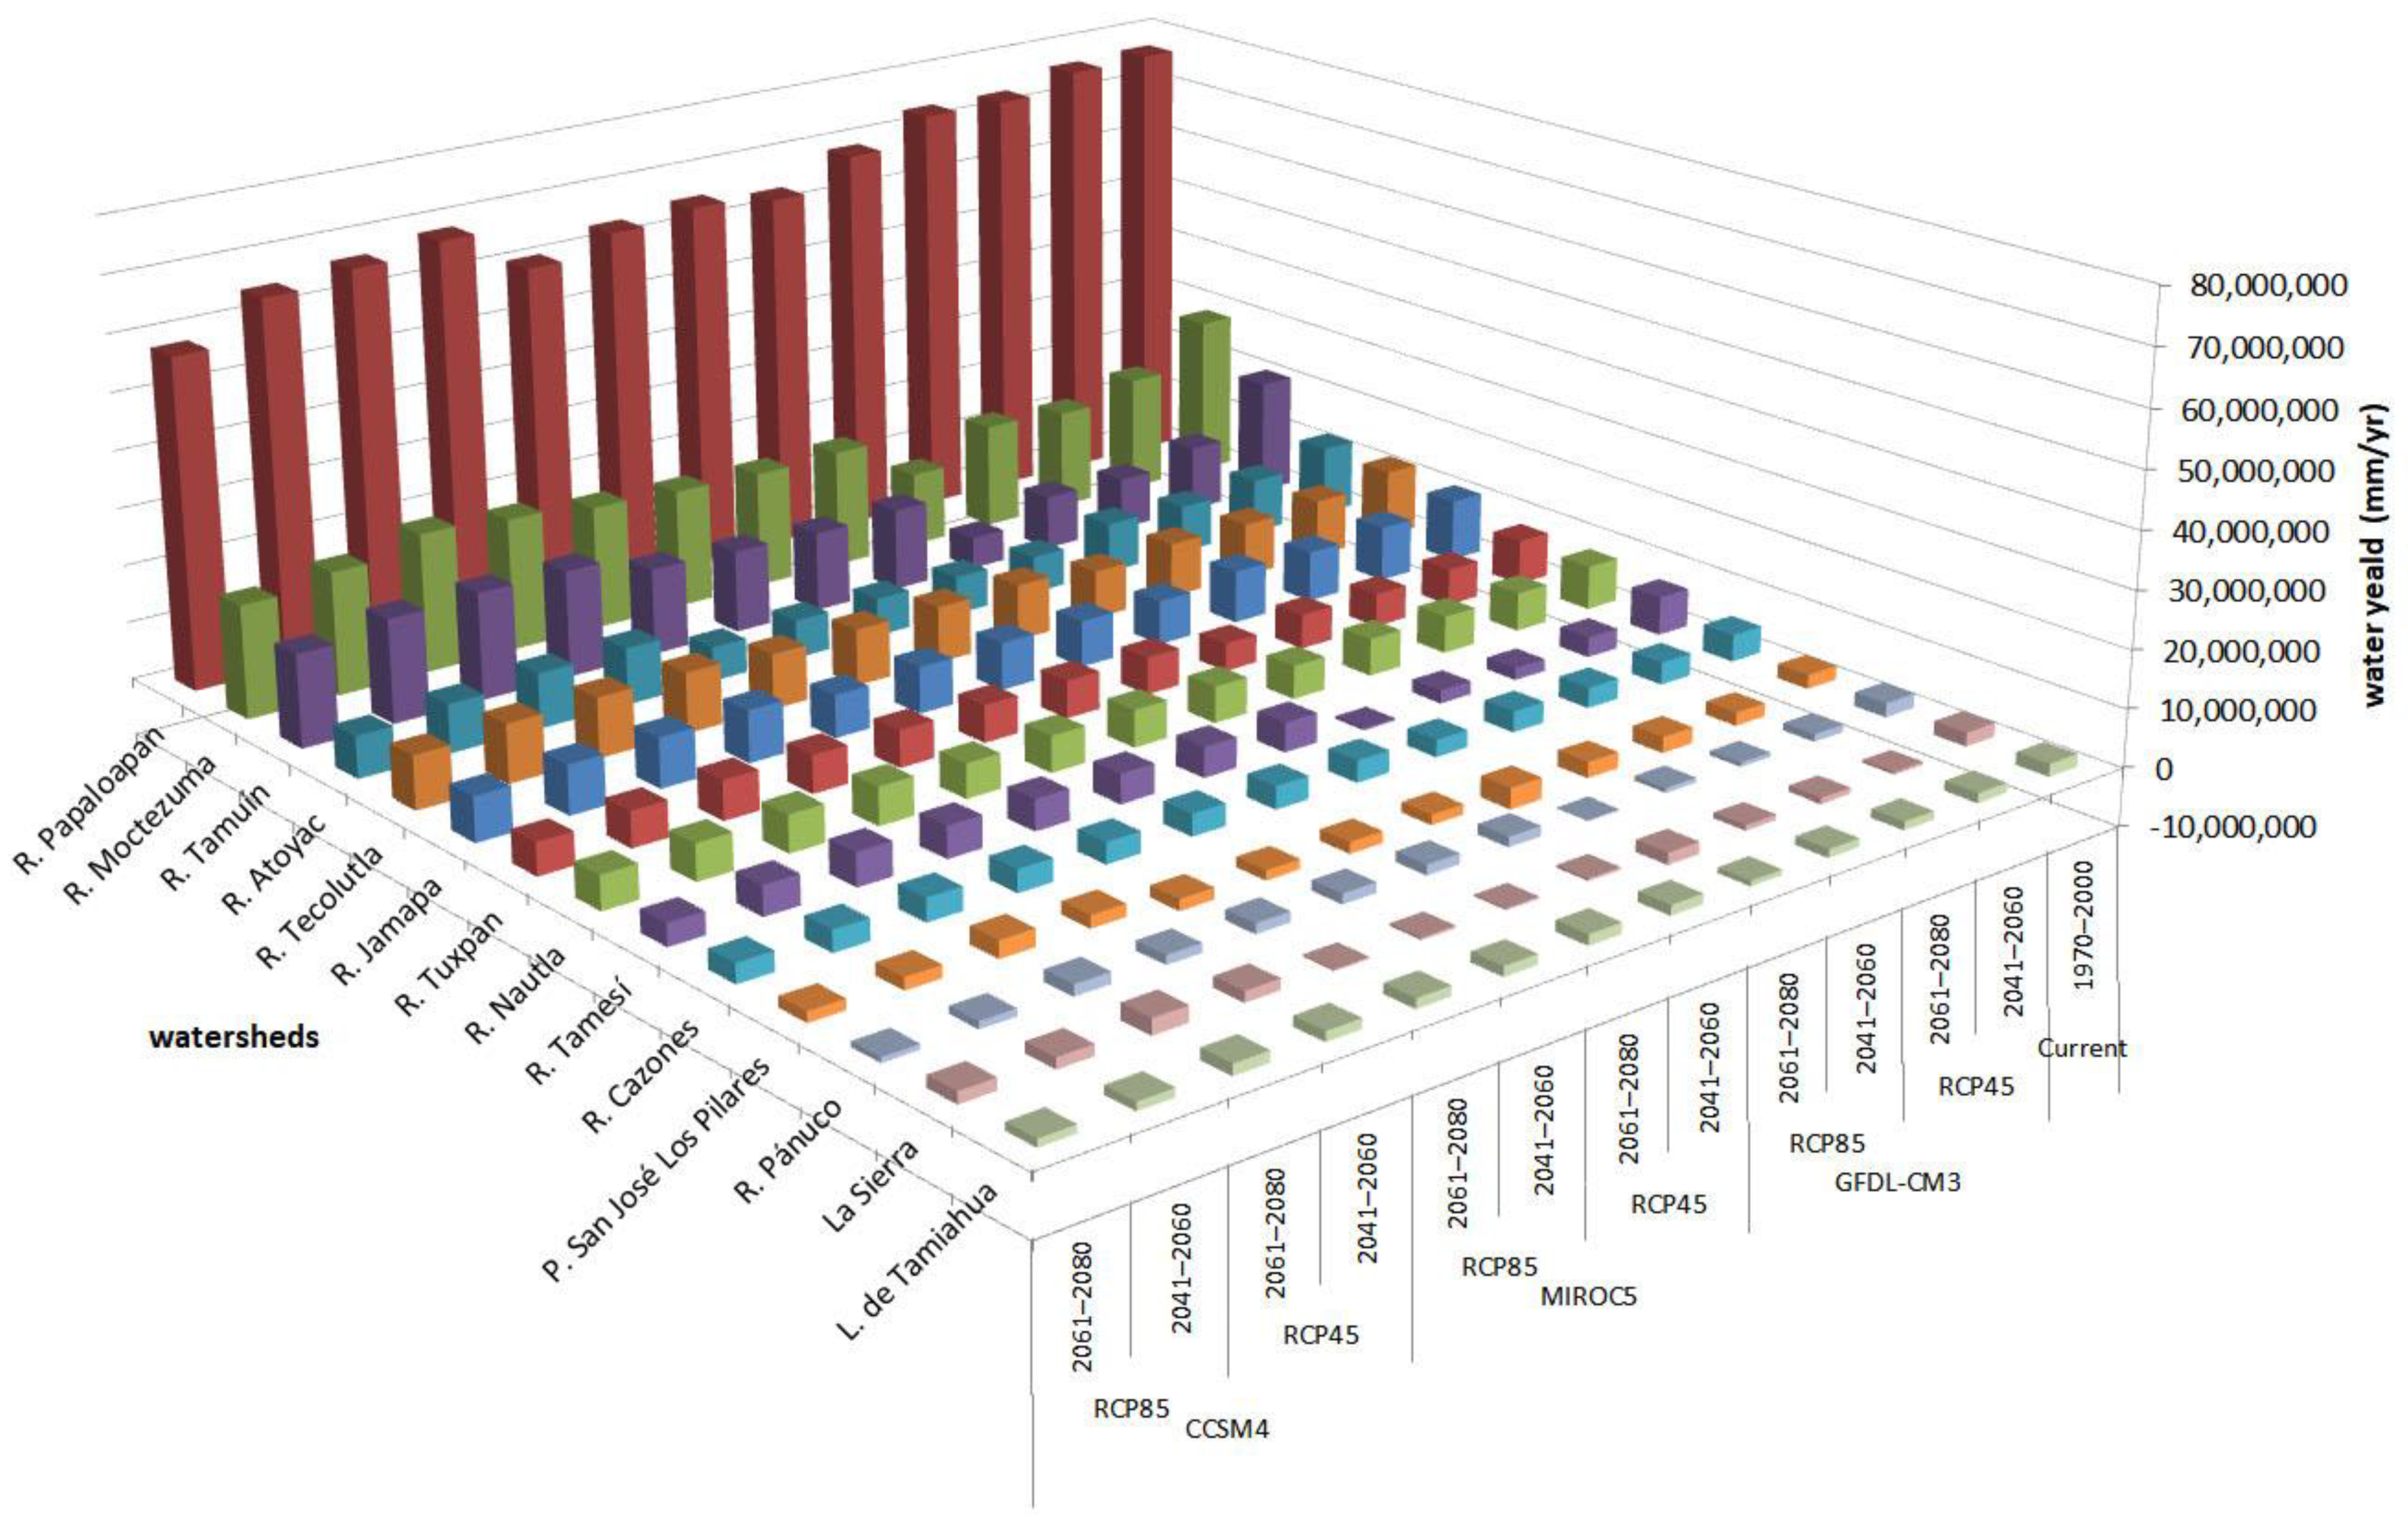
3.2. Climate Change Scenarios
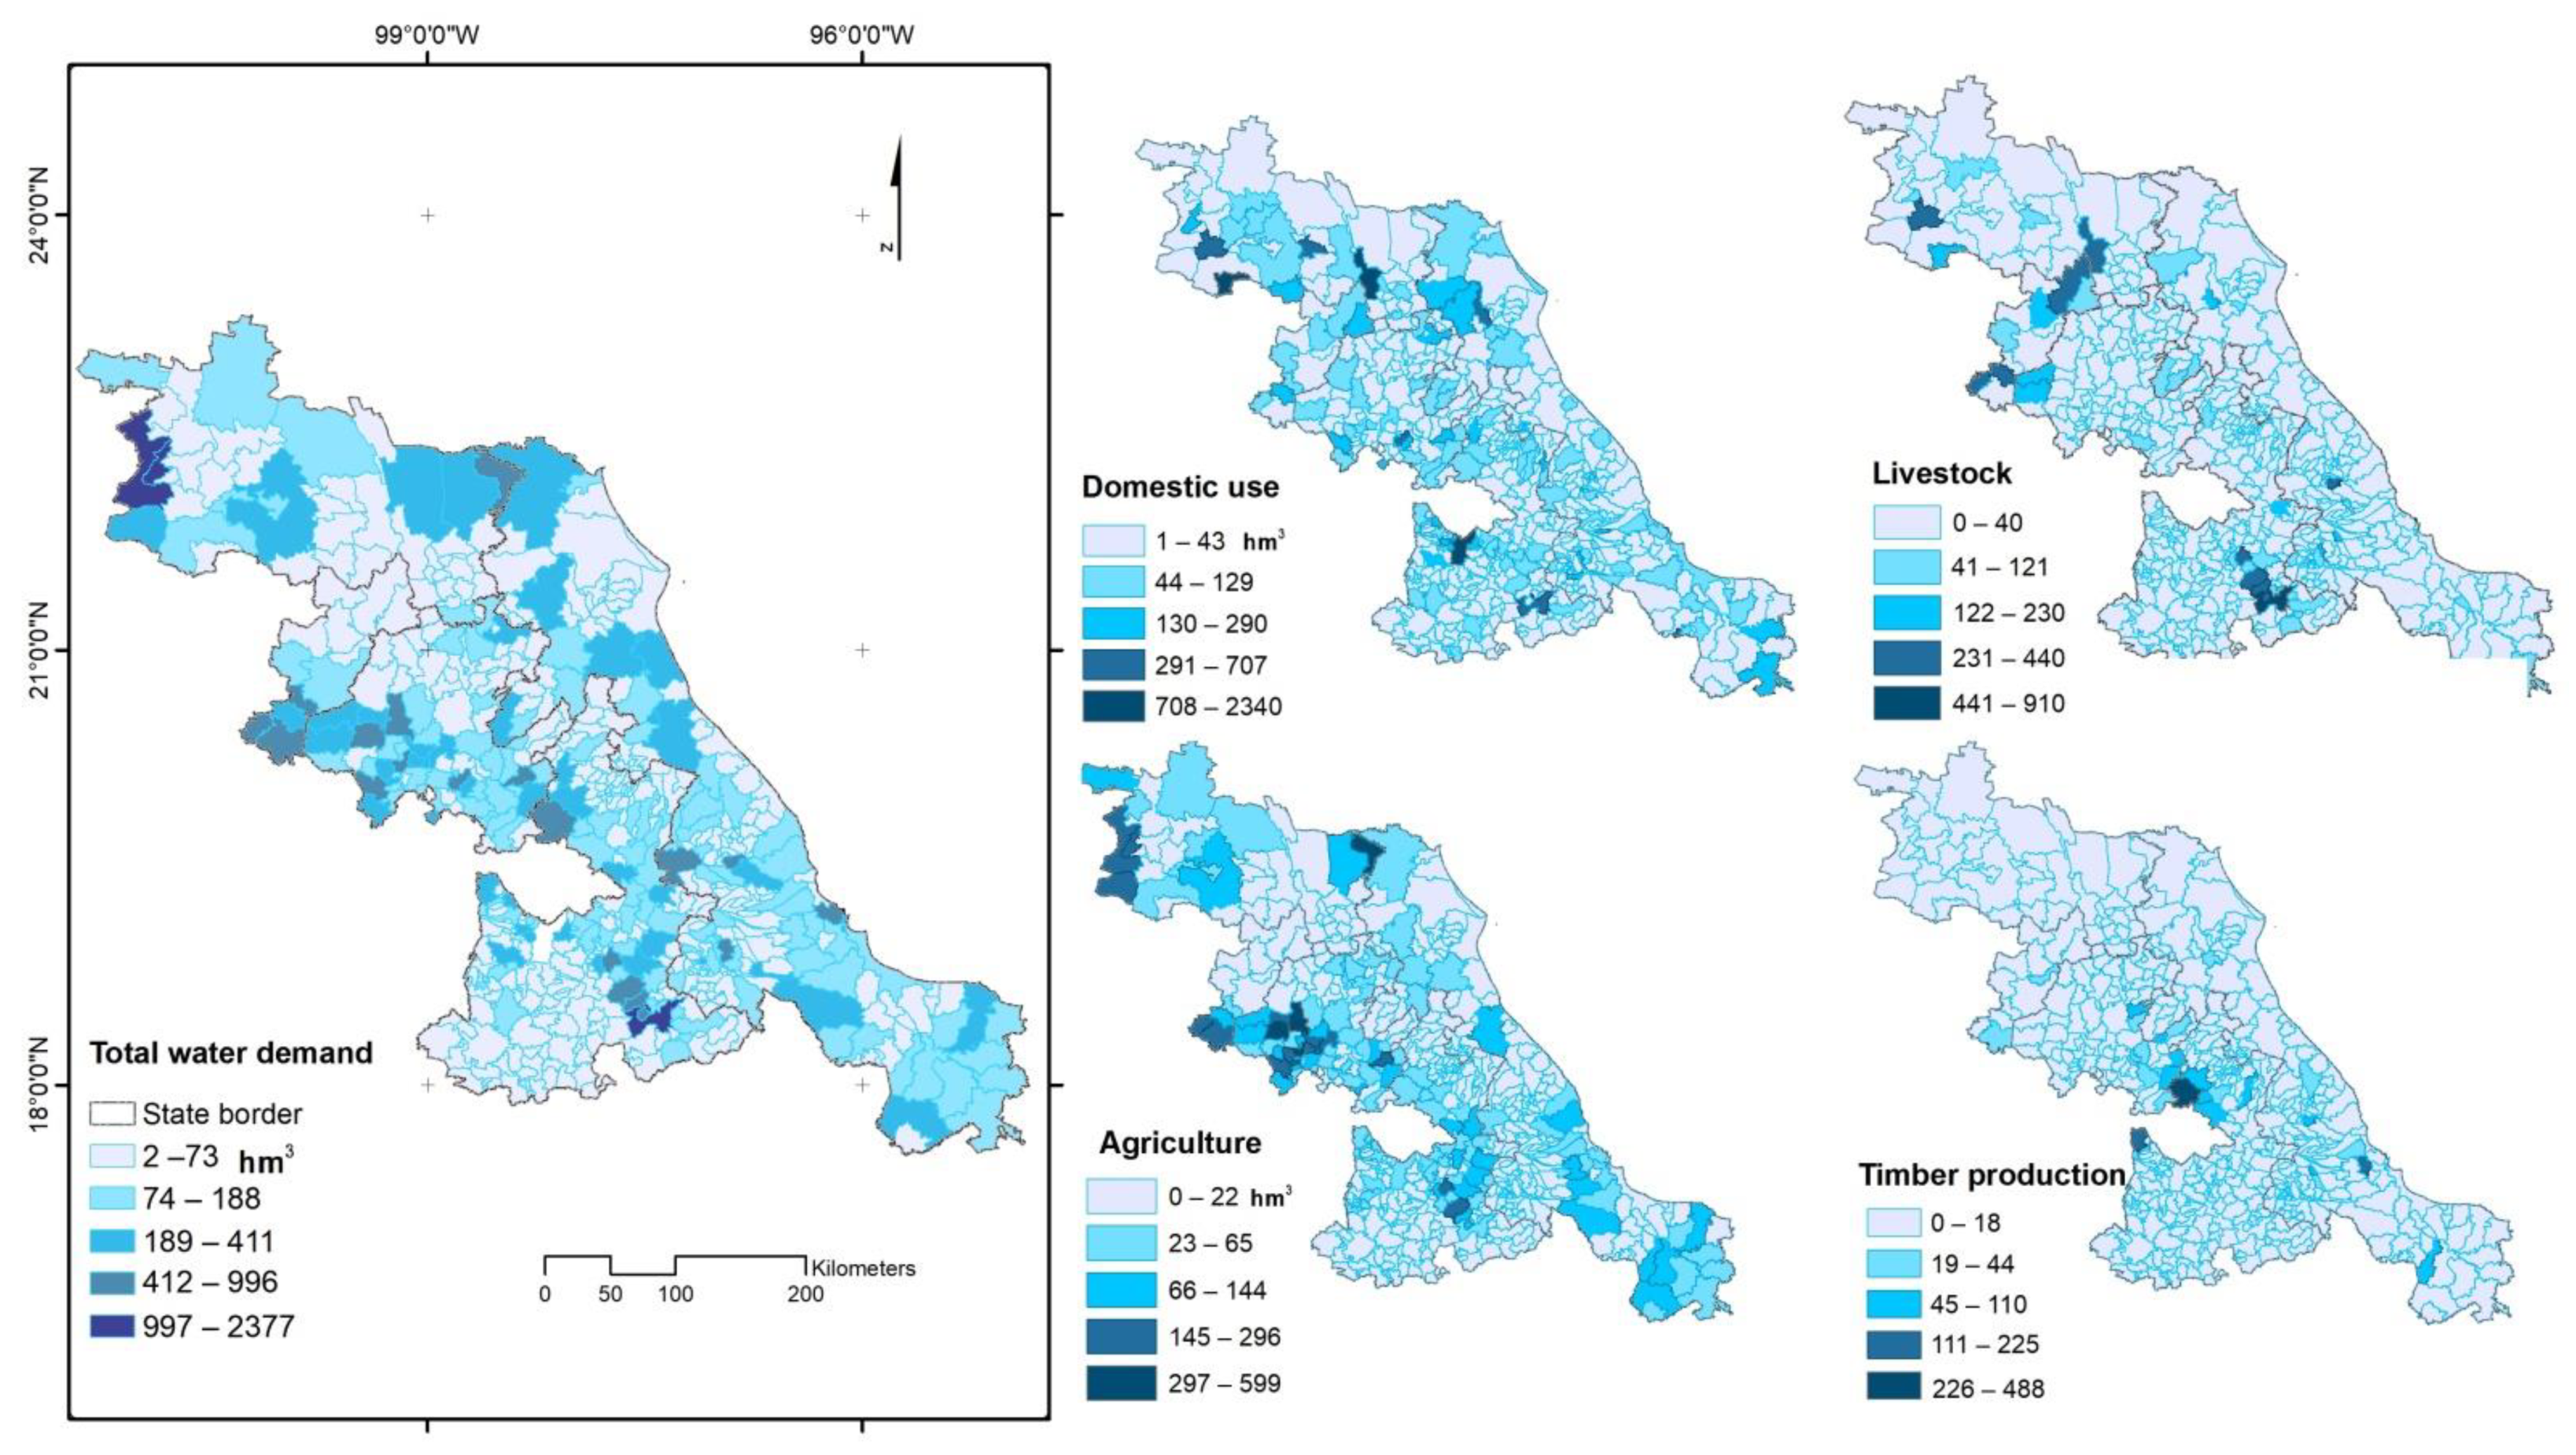
3.3. Water Demand
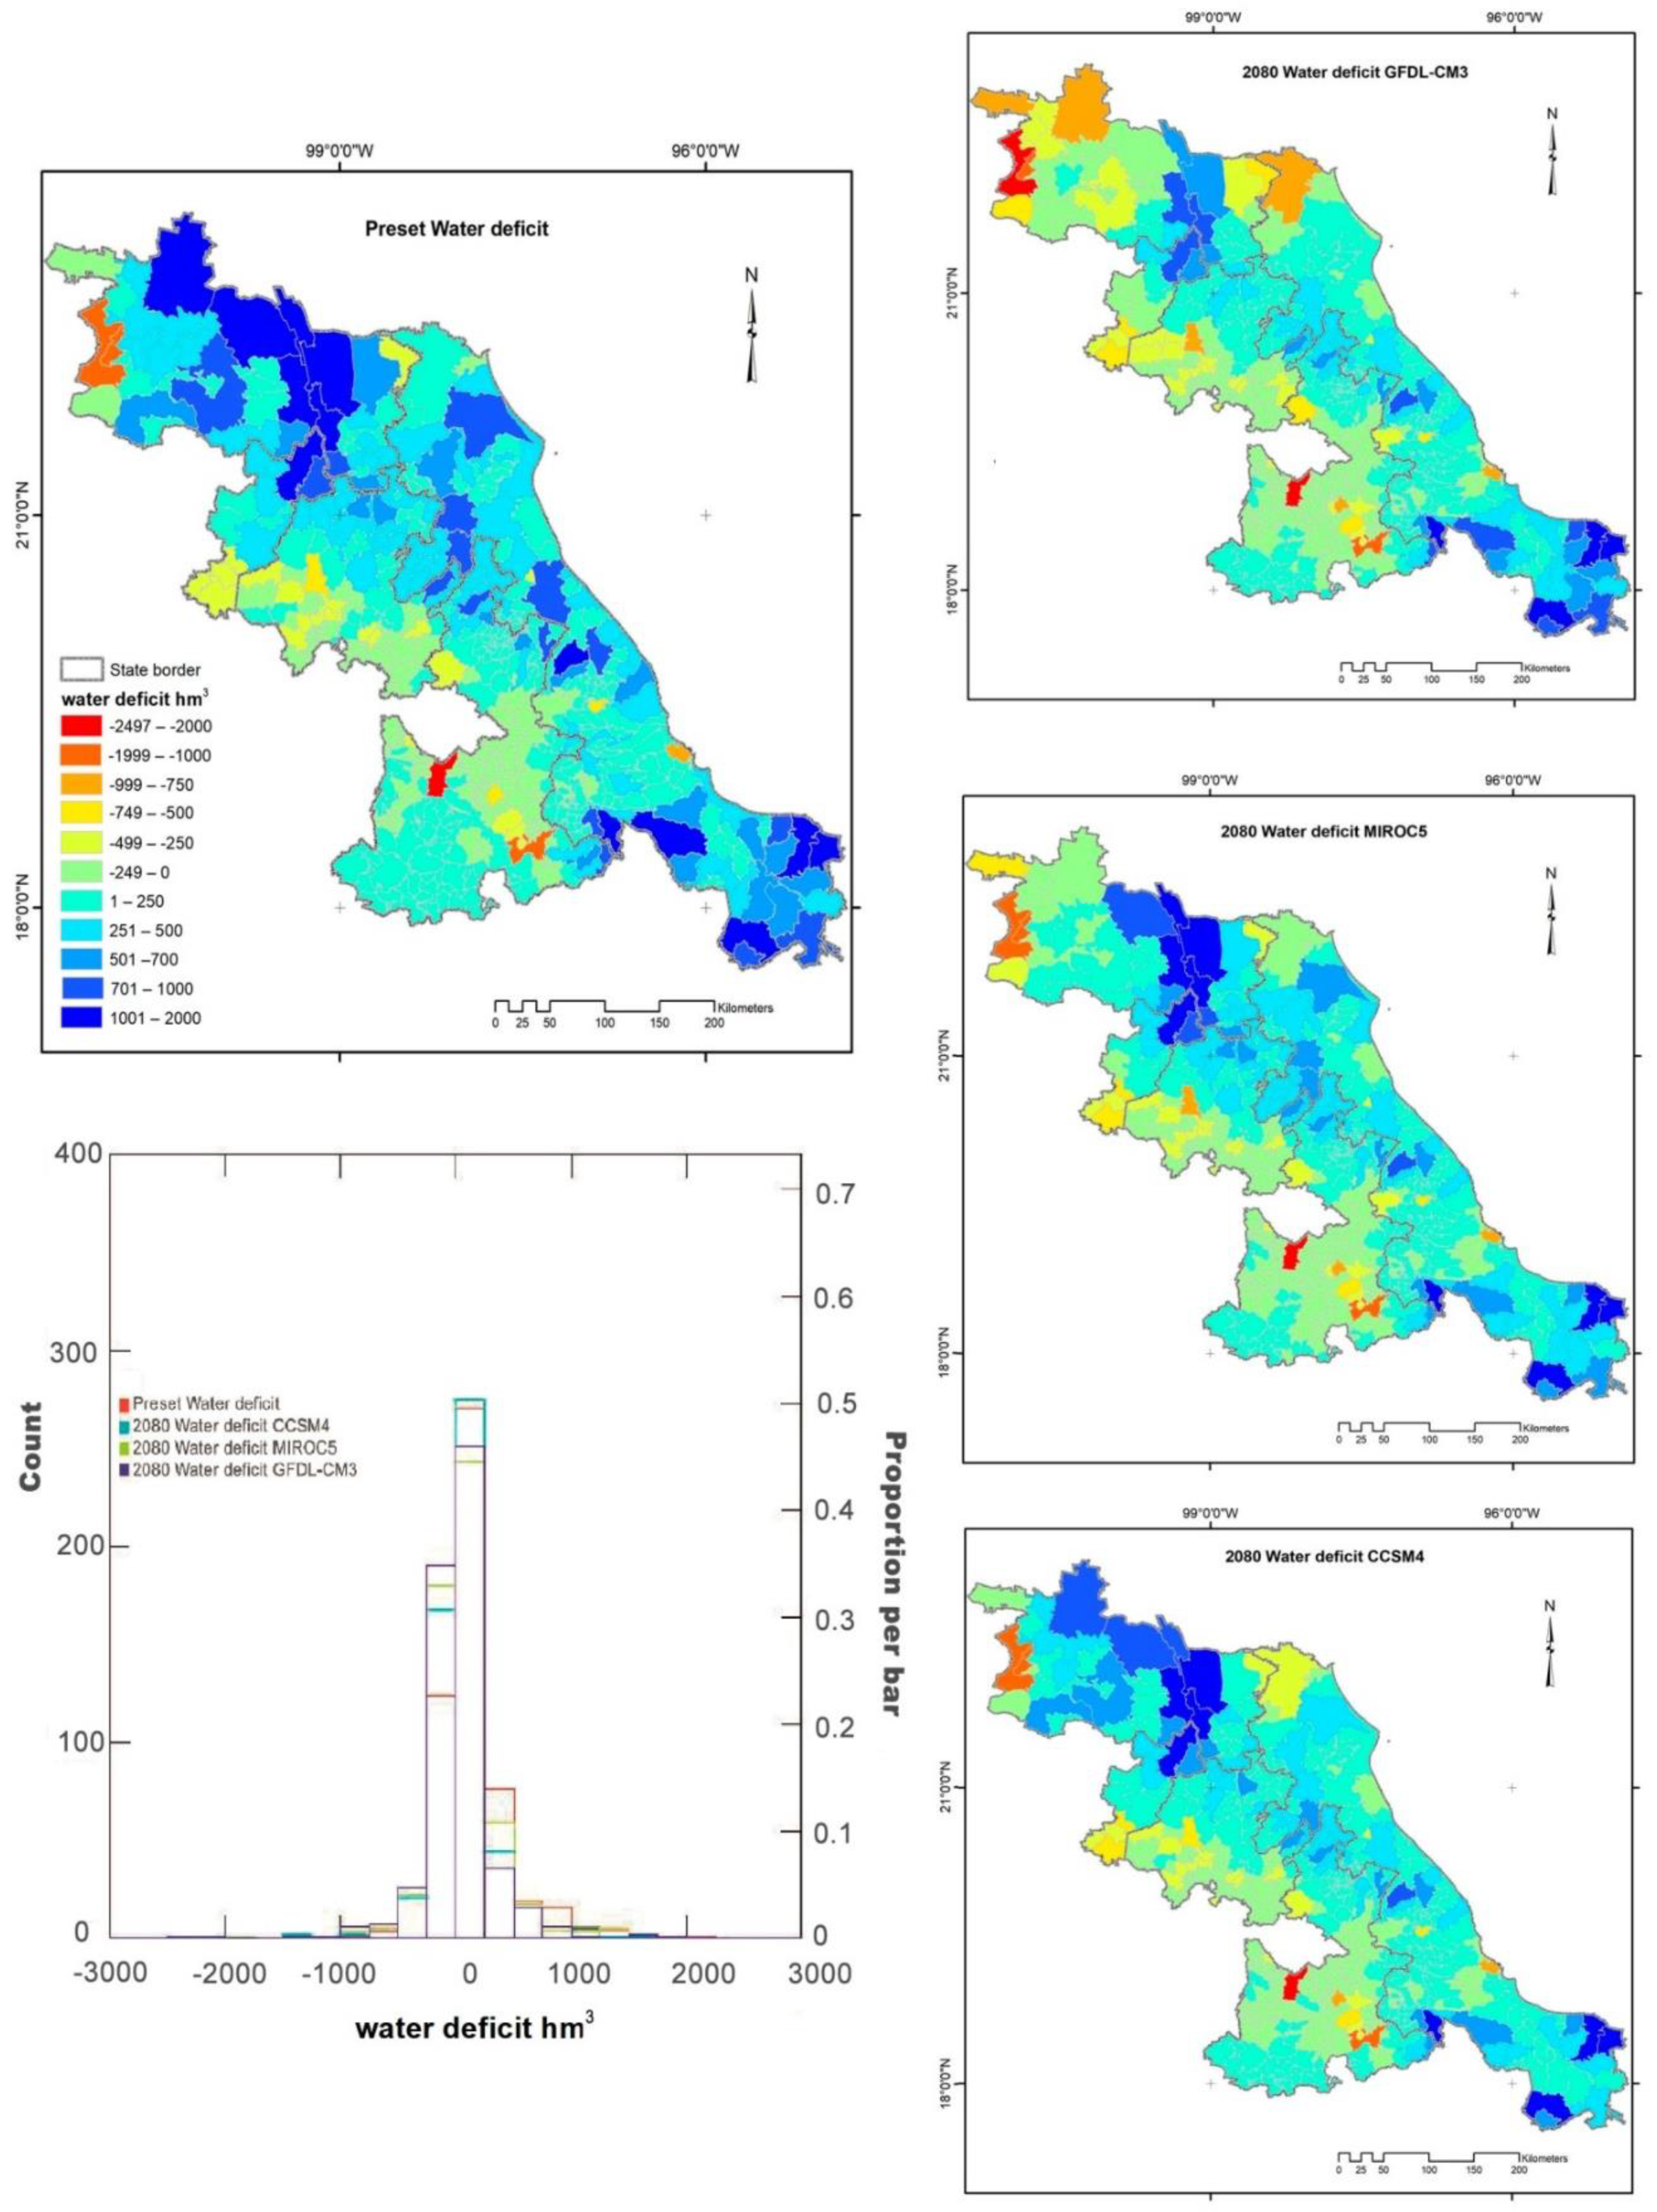
3.4. Water Deficit
4. Discussion
5. Conclusions
- The model that predicts a greater reduction in total water availability was GFDL-CM3 (20–40%), contrasting with the CCSM4, which predicts a lower reduction (15–28%). In the RCP 4.5 scenario, water availability was reduced by between 15% and 26% by 2050 and by 14–29% by 2080, whereas for RCP 8.5, the reduction was greater; 19–26% by 2050 and 25–40% by 2080.
- The greatest demand of water was associated with domestic use (48%), followed by crop agriculture (27%), livestock agriculture (20%), and timber production (5%).
- The results of this study can support water management at the sub-watershed and municipality level. It was seen that 27% of municipalities had a higher water demand than what it is actually available, and this would increase to 39%.
Author Contributions
Funding
Institutional Review Board Statement
Informed Consent Statement
Data Availability Statement
Acknowledgments
Conflicts of Interest
References
- Donat, M.G.; Lowry, A.L.; Alexander, L.V.; O’Gorman, P.A.; Maher, N. More Extreme Precipitation in the World’s Dry and Wet Regions. Nat. Clim. Chang. 2016, 6, 508. [Google Scholar] [CrossRef]
- IPCC (Intergovernmental Panel on Climate Change). Global Warming of 1.5 °C: An IPCC Special Report on the Impacts of Global Warming of 1.5 °C above Pre-Industrial Levels and Related Global Greenhouse Gas Emission Pathways, in the Context of Strengthening the Global Response to the Threat of Climate Change, Sustainable Development, and Efforts to Eradicate Poverty; Intergovernmental Panel on Climate Change: Geneva, Switzerland, 2018.
- Velasco-Muñoz, F.J.; Aznar-Sánchez, A.J.; Belmonte-Ureña, J.L.; Román-Sánchez, M.I. Sustainable Water Use in Agriculture: A Review of Worldwide Research. Sustainability 2018, 10, 1084. [Google Scholar] [CrossRef] [Green Version]
- Parry, M.; Evans, A.; Rosegrant, M.W.; Wheeler, T. Climate Change and Hunger: Responding to the Challenge; International Food Policy Research Institute: Rome, Italy, 2009. [Google Scholar]
- CONAGUA(Comisión Nacional del Agua). Estadísticas del Agua en México; Secretaría de Medio Ambiente y Recursos Naturales: Mexico City, Mexico, 2017.
- WRG (Water Resources Group). Background Impact and Way Forward, impact and the way forward; World Economic Forum: Davos-Klosters, Switzerland, 2012. [Google Scholar]
- Mekonnen, M.M.; Hoekstra, A.Y. The Green, Blue and Grey Water Footprint of Crops and Derived Crop Products. Hydrol. Earth Syst. Sci. 2011, 15, 1577–1600. [Google Scholar] [CrossRef] [Green Version]
- Nelson, E.; Sander, H.; Hawthorne, P.; Conte, M.; Ennaanay, D.; Wolny, S.; Manson, S.; Polasky, S. Projecting Global Land-Use Change and Its Effect on Ecosystem Service Provision and Biodiversity with Simple Models. PLoS ONE 2010, 5, e14327. [Google Scholar] [CrossRef] [Green Version]
- Arreguín-Cortés, F.; López-Pérez, M.; Montero-Martínez, M. Atlas de Vulnerabilidad Hídrica En México Ante el Cambio Climático: Efectos del Cambio Climático en el Recurso Hídrico de México; Instituto Mexicano de Tecnología del Agua: Progreso, Mexico, 2015. [Google Scholar]
- Pinkse, J.; Gasbarro, F. Managing Physical Impacts of Climate Change: An Attentional Perspective on Corporate Adaptation. Bus. Soc. 2019, 58, 333–368. [Google Scholar] [CrossRef]
- INECC (Instituto Nacional de Ecología y Cambio Climático). Variabilidad y Cambio Climático. Impactos, Vulnerabilidad y Adaptación al Cambio Climático En América Latina y El Caribe; INECC: Mexico City, Mexico, 2016. [Google Scholar]
- INEGI (Instituto Nacional de Estadística y Geografía). Censo de Población. Vivienda 2010. Resultados Definitivos; INEGI: Aguascalientes, Mexico, 2011. [Google Scholar]
- Colditz, R.R.; Llamas, R.M.; Ressl, R.A. Detecting Change Areas in Mexico Between 2005 and 2010 Using 250 m MODIS Images. IEEE J. Sel. Top. Appl. Earth Obs. Remote Sens. 2014, 7, 3358–3372. [Google Scholar] [CrossRef]
- Van Soesbergen, A.J.J.; Mulligan, M. Modelling Multiple Threats to Water Security in the Peruvian Amazon Using the WaterWorld Policy Support System. Earth Syst. Dyn. 2014, 5, 55–65. [Google Scholar] [CrossRef] [Green Version]
- Mulligan, M. Documentation for the WaterWorld Model V2. Available online: http://www.policysupport.org/waterworld (accessed on 16 July 2018).
- Mulligan, M. WaterWorld: A Self-Parameterising, Physically Based Model for Application in Data-Poor but Problem-Rich Environments Globally. Hydrol. Res. 2013, 44, 748. [Google Scholar] [CrossRef]
- Sokolov, A.A. Métodos de Cálculo Del Balance Hídrico Guía Internacional de Investigación y Métodos; Instituto de Hidrología de España: Madrid, Spain; UNESCO: Paris, France, 1981. [Google Scholar]
- Hansen, M.C.; Potapov, P.V.; Moore, R.; Hancher, M.; Turubanova, S.A.; Tyukavina, A.; Thau, D.; Stehman, S.V.; Goetz, S.J.; Loveland, T.R.; et al. High-Resolution Global Maps of 21st-Century Forest Cover Change. Science 2013, 342, 850–853. [Google Scholar] [CrossRef] [Green Version]
- Fick, S.E.; Hijmans, R.J. WorldClim 2: New 1 km Spatial Resolution Climate Surfaces for Global Land Areas. Int. J. Climatol. 2017, 37, 4302–4315. [Google Scholar] [CrossRef]
- INEGI. Censo de Población y Vivienda 2010a. Principales Resultados Por Localidad (ITER); INEGI: Aguascalientes, Mexico, 2010. [Google Scholar]
- Drechsel, P.; Cofie, O.O.; Amoah, P. Thirsty cities: The urban water footprint and the peri-urban interface, a four city case study from West Africa. In The Security of Water, Food, Energy and Liveability of Cities; Springer: Berlin/Heidelberg, Germany, 2014; pp. 113–120. [Google Scholar]
- Peréz-Espejo, R.H.; Constantino-Toto, R.M.; Dávila-Ibanez, H.R. Water, Food and Welfare: Water Footprint as a Complementary Approach to Water Management in Mexico; Springer: Berlin/Heidelberg, Germany, 2016; Volume 23, ISBN 3-319-28824-5. [Google Scholar]
- SIMBAD-INEGI Sistema Municipal de Bases de Datos. Available online: https://sc.inegi.org.mx/sistemas/cobdem/ (accessed on 1 November 2018). (In Spanish).
- Agroder. Huella Hídrica En México En El Contexto de Norteamérica; WWF México: Mexico City, Mexico, 2012. [Google Scholar]
- FAO. Métodos Simples Para Fabricar Carbón Vegetal; Estudio FAO: Rome, Italy, 1983. [Google Scholar]
- Schyns, J.F.; Booij, M.J.; Hoekstra, A.Y. The Water Footprint of Wood for Lumber, Pulp, Paper, Fuel and Firewood. Adv. Water Resour. 2017, 107, 490–501. [Google Scholar] [CrossRef]
- Conde, C.; Estrada, F.; Martínez, B.; Sánchez, O.; Gay, C. Regional Climate Change Scenarios for México. Atmósfera 2011, 24, 125–140. [Google Scholar]
- Anderegg, W.R.; Schwalm, C.; Biondi, F.; Camarero, J.J.; Koch, G.; Litvak, M.; Ogle, K.; Shaw, J.D.; Shevliakova, E.; Williams, A. Pervasive Drought Legacies in Forest Ecosystems and Their Implications for Carbon Cycle Models. Science 2015, 349, 528–532. [Google Scholar] [CrossRef] [Green Version]
- Colorado-Ruiz, G.; Cavazos, T.; Salinas, J.A.; De Grau, P.; Ayala, R. Climate Change Projections from Coupled Model Intercomparison Project Phase 5 Multi-model Weighted Ensembles for Mexico, the North American Monsoon, and the Mid-summer Drought Region. Int. J. Climatol. 2018, 38, 5699–5716. [Google Scholar] [CrossRef]
- Pachauri, R.K.; Meyer, L.; Plattner, G.-K.; Stocker, T. IPCC, 2014: Climate Change 2014: Synthesis Report. Contribution of Working Groups I, II and III to the Fifth Assessment Report of the Intergovernmental Panel on Climate Change; IPCC: Geneva, Switzerland, 2015; ISBN 92-9169-143-7.
- Moss, R.H.; Edmonds, J.A.; Hibbard, K.A.; Manning, M.R.; Rose, S.K.; Van Vuuren, D.P.; Carter, T.R.; Emori, S.; Kainuma, M.; Kram, T. The next Generation of Scenarios for Climate Change Research and Assessment. Nature 2010, 463, 747–756. [Google Scholar] [CrossRef]
- Stockhause, M.; Höck, H.; Toussaint, F.; Lautenschlager, M. Quality Assessment Concept of the World Data Center for Climate and Its Application to CMIP5 Data. Geosci. Model Dev. 2012, 5, 1023. [Google Scholar] [CrossRef] [Green Version]
- Guppy, L.; Anderson, K. Water Crisis Report; United Nations University Institute for Water, Environment and Health: Hamilton, ON, Canada, 2017. [Google Scholar]
- United Nations Water Goal 6: Ensure Access to Water and Sanitation for All. Available online: https://www.un.org/sustainabledevelopment/water-and-sanitation/ (accessed on 16 June 2019).
- Verhagen, W.; Kukkala, A.S.; Moilanen, A.; van Teeffelen, A.J.; Verburg, P.H. Use of Demand for and Spatial Flow of Ecosystem Services to Identify Priority Areas. Conserv. Biol. 2017, 31, 860–871. [Google Scholar] [CrossRef]
- Herrero, M.; Thornton, P.K.; Power, B.; Bogard, J.R.; Remans, R.; Fritz, S.; Gerber, J.S.; Nelson, G.; See, L.; Waha, K. Farming and the Geography of Nutrient Production for Human Use: A Transdisciplinary Analysis. Lancet Planet. Health 2017, 1, e33–e42. [Google Scholar] [CrossRef] [Green Version]
- Veldkamp, T.I.E.; Wada, Y.; Aerts, J.C.J.H.; Döll, P.; Gosling, S.N.; Liu, J.; Masaki, Y.; Oki, T.; Ostberg, S.; Pokhrel, Y.; et al. Water Scarcity Hotspots Travel Downstream Due to Human Interventions in the 20th and 21st Century. Nat. Commun. 2017, 8, 15697. [Google Scholar] [CrossRef]
- Da Silva, V.D.P.R.; De Oliveira, S.D.; Hoekstra, A.Y.; Dantas Neto, J.; Campos, J.H.B.; Braga, C.C.; De Araújo, L.E.; Aleixo, D.D.O.; De Brito, J.I.B.; De Souza, M.D. Water Footprint and Virtual Water Trade of Brazil. Water 2016, 8, 517. [Google Scholar] [CrossRef] [Green Version]
- FAO (Food and Agriculture Organization). Estadísticas Clave Sobre Recursos Hídricos de AQUASTAT. Available online: http://www.fao.org/aquastat/es/databases/ (accessed on 16 July 2018).
- UNDESA(United Nations, Department of Economic and Social Affairs). World Population Prospects: The 2017 Revision; United Nations: New York, NY, USA, 2017. [Google Scholar]
- Naumann, G.; Alfieri, L.; Wyser, K.; Mentaschi, L.; Betts, R.A.; Carrao, H.; Spinoni, J.; Vogt, J.; Feyen, L. Global Changes in Drought Conditions Under Different Levels of Warming. Geophys. Res. Lett. 2018, 45, 3285–3296. [Google Scholar] [CrossRef]
- Romano, O.; Akhmouch, A. Water Governance in Cities: Current Trends and Future Challenges. Water 2019, 11, 500. [Google Scholar] [CrossRef] [Green Version]
- Chamizo-Checa, S.; Otazo-Sánchez, E.; Gordillo-Martínez, A.; Suárez-Sánchez, J.; González-Ramírez, C.; Muñoz-Nava, H. Megacity Wastewater Poured into A Nearby Basin: Looking for Sustainable Scenarios in A Case Study. Water 2020, 12, 824. [Google Scholar] [CrossRef] [Green Version]
- Joshi, N.; Tamaddun, K.; Parajuli, R.; Kalra, A.; Maheshwari, P.; Mastino, L.; Velotta, M. Future Changes in Water Supply and Demand for Las Vegas Valley: A System Dynamic Approach Based on CMIP3 and CMIP5 Climate Projections. Hydrology 2020, 7, 16. [Google Scholar] [CrossRef] [Green Version]
- Tamaddun, K.A.; Kalra, A.; Kumar, S.; Ahmad, S. CMIP5 Models’ Ability to Capture Observed Trends under the Influence of Shifts and Persistence: An In-Depth Study on the Colorado River Basin. J. Appl. Meteorol. Climatol. 2019, 58, 1677–1688. [Google Scholar] [CrossRef]
- Brekke, L.; Thrasher, B.L.; Maurer, E.P.; Pruitt, T. Downscaled CMIP3 and CMIP5 Climate Projections: Release of Downscaled CMIP5 Climate Projections, Comparison with Preceding Information, and Summary of User Needs; US Department of the Interior, Bureau of Reclamation, Technical Service Center: Denver, CO, USA, 2013. [Google Scholar]
- Khan, N.; Shahid, S.; Ahmed, K.; Ismail, T.; Nawaz, N.; Son, M. Performance Assessment of General Circulation Model in Simulating Daily Precipitation and Temperature Using Multiple Gridded Datasets. Water 2018, 10, 1793. [Google Scholar] [CrossRef] [Green Version]
- Bijl, D.L.; Biemans, H.; Bogaart, P.W.; Dekker, S.C.; Doelman, J.C.; Stehfest, E.; van Vuuren, D.P. A Global Analysis of Future Water Deficit Based on Different Allocation Mechanisms. Water Resour. Res. 2018, 54, 5803–5824. [Google Scholar] [CrossRef] [Green Version]
- Ruckelshaus, M.; McKenzie, E.; Tallis, H.; Guerry, A.; Daily, G.; Kareiva, P.; Polasky, S.; Ricketts, T.; Bhagabati, N.; Wood, S.A.; et al. Notes from the Field: Lessons Learned from Using Ecosystem Service Approaches to Inform Real-World Decisions. Ecol. Econ. 2015, 115, 11–21. [Google Scholar] [CrossRef] [Green Version]
- Runting, R.K.; Bryan, B.A.; Dee, L.E.; Maseyk, F.J.; Mandle, L.; Hamel, P.; Wilson, K.A.; Yetka, K.; Possingham, H.P.; Rhodes, J.R. Incorporating Climate Change into Ecosystem Service Assessments and Decisions: A Review. Glob. Chang. Biol. 2017, 23, 28–41. [Google Scholar] [CrossRef] [PubMed] [Green Version]


| Products | m3/Ton/Year | Products | m3/Ton/Year |
|---|---|---|---|
| Bovine meat | 13,500 | Alfalfa | 676 |
| Goat meat | 10,252 | Oats | 1788 |
| Chicken meat | 2977 | Jalapeño pepper | 379 |
| Turkey meat | 2977 | Bean | 3177 |
| Sheep meat | 16,875 | Corn grain | 1744 |
| Pig meat | 6559 | Pastures | 450 |
| Wax | 2967 | Sorghum grain | 1212 |
| Eggs | 4277 | Red tomato | 2755 |
| Honey | 1563 | Green tomato | 2140 |
| Wood | 1116 |
Publisher’s Note: MDPI stays neutral with regard to jurisdictional claims in published maps and institutional affiliations. |
© 2021 by the authors. Licensee MDPI, Basel, Switzerland. This article is an open access article distributed under the terms and conditions of the Creative Commons Attribution (CC BY) license (http://creativecommons.org/licenses/by/4.0/).
Share and Cite
Bravo-Cadena, J.; Pavón, N.P.; Balvanera, P.; Sánchez-Rojas, G.; Razo-Zarate, R. Water Availability–Demand Balance under Climate Change Scenarios in an Overpopulated Region of Mexico. Int. J. Environ. Res. Public Health 2021, 18, 1846. https://0-doi-org.brum.beds.ac.uk/10.3390/ijerph18041846
Bravo-Cadena J, Pavón NP, Balvanera P, Sánchez-Rojas G, Razo-Zarate R. Water Availability–Demand Balance under Climate Change Scenarios in an Overpopulated Region of Mexico. International Journal of Environmental Research and Public Health. 2021; 18(4):1846. https://0-doi-org.brum.beds.ac.uk/10.3390/ijerph18041846
Chicago/Turabian StyleBravo-Cadena, Jessica, Numa P. Pavón, Patricia Balvanera, Gerardo Sánchez-Rojas, and Ramón Razo-Zarate. 2021. "Water Availability–Demand Balance under Climate Change Scenarios in an Overpopulated Region of Mexico" International Journal of Environmental Research and Public Health 18, no. 4: 1846. https://0-doi-org.brum.beds.ac.uk/10.3390/ijerph18041846