
Expression Profiling Identifies TWIST2 Target Genes in Setleis Syndrome Patient Fibroblast and Lymphoblast Cells †

 ,
,  ,
,
Abstract
:1. Introduction
2. Materials and Methods
2.1. Sample Collection and Primary Cell Cultures
2.2. RNA Extraction and Integrity Determination
2.3. Microarray Analysis
2.4. Real Time PCR Validation
3. Results
3.1. Gene Expression Profiles of Fibroblast and Lymphoblastoid Cell Lines from SS Patients and Normal Controls
3.1.1. Fibroblasts
3.1.2. Lymphoblasts
3.2. Quantitative RT-PCR Validation for Target Genes in SS Patient and Control Cell Lines
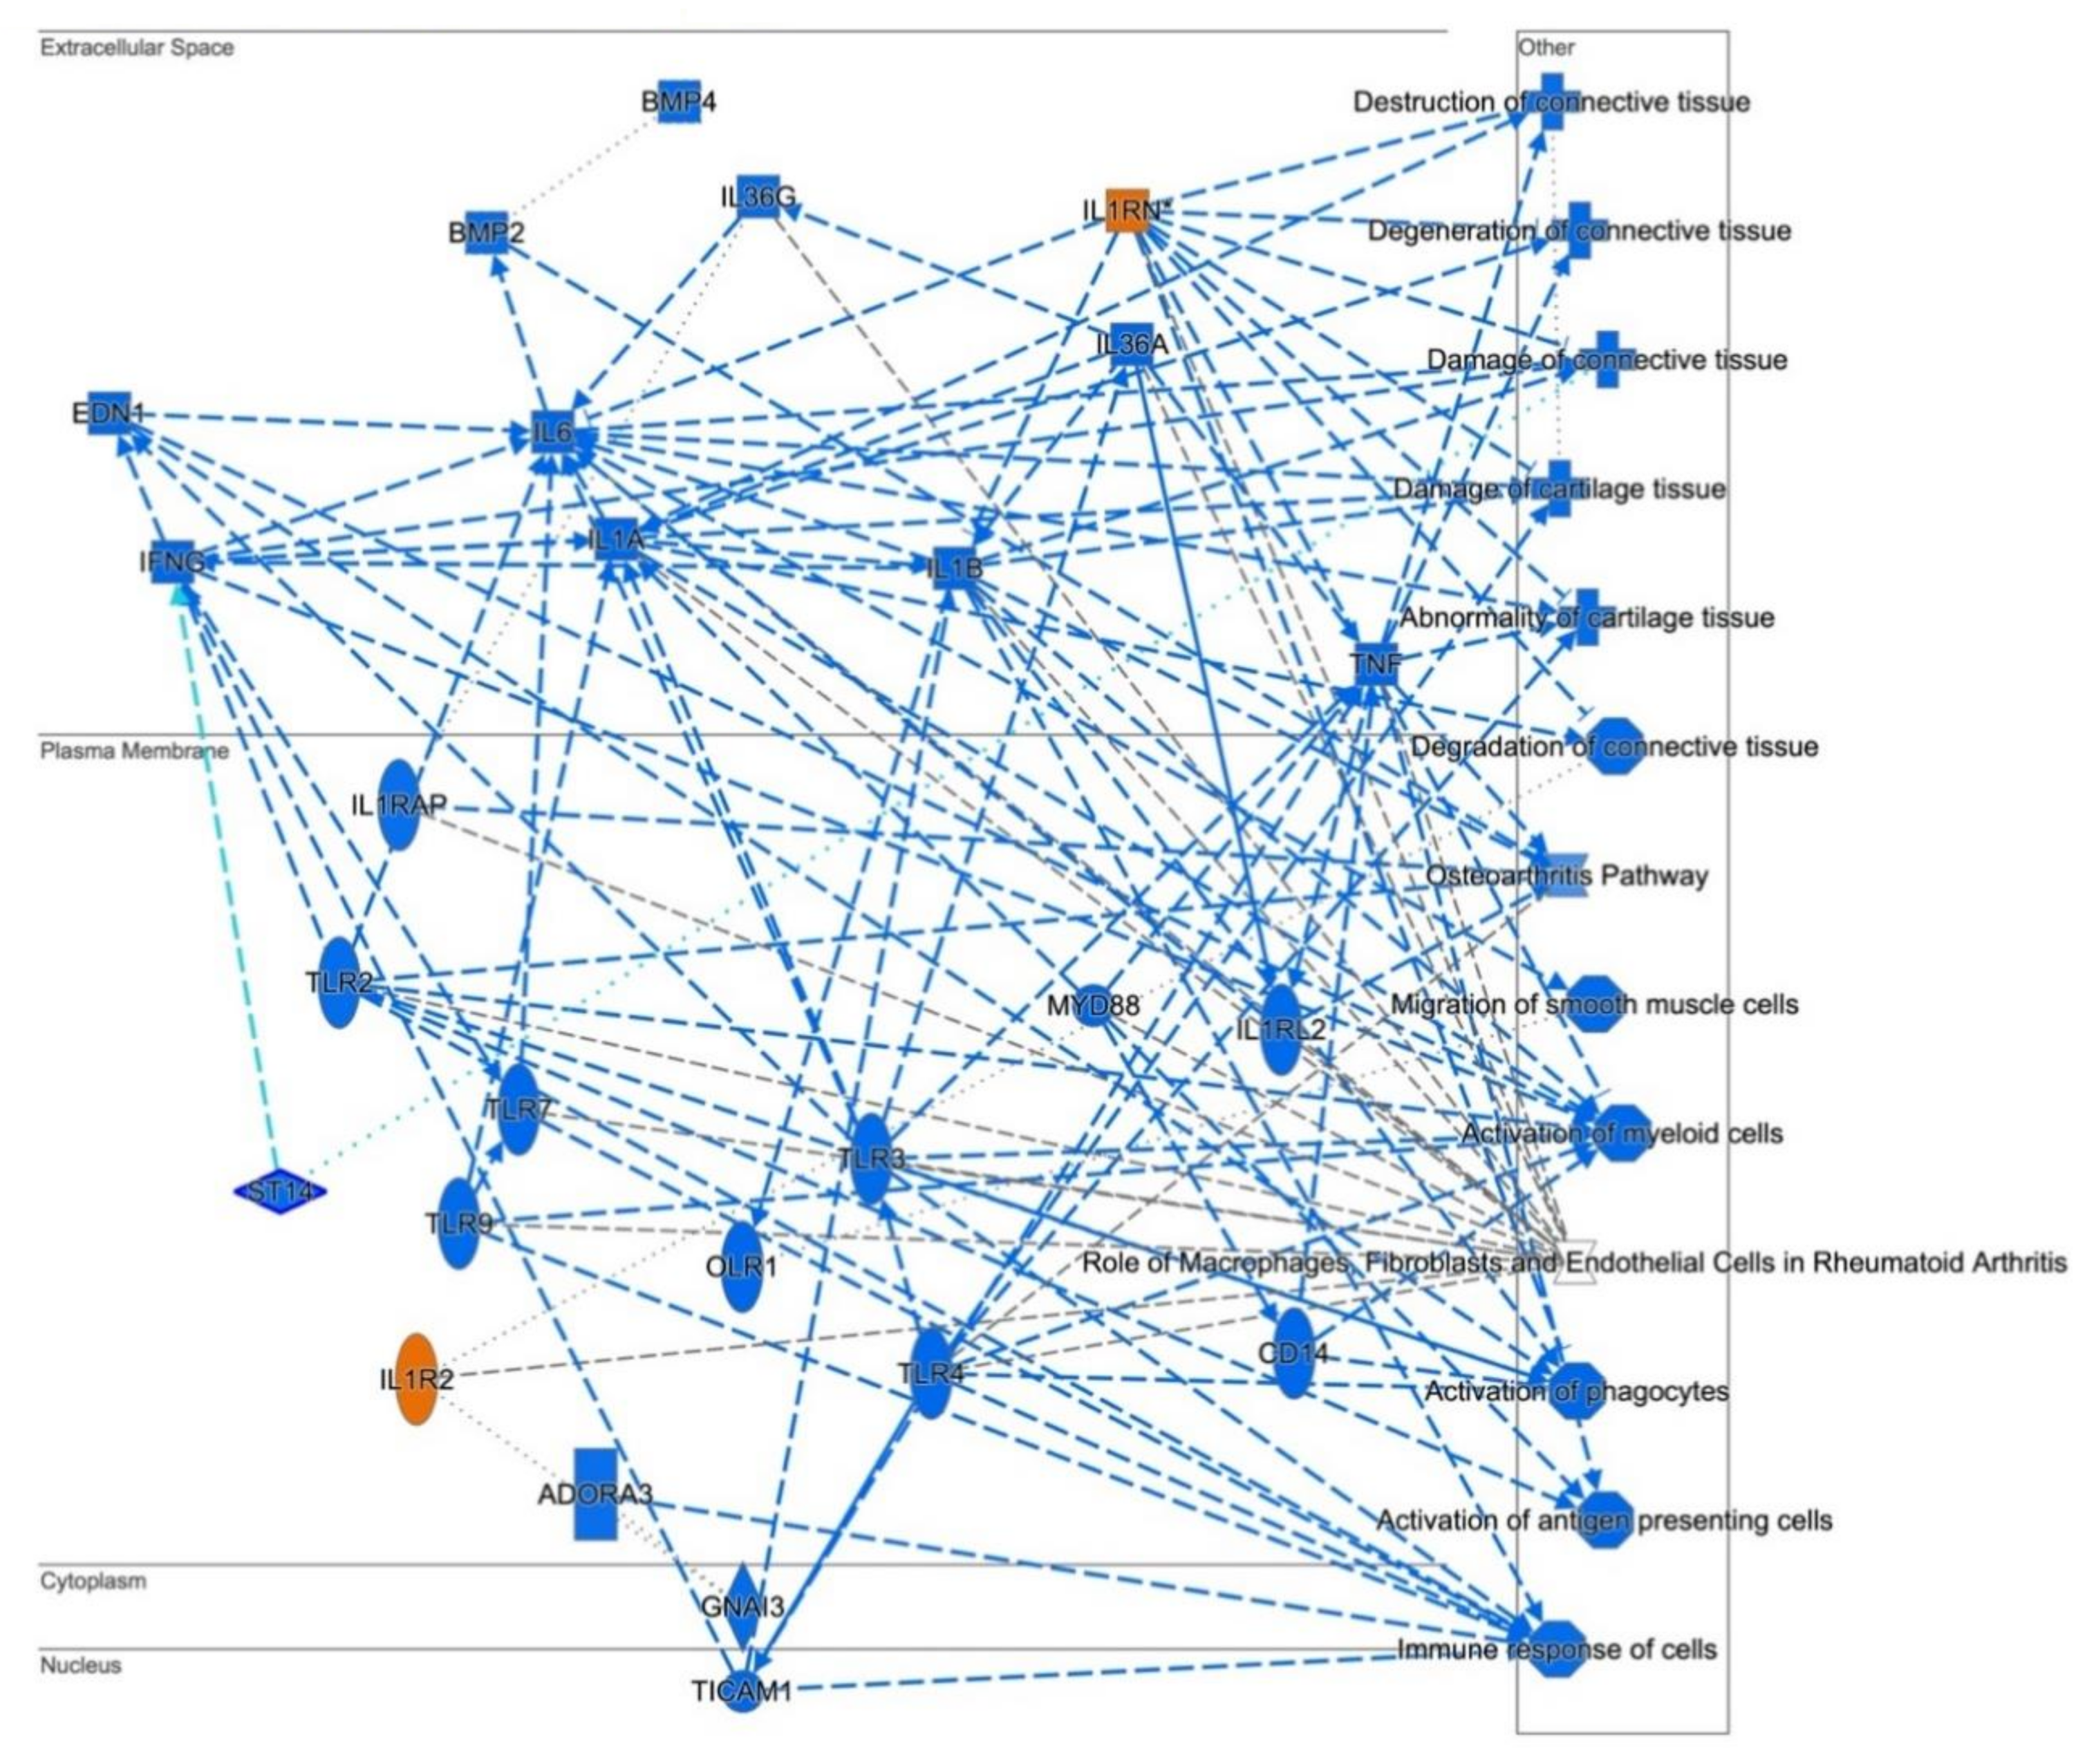
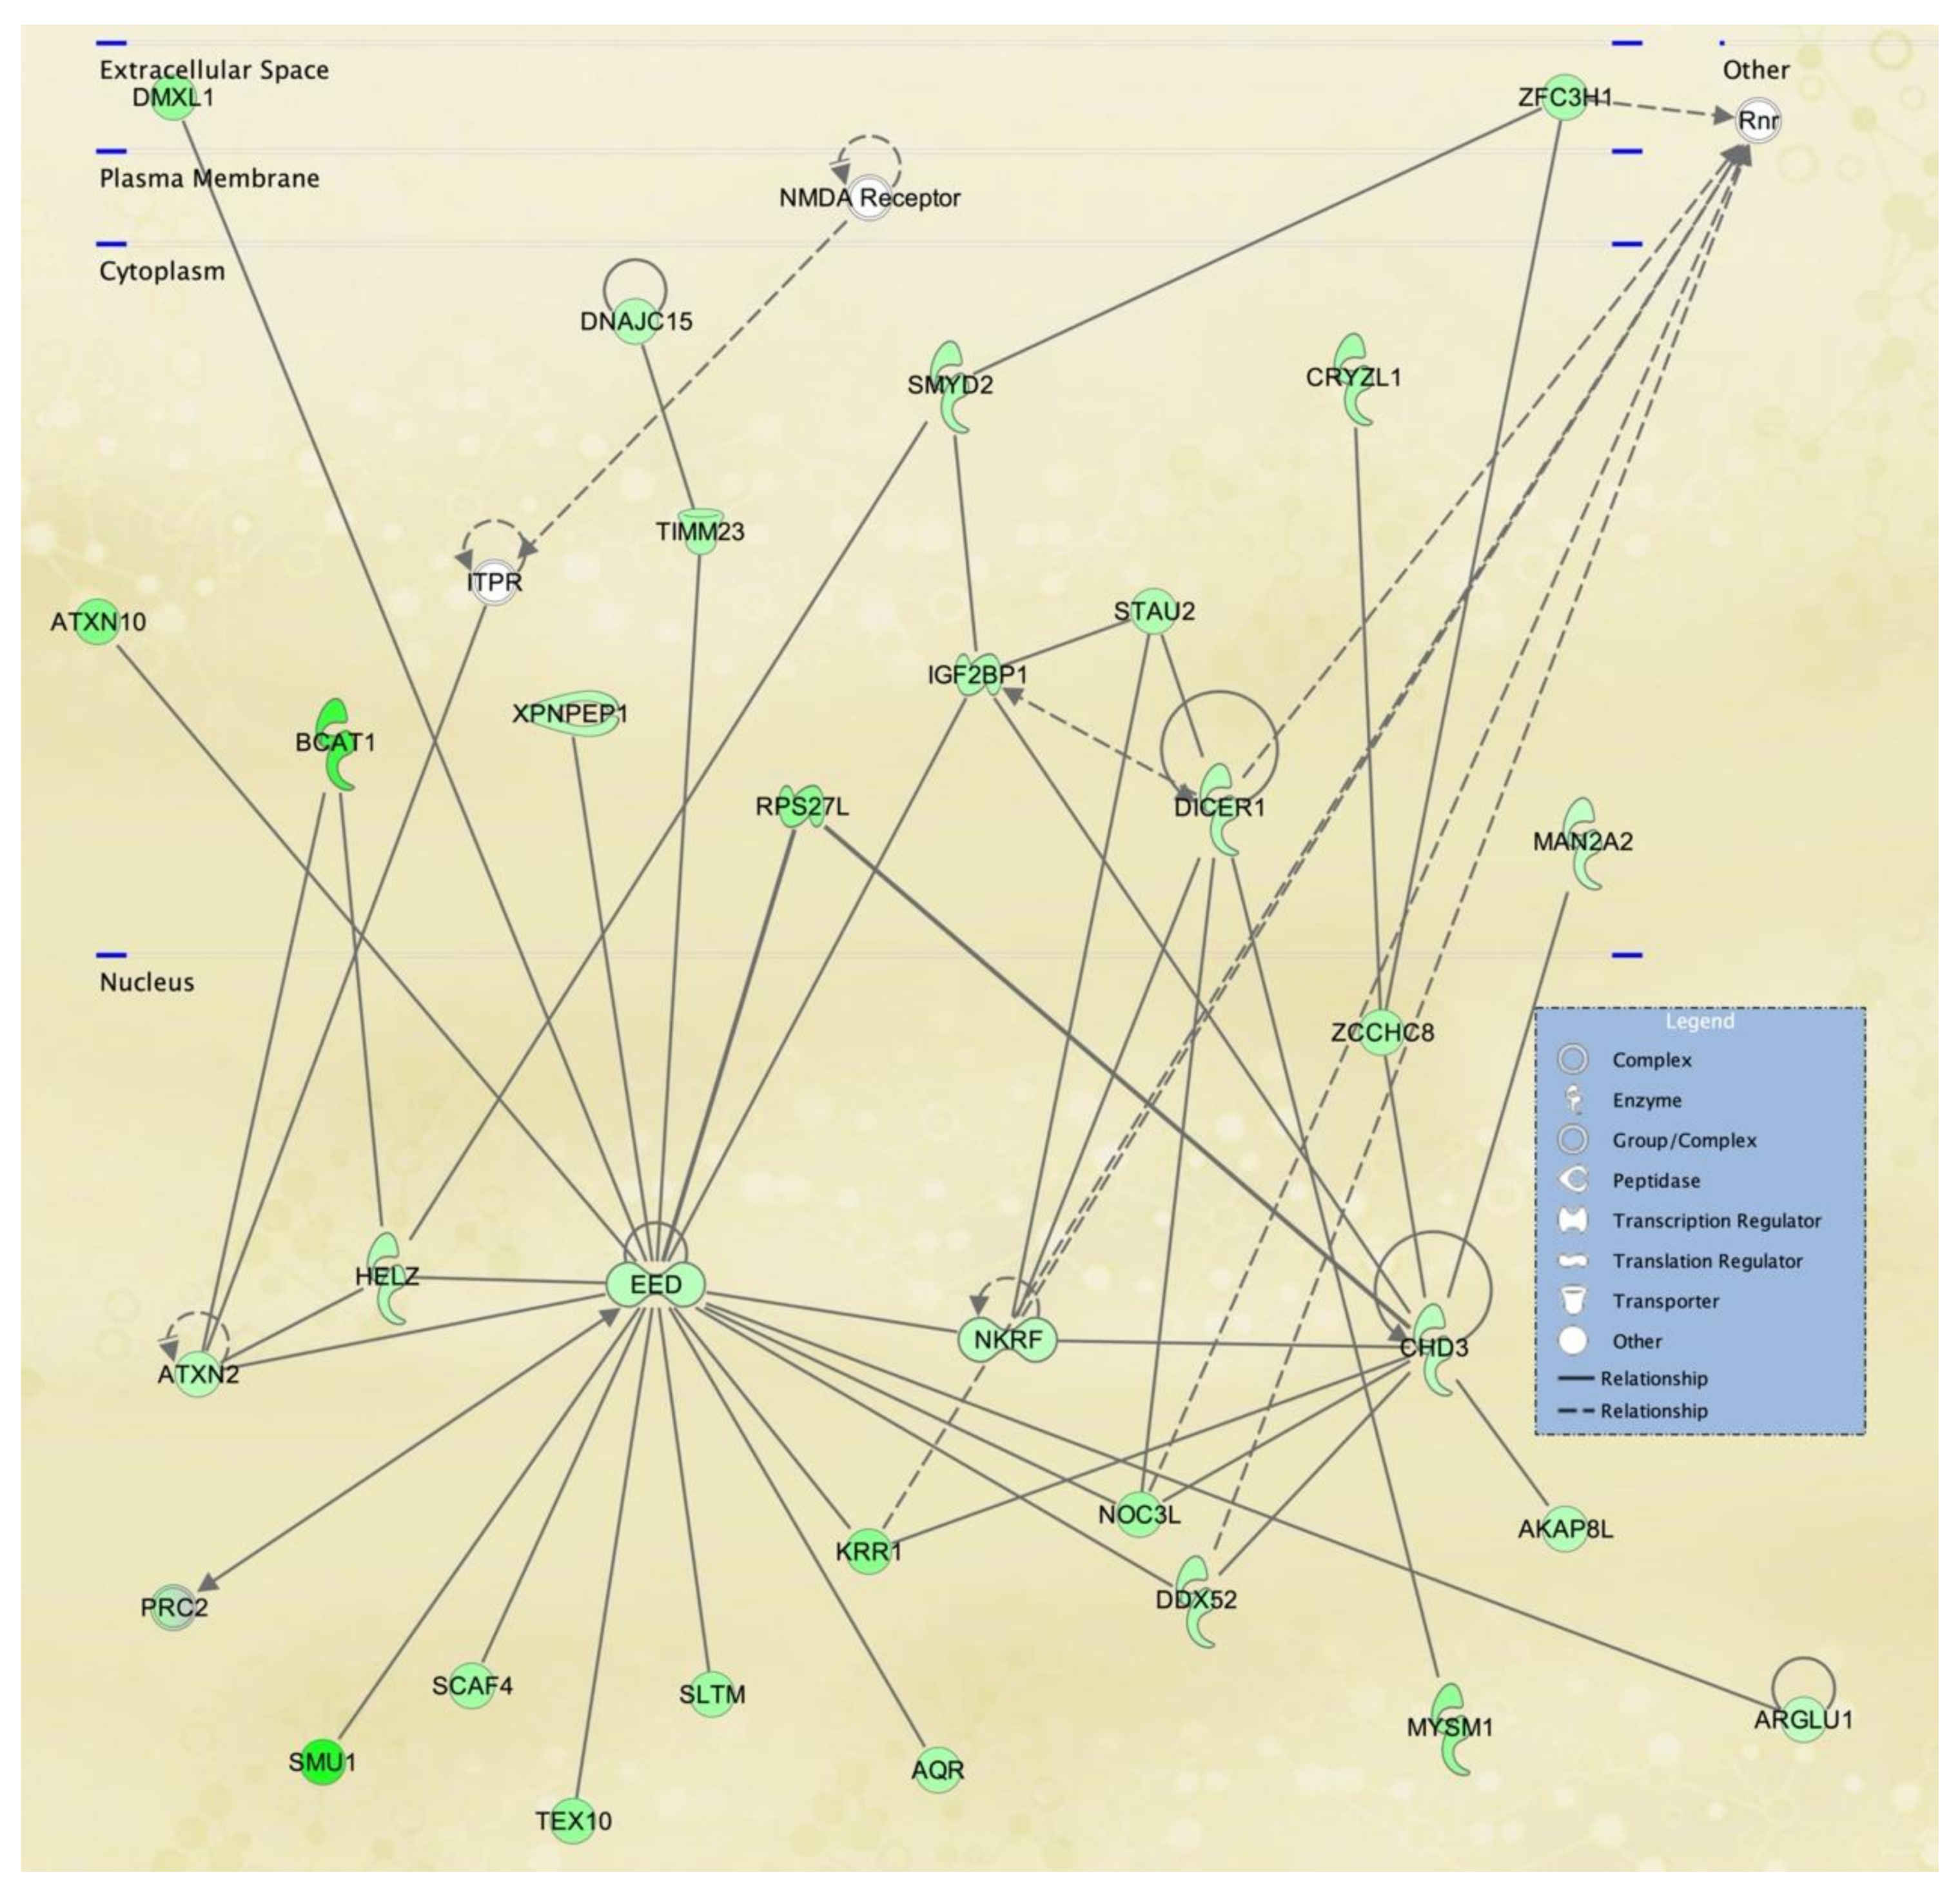
3.3. Cellular Pathways and Functional Networks Associated with SS
4. Discussion
5. Conclusions
Supplementary Materials
Author Contributions
Funding
Institutional Review Board Statement
Informed Consent Statement
Data Availability Statement
Acknowledgments
Conflicts of Interest
References
- Setleis, H.; Kramer, B.; Valcarcel, M.; Einhorn, A.H. Congenital ectodermal dysplasia of the face. Pediatrics 1963, 32, 540–548. [Google Scholar] [PubMed]
- Vázquez-Botet, M.; Cabán, F. Bitemporal Aplasia Cutis Congenita. Puerto Rico Health Sci. J. 1989, 8, 259–261. [Google Scholar]
- Suñer, I.J.; Gonzalez, C. Absent meibomian glands in Setleis Syndrome. J. Pediatr. Ophthalmol. Strabismus 1997, 34, 378–380. [Google Scholar]
- Clark, R.D.; Golabi, M.; Lacassie, Y.; Hall, B.; Seto, S. Expanded phenotype and ethnicity in Setleis Syndrome. Am. J. Med. Genet. 1989, 34, 354–357. [Google Scholar] [CrossRef]
- Matsumoto, S.; Kuno, T.; Hamasaki, Y.; Miyazaki, S.; Miyabara, S.; Narisawa, Y. Setleis bitemporal ‘forceps marks’ syndrome and its pathogenesis: A case report. Acta Paediatr. Jpn. 1991, 33, 186–190. [Google Scholar] [PubMed]
- Artlich, A.; Schwinger, E.; Meinecke, P. Setleis (bitemporal ‘forceps marks’) syndrome in a German family: Evidence for autosomal dominant inheritance. Clin. Dysmorphol. 1992, 1, 157–160. [Google Scholar] [CrossRef]
- Al-Gazali, L.I.; Al-Talabani, J. Setleis Syndrome: Autosomal recessive or autosomal dominant inheritance? Clin. Dysmorph. 1996, 5, 249–253. [Google Scholar] [CrossRef] [PubMed]
- Kent, J.S.; Romanchuk, K.G.; Lemire, E.G. Ophthalmic findings in Setleis Syndrome: Two new cases in a mother and son. Can. J. Ophthalmol. 2007, 42, 471–473. [Google Scholar] [CrossRef]
- Tukel, T.S.D.; Al-Gazali, L.I.; Erazo, M.; Casasnovas, J.; Franco, H.L.; Richardson, J.A.; Olson, E.N.; Cadilla, C.L.; Desnick, R.J. Homozygous Nonsense Mutations in TWIST2 Cause Setleis Syndrome. Am. J. Hum. Genet. 2010, 87, 289–296. [Google Scholar] [CrossRef] [Green Version]
- Sosic, D.; Richardson, J.A.; Yu, K.; Ornitz, D.M.; Olson, E.N. Twist regulates cytokine gene expression through a negative feedback loop that represses NF-kappaB activity. Cell 2003, 112, 169–180. [Google Scholar] [CrossRef] [Green Version]
- Cervantes-Barragán, D.E.; Villaroel, C.E.; Medrano-Hernández, A.; Duran-McKinster, C.; Bosch-Canto, V.; Del-Castillo, V.; Nazarenko, I.; Yang, A.; Desnick, R.J. Setleis Syndrome in Mexican-Nahua sibs due to a homozygous TWIST2 frameshift mutation and partial expression in heterozygotes: Review of the focal facial dermal dysplasias and subtype reclassification. J. Med. Genet. 2011, 48, 716–720. [Google Scholar] [CrossRef]
- Girisha, K.M.; Bidchol, A.M.; Sarpangala, M.K.; Satyamoorthy, K. A novel frameshift mutation in TWIST2 gene causing Setleis Syndrome. Indian J. Pediatr. 2014, 8, 302–304. [Google Scholar] [CrossRef]
- Rosti, R.O.; Uyguner, Z.O.; Nazarenko, I.; Bekerecioglu, M.; Cadilla, C.L.; Ozgur, H.; Lee, B.H.; Aggarwal, A.K.; Pehlivan, S.; Desnick, R.J. Setleis syndrome: Clinical, molecular and structural studies of the first TWIST2 missense mutation. Clin. Genet. 2015, 88, 489–493. [Google Scholar] [CrossRef] [PubMed] [Green Version]
- Weaver, D.D.; Norby, A.R.; Rosenfeld, J.A.; Proud, V.K.; Spangler, B.E.; Ming, J.E.; Chisholm, E.; Zackai, E.H.; Lee, B.H.; Edelmann, L.; et al. Chromosome 1p36.22p36.21 Duplications/Triplication Causes Setleis Syndrome (Focal Facial Dermal Dysplasia Type III). Am. J. Med. Genet. Part. A 2015, 167, 1061–1070. [Google Scholar] [CrossRef]
- Lee, B.H.; Kasparis, C.; Chen, B.; Mei, H.; Edelmann, L.; Moss, C.; Weaver, D.D.; Desnick, R.J. Setleis Syndrome due to inheritance of the 1p36.22p36.21 duplication: Evidence for lack of penetrance. J. Hum. Genet. 2015, 60, 717–722. [Google Scholar] [CrossRef] [PubMed] [Green Version]
- Marchegiani, S.; Davis, T.; Tessadori, F.; van Haaften, G.; Brancati, F.; Hoischen, A.; Huang, H.; Valkanas, E.; Pusey, B.; Schanze, D.; et al. Recurrent Mutations in the Basic Domain of TWIST2 Cause Ablepharon Macrostomia and Barber-Say Syndromes. Am. J. Hum. Genet. 2015, 97, 99–110. [Google Scholar] [CrossRef] [Green Version]
- De Maria, B.; Mazzanti, L.; Roche, N.; Hennekam, R.C. Barber–Say syndrome and Ablepharon–Macrostomia syndrome: An overview. Am. J. Med. Genet. Part. A 2016, 170, 1989–2001. [Google Scholar] [CrossRef] [PubMed]
- Li, L.; Cserjesi, P.; Olson, E.N. Dermo-1: A novel twist-related bHLH protein expressed in the developing dermis. Dev. Biol. 1995, 172, 280–292. [Google Scholar]
- Lee, M.S.; Lowe, G.; Flanagan, S.; Kuchler, K.; Glackin, C.A. Human Dermo-1 has attributes similar to Twist in early bone development. Bone 2000, 27, 591–602. [Google Scholar] [CrossRef]
- Bialek, P.; Kern, B.; Yang, X.; Schrock, M.; Sosic, D.; Hong, N.; Wu, H.; Yu, K.; Ornitz, D.M.; Olson, E.N.; et al. A Twist code determines the onset of osteoblast differentiation. Dev. Cell 2004, 6, 423–435. [Google Scholar] [CrossRef] [Green Version]
- Spicer, D.B.; Rhee, J.; Cheung, W.L.; Lassar, A.B. Inhibition of myogenic bHLH and MEF2 transcription factors by the bHLH protein Twist. Science 1996, 272, 1476–1480. [Google Scholar] [CrossRef]
- Piccinin, S.; Tonin, E.; Sessa, S.; Demontis, S.; Rossi, S.; Pecciarini, L.; Zanatta, L.; Pivetta, F.; Grizzo, A.; Sonego, M.; et al. “twist box” code of p53 inactivation: Twist box: p53 interaction promotes p53 degradation. Cancer Cell 2012, 22, 404–415. [Google Scholar] [CrossRef] [PubMed] [Green Version]
- Danciu, T.E.; Li, Y.; Koh, A.; Xiao, G.; McCauley, L.K.; Franceschi, R.T. The basic helix loop helix transcription factor Twist1 is a novel regulator of ATF4 in osteoblasts. J. Cell. Biochem. 2012, 113, 70–79. [Google Scholar] [CrossRef] [PubMed] [Green Version]
- Michael, K.; Skinner Rawls, A.; Wilson-Rawls, J.; Roalson, E.H. Basic Helix-Loop-Helix Transcription Factor Gene Family Phylogenetics and Nomenclature. Differentiation 2010, 80, 1–8. [Google Scholar]
- Barnes, R.M.; Firulli, A.B. A twist of insight—The role of Twist-family bHLH factors in development. Int. J. Dev. Biol. 2009, 53, 909–924. [Google Scholar] [CrossRef] [Green Version]
- Massari, M.E.; Murre, C. Helix-loop-helix proteins: Regulators of transcription in eucaryotic organisms. Mol. Cell Biol. 2000, 20, 429–440. [Google Scholar] [CrossRef] [PubMed] [Green Version]
- Rodriguez, Y.; Gonzalez-Mendez, R.R.; Cadilla, C.L. Evolution of the Twist Subfamily Vertebrate Proteins: Discovery of a Signature Motif and Origin of the Twist1 Glycine-Rich Motifs in the Amino-Terminus Disordered Domain. PLoS ONE 2016, 11, e0161029. [Google Scholar]
- Franco, H.L.; Casasnovas, J.; Rodriguez-Medina, J.R.; Cadilla, C.L. Redundant or separate entities? Roles of Twist1 and Twist2 as molecular switches during gene transcription. Nucleic Acids Res. 2010, 39, 1177–1186. [Google Scholar] [CrossRef] [Green Version]
- Chang, A.T.; Liu, Y.; Ayyanathan, K.; Benner, C.; Jiang, Y.; Prokop, J.W.; Paz, H.; Wang, D.; Li, H.; Fu, X.; et al. An evolutionarily conserved DNA architecture determines target specificity of the TWIST family bHLH transcription factors. Genes Dev. 2015, 29, 603–616. [Google Scholar]
- Gong, X.Q.; Li, L. Dermo-1, a Multifunctional Basic Helix-Loop-Helix Protein, Represses MyoD Transactivation via the HLH Domain, MEF2 Interaction, and Chromatin Deacetylation. J. Biol. Chem. 2002, 277, 12310–12317. [Google Scholar] [CrossRef] [Green Version]
- Zhang, Y.; Hassan, M.Q.; Li, Z.Y.; Stein, J.L.; Lian, J.B.; Van Wijnen, A.J.; Stei, G.S. Intricate Gene Regulatory Networks of Helix-Loop-Helix (HLH) Proteins Support Regulation of Bone-Tissue Related Genes During Osteoblast Differentiation. J. Cell Biochem. 2008, 105, 487–496. [Google Scholar] [CrossRef] [PubMed] [Green Version]
- Warburton, D. Preparation and culture of products of conception and other solid tissues for chromosome analysis. Curr. Protoc. Hum. Genet. 2009, 60, 8.5.1–8.5.9. [Google Scholar] [CrossRef] [PubMed]
- Arleen, D. Auerbach. Diagnosis of Fanconi Anemia by Diepoxybutane Analysis. Curr. Protoc. Hum. Genet. 2015, 85, 8.7.1–8.7.17. [Google Scholar] [CrossRef] [Green Version]
- Gilbert, J. Establishment of permanent cell lines by Epstein-Barr virus transformation. Curr. Protoc. Hum. Genet. 1994, 2, A.3H.1–A.3H.5. [Google Scholar] [CrossRef] [PubMed]
- Ritchie, M.E.; Belinda Phipson, B.; Wu, D.; Hu, Y.; Law, C.W.; Shi, W.; Smyth, G.K. limma powers differential expression analyses for RNA-sequencing and microarray studies. Nucleic Acids Res. 2015, 43, e47. [Google Scholar] [CrossRef]
- Krämer, A.; Green, J.; Pollard, J., Jr.; Tugendreich, S. Causal analysis approaches in Ingenuity Pathway Analysis. Bioinformatics 2014, 30, 523–530. [Google Scholar] [CrossRef]
- Pfaffl, M.W. A new mathematical model for relative quantification in real-time RT-PCR. Nucleic Acids Res. 2001, 29, 2002–2007. [Google Scholar] [CrossRef]
- Livak, K.J.; Schmittgen, T.D. Analysis of relative gene expression data using real time quantitative PCR and the 2−ΔΔCt method. Methods 2001, 25, 402–408. [Google Scholar] [CrossRef] [PubMed]
- Naegle, K.; Gough, N.R.; Yaffe, M.B. Criteria for biological reproducibility: What does “n” mean? Sci. Signal. 2015, 8, fs7. [Google Scholar] [CrossRef]
- Lazic, S.E.; Clarke-Williams, C.J.; Munafo, M.R. What exactly is ‘N’ in cell culture and animal experiments? PLoS Biol. 2018, 16, e2005282. [Google Scholar] [CrossRef] [Green Version]
- Franco, H.L.; Casasnovas, J.J.; León, R.G.; Friesel, R.; Ge, Y.; Desnick, R.J.; Cadilla, C.L. Nonsense mutations of the bHLH transcription factor TWIST2 found in SS patients cause dysregulation of periostin. Int. J. Biochem. Cell Biol. 2011, 43, 1523–1531. [Google Scholar] [CrossRef] [PubMed] [Green Version]
- Ishida, Y.; Gao, J.; Murphy, P.M. Chemokine Receptor CX3CR1 Mediates Skin Wound Healing by Promoting Macrophage and Fibroblast Accumulation and Function. J. Immunol. 2008, 180, 569–579. [Google Scholar] [CrossRef] [PubMed] [Green Version]
- Kholodnyuk, I.; Rudevica, Z.; Leonciks, A.; Ehlin-Henriksson, B.; Kashuba, E. Expression of the chemokine receptors CCR1 and CCR2B is up-regulated in peripheral blood B cells upon EBV infection and in established lymphoblastoid cell lines. Virology 2017, 512, 1–7. [Google Scholar] [CrossRef] [PubMed]
- Laky, K.; Annaert, W.; Fowlkes, B.J. Amyloid precursor family proteins are expressed by thymic and lymph node stromal cells but are not required for lymphocyte development. Int. Immunol. 2009, 21, 1163–1174. [Google Scholar] [CrossRef] [PubMed] [Green Version]
- Puig, K.; Brose, S.; Zhou, X.; Sens, M.; Combs, G.; Jensen, M.; Golovko, M.; Combs, C. Amyloid precursor protein modulates macrophage phenotype and diet-dependent weight gain. Sci. Rep. 2017, 7, 43725. [Google Scholar] [CrossRef]
- Lai, A.Y.; Wade, P.A. Cancer biology and NuRD: A multifaceted chromatin remodelling complex. Nat. Rev. 2011, 11, 588–596. [Google Scholar] [CrossRef]
- Margueron, R.; Reinberg, D. The Polycomb complex PRC2 and its mark in life. Nat. Rev. 2011, 469, 343–349. [Google Scholar] [CrossRef] [Green Version]
- Fu, J. The TWIST/Mi2/NuRD protein complex and its essential role in cancer metastasis. Cell Res. 2011, 21, 275–289. [Google Scholar] [CrossRef] [Green Version]
- Su, I.H. Ezh2 controls B cell development through histone H3 methylation and Igh rearrangement. Nat. Immunol. 2003, 4, 124–131. [Google Scholar] [CrossRef] [PubMed]
- SoRelle, E.D.; Dai, J.; Zhou, J.Y.; Giamberardino, S.N.; Bailey, J.A.; Gregory, S.G.; Chan, C.; Luftig, M.A. Single-cell characterization of transcriptomic heterogeneity in lymphoblastoid cell lines. bioRxiv 2020. [Google Scholar] [CrossRef]
- Abhinand, C.S.; Raju, R.; Soumya, S.J.; Arya, P.S.; Sudhakaran, P.R. VEGF-A/VEGFR2 signaling network in endothelial cells relevant to angiogenesis. J. Cell Commun. Signal. 2016, 10, 347–354. [Google Scholar] [CrossRef] [PubMed] [Green Version]
- Sunitha, P.; Raju, R.; Sajil, C.K.; Abhinand, C.S.; Nair, A.S.; Oommen, O.V.; Sugunan, V.S.; Sudhakaran, P.R. Temporal VEGFA responsive genes in HUVECs: Gene signatures and potential ligands/receptors fine-tuning angiogenesis. J. Cell Commun. Signal. 2019, 13, 561–571. [Google Scholar] [CrossRef] [PubMed]
- Lohela, M.; Bry, M.; Tammela, T.; Alitalo, K. VEGFs and receptors involved in angiogenesis versus lymphangiogenesis. Curr. Opin. Cell Biol. 2009, 21, 154–165. [Google Scholar] [CrossRef] [PubMed]
- Pavenstadt, H.; Kriz, W.; Kretzler, M. Cell Biology of the Glomerular Podocyte. Physiol. Rev. 2003, 83, 253–307. [Google Scholar] [CrossRef] [PubMed] [Green Version]
- Goossens, S.; Vandamme, N.; Van Vlierberghe, P.; Berx, G. EMT transcription factors in cancer development re-evaluated: Beyond EMT and MET. Biochim. Biophys. Acta Rev. Cancer 2017, 1868, 584–591. [Google Scholar] [PubMed]


| Gene Symbol | SS Ave ± Std Dev (log2) | WT Ave_ Std Dev (log2) | MA Fold Change | Mod t/ p-Value | Mean qRT-PCR Fold Change ± SEM | Full Name, Function |
|---|---|---|---|---|---|---|
| CXCL8/IL8 | 5.60 ± 0.21 | 12.94 ± 0.80 | −162 | −35.8/ 8.7 × 10⁻⁷ | −251.9 ± 65.2 | Interleukin 8, CXC chemokine |
| COL15A1 | 14.24 ± 0.89 | 9.10 ± 0.9 | −29 | −13.12/ 0.0002 | −4.91 ± 0.4 | Collagen type XV, alpha |
| POSTN | 4.63 ± 1.38 | 9.35 ± 0.86 | −28.3 | −8.8/ 0.002 | −144.0 ± 31.6 | Periostin. Secreted extracellular matrix protein |
| CXCL3 | 4.84 ± 0.23 | 9.32 ± 1.36 | −22.3 | −9.8/ 0.0003 | −14.2 ± 2.1 | MIP2−Beta. CXC chemokine |
| IL1RN | 4.79 ± 0.67 | 8.68 ± 0.72 | −14.8 | −16.8/ 0.0003 | −48.7 ± 9.7 | Interleukin 1 receptor antagonist. |
| CSTA | 4.68 ± 0.57 | 8.40 ± 0.75 | −13 | −12.7/ 0.0001 | −26.6 ± 5.4 | Cystatin A. Cysteine protease inhibitor |
| CCL20 | 3.98 ± 0.33 | 7.54 ± 1.42 | −11.8 | −9.8/ 0.0005 | −239.5 ± 38.5 | MIP3α. Chemokine (C−C motif) ligand 20 |
| PGF | 5.21 ± 0.66 | 8.60 ± 0.96 | −10.4 | −10.1/ 0.0004 | −56.4 ± 14.2 | Placental growth factor |
| RUNX3 | 4.59 ± 0.26 | 7.50 ± 0.88 | −7.5 | −7.45/ 0.0014 | −23.2 ± 9.8 | runt domain transcription factor |
| TRIB3 | 8.19 ± 0.08 | 9.28 ± 0.10 | −2.1 | −23.2/ 2.3 × 10⁻⁵ | −4.6 ± 0.8 | Tribbles pseudokinase 3 |
| LAMA4 | 11.36 ± 0.45 | 10.10 ± 0.12 | +2.4 | +19.9/ 1.6 × 10⁻⁵ | 2.9 ± 0.4 | Laminin alpha 4 |
| RALGPS2 | 7.38 ± 0.42 | 5.56 + 0.13 | +3.5 | +15.9/ 8.8 × 10⁻⁵ | +1.9 ± 0.3 | Ral GEF |
| MEST | 9.93 ± 0.52 | 7.22 ± 0.95 | +6.5 | +9.7/ 0.0005 | +15.5 ± 5.6 | [α]/[β] hydrolase fold family member |
| IL7 | 7.72 ± 0.20 | 5.00 ± 0.70 | +6.7 | +35.8/ 0.0002 | +3.2 ± 0;.7 | Interleukin 7 |
| PRLR | 5.48 ± 0.77 | 4.20 ± 0.43 | +7.6 | +10.9/ 0.0076 | +54.1 ± 5.6 | Prolactin receptor |
| MYRIP | 6.78 ± 0.48 | 3.64 ± 0.27 | +8.8 | +15.1/ 1.14 × 10⁻⁵ | +26.6 ± 8.8 | Rab27A-binding protein and actin interacting protein |
| CHRDL1 | 11.19 ± 0.82 | 5.12 ± 0.76 | +67 | +15.3/ 1.3 × 10⁻⁵ | +74.3 ± 11.9 | Chordin like 1, bone morphogenetic protein 4 antagonist |
| Gene Symbol | SS Ave ± Std Dev (log2) | WT Ave_ Std Dev (log2) | MA Fold Change | p-Value | Median qRT-PCR Fold Change * | Protein Product Name, Function |
|---|---|---|---|---|---|---|
| PRKCH | 5.43 ± 0.58 | 8.63 ± 0.72 | −9.2 | 0.0006 | −14.1 ± 7.9 | Protein Kinase C, eta |
| SMU1 | 4.83 ± 2.15 | 7.80 ± 1.32 | −7.8 | 0.0399 | −2.2 ± 1.0 | SMU1 DNA Replication Regulator |
| BCAT1 | 5.94 ± 1.11 | 8.69 ± 1.07 | −6.8 | 6.83 × 10⁻⁵ | −2.7 ± 0.6 | Cytosolic branched-chain amino acid transaminase |
| LPXN | 6.89 ± 1.6 | 9.56 + 0.14 | −6.4 | 0.0105 | −4.1 ± 0.6 | Leupaxin, Transcriptional coactivator |
| TAS2R50 | 4.09 ± 0.49 | 6.76 ± 0.92 | −6.4 | 0.0057 | −4.2 ± 2.9 | Taste 2 Receptor Member 50 |
| RAB31 | 6.24 ± 0.69 | 8.80 ± 0.46 | −5.9 | 0.0011 | −5.8 ± 3.3 | Ras-Related Protein Rab-31 |
| RHOBTB3 | 4.51 ± 0.71 | 6.95 ± 0.81 | −5.4 | 0.0075 | −2.3 ± 0.8 | Rho Related BTB Domain Containing 3-Rab9-regulated ATPase |
| NPIPB4 | 6.99 ± 1.04 | 9.33 ± 0.51 | −5.1 | 0.0055 | −7.7 ± 3.8 | Nuclear Pore Complex Interacting Protein Family Member B4 |
| GIMAP6 | 5.64 ± 0.67 | 7.98 ± 0.97 | −5.0 | 0.0137 | −40.1 ± 27.7 | GTPases of immunity-associated proteins (GIMAP) family member |
| CCR1 | 3.65 ± 0.50 | 5.72 ± 1.21 | −4.2 | 0.0286 | −7.7 ± 3.8 | chemokine (C-C motif) receptor 1 |
| SNX33 | 5.64 ± 0.37 | 4.55 ± 0.31 | 2.1 | 0.0219 | −6.3 ± 4.3 | Sorting nexin 33 |
| MUC13 | 9.37 ± 1.27 | 6.37 ± 0.47 | 8.0 | 0.0156 | +339.5 ± 307.4 | Mucin 13, |
| LCE2D | 5.75 ± 1.11 | 2.5 ± 1.39 | 9.5 | 0.0086 | 12.8 ± 12.6 | late cornified envelope 2D |
| REXO1L1P | 7.33 ± 2.68 | 3.62 ± 0.52 | 13.1 | 0.0417 | 6.45 ± 6.3 | RNA exonuclease 1 homolog-like 1 pseudogene |
| Pathway | #Total | Genes in Pathway * | Significance | p-Value |
|---|---|---|---|---|
| VEGFA-VEGFR2 Signaling Pathway | 35 | PRKD2,HSPA1A,SMARCA2,NCK1,QGAP1, PLAUPIK3R1,TXNIP,GSK3B,CTNNB1, FBXW11,EPS15,TNXB,ADAM10,S1PR1,ADRB2PDE4DIP,VEGFA,SPHK1,PRKCD,NFKBIA, NRP2,PTGS2,CXCL8,ICAM1,PLAUR,SOD2, IGFBP7,PGF,SLC39A14,CSRP2,PGK1,SSR3, CGNL1,P4HA2 | 6.24 | 0.000001 |
| PodNet: protein-protein interactions in the podocyte | 31 | MYOC,SMAD3,AGTR1,IQGAP1,UTRN, ADAM10,SPTAN1,KCNMA1,PLCE1,NCK1, SP1,SPTBN1,PIK3R1,CTNNB1,MET,ACTR2, CTTN,KRT7IGFBP7PTGS2,VEGFA,DDR1,NOTCH3,ANGPTL4,PLAUR,IGFBP2,CDKN1C,PDPN, COL18A1,PALLD,SYNPO | 8.02 | 0 |
| Nuclear Receptors Meta-Pathway | 30 | NR3C1,SDPR,PPARGC1A,NCOA2,SP1, HSPA1A,ABHD2,PLK2,AHR,NCOA3,SLC6A15SLC7A11,CES1,SRGN,TSC22D3,SLC2A1, TNFAIP3,PTGS2,CCL20,ANGPTL4,SLC7A5, GSTT2,SRXN1,AMIGO2GCLM,CDKN1C,NRG1,ME1,SLC6A8,SLC39A14 | 6.88 | 0 |
| Endothelin Pathway | 24 | CDH2,VCAN,IGFBP5,CTNNB1,ACTR2,GULP1CASP8,GSK3B,TCF4,RGS3,CXCL8,PLOD2, PTGS2,COL5A1,MMP3,COMP,MMP1,ADAM12,EDNRA,NFKBIA, IL6,CXCL1,MCAM, VEGFA | 3.73 | 0.000186 |
| PI3K-Akt Signaling Pathway | 23 | PIK3R1,ITGA7,COL6A6,LAMA4,PRLR,TNXB, PDGFD,MET,GNG12,GSK3B,IL7,NTRK2 GYS1,COMP,DDIT4,ITGA8,FGF1,VEGFA,PGF, EIF4EBP1,IL6,TLR2,TLR4 | 3.13 | 0.000737 |
| Focal Adhesion-PI3K-Akt-mTOR-signaling pathway | 22 | PIK3R1,ITGA7,MET,LAMA4,PRLR,TNXB, PDGFD,GNG12,GSK3B,PPARGC1A,COMP, COL5A1,DDIT4,ITGA8,FGF1,VEGFA,PGF, SLC2A1,GYS1,PFKFB3,PFKFB4,EIF4EBP1 | 3.51 | 0.00031 |
| Adipogenesis | 19 | NR3C1,RBL1,SP1,PPARGC1A,NCOA2,MBNL1,CTNNB1,SMAD3,PRLR,AHR,LMNA,DDIT3, LIF,CYP26B1,MIF,LEP,IL6,TRIB3,RORA | 7.53 | 0 |
| Circadian rhythm related genes | 19 | PRKG2, NCOA2,DDX5,KCNMA1,OGT, PPARGC1A,PRKDC,FBXW11,GSK3B,NLGN1, NR1D2,DHX9,AHR,LEP,RORA,IL6,OPN3,ID2, NAMPT | 4.58 | 0.000026 |
| IL-18 signaling pathway | 17 | CASP8,CTNNB1,GSK3B,SLC4A7,KLF2,PIK3R1 SP1,MMP3,FOXN3,NFKBIA,IL6,CCL20,CXCL8, MMP1,SPON1,PTGS2,PRKCD | 2.04 | 0.009034 |
| Sudden Infant Death Syndrome (SIDS) Susceptibility Pathways | 14 | NR3C1,SP1,PPARGC1A,THRB,CTNNB1,NTRK2,SPTBN1,RUNX3,RORA,IL6,IL1RN,VEGFA, TAC1,POU2F2 | 3.26 | 0.000553 |
| Pathway | #Total | Genes in Pathway * | Significance | p-Value |
|---|---|---|---|---|
| EGF/EGFR Signaling | 23 | MAPK1,MAPK8,EPS15L1,RASA1,VAV2,SOS2,MAPK3, JAK1,CDC42,ATXN2,RPS6KB1,ASAP1,SYNJ1,MAP4K1,USP6NL,ABI1,ROCK1,USP8,PTEN,STAM,STAT5B, CBL,PTK2 | 2.37 | 0.004236 |
| TGF-beta Signaling | 22 | SPTBN1,MAPK1,MAPK8,WWP1,NUP214,TGFBR1, RBL2,MAPK3,CDC42,SMAD2, STAMBPL1,BTRC,SMURF2,E2F4,ITGB1,MAP4K1,APPMAP2K6,PIAS1,ROCK1,ZEB1,PTK2 | 3.07 | 0.000854 |
| JAK/STAT | 19 | PTPN6,MAPK3,FLNA,STAT5B,VAV2,CBL,CHUK, RPS6KB1,PTK2,MAPK1,REL,BAX,ITGB1,IGF1,JAK1, CDC42,ROCK1,CFL2,MAPK8 | 2.84 | 0.001456 |
| Olfactory receptor activity | 19 | OR6C76,OR6C74,OR9G1,OR1M1,OR52L1,OR2L8, OR7C2OR2B3, OR1L1,OR4N5,OR10H2,OR6C3, OR8K5, OR4N2,OR52N2,OR52E2,OR10A7,OR52H1,OR4B1 | 1.38 | 0.041643 |
| Mesodermal Commitment | 19 | LEF1,PIAS1,NLK,WDFY2,BMPR2,CCDC6,ELP4, C9orf72,TRIM5,FGFR1,LATS1,KDM6A,MBTD1TCF4, BMPR1A,TRERF1,TWSG1,SMAD2,AEBP2 | 1.34 | 0.045833 |
| Genes involved in male infertility | 18 | UBD,ABLIM1,AHR,ARNTL,ATM,CLOCK,EPSTI1,FASLIG4,MLH3PEMT,RGS9,SHMT1,TEX15,USP8,CCNT1,CCNK,CDK9 | 1.39 | 0.040353 |
| Endoderm Differentiation | 18 | LEF1,RTF1,RFX7,BPTF,MBTD1,SP4,APP,AEBP2,BMPR1A,SMAD2,PIAS1,NLK,WDFY2,ELP4,TRIM5,TCF4, EMSY,TRERF1 | 1.39 | 0.040353 |
| B Cell Receptor Signaling | 16 | CHUK,REL,MAP2K6,VAV2,MALT1,PTPN6,MAPK3, MAPK8,RAPGEF1,MAX,CDC42,CBL,BLK,MAPK1, CD22,MAP4K1 | 2.38 | 0.004197 |
| T-Cell antigen Receptor(TCR) Signaling | 15 | MAP4K1,MAPK8,LCP2,WAS,REL,CHUK,FYB,CDC42,GRAP2,MAPK3,MAPK1,MALT1,CBL,SKAP1,FAS | 2.31 | 0.004854 |
| Integrin-mediated Cell Adhesion | 15 | SEPP1,CDC42,ARHGEF7,VAV2,ROCK1,GIT2, PTK2,CAPN3,PAK6,MAP2K6,RAPGEF1, MAPK1,ITGAX,ITGB1,VCL | 1.89 | 0.012959 |
| Ingenuity Canonical Pathways | p-Value | Genes in Pathway * |
|---|---|---|
| Role of IL-17A in Psoriasis | 7.94 × 10⁻¹⁰ | CCL20,CXCL1,CXCL3,CXCL5,CXCL6,CXCL8,S100A7,S100A9 |
| Osteoarthritis Pathway | 7.24 × 10⁻⁹ | CASP8,CCN4,CTNNB1,CXCL8,DDIT4,DDR2,GDF5,LEP,MMP1,MMP3,NAMPT,PGF,PPARGC1A,PTCH1,PTGS2,S100A9,SMAD3,SOX9,SP1, SPHK1,TCF4,TCF7L2,TLR2,TLR4,VEGFA |
| Role of Macrophages, Fibroblasts and Endothelial Cells in Rheumatoid Arthritis | 3.16 × 10⁻⁸ | CAMK2D,CTNNB1,CXCL8,GSK3B,ICAM1,IL1RN,IL32,IL33,IL36B,IL6, IL7,MIF,MMP1,MMP3,NFKBIA,PDGFD,PGF,PIK3R1,PLCB4,PLCE1, PPP3CC,PRKCD,SFRP2,TCF4,TCF7L2,TLR2,TLR3,TLR4,VEGFA, WNT5A |
| Hepatic Fibrosis/Hepatic Stellate Cell Activation | 5.89 × 10⁻⁸ | AGTR1,COL15A1,COL18A1,COL23A1,COL27A1,COL5A1,COL6A6, CXCL3,CXCL8,EDNRA,FGF1,ICAM1,IGFBP5,IL6,LEP,MET,MMP1, PDGFD,PGF,SMAD3,TLR4,VEGFA |
| Glucocorticoid Receptor Signaling | 1.62 × 10⁻⁷ | ADRB2,CDKN1C,CXCL3,CXCL8,HSPA1A/HSPA1B,ICAM1,IL1RN,IL6,KRT14,KRT15,KRT19,KRT34,KRT6A,KRT6B,KRT7,MAPK13,MMP1, NCOA2,NCOA3,NFKBIA,NR3C1,PIK3R1,PLAU,POU2F2,PPP3CC, PTGS2,SMAD3,SMARCA2,TAF9B,TSC22D3 |
| Ingenuity Canonical Pathways | p-Value | Genes in Pathway* |
|---|---|---|
| FAK Signaling | 2.95 × 10⁻⁵ | ARHGEF6,ARHGEF7,ASAP1,CAPN3,GIT2,ITGB1,MAPK1,MAPK3, PIK3C2A,PIK3C3,PIK3R5,PTEN,PTK2,SOS2,VCL,WAS |
| Ephrin B Signaling | 7.59 × 10⁻⁵ | ABI1,CAP1,CBL,CDC42,CFL2,GNA13,GNG2,GNG7,MAPK1,MAPK3,PTK2, ROCK1,VAV2 |
| Molecular Mechanisms of Cancer | 7.94 × 10⁻⁵ | ADCY3,ARHGEF6,ARHGEF7,ATM,BAX,BMPR1A,BMPR2,CBL,CDC42 ,CDK16,CDK9,CTNND1,E2F4,E2F7,E2F8,GNA13,ITGB1,JAK1,LEF1,LRP5, MAP2K6,MAPK1,MAPK3,MAPK8,MAX,NLK,PA2G4,PIK3C2A,PIK3C3, PIK3R5,PRKCH,PTK2,RAPGEF1,RASA1,RHOT1,SMAD2,SOS2,TCF4,TGFBR1 |
| Reelin Signaling in Neurons | 0.000125 | APP,ARHGEF6,BLK,CDC42,CNR2,HCK,ITGB1,MAP2K6,MAP4K1,MAPK1,MAPK3,MAPK8,NDEL1,PDK3,PIK3C2A,PIK3C3,PIK3R5,RAPGEF1 |
| B Cell Receptor Signaling | 0.000257 | APBB1IP,CD22,CDC42,CFL2,IGHG1,MALT1,MAP2K6,MAPK1,MAPK3, MAPK8,NFAT5,PAG1,PIK3C2A,PIK3C3,PIK3R5,PTEN,PTK2,PTPN6,RPS6KB1,SOS2,SYNJ1,VAV2 |
| Network ID | Genes in Network * | Score | Focus Molecules | Top Diseases and Functions |
|---|---|---|---|---|
| 1 | ARAP2,DDX5,EHBP1,ENPP4,G3BP1,H1-2, KCNE4,H2AC18/H2AC19,Histone h2a,IGF2BP3,KCNE4, LAMA4,LGALS8,LDL-cholesterol, LMNA,MAP7, MAPK13,PTEFb,PRKD2,PRKDC,RAB33A,RADX, RESF1,RNA polymerase II,Rnr,SFN,SLC20A1, SPATA6, SUPT16H,SYNGR1,TCF7L2,TMEM65, TMTC1,UBAP1, VEGFA,WDR36 | 44 | 30 | Cancer, Nervous System Development and Function, Neurological Disease |
| 2 | aldehyde dehydrogenase, aldehyde dehydrogenase (NAD),ALDH1A3,ALDH3A2,ALDH6A1,ANTXR2,CDHE/CDHN,COL27A1,Ctbp,CTNNB1,HHEX, HILPDA,HMG CoA synthase,IFITM1,KCNK1,ME1, MOB1A,Neuropilin,NRP2,RAB7,RAB8B,RASSF4, SEMA3C,SLC16A6,SLC1A5,SLC38A5,ST8SIA1, SYNM,TAOK1,TCF,TDO2,TRAPPC13,TWIST, TWIST2, UGCG | 35 | 26 | Lipid Metabolism, Molecular Transport, Small Molecule Biochemistry |
| 3 | ADAM10,ADAM12,Alpha Actinin,BEST1, Cadherin,CDH2,COMP,DCLK1,DLL1,GALNT5, Growth factor,Hedgehog,HELLS,HOXA11,Hsp27, KBTBD11,KLF2,MAC,MOXD1,MYCBP2,NEAT1, Notch,PALLD,PARP,PRSS12,PTCH1,RALGPS2, RDH10,SFRP2,SH3D19,SH3PXD2A,SOX9, SRC(family),THBS1,VGLL3 | 35 | 26 | Cancer, Organismal Injury and Abnormalities, Reproductive System Disease |
| 4 | ADAM33,ATM,BOLA2/BOLA2B,BRINP1,C15orf48,CCDC50,CHMP4B,DLST,FSTL1,H2BC8,H4C8,Hif1HISTONE,Histone h3,IgG2b,IL12 (family), Immunoglobulin,KLF4,KMT2C,LGALS3BP, Mitochondrial complex 1,NAMPT,NDUFA4L2, NDUFS1,NHLRC3,OGT,P3H2,PDK1,RAB11FIP1, Secretase gamma, SOD2, Tnf (family),TNFAIP3, TPK1, WARS2 | 35 | 26 | Free Radical Scavenging, Neurological Disease, Organismal Injury and Abnormalities |
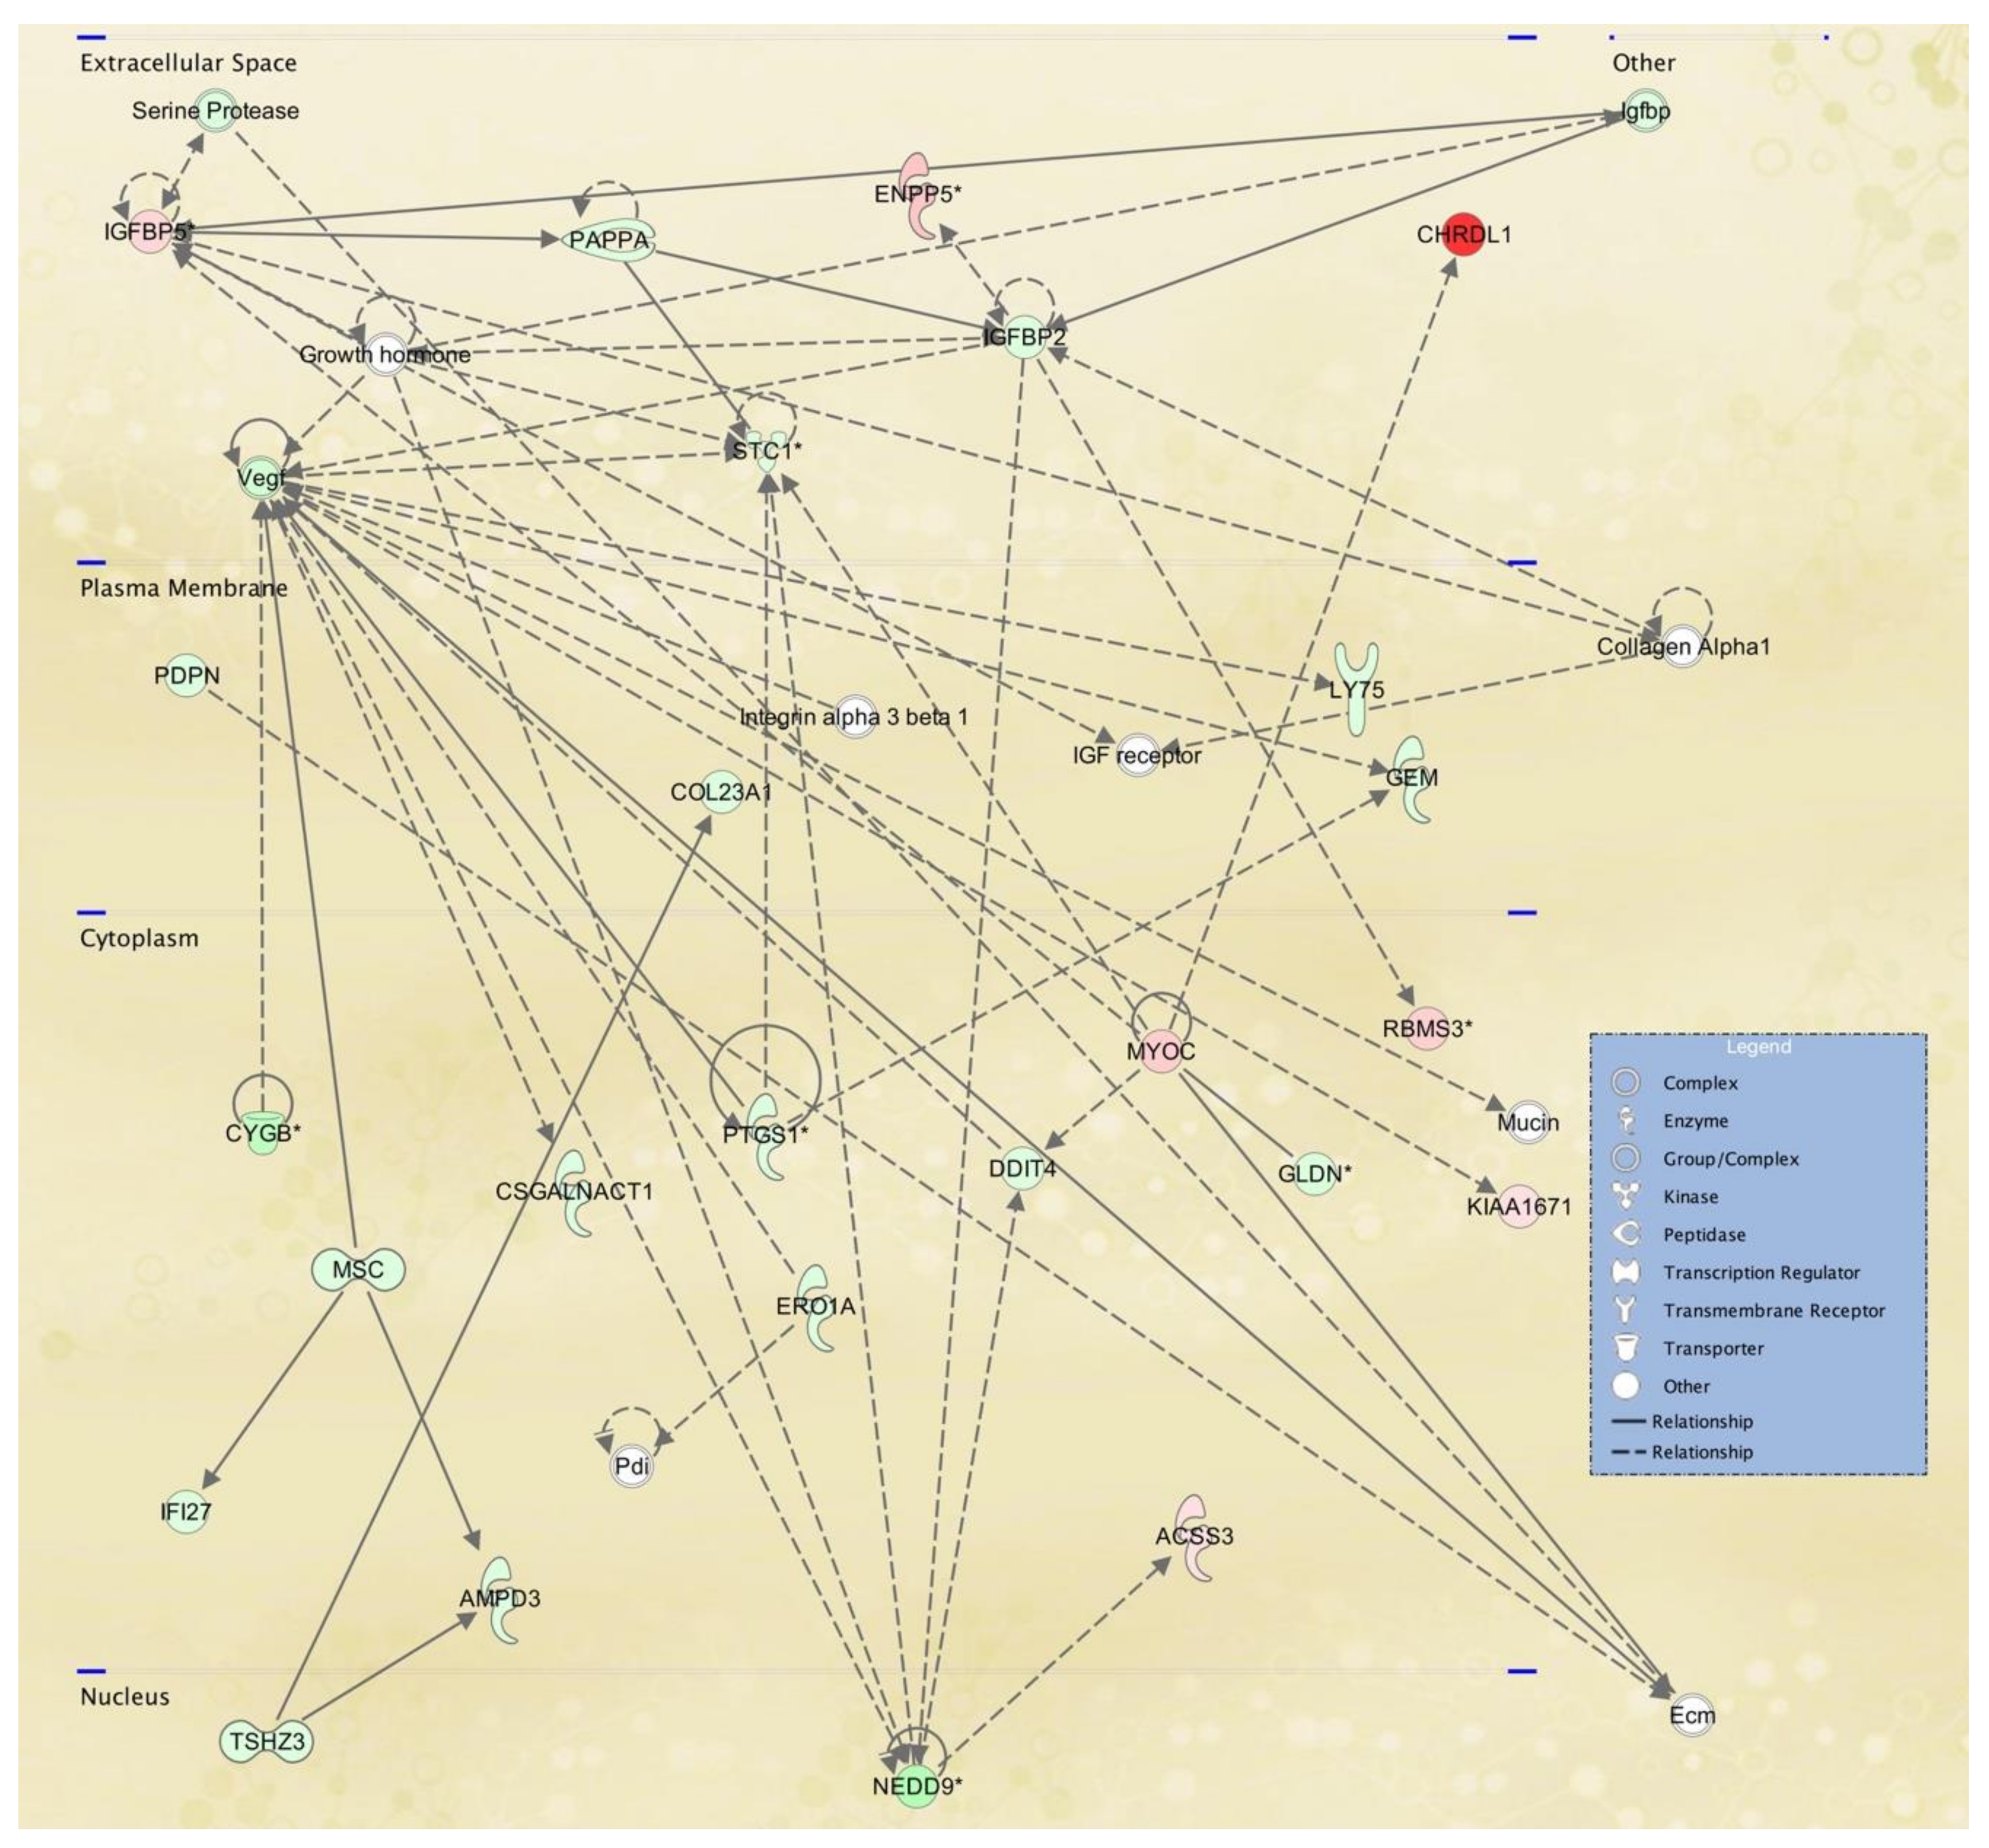
| 5 | ACSS3,AMPD3,CHRDL1,COL23A1,Collagen Alpha1,CSGALNACT1,CYGB,DDIT4,Ecm,ENPP5, ERO1A,GEM,GLDN,Growth hormone, IFI27, IGF receptor,Igfbp,IGFBP2,IGFBP5,Integrin alpha 3 beta 1,KIAA1671,LY75,MSC,Mucin,MYOC,NEDD9, PAPPA,Pdi,PDPN,PTGS1,RBMS3,Serine Protease,STC1, TSHZ3,Vegf | 33 | 25 | Cell Signaling, Free Radical Scavenging, Small Molecule Biochemistry |
| Network ID | Genes in Network * | Score | Focus Molecules | Top Diseases and Functions |
|---|---|---|---|---|
| 1 | ANGEL1,ARHGAP25,ASCC2,CARD8,DIAPH2, DIDO1,HCFC2,HERC3,IKZF5,KDM5C,LACTB2,MBIP,MIS18BP1,NAGK,NFRKB,NRCAM, OR7C2,PATL1,PEMT,PPHLN1,Presenilin,RGS9, RNF26,SGF29,SMC5,SMDT1,TASOR2,TENT4B, TMEM62,UTP18,Vegf,WDR37,WDR74,ZNF143, ZNF33A | 45 | 33 | Endocrine System Disorders, Hereditary Disorder, Organismal Injury and Abnormalities |
| 2 | AGO3,AGO4,ANTXR2,APTX,ARFGAP3,ARGONAUTE,BICD1,CCP110,CENPJ,CEP290,CNOT2, CNTROB,CRTC3,DMAC2L,FBXO22,HMGXB4, KIAA0753,KIZ,LYST,MPHOSPH9,MRPL17,MRPL39,MRPL41,MRPS14,OFD1,PAN3,PIBF1,Pka, PPP2R3C,RNASEH2B,SMG9,TNRC6A,TNRC6B, TSPYL5,VBP1 | 45 | 33 | Cell Cycle, Cellular Assembly and Organization, DNA Replication, Recombination, and Repair |
| 3 | ACIN1,ANKRD10,API5,ARID4A,ATP11C,ATP6V0A1,BCCIP,CENPV,CHORDC1,COX15,DPP9, DRG1,FAM98B,GABP,GABPA,GPCPD1, HNRNPH3,Immunoglobulin,MIER2,NSRP1, PHKG2,PIGN,PRKAB1,RBBP4,RYBP,SCGB1D2,SINHCAF,ST13,TMEM135,TMEM63A,TMLHE, TNPO2,YAF2,YTHDF1,ZFP36L1 | 45 | 33 | Cardiovascular Disease, Developmental Disorder, Digestive System Development and Function |
| 4 | APP,BRWD1,C1orf112,CENPI,CHURC1,DCXR,DENND1C,DTD2,DTWD1,EVI2A,FAM50A, FMNL3,GIMAP5,GIMAP6,GTDC1,Irp,KCNMB2KLF7,NAA25,PCIF1,PI3k class III,PRKRIP1, PUS7L, SP140L,T2r,TAS2R20,TAS2R4,TAS2R46, TAS2R50,TCP11L2,TICRR,TIGD1,ZMYM5, ZNF431,ZNF75A | 42 | 32 | Hereditary Disorder, Metabolic Disease, Organismal Injury and Abnormalities |
| 5 | Adaptor protein 1,ADPGK,alcohol group acceptor phosphotransferase,AP1G2,AP1S3,ARL15,CEP83, DCAF10,DPY19L3,DYRK1A,Exocyst,GGA2, HAUS2,HIPK1,KLHL36,MAP2K6,MAPK3, MZT2A,PHLPP1,PIGB,POMK,PRKCH,PRKX, RALGAPA1,RALGAPA2,RALGAPB,RFX7, RIPOR2,SCAF11,TMEM120A,TUBG2,TUBGCP4,UFC1,ZNF507,ZNFX1 | 42 | 32 | Auditory Disease, Cellular Development, Cellular Growth and Proliferation |
Publisher’s Note: MDPI stays neutral with regard to jurisdictional claims in published maps and institutional affiliations. |
© 2021 by the authors. Licensee MDPI, Basel, Switzerland. This article is an open access article distributed under the terms and conditions of the Creative Commons Attribution (CC BY) license (http://creativecommons.org/licenses/by/4.0/).
Share and Cite
Crespo, N.E.; Torres-Bracero, A.; Renta, J.Y.; Desnick, R.J.; Cadilla, C.L. Expression Profiling Identifies TWIST2 Target Genes in Setleis Syndrome Patient Fibroblast and Lymphoblast Cells . Int. J. Environ. Res. Public Health 2021, 18, 1997. https://0-doi-org.brum.beds.ac.uk/10.3390/ijerph18041997
Crespo NE, Torres-Bracero A, Renta JY, Desnick RJ, Cadilla CL. Expression Profiling Identifies TWIST2 Target Genes in Setleis Syndrome Patient Fibroblast and Lymphoblast Cells . International Journal of Environmental Research and Public Health. 2021; 18(4):1997. https://0-doi-org.brum.beds.ac.uk/10.3390/ijerph18041997
Chicago/Turabian StyleCrespo, Noe E., Alexandra Torres-Bracero, Jessicca Y. Renta, Robert J. Desnick, and Carmen L. Cadilla. 2021. "Expression Profiling Identifies TWIST2 Target Genes in Setleis Syndrome Patient Fibroblast and Lymphoblast Cells " International Journal of Environmental Research and Public Health 18, no. 4: 1997. https://0-doi-org.brum.beds.ac.uk/10.3390/ijerph18041997