1. Introduction
Clinical trials are used to determine the efficacy and toxicity of medications in humans. Although effective in elucidating various acute responses to the pharmaceutical compound in question, clinical trials are inherently limited by representation bias, size, and duration [
1,
2]. Current methods of toxicity and drug testing are unable to predict adverse drug reaction (ADR) across diverse populations under conditions of chronic exposure [
3,
4]. Such ADRs are a significant global health issue that affects millions of people each year with and accounting for an estimated 17% of hospital readmissions [
5,
6,
7,
8].
One response to this inherent short-coming in predicting and preventing ADRs has been the Tox21 Program. Through collaborative efforts, the U.S. National Institute of Health (NIH), Federal Drug Administration (FDA), and Environmental Protection Agency (EPA) have come together to help promote the evolution of toxicological testing and achieve specific goals that would increase both acute and predictive testing capacities [
9]. To increase the ability to understand toxicity effects via data-driven predictions, the program outlines key objectives that address current limitations in identifying rare idiosyncratic responses, characterizing non-genotoxic potential carcinogens, gaining further insight into Adverse Outcome Pathways for risk assessment, and other gaps in testing technology [
9].
To fuel the large-scale studies geared towards advancing toxicological and predictive technology, scientists utilize centralized real-world evidence (RWE) databases that contain individual level records of adverse events and associated patient features. Such sources, include the FDA Adverse Event Reporting System (FAERS) dataset which has been standardizing post-market adverse event reports for over six years and the UK Biobank (UKBB), which links a large set of clinical variables (including medications) longitudinally to genetic information [
5,
10]. These databases compile relevant information with the intent to improve public health through innovation and discovery [
11].
Machine learning may be able to fill the gaps outlined in the Tox21 program by creating models that are predictive, scalable, cost-effective, and adaptable. More specifically, computational methods that have been adapted to biomedical applications, such as toxicity testing, drug responses, and drug discovery, include approaches that leverage Morgan Fingerprints (Morgan FP), Graph Convolutional Networks (GCNs), and Neural Networks (NNs) for Deep Learning applications [
12,
13].
Such methods utilize structural characteristics of molecules as inputs to computational programs, which in turn, informs in vivo response predictions. Morgan FP, for example, represent key molecular substructures using an explicitly defined featurization. However, a limitation of this specific methodology is its inability to adaptively learn alternative representations that may be more adapted to a particular task [
13].
Differing from traditional fingerprint representations, GCNs represent atoms, molecular connectivity, and bond characteristics in a graph-based format. The relationships between neighboring atom-level features that are most informative for a particular task can be learned as the network updates the weights connecting each of the graph convolutional layers [
13]. Since featurization and task prediction happen simultaneously in GCN based models, they have significantly higher model complexity and typically require a large dataset in order to outperform traditional machine learning approaches based on traditional fingerprint representations. Alternatively, a pre-training strategy can be used where the model is first trained on a related task (on which a large dataset is available) and then subsequently fine-tuned [
14].
Integrative approaches are required to not only enable accurate predictions, but also to address the need for real world applicability. In clinical practice, it is common for those with chronic disease to be on a regimen of multiple medications, which has a positive correlation with the occurrence of ADRs [
15,
16]. Not only are multiple medications required for patients with comorbidities, but a single illness may also commonly treated with more than one medication [
17,
18]. The Center for Disease Control reported that from 2013–2016, in the U.S. alone, 24% of the population reported using three or more medications, whereas 12.6% reported using five or more within the month preceding the survey [
15].
While efforts have been made to create machine learning approaches and corresponding databases that capture new ADRs or drug-drug interactions [
19], they are limited in their ability to generalize across larger sets. The computational costs and data required to model these higher order interactions scales exponentially with the number of drug interactions (i.e., n, n
2, n
3, for single drug, drug-drug, and drug triplet interactions respectively) and as such no existing method can flexibly learn interactions across all medications for patients on multiple medications. Additionally, incorporating other risk factors into the model such as demographic and clinical data can be important in obtaining the most accurate predictions and disentangling confounding risks [
2,
20,
21].
In this paper, we discuss an integrative, precision medicine approach to multi-drug adverse event prediction. The strategy utilized seeks to fill translational gaps in current predictive methodologies.
2. Materials and Methods
2.1. Drug Name to Chemical Structure
Pubchempy (an open source Github repository) was used to convert drug names or active ingredient to isomeric SMILES representation. Simple text filtering for case and punctuation was performed on the drug name input.
2.2. Chemical Structure Featurization of Single Molecules
In our GCN, SMILES structures are featurized using functionality from RDkit (an open source Github repository). Specifically, atom-level features consisting of a one-hot encoding if the atom is either C, N, O, F, P S, Cl, Br, I, the atomic number, a one-hot coding of chirality, the atoms degree (number of neighboring atoms), formal charge, number of hydrogens, number of radical electrons, a one-hot encoding of hybridization, whether it is or is not aromatic, and whether it is or is not in a ring. Bond-level features including, conjugated status, a one hot encoding of bond type (single, double, triple, aromatic), and a one hot encoding of whether the bond is stereoisomeric. We chose to concatenate the bond-level features to the atom-level features by summing over all bonds directly connected to each atom. This resulted in a feature vector of length 42 for each atom. Finally, we constructed the connectivity matrix between atoms and loaded these features into a Pytorch Geometric Data object.
For cases in which a linear model was to be used as a comparator to the neural network architecture, SMILES structures were featurized into binary feature vectors of length 2048 using Morgan FP with radius 2 using the python package RDkit.
2.3. Extension to Multi-Drug Framework
For our GCN, the atom-level connectivity matrices for each molecule were connected in a block diagonal manner with atom-level and bond-level features being adjoined directly.
For use in the linear model comparisons when patients were taking multiple medications, the maximum value of each element of the Morgan fingerprint across all medications was used as the corresponding featurization for the linear model (again resulting a vector of length 2048).
2.4. Linear/Logistic Regression
For continuous variables, such as predicting hospitalization in the UKBB dataset, a linear regression with an L2 norm penalty (Ridge regression) was used as a comparator model (sklearn’s Ridge module with default parameters).
For discrete variables, such as predicting death or outcome labels in the FAERS dataset a comparable model using sklearn’s logistic regression (with default parameters) was used.
2.5. Neural Network/Graph Convolutional Neural Network
For non-drug features, a simple neural network was constructed with the following form:
Linear layer transforming the feature vector into a hidden dimension (100 in our model)
Rectified linear unit (ReLU) transform
Batch normalization
Fully connected linear layer transforming hidden dimension to hidden dimension
ReLU transform
Linear layer transforming hidden dimension to target dimension
For medication associated features, the following architecture was used based roughly on [
14,
22]:
GINConv (graph isomorphism) layer feature vector into a hidden dimension (100 in our model)
Rectified linear unit (ReLU) transform
Batch normalization
Four additional layers as in 1–3 above
Medication features are aggregated using pooling operators including Set2Set [
23], global_max_pool, and global_mean_pool, available in the PyTorch Geometric library.
For the combined model, the outputs of the architectures described above are concatenated for the relevant feature subset.
2.6. Model Evaluation
In all cases, 5-fold cross validation is performed to evaluate model performance.
2.7. Feature Attribution/Importance
To evaluate the importance of individual features within the combined neural network architecture the Integrated Gradients method [
24] within the Captum library for PyTorch was used. The sum of all gradients for each feature across patients is used as an estimate of feature importance.
2.8. UK Biobank
UK Biobank (UKBB) contains deep genetic and phenotype information on approximately 500,000 individuals from across the United Kingdom who were aged 40 to 69 at recruitment [
10]. Our data were resourced under Application Number 5424. It is available to researchers pending confirmation of their institutional affiliations by their approval committee and payment of any applicable fees.
Medication and health supplements data (Data Field: 20,003) were coded using 6745 categories (Data coding 4) which were mapped to their corresponding active ingredient follow steps similar to those in [
11]. This active ingredient was used to obtain SMILES stings and featurization as described above.
Clinical features for each patient were extracted from ICD10 codes (Data Field: 41,202). PCA was performed across all patients to reduce the dimensionality and the scores were extracted as a representation of the “clinical status” of each patient.
A summary of the key subsets of the UKBB dataset that we reference in this work is described in
Table 1.
2.9. FDA FAERS
We captured a total of 8,224,912 unique cases in the FAERS database spanning the years between 2014–2020 (through Q3 2020). The data may be readily accessed through the FDA’s online portal. The data were further filtered by the reported role the drug played in the adverse event report, which is characterized by the physician. We only selected drugs that were characterized as primary suspect drugs, secondary suspect drugs, or suspected interacting drugs (PS, SS, or I in the DRUG file), meaning they may have played an important role in the adverse event. Finally, we performed filtering to remove potentially duplicated entries for cases in which the same combination of sex, weight, age, and medications appeared more than once.
A summary of the key subsets of the FAERS dataset that we reference in this work is described in
Table 2.
3. Results
We sought to construct a machine learning framework that could incorporate vast (but often disparate and filled with missing data elements) RWE databases to predict adverse events (
Figure 1). We imposed the requirement that the model be able to flexibly model patients who are on multiple medications without being explicitly constrained to pairwise drug-drug interactions or those previously described.
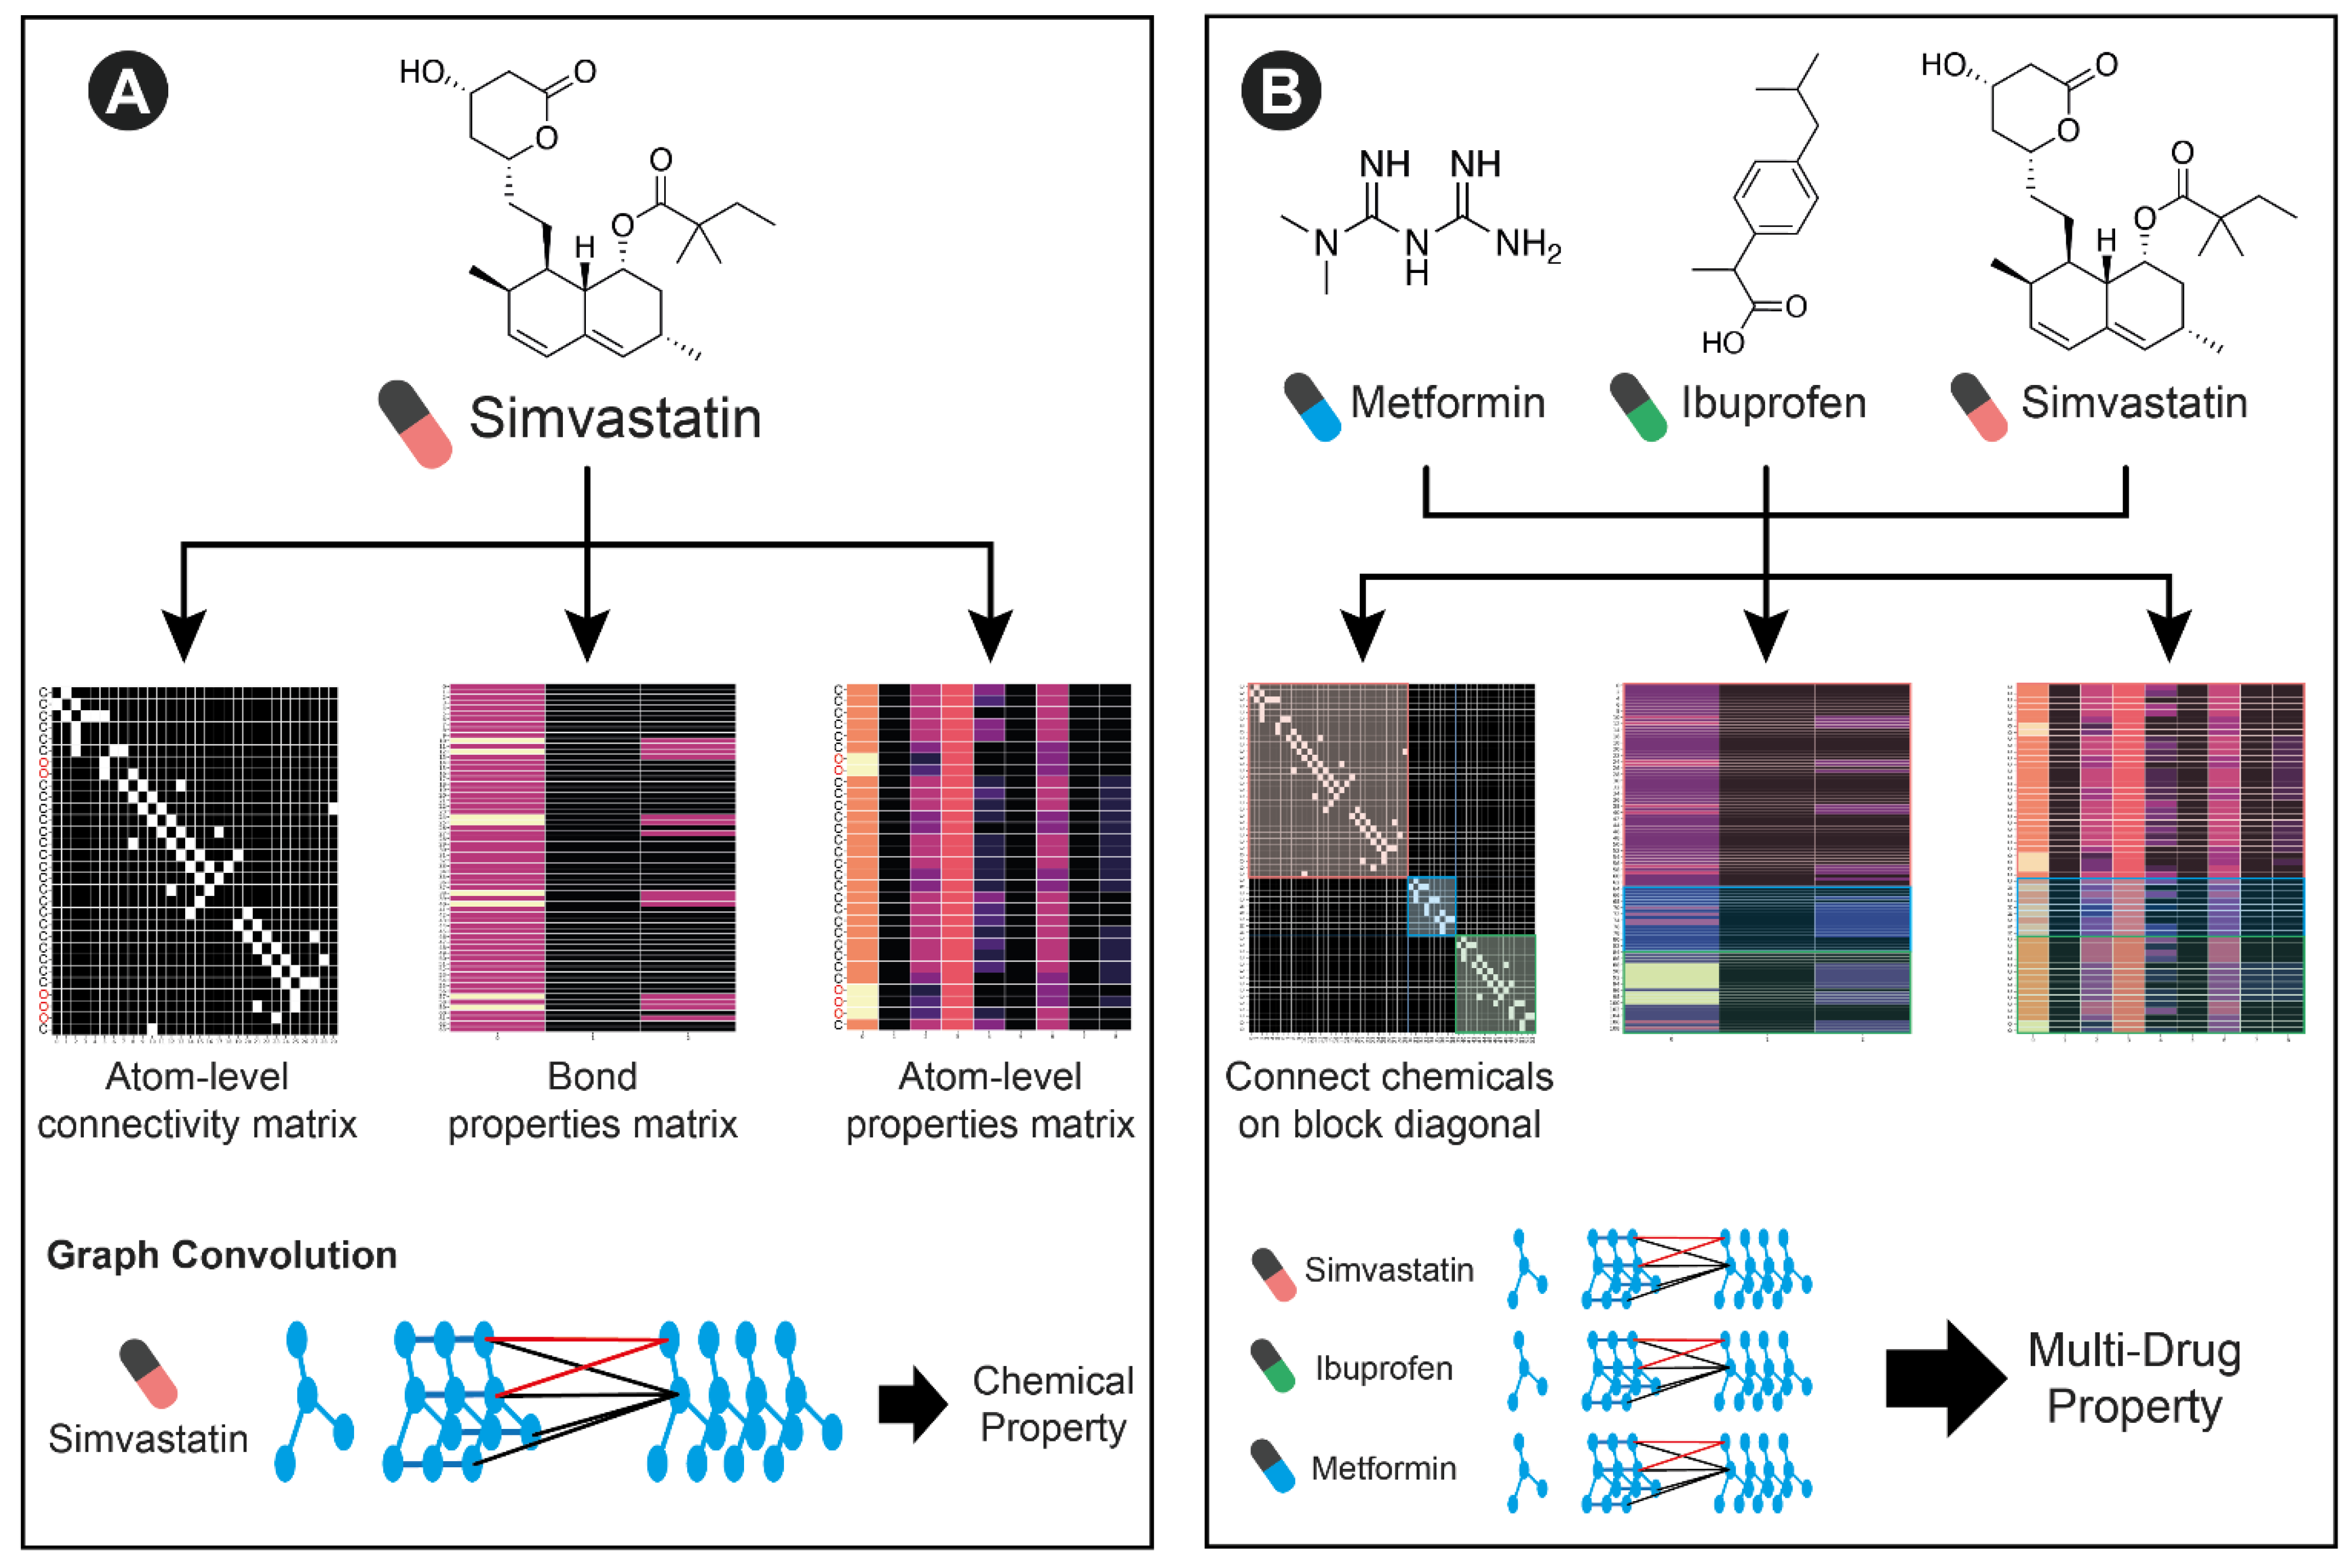
In order to model the variable number of medications that any patient may be taking, we leverage the graph-based featurization of molecules that GCNs can learn (
Figure 2). A single chemical can be represented by the connectivity between atoms, atom-level features, and bond-level features. By concatenating atom level connectivity matrices in a block diagonal format, and simply concatenating atom and bond-level features, multiple molecules can be featurized together. This concatenation represents a collection of disjoint subgraphs. Since there are no connections between different molecules in the connectivity matrix, the GCN operations will not incorporate information across molecules. However, subsequent fully connected operations can learn from the collection of extracted features. With a sufficiently large training dataset, this architecture is able to learn new chemical features and interactions between them that predict multi-drug properties including adverse events.
In order to flexibly model other available individually predictive features (such as age, sex, weight, and genetics), we create separate compact neural networks that learn representations of these features. Finally, the learned representations across each small neural network and the GCN can be combined in a final set of neural network layers to predict the patient-level variable of interest.
3.1. Predicting Adverse Events in the UK Biobank Dataset
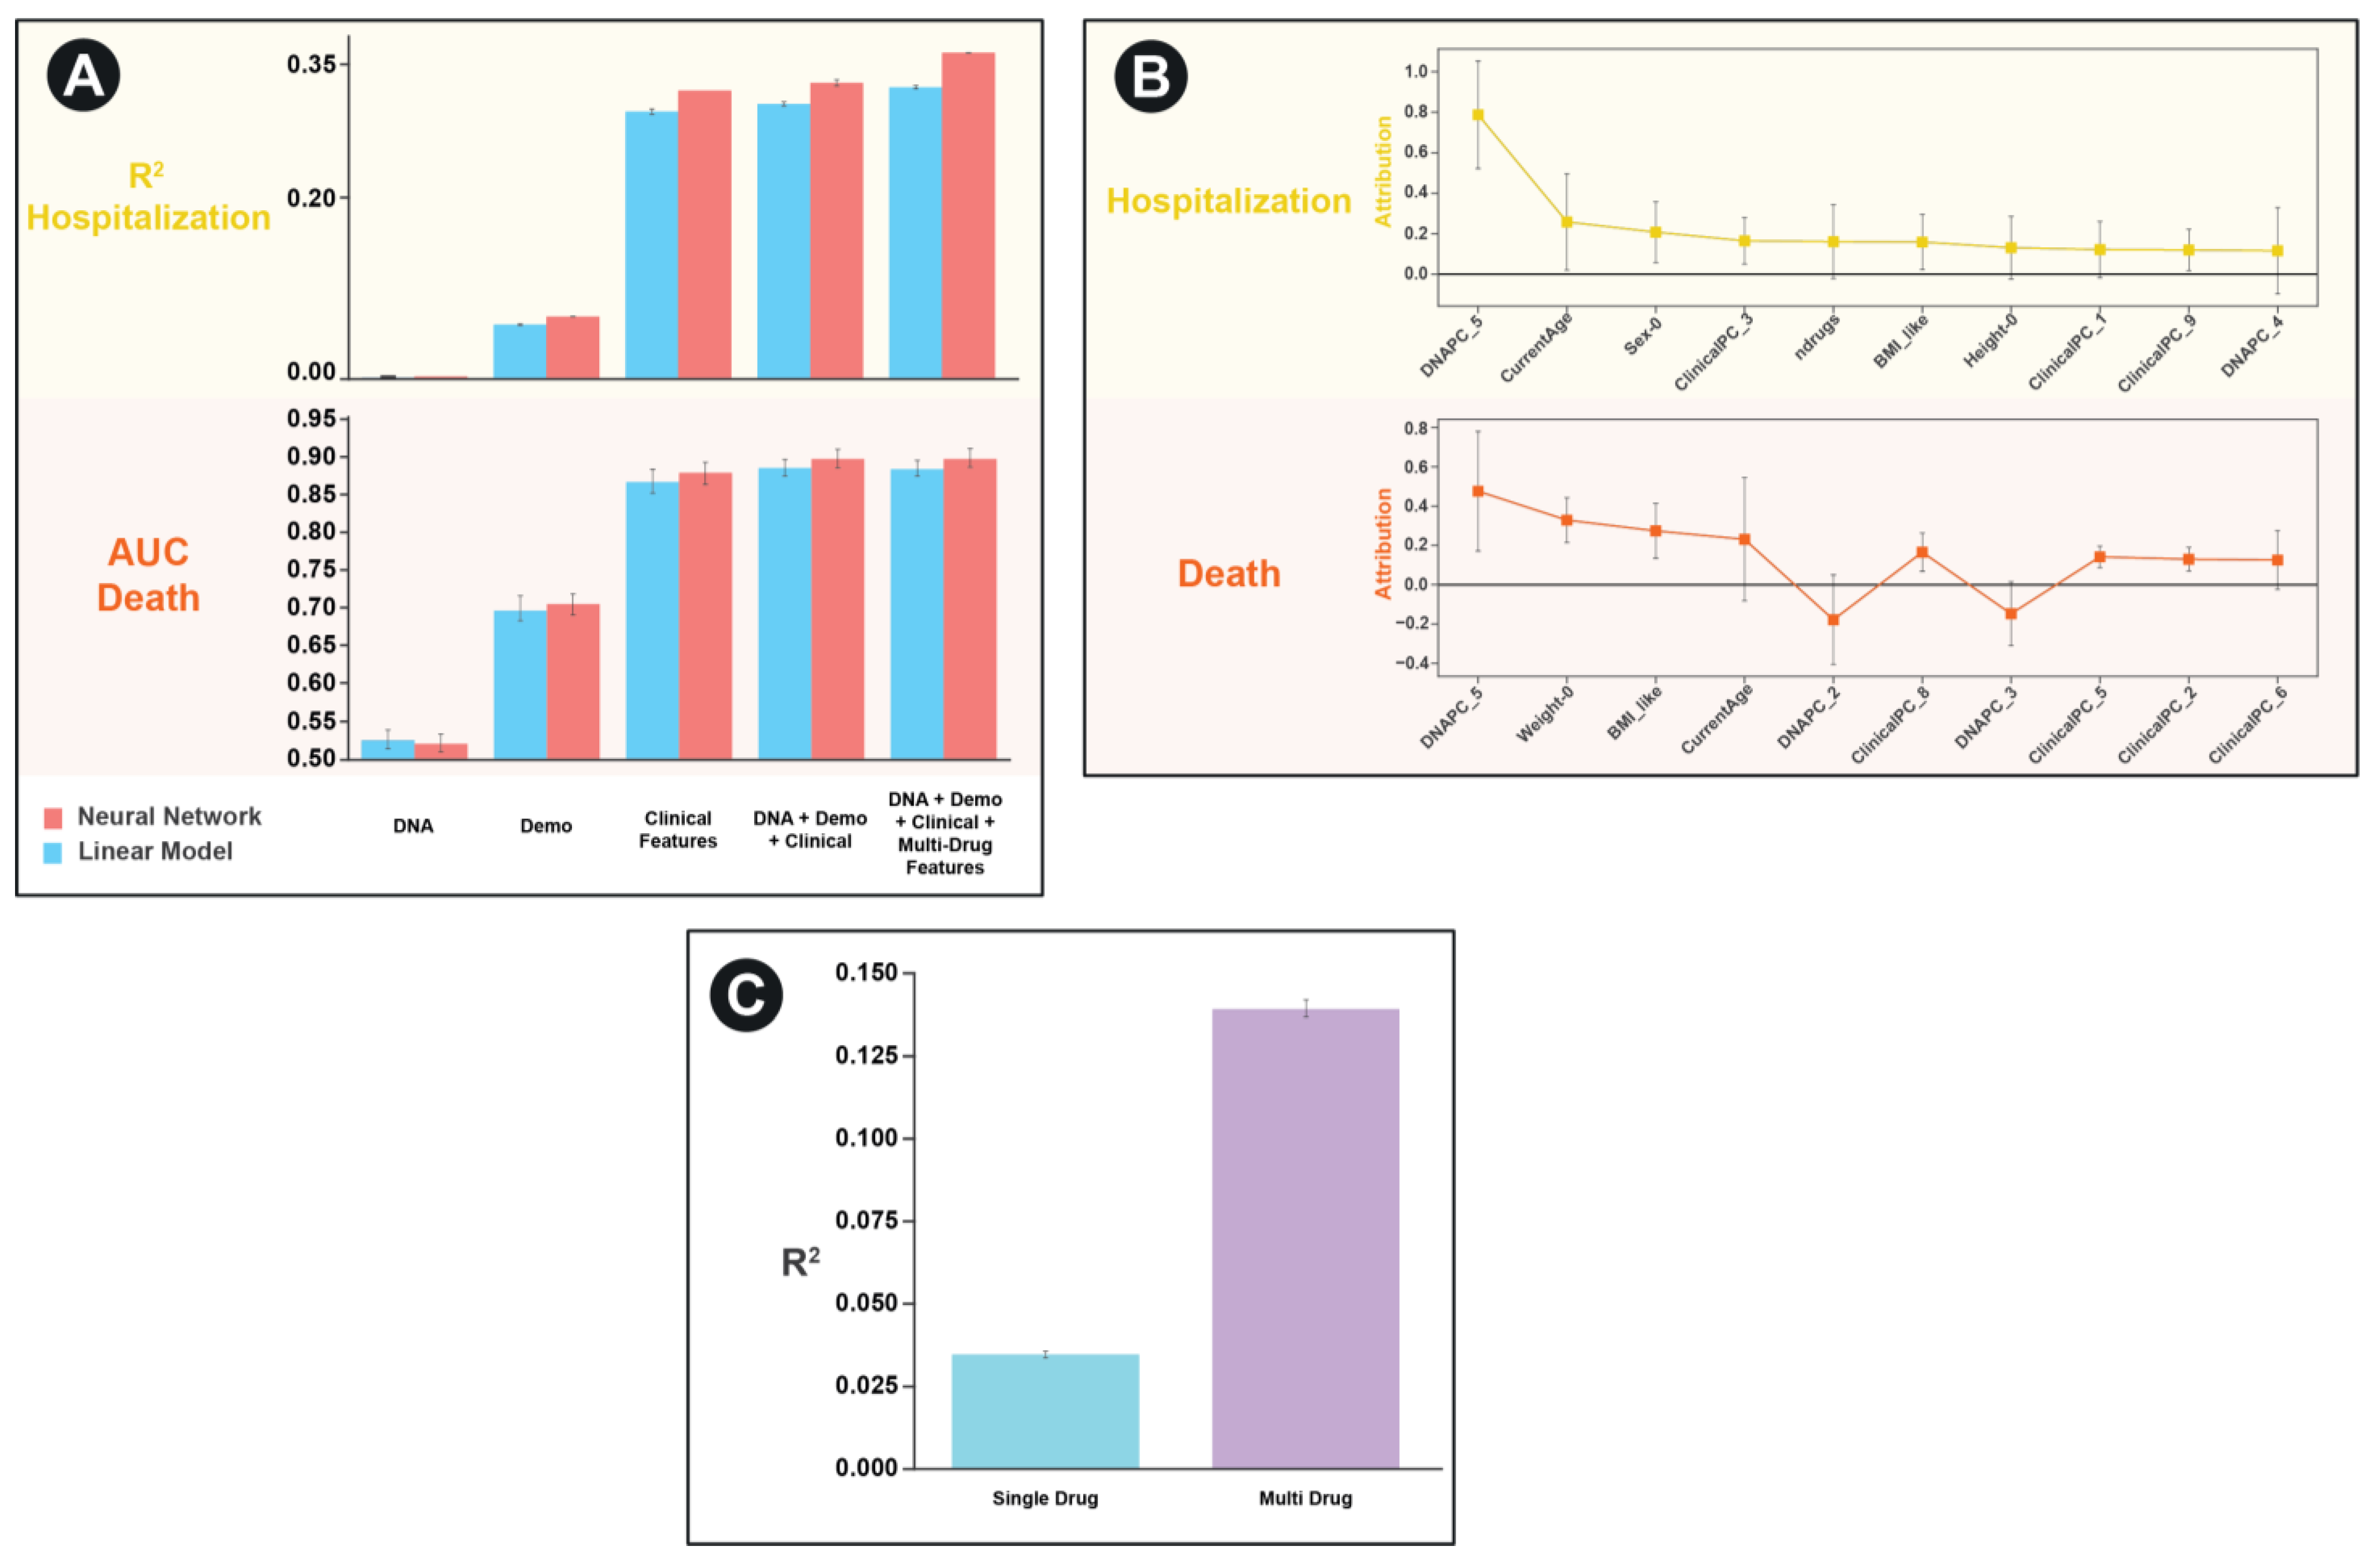
In order to test the performance of our framework, we applied it to the UK Biobank dataset on two separate tasks: predicting the number of hospitalizations a patient experienced and predicting whether an individual has died. We were particularly interested in characterizing the relative importance of each of the features and any nonlinear interactions between features. As such we create separate models that contained each of the individual features as well as a combined model containing all features. To benchmark the performance of our approach, we contrast the neural network performance with that of a linear model (which would have limited ability to discern interactions between feature sets) (
Figure 3A).
For both the task of predicting hospitalization and death in the UKBB, we found that clinical features (based on PCA scores of ICD10 codes) to be the most predictive individual feature set. For hospitalization, but not death, we find that the neural network architectures significantly outperformed the simple linear model for every feature set except the genetic principal components by themselves. Similarly, for hospitalization, but not death, we find a combined model including multi-drug GCN features significantly improves the predictive performance of the model compared to one without those features (R
2 0.364 vs. 0.331,
p = 0.00004,
Figure 3A).
As a final evaluation of feature importance in the combined model, we use the Integrated Gradients approach to assess contributions of the non-drug features [
24]. Surprisingly, we find that despite the fact that the both DNA and demographic features had relatively low predictive performance individually, they were amongst the most predictive features in the combined model (
Figure 3B).
To highlight the improvements made possible by our multi-drug framework compared to a single-drug framework, we revaluated performance on the task of predicting hospitalization for the subset of patients who are on 2 or more medications. We compare the performance of a model that only considers one randomly selected drug per patient to a model that considers all drugs (
Figure 3C). We find a highly significant improvement in model performance (R
2 of 0.035 vs. 0.14,
p < 10
−10).
3.2. Predicting Adverse Events in the FDA FAERS Dataset
We next sought to apply our framework to the FDA FAERS dataset. It contains a larger volume of data and a more targeted set of adverse event labels. Specifically, we attempted to predict the outcomes codes using a similar set of features to those available in the UK Biobank (except for DNA/genetic features which are not available in FAERS).
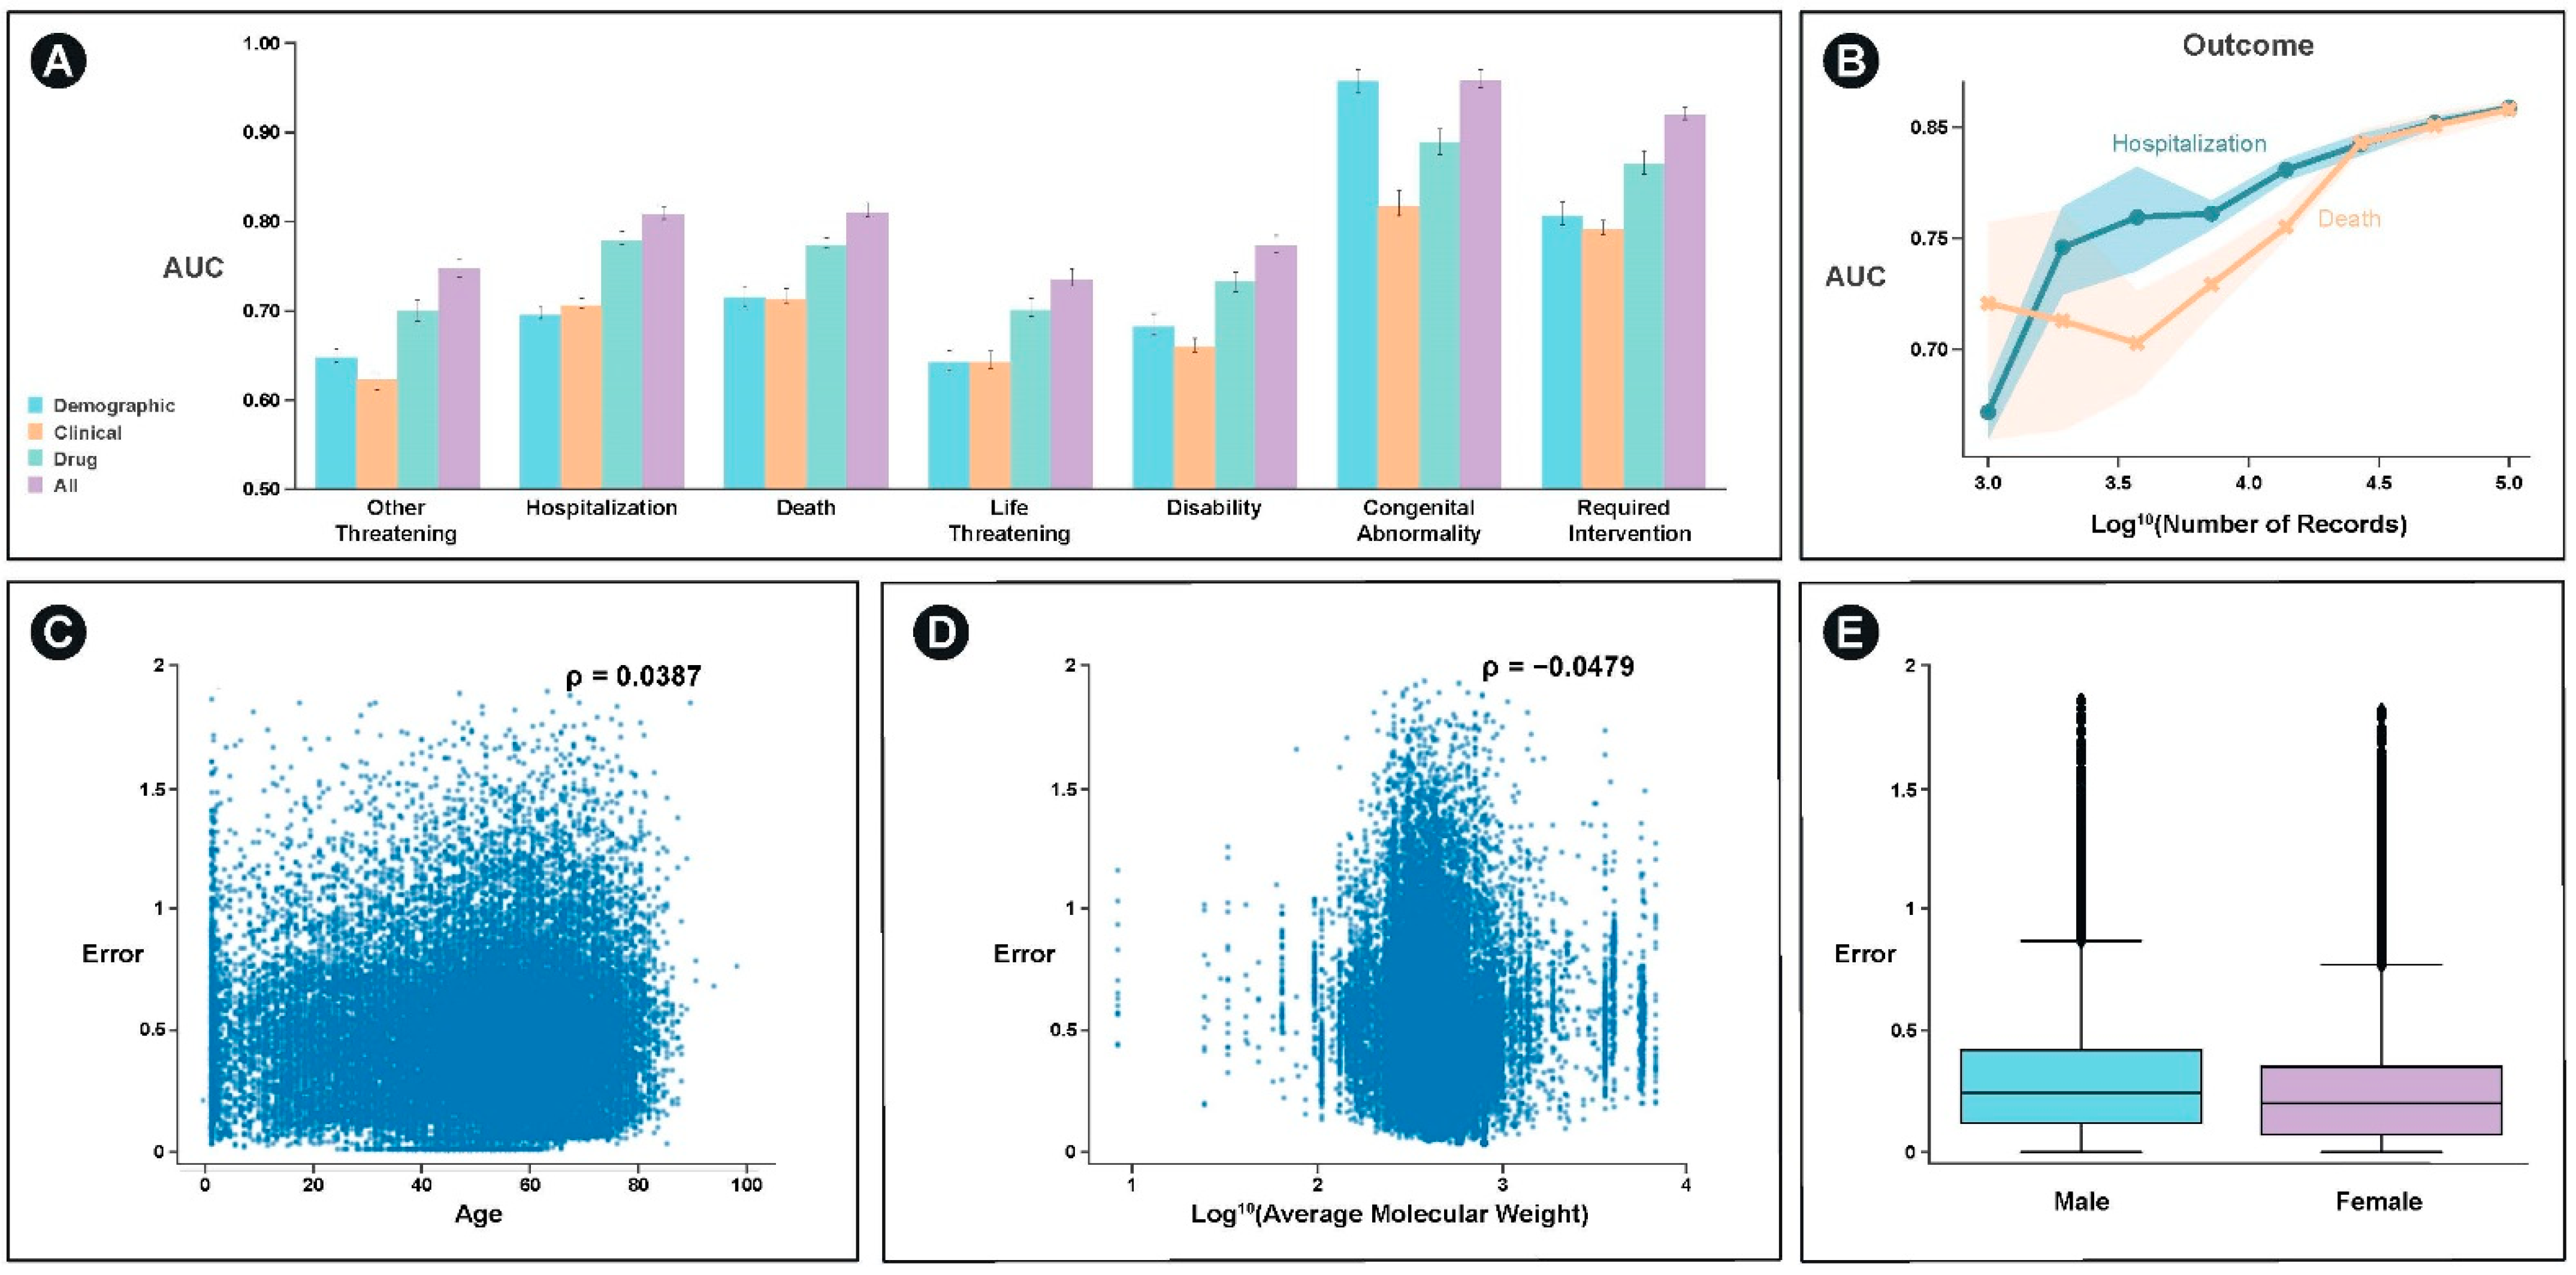
With the exception of congenital abnormality, which can be significantly predicted with demographic information such as age, the best single feature set for predicting the majority of outcomes was drug structure specific features (
Figure 4A). For most categories, an integrated model of demographic, clinical, and drug structure significantly outperformed any of the individual feature set models. These categories included hospitalization (
p < 10
−5) and death (
p < 10
−5).
We examined the extent to which model performance would be expected to improve through the incorporation of additional data and find that the model would continue to improve for both the prediction of hospitalization and death (
Figure 4B). Additionally, we examine the extent to which the model performs better or worse as a function of the covariates we used. We find weak, but significant relationships between age, average molecular weight, and sex and model error (
p < 10
−6) (
Figure 4C–E).
4. Discussion
The two datasets analyzed in this paper have contrasting strengths and weaknesses. The UK Biobank includes deep genetic and phenotype information to compare the relative predictive performance of a wide range of well annotated features, but is generally limited to adults 40 years and older in the United Kingdom. It does not have a well-curated a collection of adverse event labels and, as such, surrogate labels such as hospitalization or death were used in this paper. In contrast FDA FAERS collection, is solely focused on adverse events with detailed event labels, however, the database contains selection bias against patients who did not suffer any adverse events on a medication. As such, a predictor built on FDA FAERS will overestimate the likelihood of a particular patient in the general population on a particular combination of medications having an adverse event without performing an additional calibration for how widely those particular medications are prescribed.
There are several promising directions for expanding upon and improving the approach described in this paper. These range from feature expansion for the representation of each atom (including aspects such as drug route of administration and dosage) in each chemical to optimization of the model architecture. One particularly promising area is the incorporation of convolutions which incorporate bond features and the spatial relationships between atoms [
25,
26].
The Integrated Gradients approach that we used can also be used to increase model interpretability on drug features. Specifically, the relative importance of particular chemical motifs (and interactions between motifs across medications) that drive the prediction a particular individual to experience an adverse event can be visualized [
24].
We also note several limitations of the work we present here. Modification of model architecture would likely be required to incorporate and model the impact of biologic therapies. Additionally, for the FAERS dataset, we filtered to around 3% of the overall dataset, this limited dataset may have reduced the ability of the GCN approach to learn improved featurizations. As such, we could either use less strict filtering or pre-train the GCN using other datasets such as the Tox21 Data Challenge or UKBB data sets.
Despite the limited performance of genetic features as standalone predictors of ADRs, we were encouraged by the feature importance of several genetic principal components in the combined model to predict hospitalization in the UKBB dataset. As such we explored using a more comprehensive genetic feature set and developed a companion manuscript, which describes a more thorough variant level prediction of the genetic basis of ADRs across the millions of genetic variants present in the UKBB.
Finally, we highlight two specific examples to illustrate situations in which our model performs poorly and when it performs well. In the first example, we describe the case of a 30-year-old female on Nexplanon who experienced a hospitalization and related life-threatening event that our model failed to predict. We find multiple similar cases of patients on Nexplanon or Nuvaring (implantable birth control medications that the model performed poorly on (there are 659 such cases in our FAERS dataset, and we find they have a 32% higher error than other cases, p < 10−4). We hypothesize that this is due to the route of administration not being a component of our model (i.e., pill, infusion, eluting implantable device, etc). In our second example, we highlight the case of a 35-year-old female taking multiple medications who is likely immunocompromised on medications for multiple infections and HIV antiretrovirals whose four adverse events were predicted almost perfectly (difference between actual adverse event outcomes and predicted probabilities was 0.82 out of 7).
5. Conclusions
In this work, we compare the relative predictive utility of demographic, genetic, clinical, multiple drug structures, and the integration of these features to predict adverse outcomes in real world evidence databases including the UKBB and FAERS dataset (
Table 3).
In the UKBB, we find that in many cases the incorporation of a neural network framework significantly improved predictive performance relative to a standard linear model suggesting the presence of nonlinear interactions between features. We also find that in an integrated model of all features, which outperformed and of the single feature models for hospitalization, demographic and genetic features had significant weights despite not having strong individual level performance.
Similarly, in the FAERS dataset we find that a combined model of demographic, clinical, and multi-drug feature sets is able to outperform any individual feature set for key outcomes like hospitalization and death. This result suggests a role for personalized medicine approaches to predictive toxicology that incorporate patient specific and multi-drug structure features into joint models.
As part of this work we outline and implement a multi-drug GCN framework that is able to flexibly incorporate the variable numbers of medications that real-world patient populations are taking. Built on a deep neural network architecture and deployed on GPU frameworks, it has the potential to rapidly learn complex interactions from growing databases of real-world evidence.
Overall, we believe that these methods will facilitate more accurate predictive personalized toxicology efforts in the future.
Author Contributions
Conceptualization, methodology, software, data analysis, and visualization I.N.A. and A.C.D.; writing—original draft preparation, I.N.A., C.K.H. and A.C.D.; writing—review and editing, A.C.D.; visualization, A.C.D.; supervision, A.C.D. and K.N.D.; project administration, A.C.D. and K.N.D.; clinical significance review, C.K.H. and K.N.D.; funding acquisition, A.C.D. All authors have read and agreed to the published version of the manuscript.
Funding
This research was supported by internal funding and the NIH SBIR program, grant number 1R44ES032515-01.
Institutional Review Board Statement
Not applicable. No new human data was collected for this project. Anonymized data was obtained as per UK Biobank policies.
Informed Consent Statement
Not applicable.
Data Availability Statement
Acknowledgments
This research has been conducted using the UK Biobank Resourced under Application Number 54241. We thank Tyler Yath for his early conceptualization efforts predicting adverse events from chemical structures using image convolutions.
Conflicts of Interest
A.D. and K.D. are equity holders in Coral Genomics, Inc.
References
- Clark, L.T.; Watkins, L.; Piña, I.L.; Elmer, M.; Akinboboye, O.; Millicent, G.; Jamerson, B.; McCullough, C.; Pierre, C.; Polis, A.B.; et al. Increasing Diversity in Clinical Trials: Overcoming Critical Barriers. Curr. Probl. Cardiol. 2019, 44, 148–172. [Google Scholar] [CrossRef]
- Mak, W.W.S.; Law, R.W.; Alvidrez, J.; Pérez-Stable, E.J. Gender and Ethnic Diversity in NIMH-Funded Clinical Trials: Review of a Decade of Published Research. Adm. Policy Ment. Heal. Ment. Heal. Serv. Res. 2007, 34, 497–503. [Google Scholar] [CrossRef]
- Ramamoorthy, A.; Pacanowski, M.; Bull, J.; Zhang, L. Racial/Ethnic Differences in Drug Disposition and Response: Review of Recently Approved Drugs. Clin. Pharmacol. Ther. 2015, 97, 263–273. [Google Scholar] [CrossRef] [PubMed]
- Ksenia, J.G.; Carvalhoc, N.R.; Chipmand, K.J.; Denslowe, N.D.; Halder, M.; Murphy, C.A.; Roelofs, D.; Rolaki, A.; Schirmer, K.; Watanabek, K.H. Development and Application of the Adverse Outcome Pathway Framework for Understanding and Predicting Chronic Toxicity: I. Challenges and Research Needs in Ecotoxicology. Chemosphere 2015, 120, 764–777. [Google Scholar]
- Ngufor, C.; Wojtusiak, J.; Pathak, J. A Systematic Prediction of Adverse Drug Reactions Using Pre-Clinical Drug Characteristics and Spontaneous Reports. Int. Conf. Healthc. Inform. 2015. [Google Scholar] [CrossRef]
- Center for Disease Control and Prevention, Adverse Drug Events in Adults. Available online: https://www.cdc.gov/medicationsafety/adult_adversedrugevents.html (accessed on 14 December 2020).
- Willson, N.M.; Greer, C.L.; Weeks, D.L. Medication Regimen Complexity and Hospital Readmission for an Adverse Drug Event. Ann. Pharmacother. 2014, 48, 26–32. [Google Scholar] [CrossRef] [PubMed]
- White, J.T.; Arakelian, A.; Rho, J.P. Counting the Costs of Drug-Related Adverse Events. Pharmacoeconomics 1999, 15, 445–458. [Google Scholar] [CrossRef]
- Administration, U.F.D. FDA Predictive Toxicology Roadmap. Available online: https://www.fda.gov/media/109634/download (accessed on 14 December 2020).
- Bycroft, C.; Freeman, C.; Petkova, D.; Band, G.; Lloyd, T.E.; Sharp, K.; Motyer, A.; Vukcevic, D.; Delaneau, O.; O’Connell, J.; et al. The UK Biobank Resource with Deep Phenotyping and Genomic Data. Nature 2018, 562, 203–209. [Google Scholar] [CrossRef] [Green Version]
- Wu, Y.; Byrne, E.M.; Zheng, Z.; Kemper, K.E.; Yengo, L.; Mallett, A.J.; Yang, J.; Visscher, P.M.; Genome, W.N.R. Wide Association Study of Medication-Use and Associated Disease in the UK Biobank. Nat. Commun. 2019, 10, 1891. [Google Scholar] [CrossRef] [Green Version]
- Mayr, A.; Klambauer, G.; Unterthiner, T.; Hochreiter, S. DeepTox: Toxicity Prediction Using Deep Learning. Front. Environ. Sci. 2016, 3, 80. [Google Scholar] [CrossRef] [Green Version]
- Kearnes, S.; McCloskey, K.; Berndl, M.; Pande, V.; Riley, P. Molecular Graph Convolutions: Moving Beyond Fingerprints. J. Comput. Aided Mol. Des. 2016, 30, 595–608. [Google Scholar] [CrossRef] [PubMed] [Green Version]
- Hu, W.; Liu, B.; Gomes, J.; Zitnik, M.; Liang, P.; Pande, V.; Leskovec, J. Strategies for Pre-Training Graph Neural Networks. arXiv 2019, arXiv:1905.12265v3. Available online: https://arxiv.org/abs/1905.12265 (accessed on 14 December 2020).
- Therapeutic Drug Use. Center for Disease Control. 2020. Available online: https://www.cdc.gov/nchs/fastats/drug-use-therapeutic.htm (accessed on 14 December 2020).
- Sommer, J.; Seeling, A.; Rupprecht, H. Adverse Drug Events in Patients with Chronic Kidney Disease Associated with Multiple Drug Interactions and Polypharmacy. Drugs Aging 2020, 37, 359–372. [Google Scholar] [CrossRef] [PubMed]
- Libby, A.M.; Fish, D.N.; Hosokawa, P.W.; Linnebur, S.A.; Metz, R.K.; Nair, K.V.; Saseen, J.J.; Griend, J.P.V.; Vu, S.P.; Hirsch, J.D. Patient-Level Medication Regimen Complexity Across Populations with Chronic Disease. Clin. Ther. 2013, 35, 385–398. [Google Scholar] [CrossRef] [PubMed] [Green Version]
- Sun, J.A.; Li, S.; Zhang, A.C.; Jensen, K.T.; Lindahl-Jacobsen, R.; Eisenberg, M.L. Parental Comorbidity and Medication Use in the USA: A Panel Study of 785 000 Live Births. Hum. Reprod. 2020, 35, 669–675. [Google Scholar] [CrossRef] [PubMed]
- Tatonetti, P.N.; Ye, P.P.; Daneshjou, R.; Altman, R.B. Data-Driven Prediction of Drug Effects and Interactions. Sci. Transl. Med. 2012, 4. [Google Scholar] [CrossRef] [Green Version]
- Alomar, M.J. Factors Affecting the Development of Adverse Drug Reactions (Review Article). Saudi Pharm. J. 2014, 22, 83–94. [Google Scholar] [CrossRef] [Green Version]
- Hajjar, E.R.; Hanlon, J.T.; Artz, M.B.; Lindblad, C.I.; Pieper, C.F.; Sloane, R.J.; Ruby, C.M.; Schmader, K.E. Adverse Drug Reaction Risk Factors in Orlder Outpatients. Am. J. Geriatr. Pharmacother. 2003, 1, 82–89. [Google Scholar] [CrossRef]
- Xu, K.; Hu, W.; Leskovec, J.; Jegelka, S. How Powerful are Graph Neural Networks? arXiv 2018, arXiv:1810.00826. Available online: https://arxiv.org/abs/1810.00826 (accessed on 14 December 2020).
- Vinyals, O.; Bengio, S.; Kudlur, M. Order Matters: Sequence to Sequence for Sets. arXiv 2015, arXiv:1511.06391. Available online: https://arxiv.org/abs/1511.06391 (accessed on 14 December 2020).
- Sundararajan, M.; Taly, A.; Yan, Q. Axiomatic Attribution for Deep Networks. In Proceedings of the 34th International Conference on Machine Learning, Sydney, Australia, 6–11 August 2017; Available online: http://proceedings.mlr.press/v70/sundararajan17a.html (accessed on 14 December 2020).
- Simonovsky, M. Komodakis Dynamic Edge-Conditioned Filters in Convolutional Neural Networks on Graphs. In Proceedings of the IEEE Conference on Computer Vision and Pattern Recognition, Honolulu, HI, USA, 21–26 July 2017; pp. 3693–3702. [Google Scholar]
- Feinberg, E.N.; Sur, D.; Wu, Z.; Husic, B.E.; Mai, H.; Li, Y.; Sun, S.; Yang, J.; Ramsundar, B.; Pande, V.S. PotentialNet for Molecular Property Prediction. ACS Cent. Sci. 2018, 4, 1520–1530. [Google Scholar] [CrossRef] [PubMed]
| Publisher’s Note: MDPI stays neutral with regard to jurisdictional claims in published maps and institutional affiliations. |
© 2021 by the authors. Licensee MDPI, Basel, Switzerland. This article is an open access article distributed under the terms and conditions of the Creative Commons Attribution (CC BY) license (http://creativecommons.org/licenses/by/4.0/).


