
A Data Augmentation-Based Evaluation System for Regional Direct Economic Losses of Storm Surge Disasters


Abstract
:1. Introduction
2. Methodology
2.1. The Disaster Loss Assessment Index System
2.1.1. Disaster-Causing Factors
2.1.2. Disaster-Formative Environment
2.1.3. Disaster-Affected Bodies
2.1.4. Disaster Prevention Capabilities
2.2. Data Input
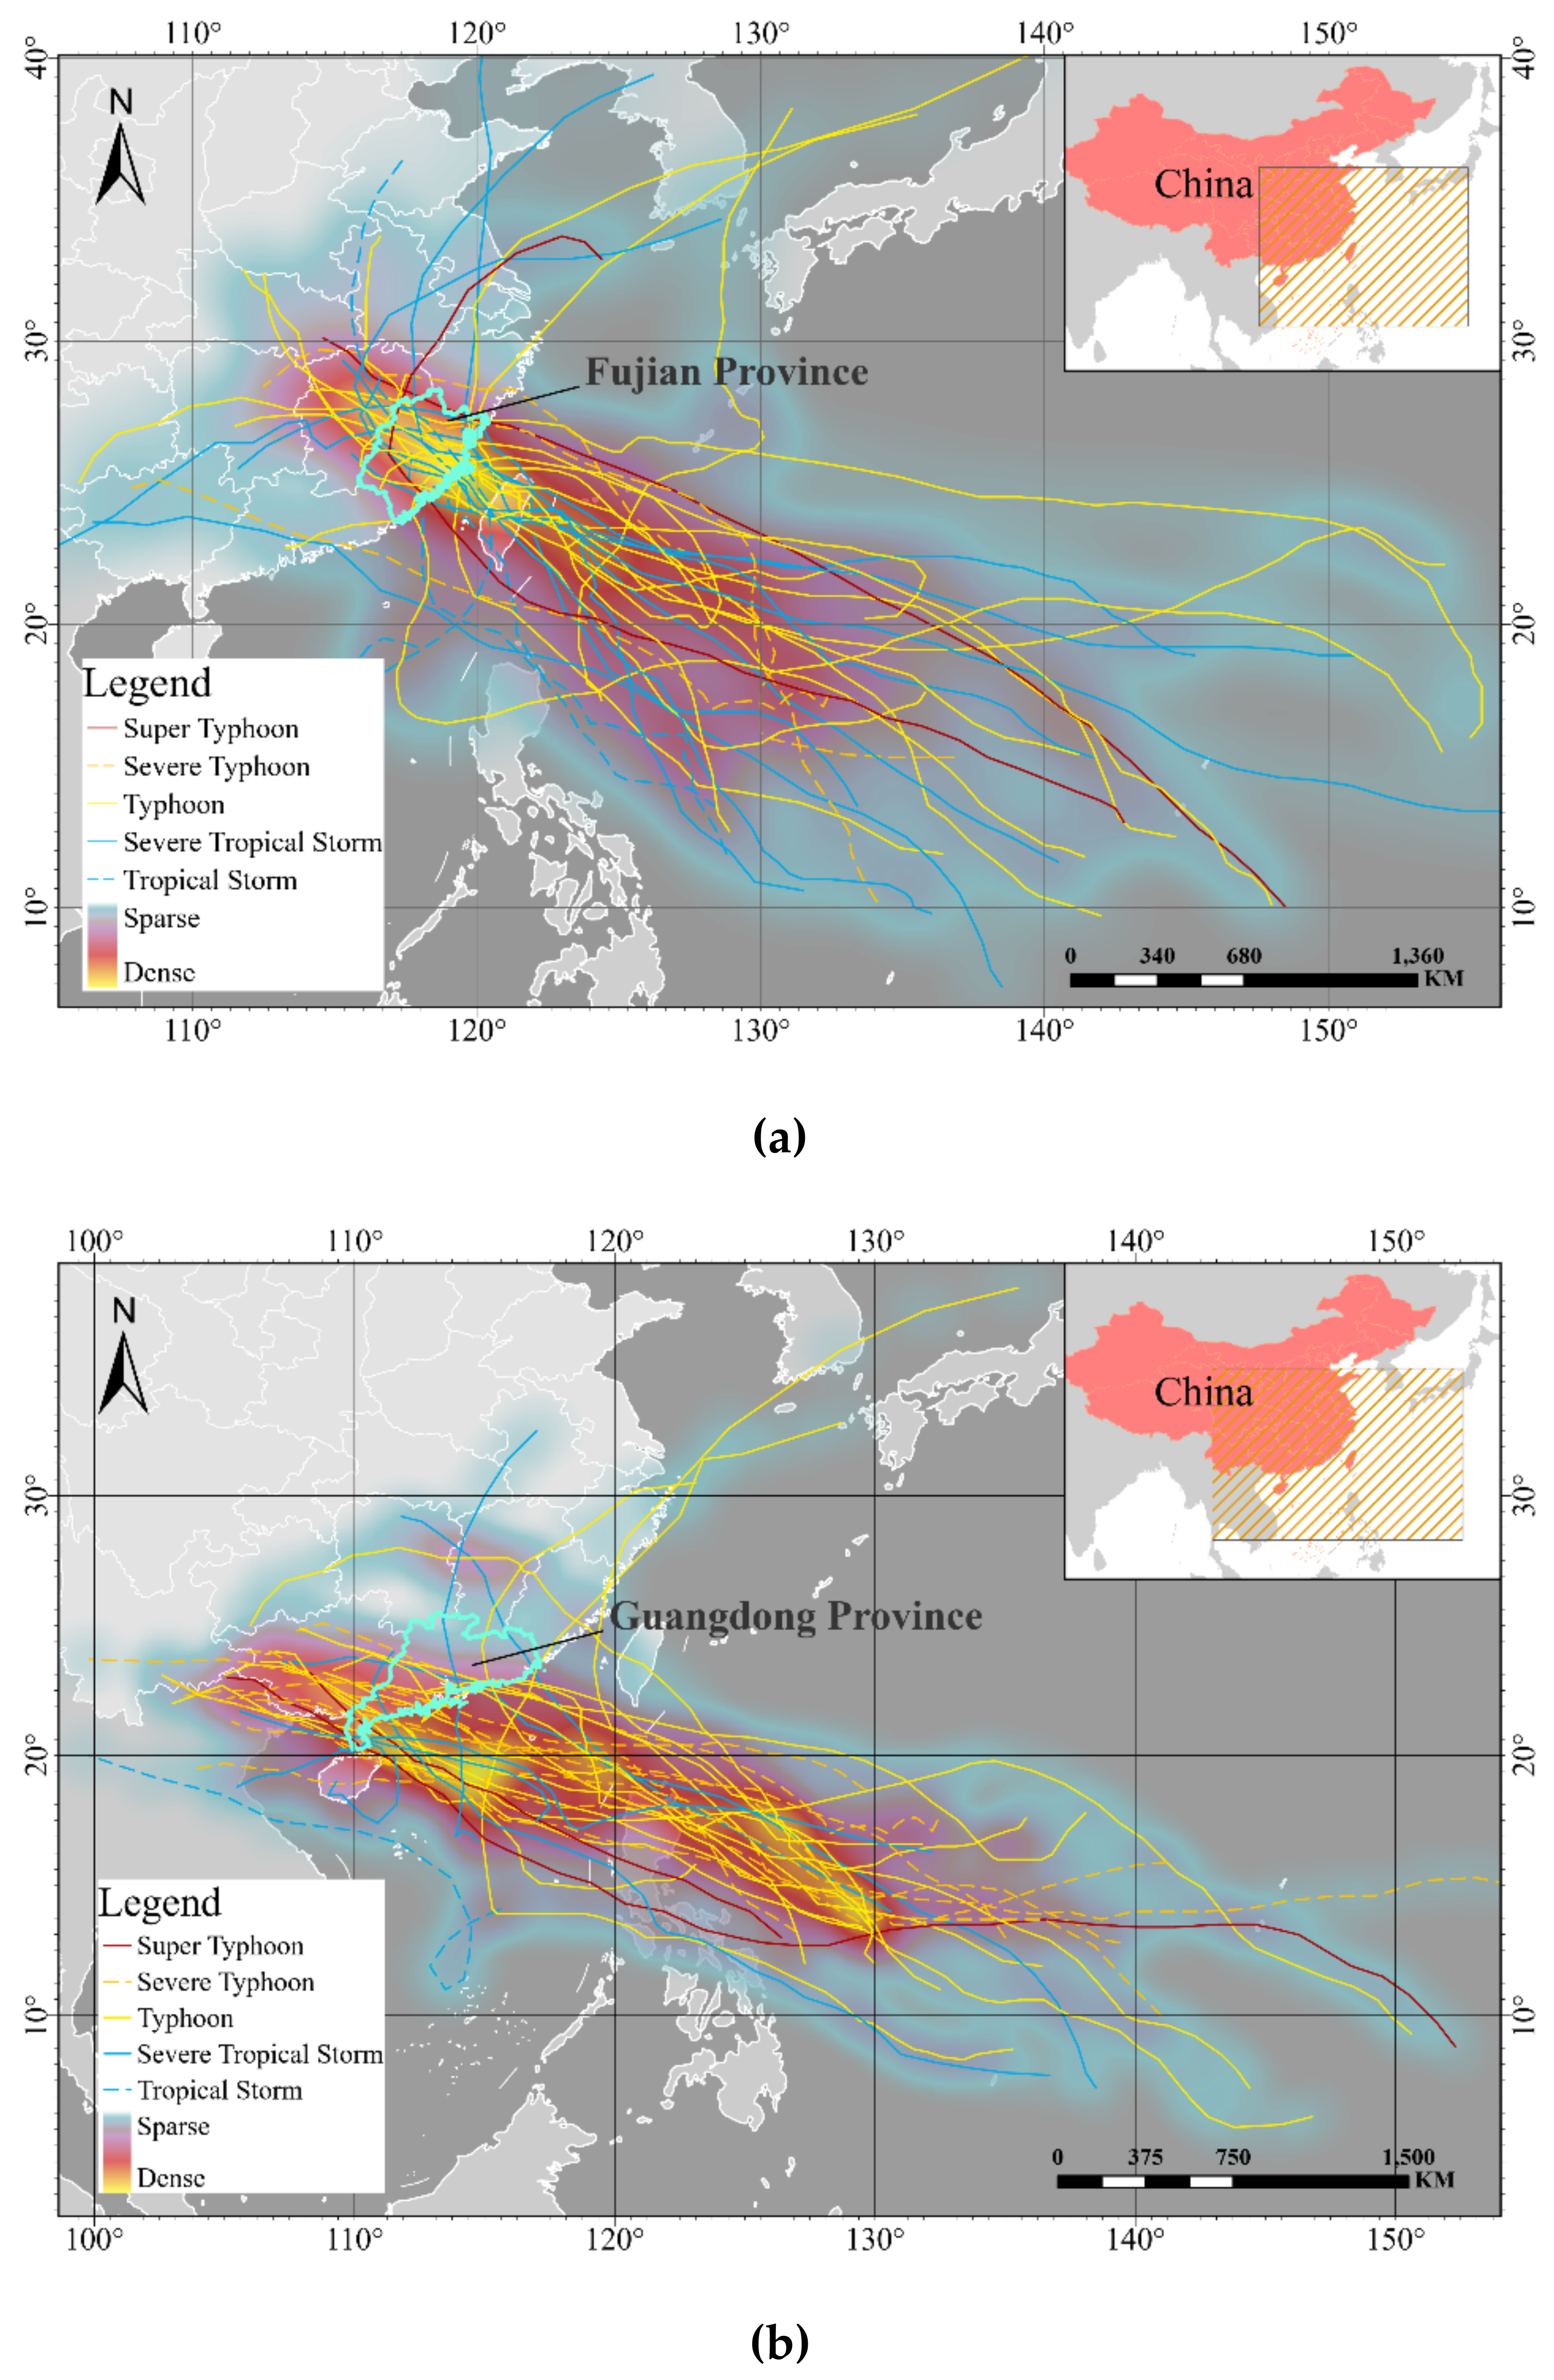
2.2.1. Study Area
2.2.2. Data Collection
- China Marine Disaster Bulletin [1]: The Ministry of Natural Resources of China publishes this annual report on its official website to record the information of marine disasters suffered across China in the previous year. In this paper, the data of the maximum storm surge, exceeding the local warning water level, disaster-affected population, marine engineering damage length, and regional direct economic loss were collected from twenty-five bulletins from 1995 to 2019. What needs special explanation is that the regional direct economic loss data were collected, counted, and checked by local governments. The public officials classified and counted kinds of lost property caused by the disaster through the field survey, and then calculated the corresponding value to obtain the overall direct economic loss data.
- Fujian Marine Disaster Bulletin [48]: The Bureau of Ocean and Fisheries of Fujian Province, from 2011, offers these annual reports on its official website. Like China Marine Disaster Bulletin, it records the information of marine disasters but only includes data from Fujian in the previous year. Moreover, Fujian Marine Disaster Bulletin has supplementary records of the affected population and extra records the length of marine engineering damage in Fujian.
- Guangdong Marine Disaster Bulletin [49]: The Department of Natural Resources of Guangdong Province publishes these annual reports from 2013. It also offers the data of the affected population, which is not in the China Marine Disaster Bulletin, and the length of marine engineering damage.
- Collection of Storm Surge Disasters Historical Data in China 1949–2009 [50]: This book is one of the achievements of a special survey program organized by the State Oceanic Administration of China. It collects and collates the detailed information of the maximum storm surge and exceeding the local warning water level of 209 typhoon storm surge disasters in China from 1949 to 2009. Because marine disaster bulletins mentioned above do not record the data of the maximum storm surge and exceeding the local warning water level of a few storm surges before 2009, we referred to this book for the supplements.
- Central Meteorological Observatory Typhoon Website [51]: This website displays lots of typhoon tracking information, which can be used to calculate the land impact time.
- National Statistics of China [52]: This is a database provided by the National Bureau of Statistics, which includes the basic natural environment and socio-economic data of each province. Eleven indicators of disaster-formative environments and disaster prevention capabilities are mainly from this database.
- Statistical Yearbook of Fujian [53]: This annual report is published by the Fujian Bureau of Statistics from 2000. It supplements the missing data in the National Statistics of China in terms of 11 indicators of disaster-formative environments and disaster prevention capabilities that are missing.
- Statistical Yearbook of Guangdong [54]: These annual reports also log the local socio-economic development, which are published by the Guangdong Bureau of Statistics from 2000. Similar to the Statistical Yearbook of Fujian, it fills in the part of missing data of 11 indicators belonging to disaster-formative environments and disaster prevention capabilities.
2.2.3. Data Preprocessing
2.3. Ensemble Learning Models
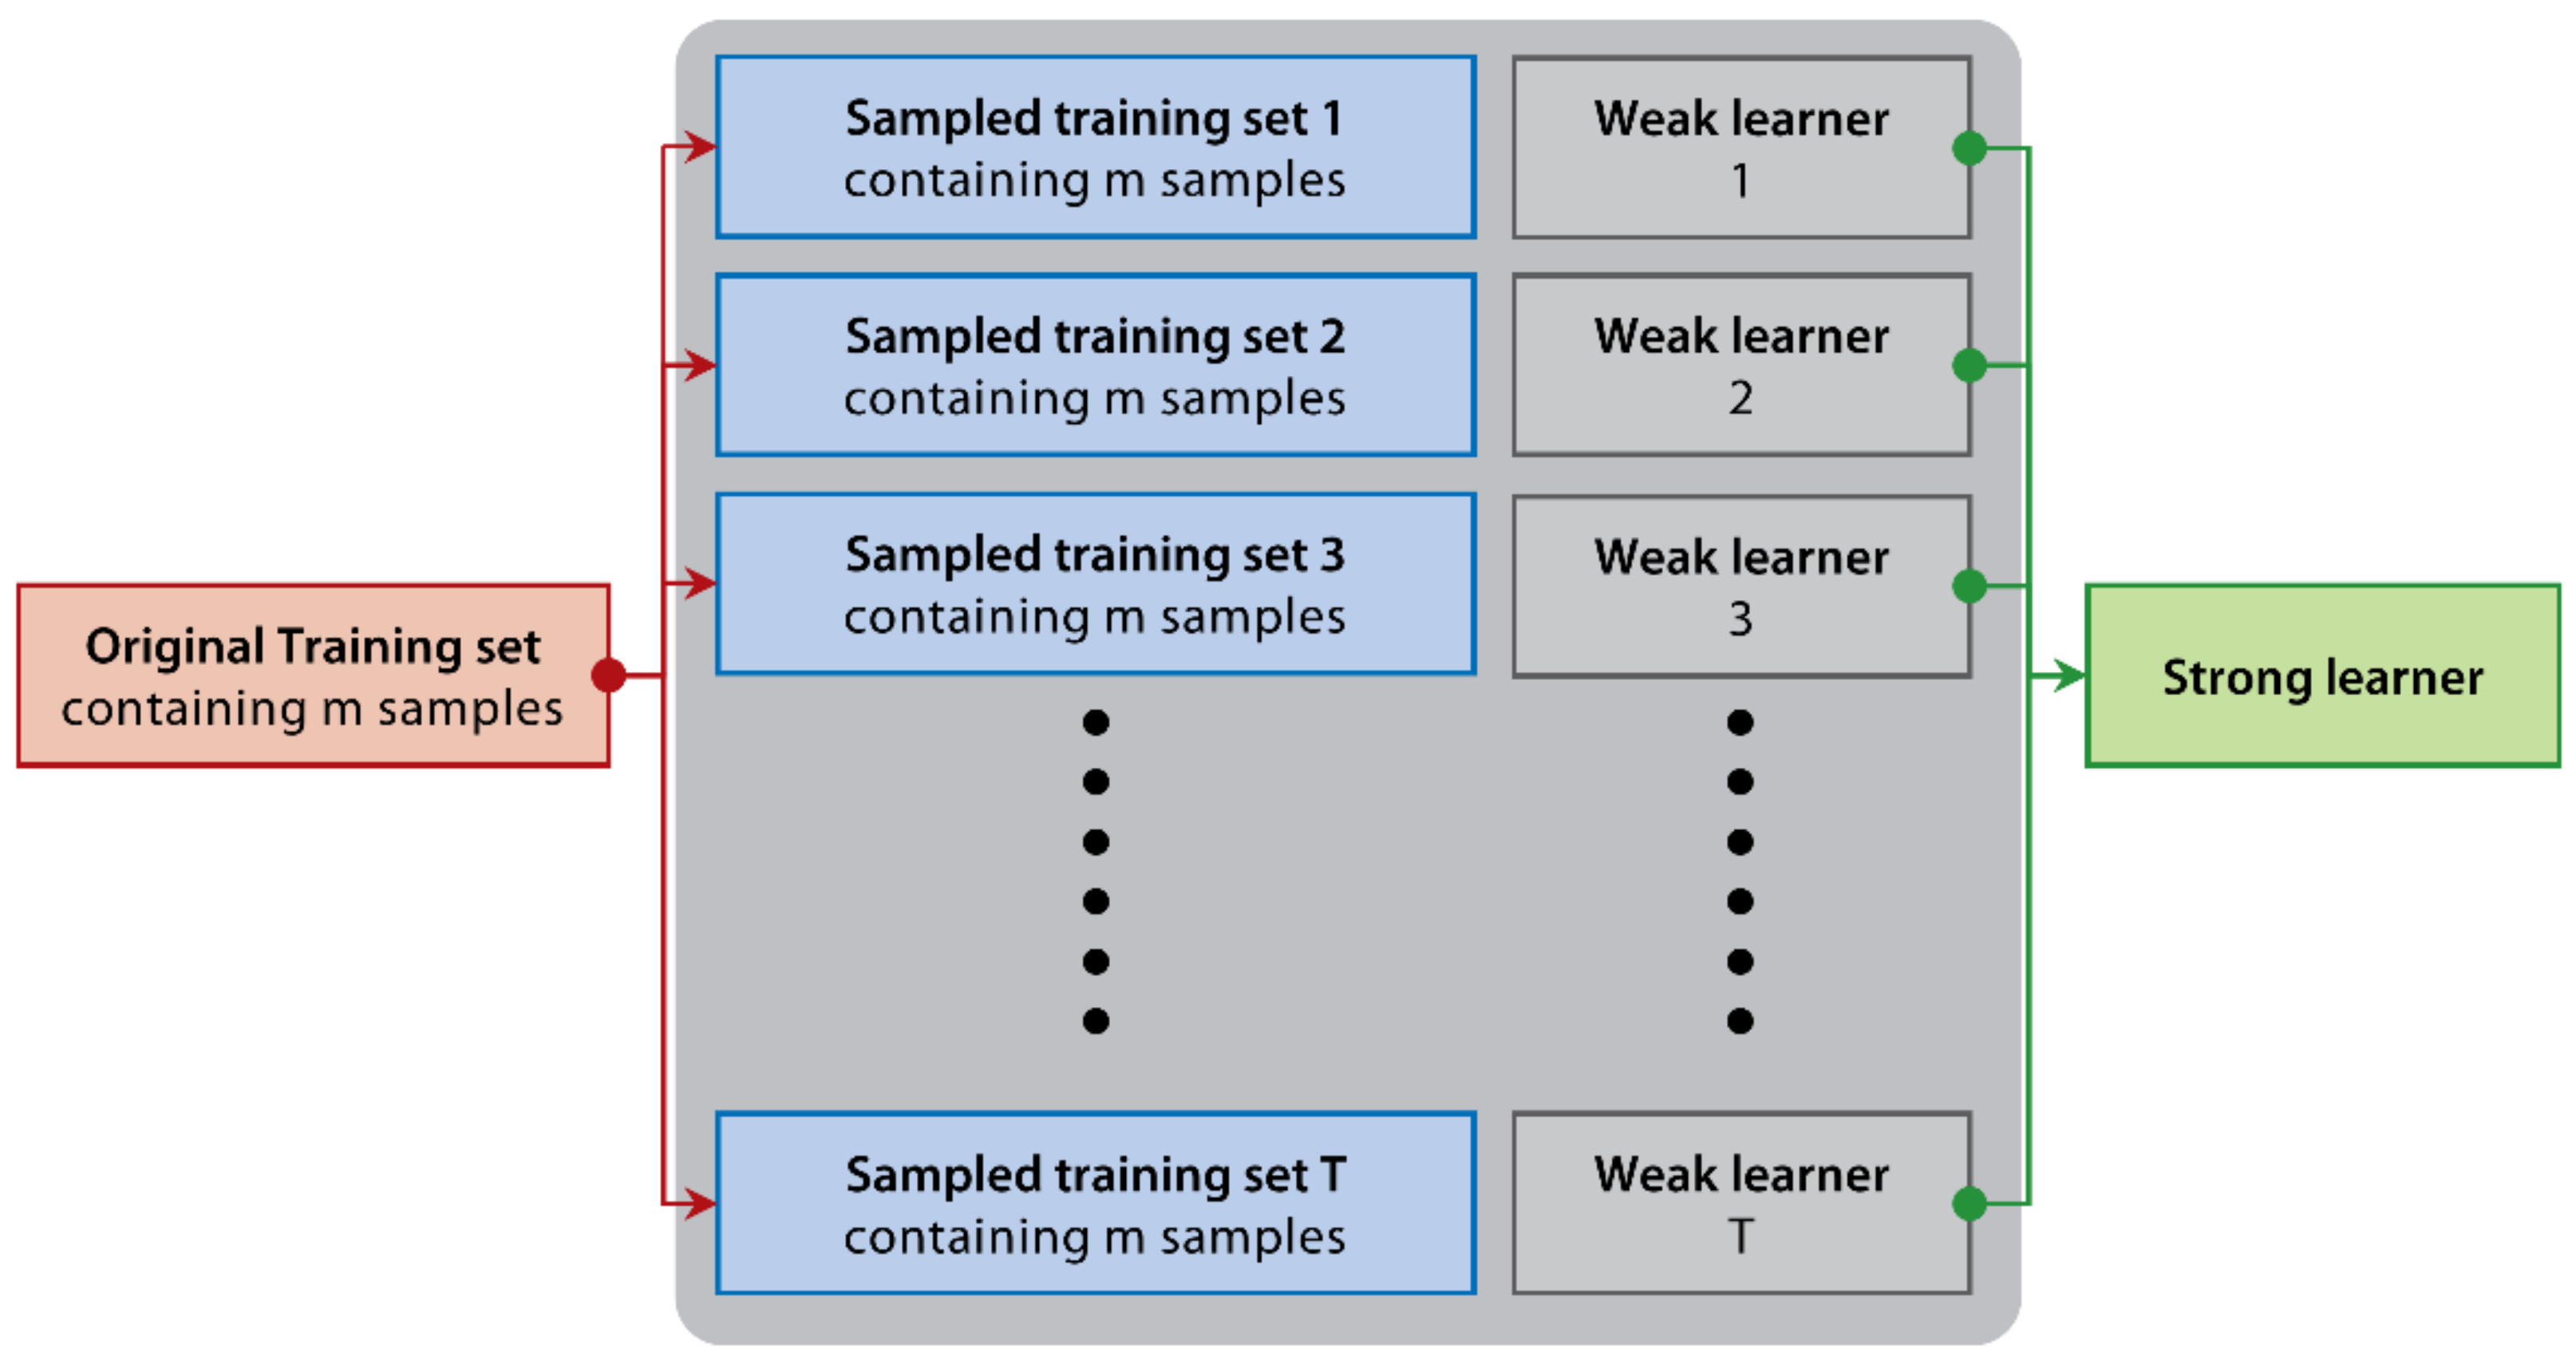
2.3.1. Random Forest
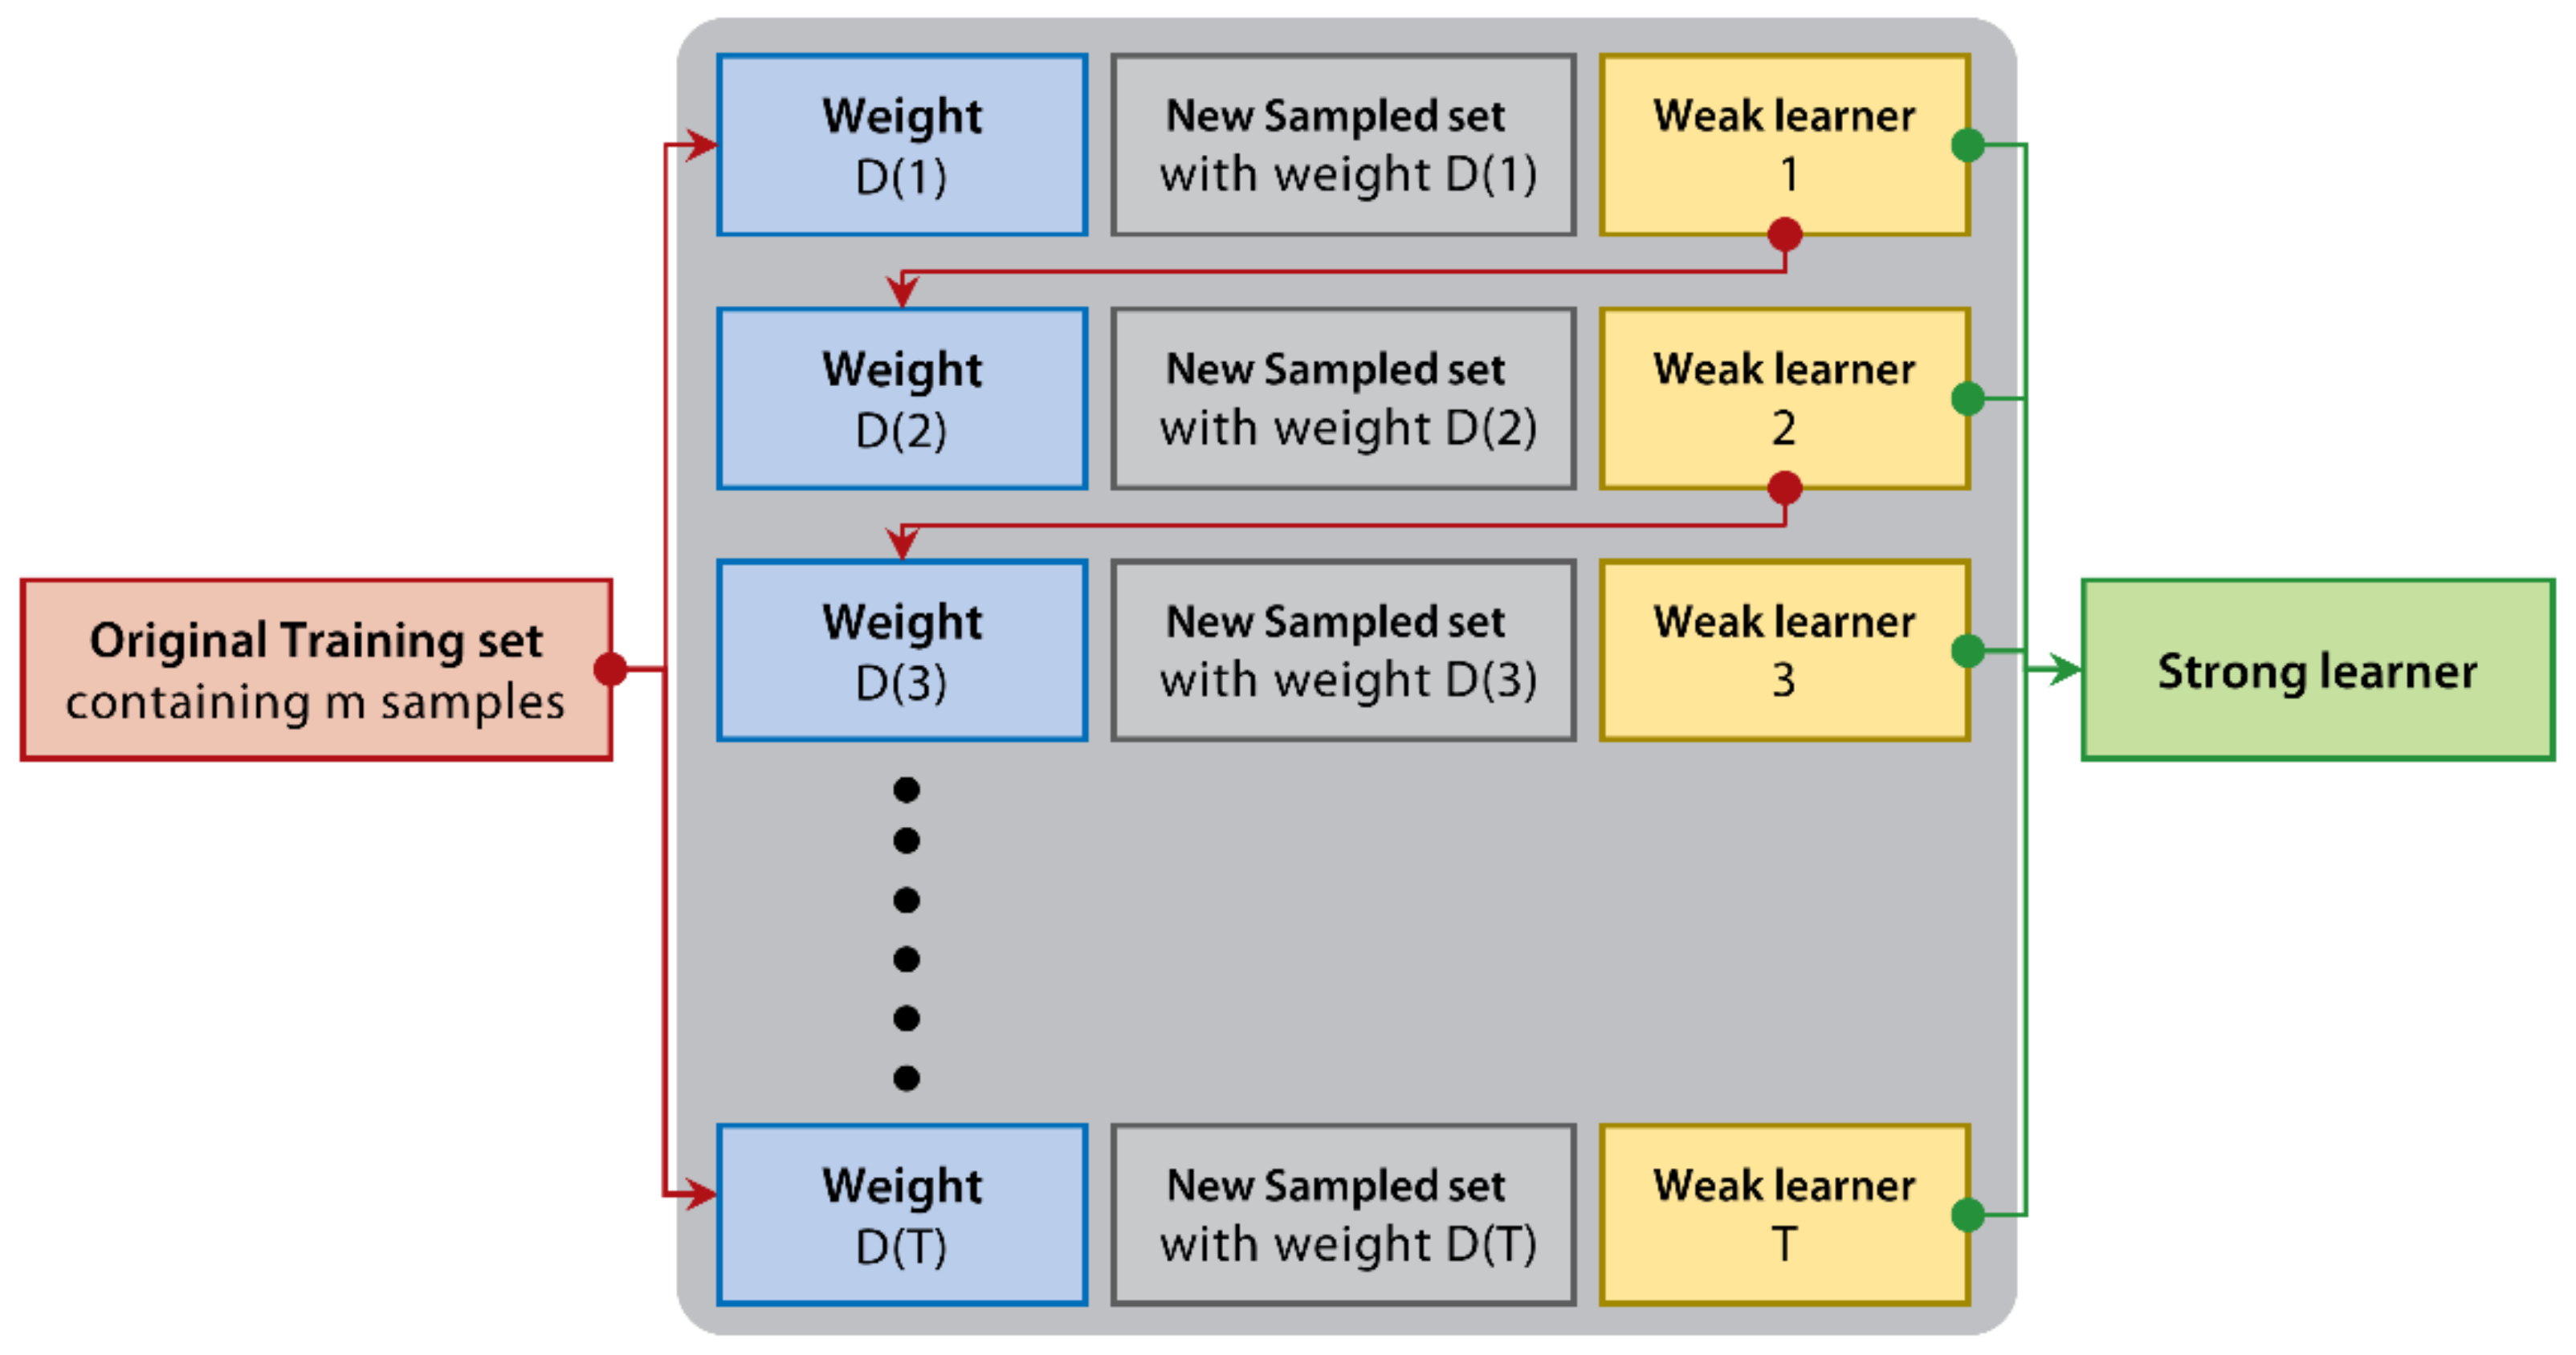
2.3.2. XGBoost
2.3.3. LightGBM
2.3.4. CatBoost
2.3.5. Comparison of the Ensemble Learning Models
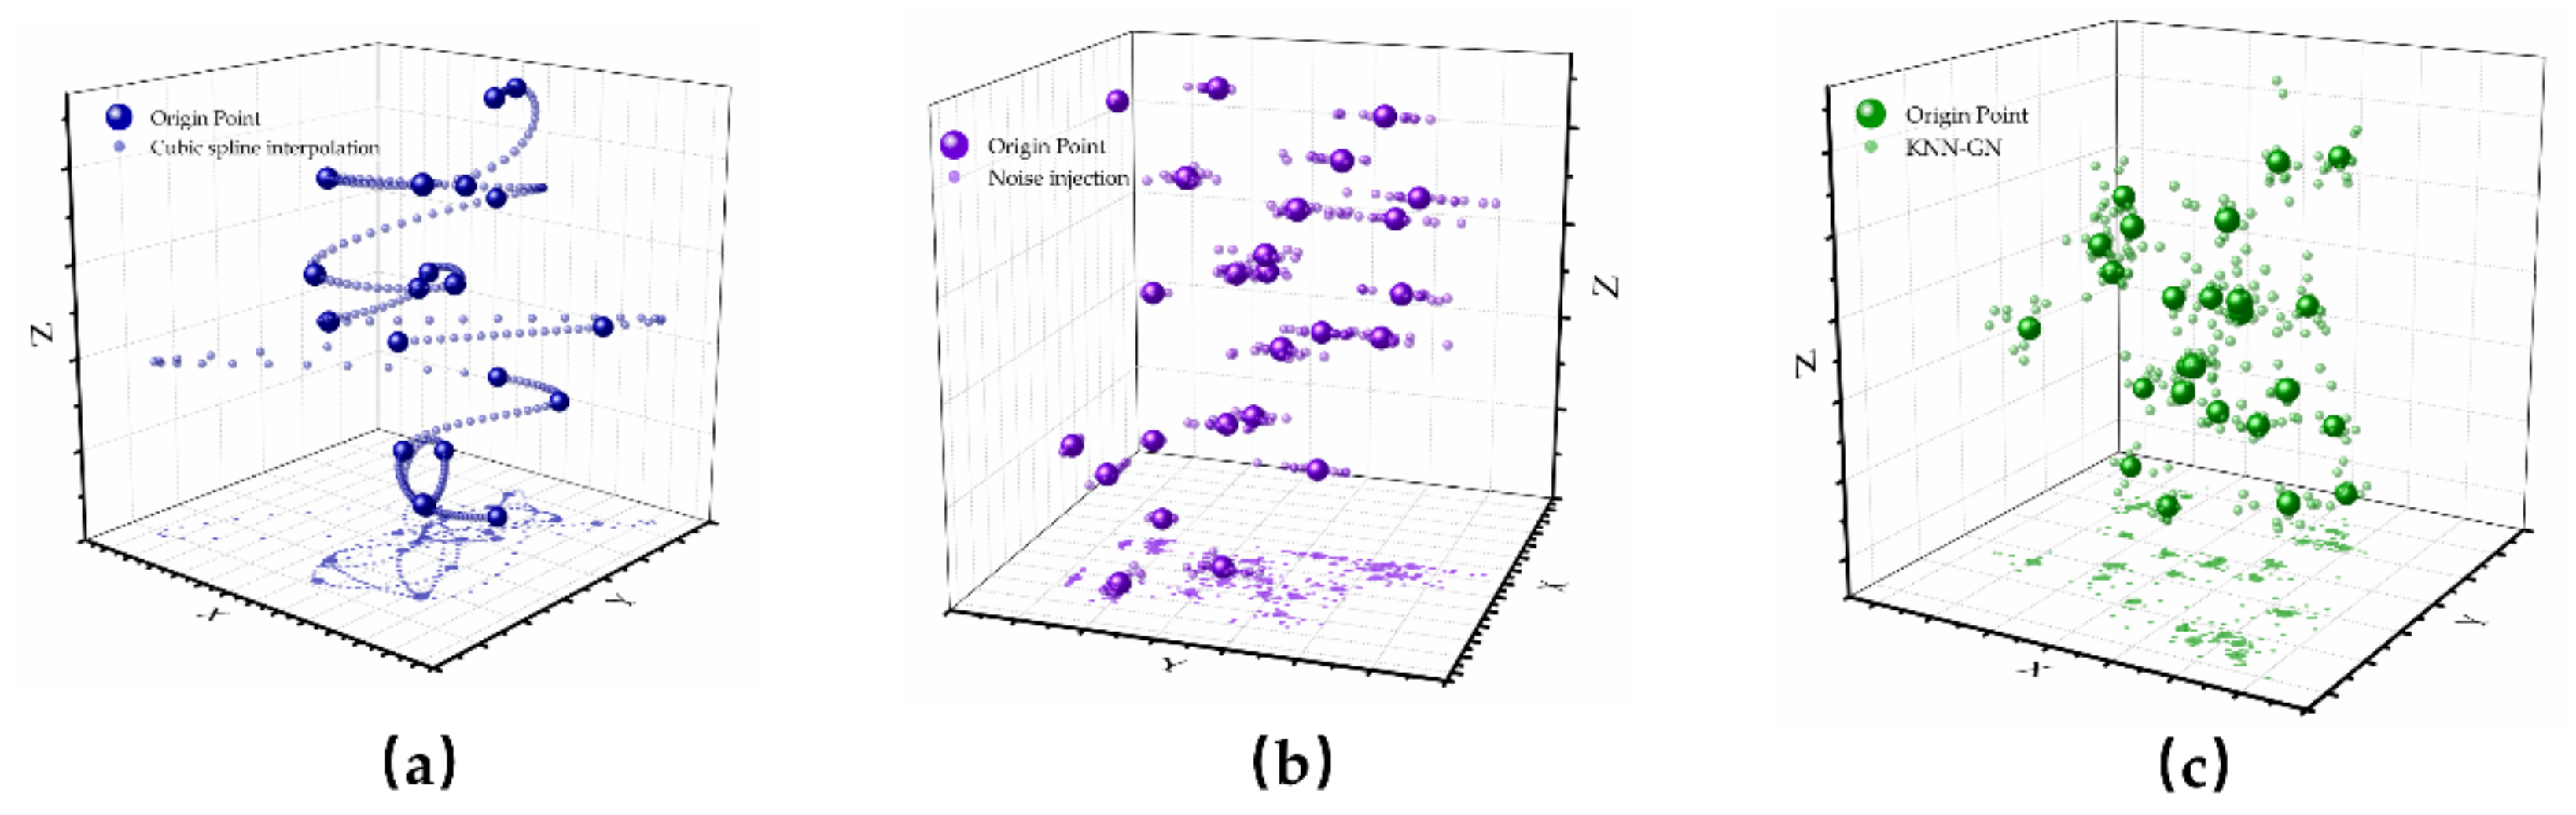
2.4. The Data Augmentation
2.4.1. Cubic Spline Interpolation
- In each segmented section , is a cubic polynomial;
- ;
- In section [, derivative , and second derivative are all continuous.
2.4.2. Noise Injection
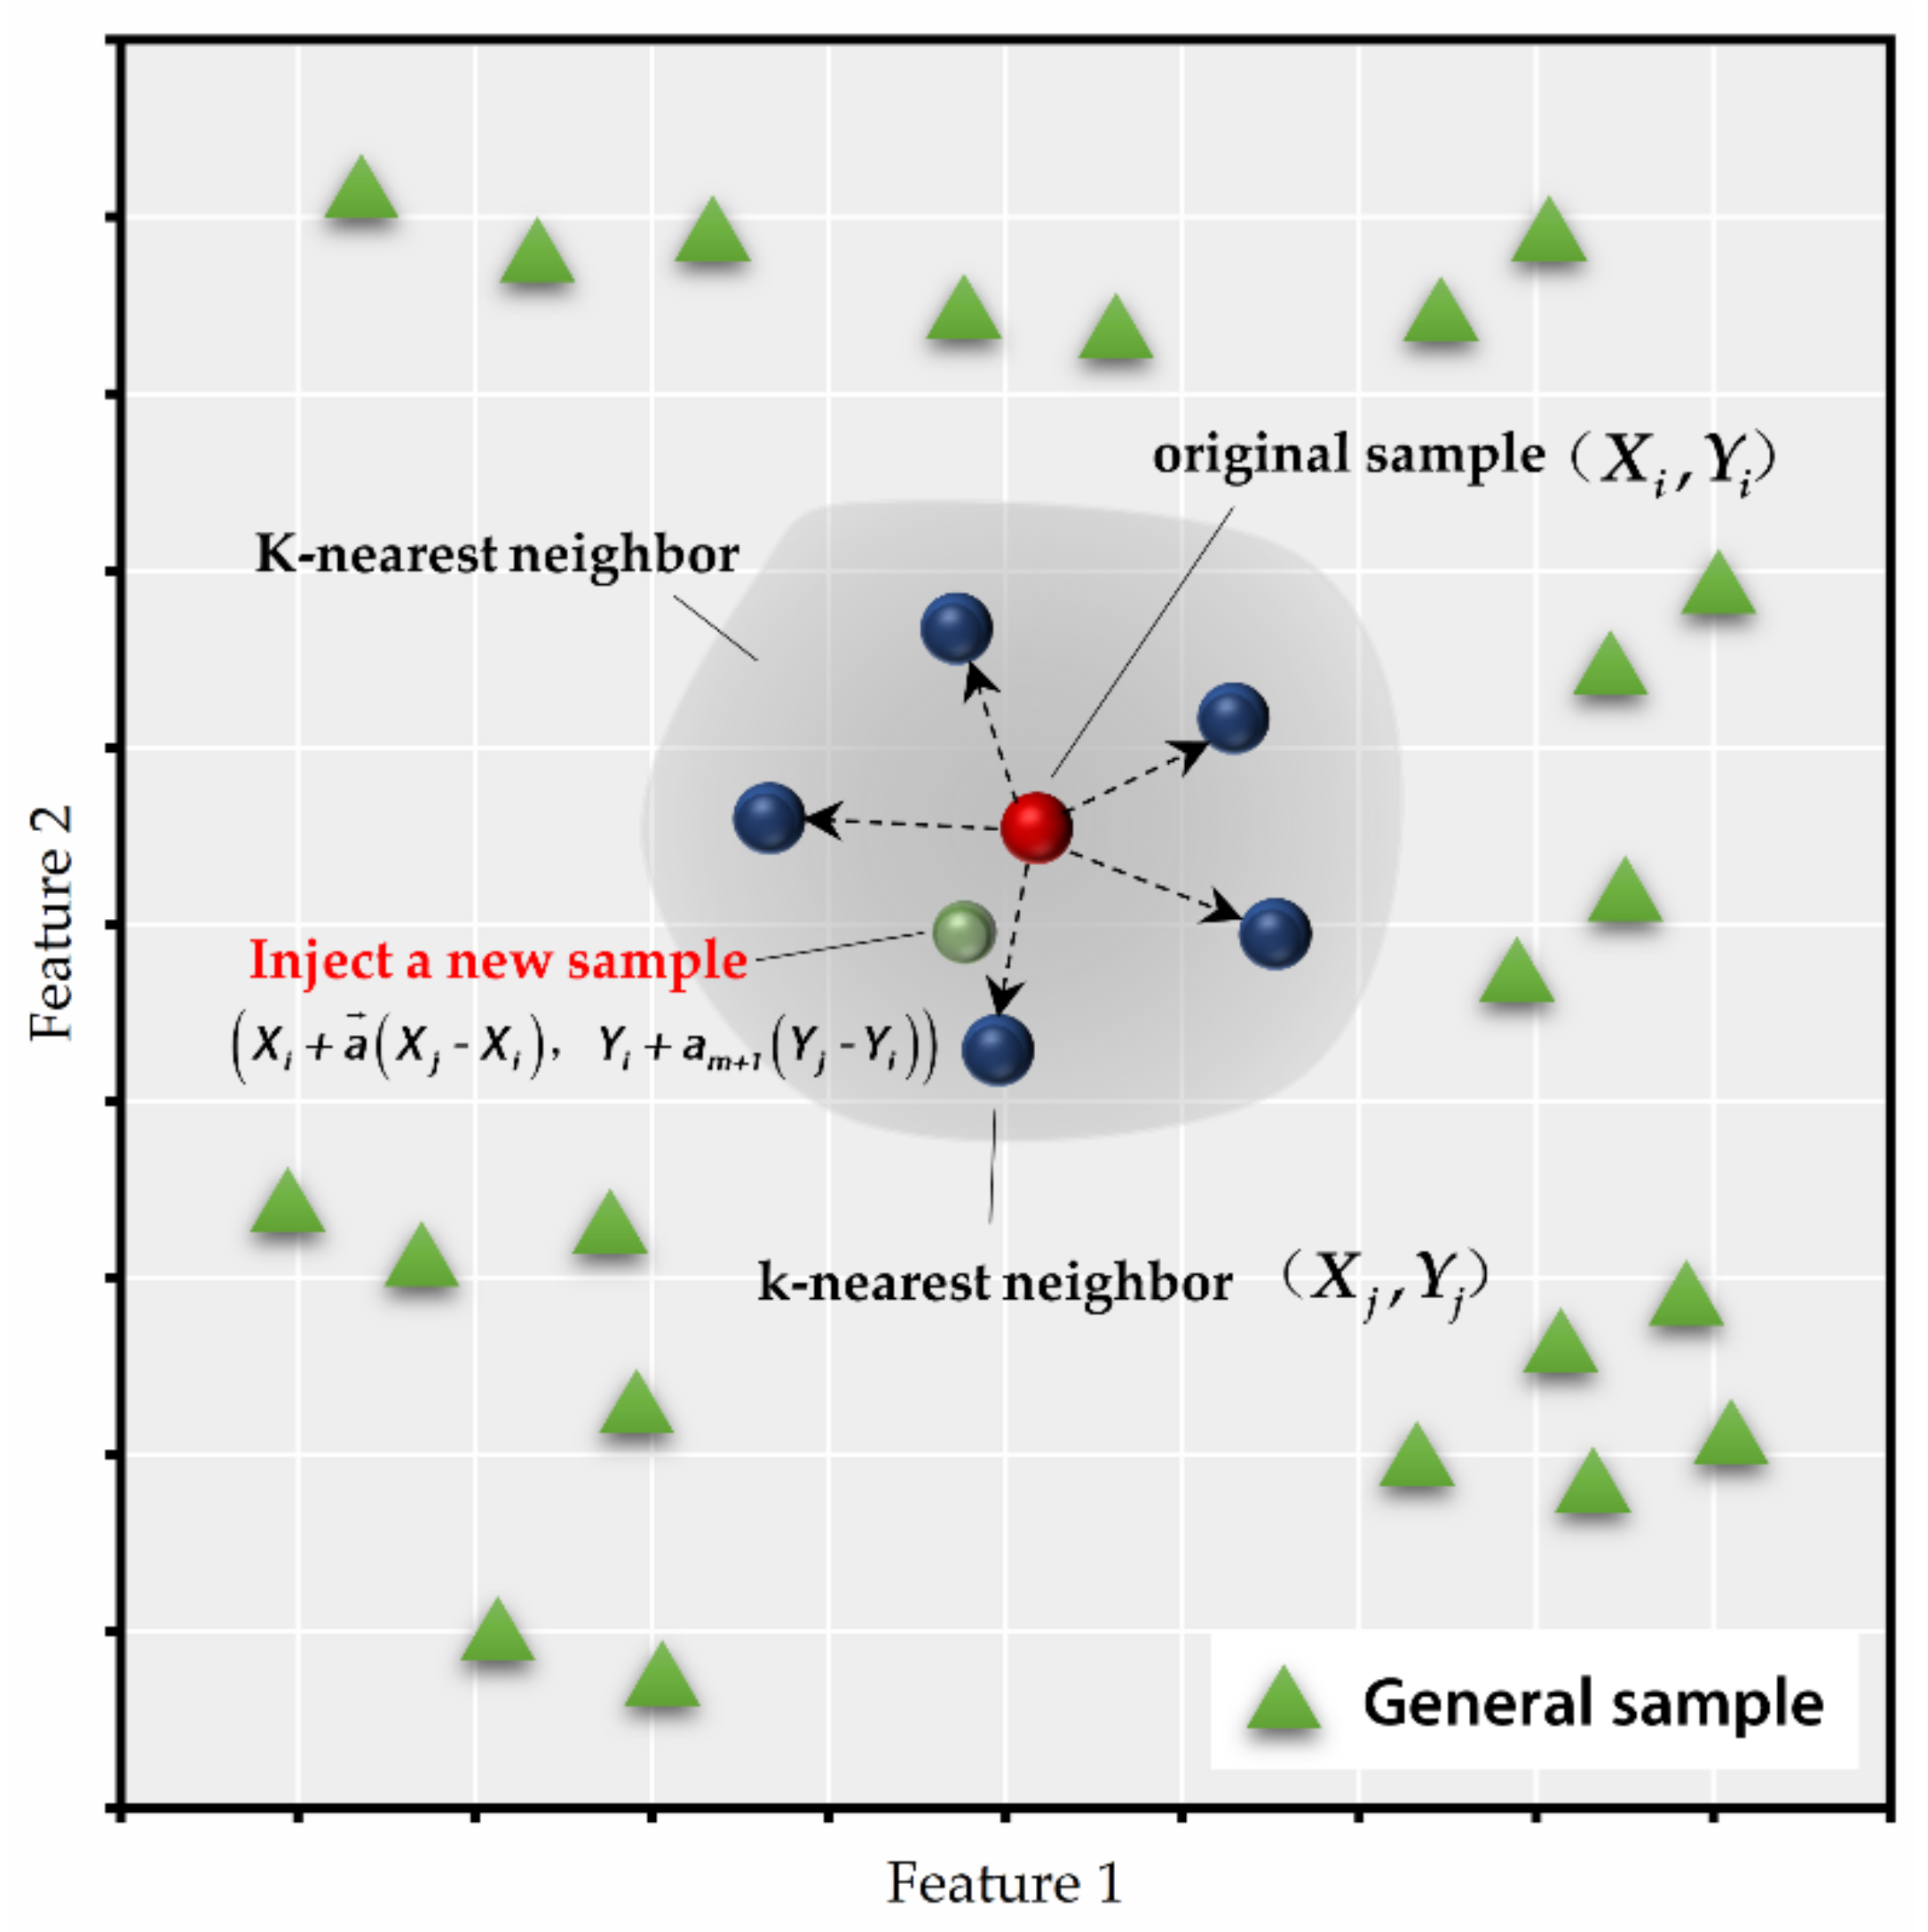
2.4.3. KNN-GN
2.4.4. Comparison of the Data Augmentation Technology
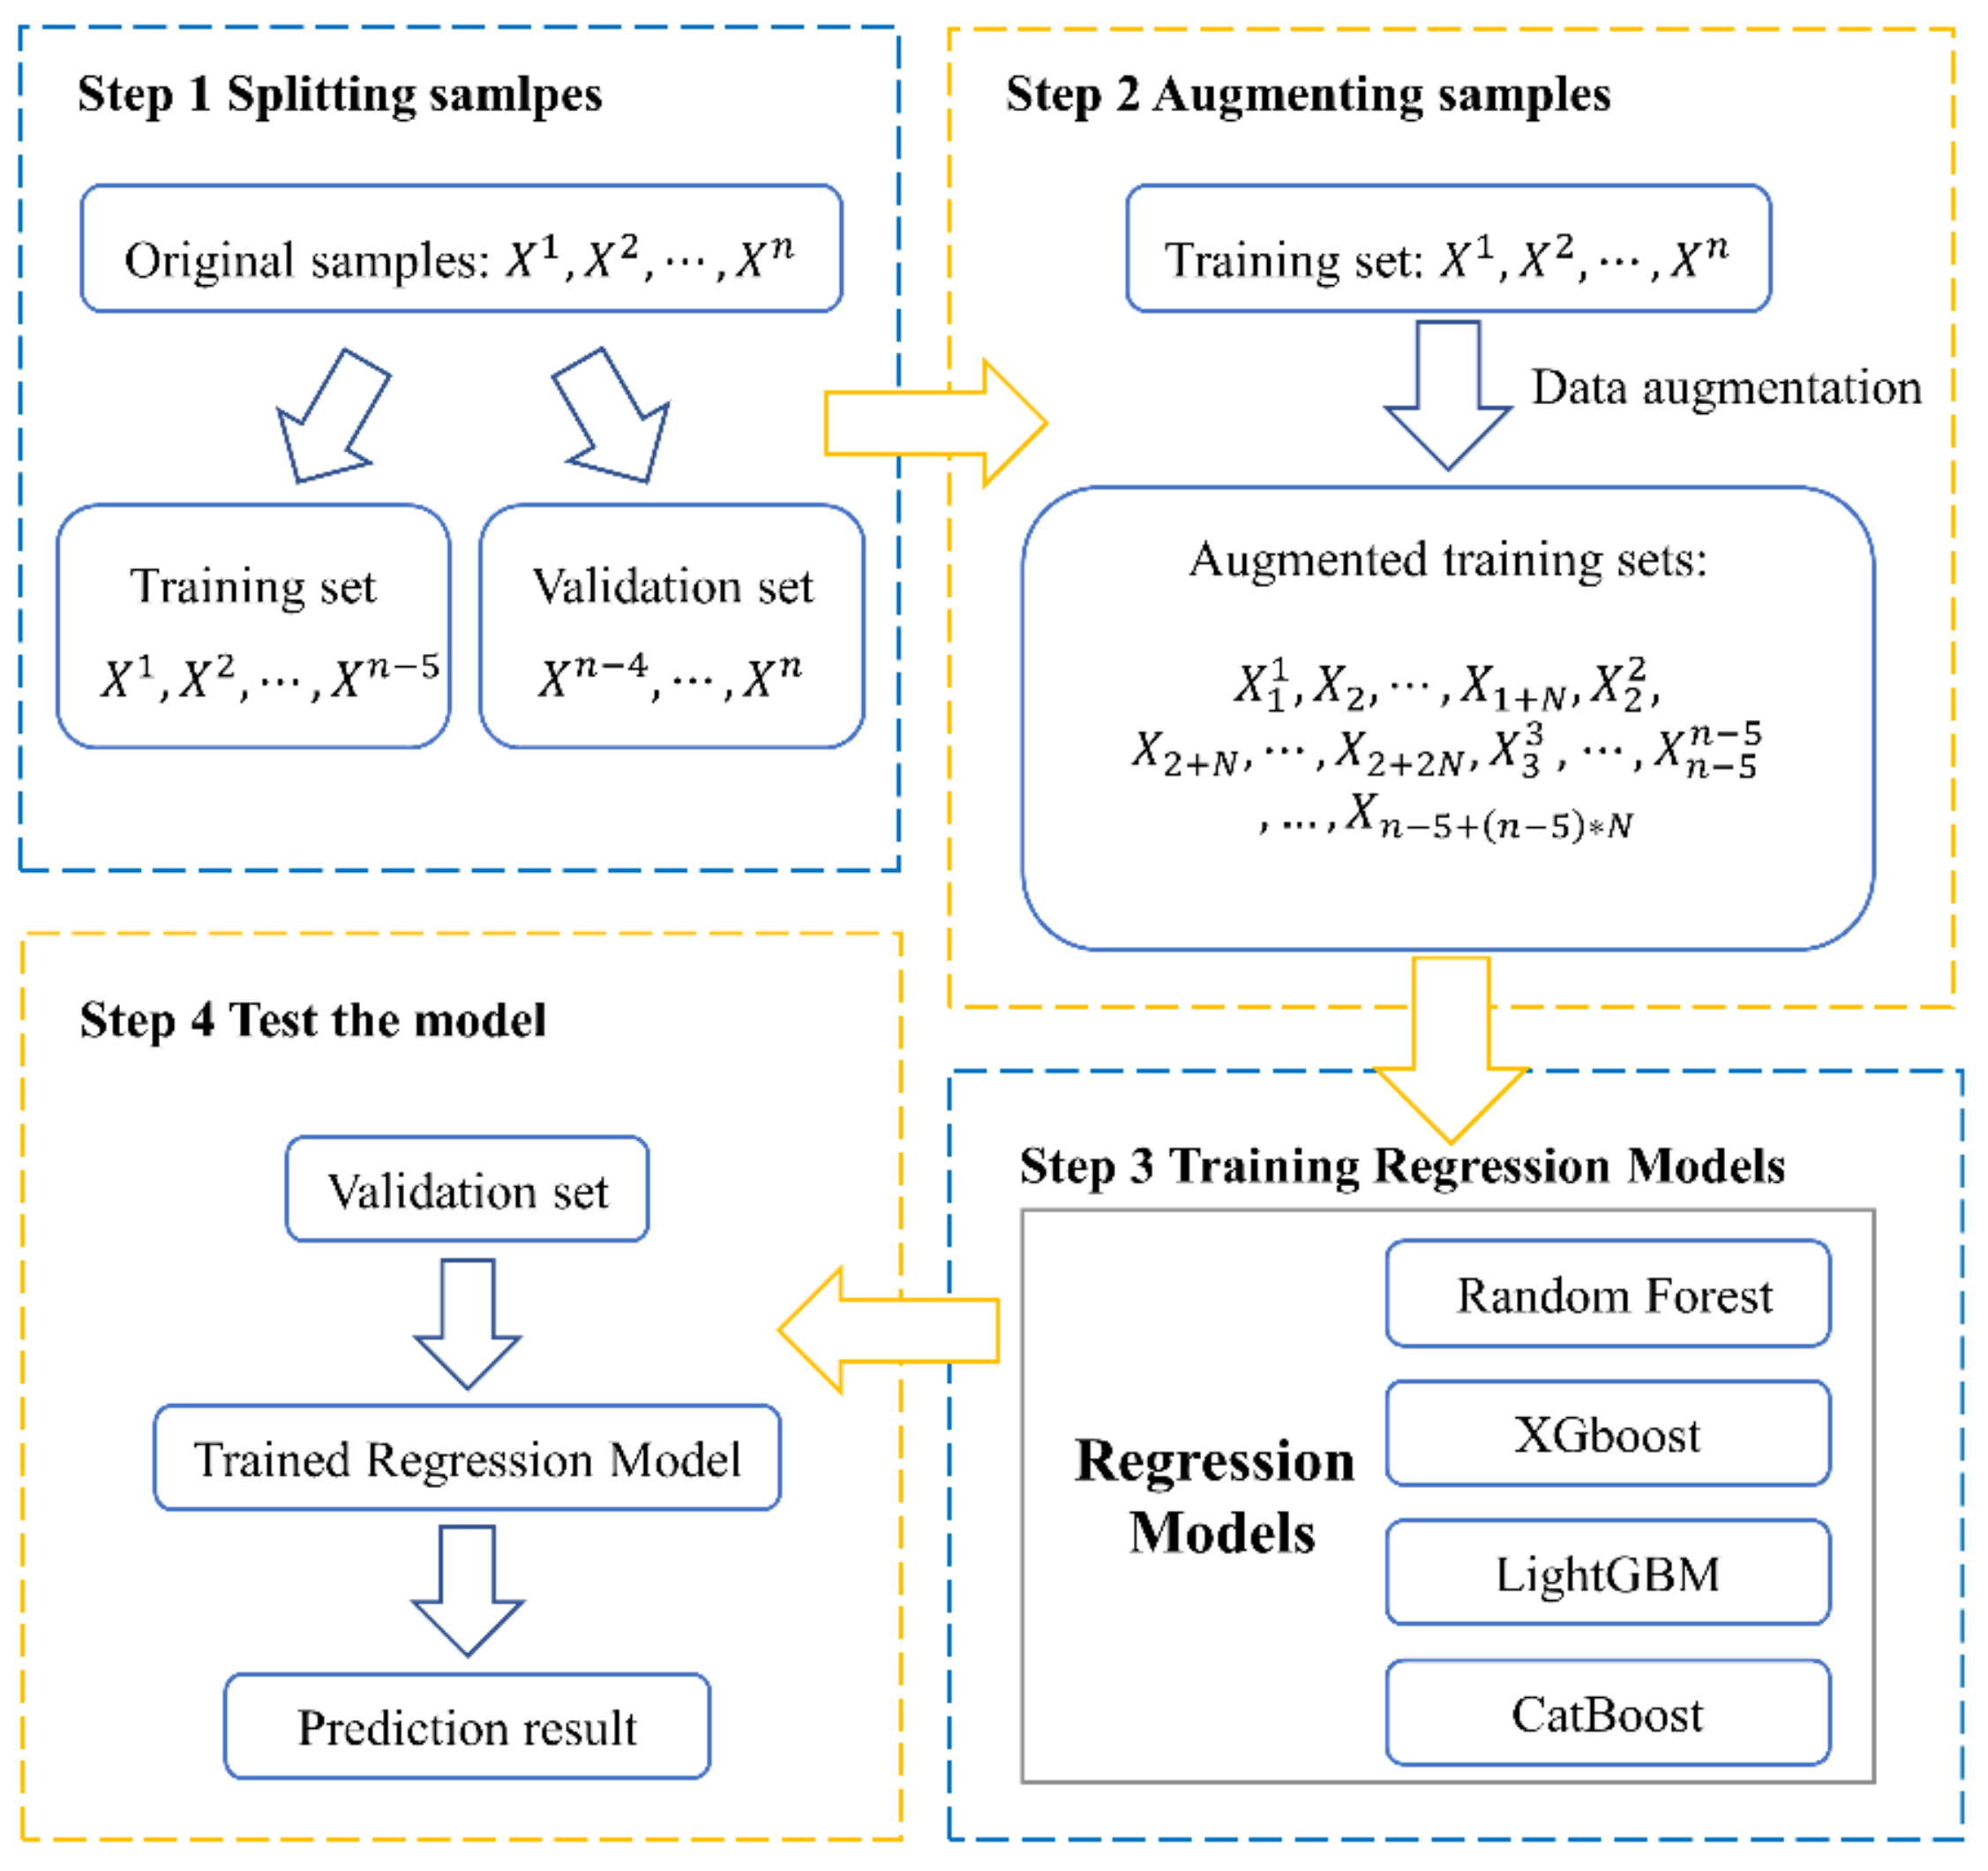
2.5. Comparative Experimental Design
- (a)
- The original samples are randomly split into a training set and a validation set.
- (b)
- According to an acknowledged kind of technique, training sets are augmented with N times to attain an extended training set. (The augmented training set by noise injection and KNN-GN includes samples, while the augmented training set with cubic spline interpolation and without any data augmentation has samples and n − 5 samples, respectively.)
- (c)
- Augmented training set is fed to one of the regression models.
- (d)
- The validation set is predicted with the trained regression model.
2.6. Parameter Settings
3. Results and Discussion
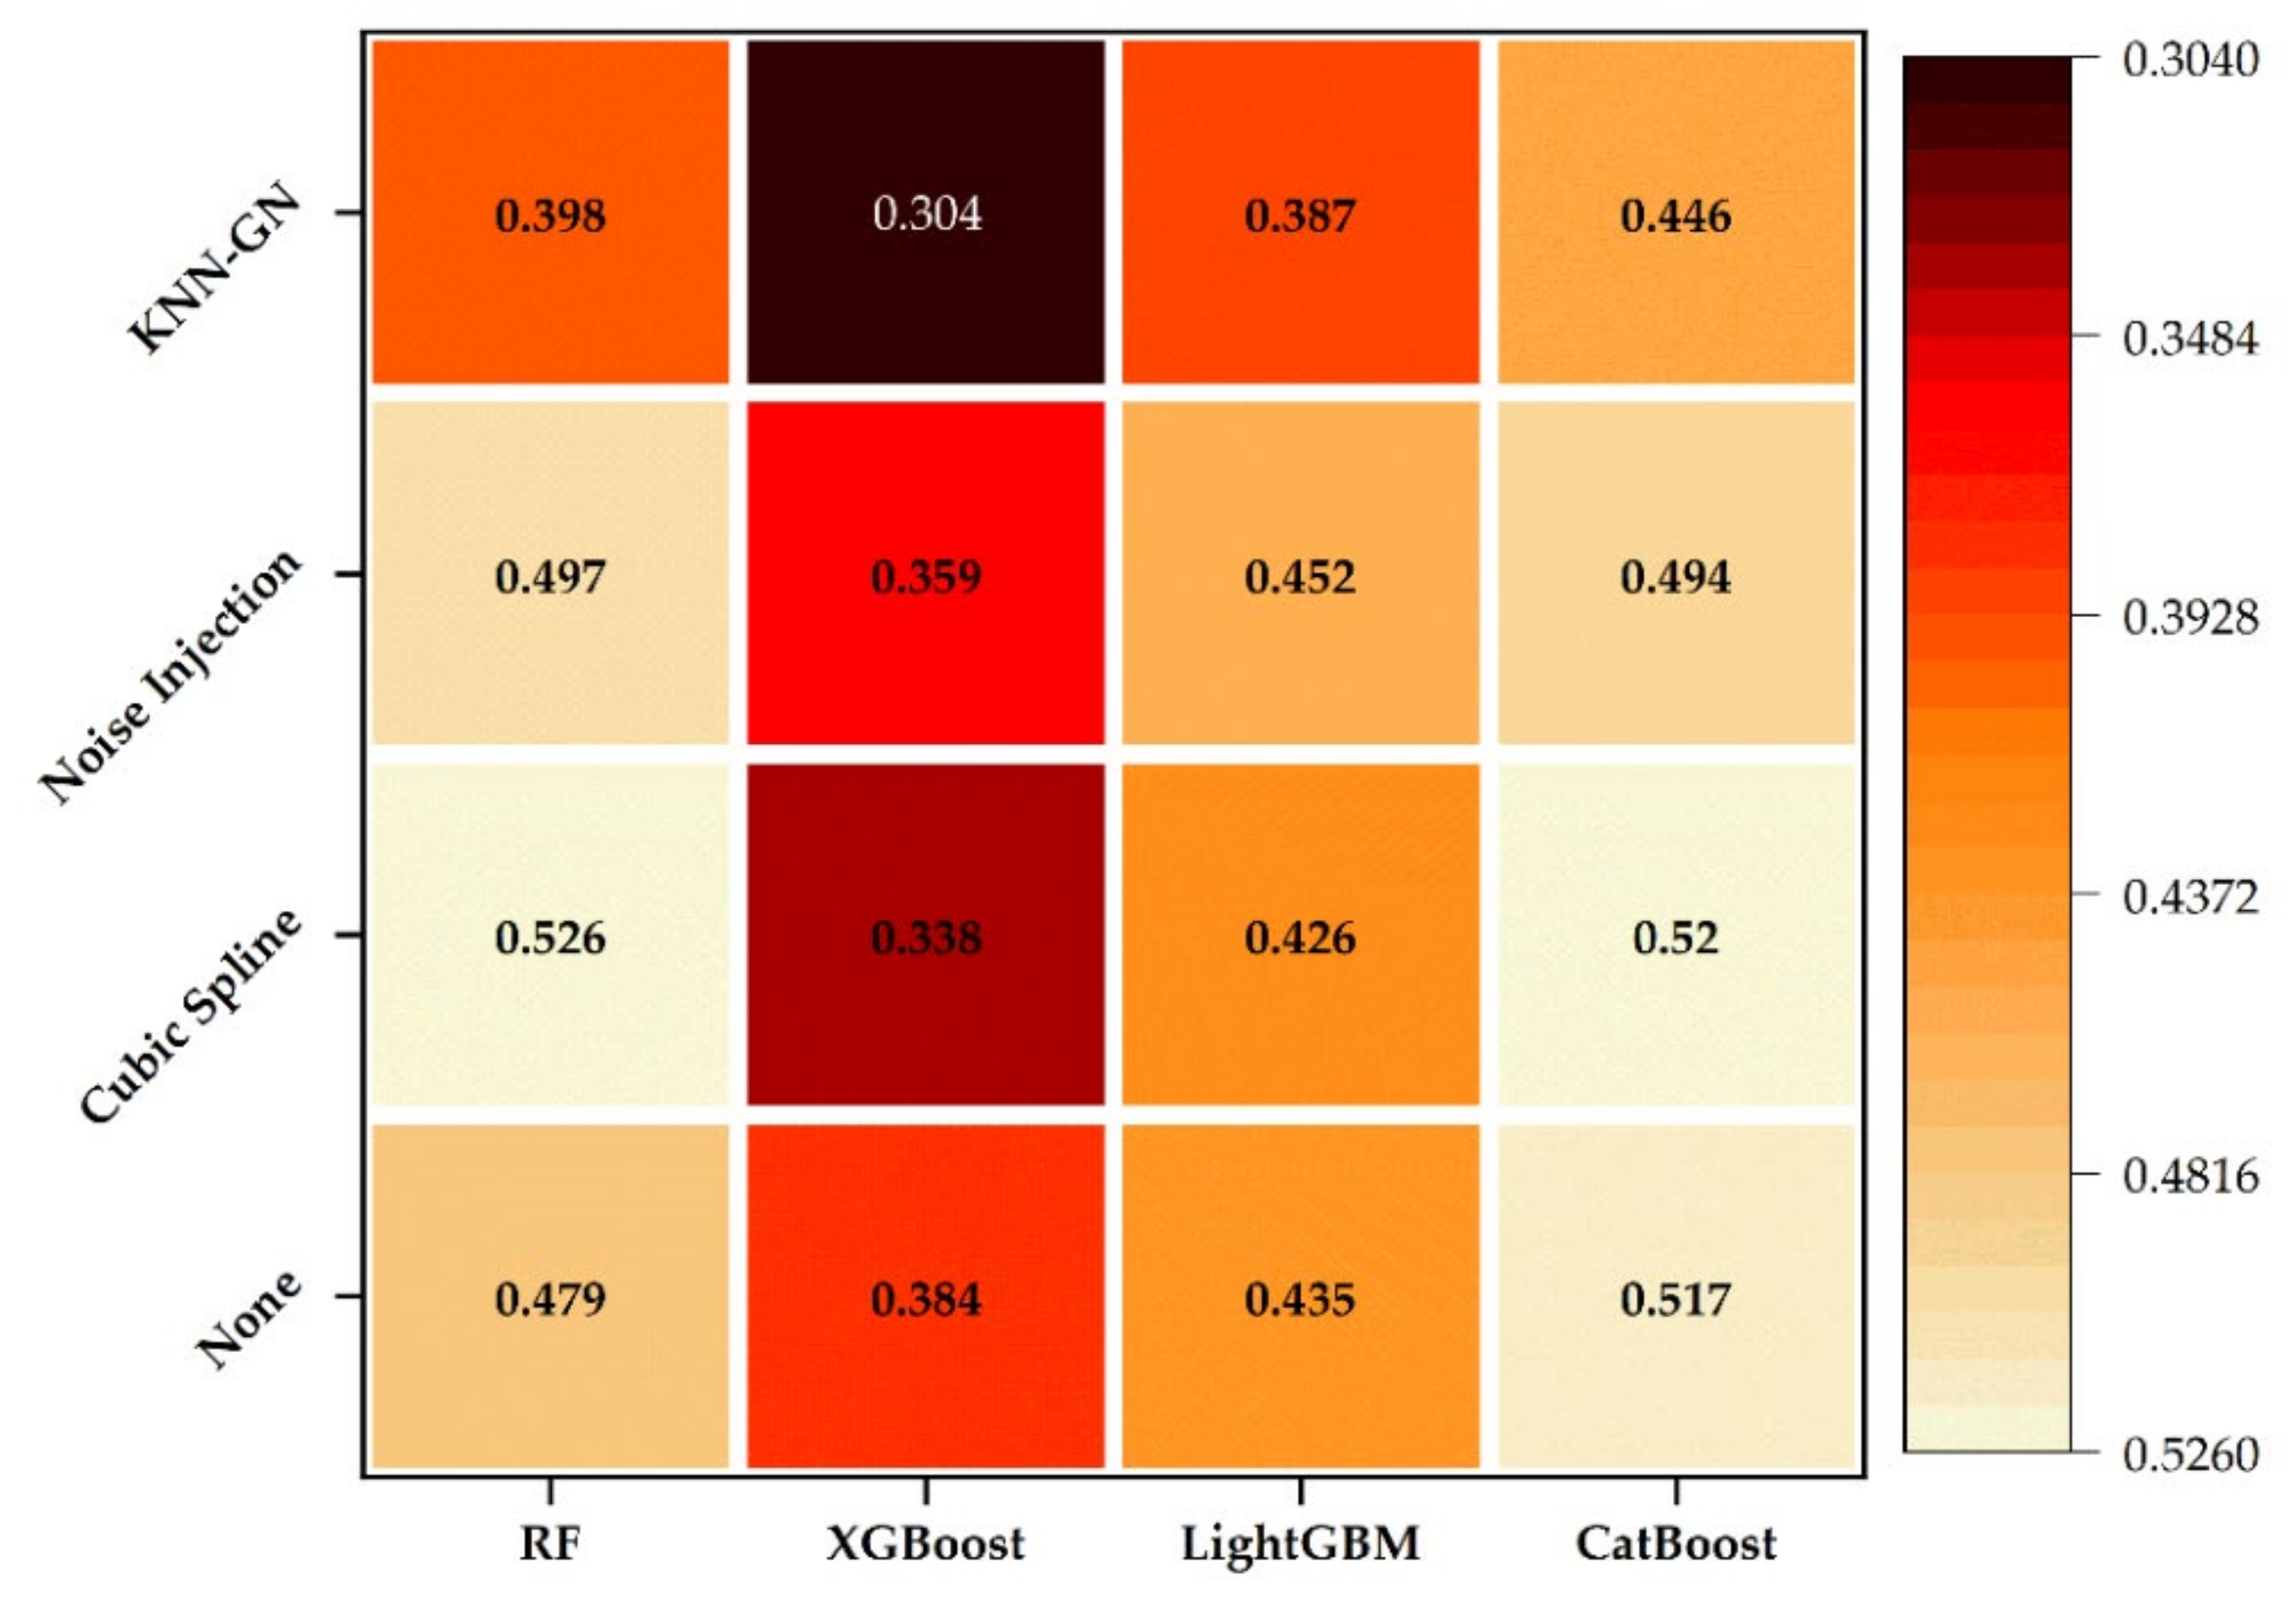
3.1. Optimization of Combined Models
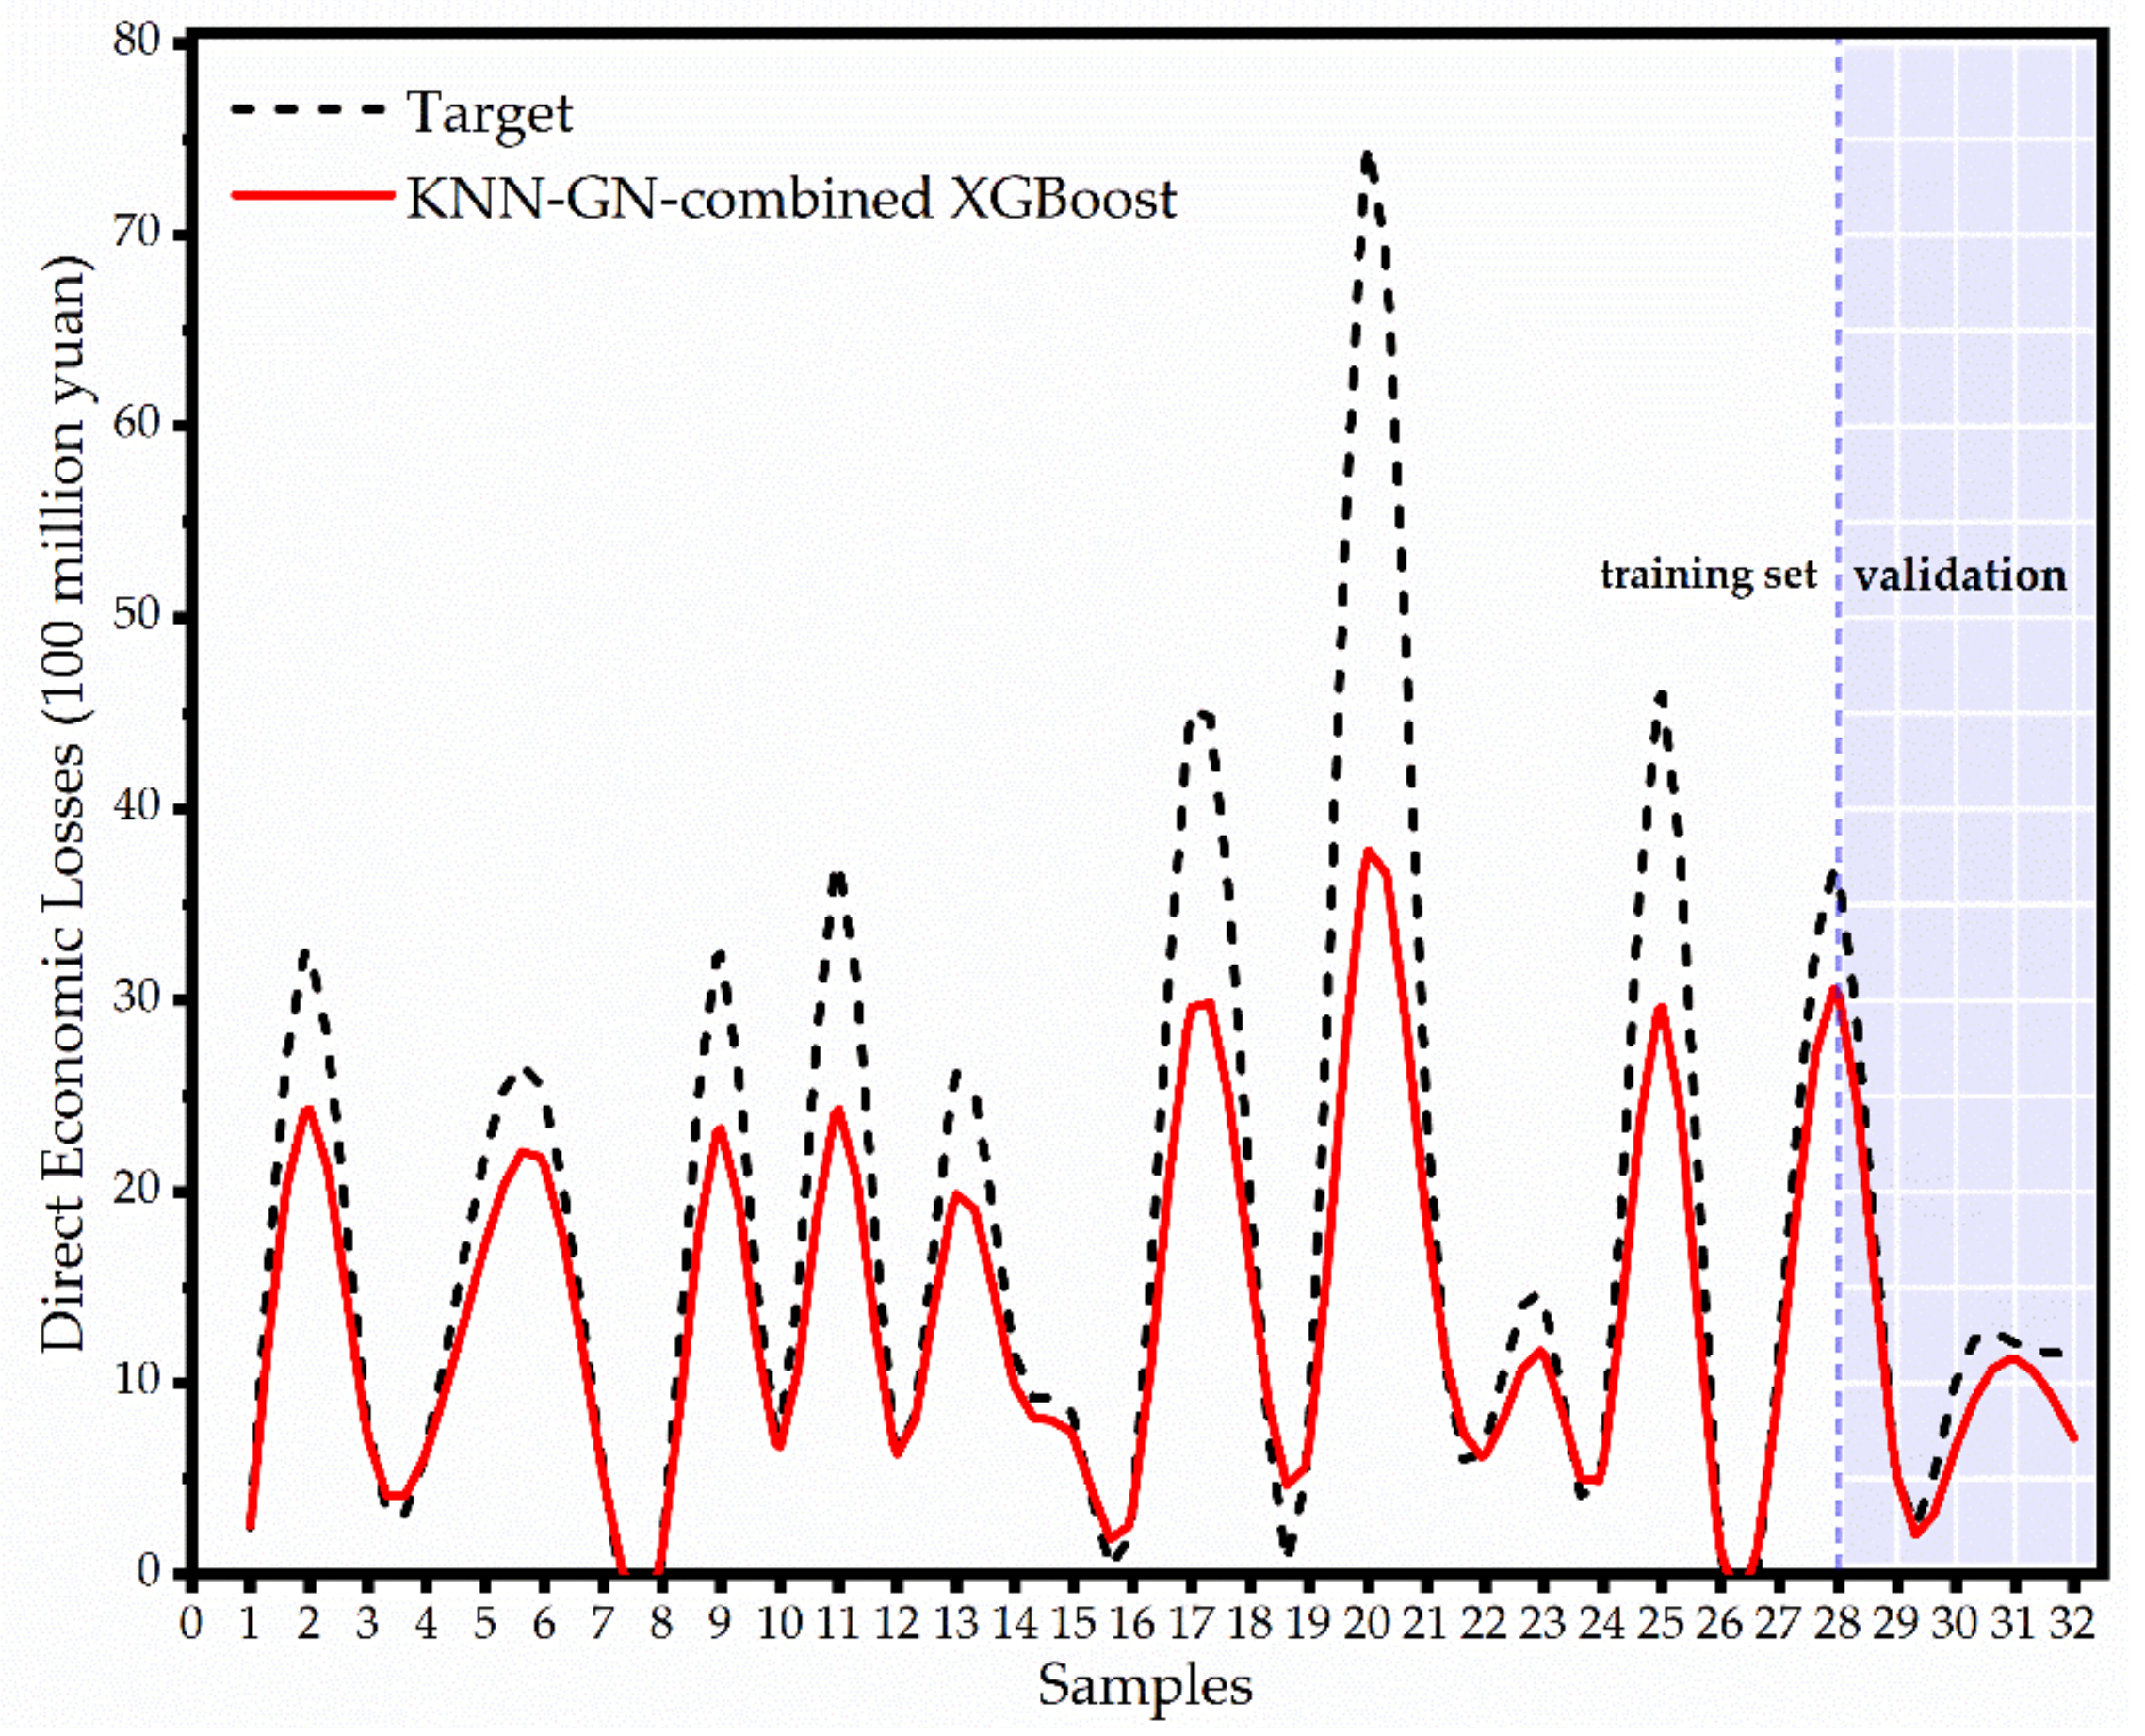
3.2. Validation of the KNN-GN-Based XGBoost Model
3.3. Robustness Analysis
4. Conclusions
Author Contributions
Funding
Institutional Review Board Statement
Informed Consent Statement
Data Availability Statement
Conflicts of Interest
References
- China Marine Disaster Bulletin. Available online: http://www.mnr.gov.cn/sj/sjfw/hy/gbgg/zghyzhgb/ (accessed on 4 March 2021).
- Schmidt, S.; Kemfert, C.; Höppe, P. The impact of socio-economics and climate change on tropical cyclone losses in the USA. Reg. Environ. Change 2010, 10, 13–26. [Google Scholar] [CrossRef] [Green Version]
- Murnane, R.J.; Elsner, J.B. Maximum wind speeds and US hurricane losses. Geophys. Res. Lett. 2012, 39, 16707. [Google Scholar] [CrossRef] [Green Version]
- Kim, J.-M.; Son, K.; Kim, Y.-J. Assessing regional typhoon risk of disaster management by clustering typhoon paths. Environ. Dev. Sustain. 2019, 21, 2083–2096. [Google Scholar] [CrossRef]
- Qi, P.; Du, M. Multi-factor evaluation indicator method for the risk assessment of atmospheric and oceanic hazard group due to the attack of tropical cyclones. Int. J. Appl. Earth Obs. Geoinform. 2018, 68, 1–7. [Google Scholar] [CrossRef]
- Tan, L.; Wu, X.; Xu, Z.; Li, L. Comprehensive economic loss assessment of disaster based on CGE model and IO model—A case study on Beijing “7.21 Rainstorm”. Int. J. Dis. Risk Reduct. 2019, 39, 101246. [Google Scholar] [CrossRef]
- Sun, W.; Bocchini, P.; Davison, B.D. Applications of artificial intelligence for disaster management. Nat. Hazards 2020, 103, 2631–2689. [Google Scholar] [CrossRef]
- Lou, W.; Chen, H.; Shen, X.; Sun, K.; Deng, S. Fine assessment of tropical cyclone disasters based on GIS and SVM in Zhejiang Province, China. Nat. Hazards 2012, 64, 511–529. [Google Scholar] [CrossRef]
- Wang, T.T.; Liu, Q. Prediction of storm surge disaster loss based on BAS-BP model. Mar. Environ. Sci. 2018, 37, 457–463. (In Chinese) [Google Scholar]
- Yuan, S.; Wang, G.; Chen, J.; Guo, W. Assessing the Forecasting of Comprehensive Loss Incurred by Typhoons: A Combined PCA and BP Neural Network Model. J. Artif. Intell. 2019, 1, 69–88. [Google Scholar] [CrossRef]
- Jianghao, L.; Aimin, Y. Economic loss assessment of typhoon based on BP neural network and VSM. J. Catastrophol. 2019, 1, 22–26. (In Chinese) [Google Scholar]
- Chen, S.; Tang, D.; Liu, X.; Chunhua, H. Assessment of tropical cyclone disaster loss in Guangdong Province based on combined model. Geomatics, Nat. Hazards Risk 2018, 9, 431–441. [Google Scholar] [CrossRef] [Green Version]
- Cai, J.; Li, X.; Tan, Z.; Peng, S. An assembly-level neutronic calculation method based on LightGBM algorithm. Ann. Nucl. Energy 2021, 150, 107871. [Google Scholar] [CrossRef]
- Dong, L.; Zeng, W.; Wu, L.; Lei, G.; Chen, H.; Srivastava, A.K.; Gaiser, T. Estimating the Pan Evaporation in Northwest China by Coupling CatBoost with Bat Algorithm. Water 2021, 13, 256. [Google Scholar] [CrossRef]
- Jevšenak, J.; Skudnik, M. A random forest model for basal area increment predictions from national forest inventory data. For. Ecol. Manag. 2021, 479, 118601. [Google Scholar] [CrossRef]
- Liu, J.; Wu, J.; Liu, S.; Li, M.; Hu, K.; Li, K. Predicting mortality of patients with acute kidney injury in the ICU using XGBoost model. PLoS ONE 2021, 16, e0246306. [Google Scholar] [CrossRef] [PubMed]
- Sagi, O.; Rokach, L. Ensemble learning: A survey. Wiley Interdiscip. Rev. Data Min. Knowl. Discov. 2018, 8, 1249. [Google Scholar] [CrossRef]
- Zhao, X.; Li, H.; Ding, L.; Liu, M. Research and application of a hybrid system based on interpolation for forecasting direct economic losses of marine disasters. Int. J. Disaster Risk Reduct. 2019, 37, 101121. [Google Scholar] [CrossRef]
- Chen, T.; Guestrin, C. XGBoost: A Scalable Tree Boosting System. In Proceedings of the 22nd ACM SIGKDD International Conference on Knowledge Discovery and Data mining, San Francisco, CA, USA, 13–17 August 2016; pp. 785–794. [Google Scholar]
- Chaitanya, K.; Karani, N.; Baumgartner, C.F.; Becker, A.; Donati, O.; Konukoglu, E. Semi-supervised and Task-Driven Data Augmentation. In Proceedings of the 26th International Conference on Information Processing in Medical Imaging (IPMI), Hong Kong, China, 2–7 June 2019; pp. 29–41. [Google Scholar]
- Shorten, C.; Khoshgoftaar, T.M. A survey on Image Data Augmentation for Deep Learning. J. Big Data 2019, 6, 60. [Google Scholar] [CrossRef]
- Yang, S.; Liu, X.; Liu, Q. A storm surge projection and disaster risk assessment model for China coastal areas. Nat. Hazards 2016, 84, 649–667. [Google Scholar] [CrossRef]
- Xianwu, S.; Ziqiang, H.; Jiayi, F.; Jun, T.; Zhixing, G.; Zhilin, S. Assessment and zonation of storm surge hazards in the coastal areas of China. Nat. Hazards 2019, 100, 39–48. [Google Scholar] [CrossRef]
- Sun, R.; Gong, Z.; Gao, G.; Shah, A.A. Comparative analysis of Multi-Criteria Decision-Making methods for flood disaster risk in the Yangtze River Delta. Int. J. Disaster Risk Reduct. 2020, 51, 101768. [Google Scholar] [CrossRef]
- Guo, T.; Li, G. Study on methods to identify the impact factors of economic losses due to typhoon storm surge based on confirmatory factor analysis. Nat. Hazards 2020, 100, 515–534. [Google Scholar] [CrossRef]
- Stefanidis, S.; Stathis, D. Assessment of flood hazard based on natural and anthropogenic factors using analytic hierarchy process (AHP). Nat. Hazards 2013, 68, 569–585. [Google Scholar] [CrossRef]
- Koks, E.; Jongman, B.; Husby, T.; Botzen, W. Combining hazard, exposure and social vulnerability to provide lessons for flood risk management. Environ. Sci. Policy 2015, 47, 42–52. [Google Scholar] [CrossRef]
- Davidson, R.A.; Lambert, K.B. Comparing the Hurricane Disaster Risk of U.S. Coastal Counties. Nat. Hazards Rev. 2001, 2, 132–142. [Google Scholar] [CrossRef]
- Cardona, O.D. Measuring Vulnerability to Natural Hazards: Towards Disaster Resilient Societies. In Measuring Vulnerability to Natural Hazards: Toward Disaster Resilient Societies; Birkmann, J., Ed.; United Nations University Press: Tokyo, Japan, 2006; pp. 189–209. [Google Scholar]
- Cutter, S.L.; Mitchell, J.T.; Scott, M.S. Revealing the Vulnerability of People and Places: A Case Study of Georgetown County, South Carolina. Ann. Assoc. Am. Geogr. 2000, 90, 713–737. [Google Scholar] [CrossRef]
- De Almeida, L.Q.; Welle, T.; Birkmann, J. Disaster risk indicators in Brazil: A proposal based on the world risk index. Int. J. Disaster Risk Reduct. 2016, 17, 251–272. [Google Scholar] [CrossRef]
- Ainuddin, S.; Routray, J.K.; Ainuddin, S. Operational indicators for assessing vulnerability and resilience in the context of natural hazards and disasters. Int. J. Risk Assess. Manag. 2015, 18, 66–88. [Google Scholar] [CrossRef]
- Nicholls, R.J.; Wong, P.P.; Burkett, V.; Woodroffe, C.D.; Hay, J. Climate change and coastal vulnerability assessment: Scenarios for integrated assessment. Sustain. Sci. 2008, 3, 89–102. [Google Scholar] [CrossRef]
- Peduzzi, P.; Dao, Q.-H.; Herold, C.; Mouton, F. Assessing global exposure and vulnerability towards natural hazards: The Disaster Risk Index. Nat. Hazards Earth Syst. Sci. 2009, 9, 1149–1159. [Google Scholar] [CrossRef]
- Pelling, M.; Maskrey, A.; Ruiz, P.; Hall, L. Reducing Disaster Risk: A Challenge for Development-a Global Report, 1st ed.; United Nations Development Programme, Bureau for Crisis Prevention and Recovery: New York, NY, USA, 2004; pp. 1–161. [Google Scholar]
- Dickson, E.; Baker, J.L.; Hoornweg, D.; Asmita, T. Urban Risk Assessments: An Approach for Understanding Disaster and Climate Risk in Cities, 1st ed.; The World Bank: Washington, DC, USA, 2012; pp. 5–227. [Google Scholar]
- Lam, J.S.L.; Lassa, J.A. Risk assessment framework for exposure of cargo and ports to natural hazards and climate extremes. Marit. Policy Manag. 2016, 44, 1–15. [Google Scholar] [CrossRef]
- Liu, Y.; Zhang, S.; Wang, T. Analysis of influence factors of disaster prevention capacity in urban green space based on analytic hierarchy process. Energy Procedia 2018, 153, 370–375. [Google Scholar] [CrossRef]
- Jeong, D.; Kim, M.; Song, K.; Lee, J. Planning a Green Infrastructure Network to Integrate Potential Evacuation Routes and the Urban Green Space in a Coastal City: The Case Study of Haeundae District, Busan, South Korea. Sci. Total. Environ. 2021, 761, 143179. [Google Scholar] [CrossRef]
- Mabon, L. Enhancing post-disaster resilience by ‘building back greener’: Evaluating the contribution of nature-based solutions to recovery planning in Futaba County, Fukushima Prefecture, Japan. Landsc. Urban Plan. 2019, 187, 105–118. [Google Scholar] [CrossRef]
- Tidball, K.G.; Aktipis, A. Feedback enhances greening during disaster recovery: A model of social and ecological processes in neighborhood scale investment. Urban For. Urban Green. 2018, 34, 269–280. [Google Scholar] [CrossRef]
- Griego, A.L.; Flores, A.B.; Collins, T.W.; Grineski, S.E. Social vulnerability, disaster assistance, and recovery: A population-based study of Hurricane Harvey in Greater Houston, Texas. Int. J. Disaster Risk Reduct. 2020, 51, 101766. [Google Scholar] [CrossRef]
- Jonkman, S.N.; Maaskant, B.; Boyd, E.; Levitan, M.L. Loss of Life Caused by the Flooding of New Orleans After Hurricane Katrina: Analysis of the Relationship Between Flood Characteristics and Mortality. Risk Anal. 2009, 29, 676–698. [Google Scholar] [CrossRef] [PubMed]
- Brooks, N. Vulnerability, risk and adaptation: A conceptual framework. Tyndall Cent. Clim. Chang. Res. Work. Pap. 2003, 38, 1–16. [Google Scholar]
- Ramirez, J.A.; Lichter, M.; Coulthard, T.J.; Skinner, C. Hyper-resolution mapping of regional storm surge and tide flooding: Comparison of static and dynamic models. Nat. Hazards 2016, 82, 571–590. [Google Scholar] [CrossRef]
- Pandey, R.S.; Liou, Y.-A. Decadal behaviors of tropical storm tracks in the North West Pacific Ocean. Atmos. Res. 2020, 246, 105143. [Google Scholar] [CrossRef]
- Ying, M.; Zhang, W.; Yu, H.; Lu, X.; Feng, J.; Fan, Y.; Zhu, Y.; Chen, D. An Overview of the China Meteorological Administration Tropical Cyclone Database. J. Atmos. Ocean. Technol. 2014, 31, 287–301. [Google Scholar] [CrossRef] [Green Version]
- Fujian Marine Disaster Bulletin. Available online: http://hyyyj.fujian.gov.cn/search/?key=%E6%B5%B7%E6%B4%8B%E7%81%BE%E5%AE%B3%E5%85%AC%E6%8A%A5 (accessed on 4 March 2021).
- Guangdong Marine Disaster Bulletin. Available online: http://nr.gd.gov.cn/gkmlpt/search?keywords=%E5%B9%BF%E4%B8%9C%E7%9C%81%E6%B5%B7%E6%B4%8B%E7%81%BE%E5%AE%B3%E5%85%AC%E6%8A%A5 (accessed on 4 March 2021).
- Fujiang, Y.; Jianxi, D.; Lin, Y. Collection Of Storm Surge Disasters Historical Data In China 1949–2009, 1st ed.; China Ocean Press: Beijing, China, 2015; pp. 516–740. [Google Scholar]
- Central Meteorological Observatory: Typhoon Website. Available online: http://typhoon.nmc.cn/web.html (accessed on 4 March 2021).
- National Statistics of China. Available online: https://data.stats.gov.cn/index.htm (accessed on 4 March 2021).
- Fujian Statistical Yearbook. Available online: http://tjj.fujian.gov.cn/xxgk/ndsj/ (accessed on 4 March 2021).
- Guangdong Statistical Yearbook. Available online: http://stats.gd.gov.cn/gdtjnj/ (accessed on 4 March 2021).
- Bulletins and Yearbooks Used in This Article. (password: wign). Available online: https://pan.baidu.com/s/1FENw4s3sp7A3xdUGCx3yEw (accessed on 4 March 2021).
- Deng, Y. Research and Empirical Analysis on Filling Method of Missing Data. Master’s Thesis, Northwestern University, Xi’an, China, 2010. (In Chinese). [Google Scholar]
- Jin, L. Research on Missing Value Imputation of Incomplete Data. Master’s Thesis, Harbin Institute of Technology, Harbin, China, 2013. (In Chinese). [Google Scholar]
- Polikar, R. Ensemble based systems in decision making. IEEE Circ. Syst. Mag. 2006, 6, 21–45. [Google Scholar] [CrossRef]
- Dietterich, T.G. Ensemble learning. In The Handbook of Brain Theory and Neural Networks; MIT Press: Cambridge, UK, 2002; pp. 110–125. [Google Scholar]
- Fernández-Delgado, M.; Cernadas, E.; Barro, S.; Amorim, D. Do we need hundreds of classifiers to solve real world classification problems? J. Mach. Learn. Res. 2014, 15, 3133–3181. [Google Scholar]
- Breiman, L. Bagging predictors. Mach. Learn. 1996, 24, 123–140. [Google Scholar] [CrossRef] [Green Version]
- Friedman, J.H. Stochastic gradient boosting. Comput. Stat. Data Anal. 2002, 38, 367–378. [Google Scholar] [CrossRef]
- Breiman, L. Random Forests. Mach. Learn. 2001, 45, 5–32. [Google Scholar] [CrossRef] [Green Version]
- Friedman, J.H. Greedy Function Approximation: A Gradient Boosting Machine. Ann. Stat. 2001, 29, 1189–1232. [Google Scholar] [CrossRef]
- Ke, G.L.; Meng, Q.; Finley, T.F.; Wang, T.; Chen, W.; Ma, W.; Ye, Q.; Liu, T.Y. LightGBM: A Highly Efficient Gradient Boosting Decision Tree, 2017. In Proceedings of the 31st Conference on Neural Information Processing Systems (NIPS), Long Beach, CA, USA, 4–9 December 2017; pp. 3149–3157. [Google Scholar]
- Prokhorenkova, L.; Gusev, G.; Vorobev, A.; Dorogush, A.V.; Gulin, A. CatBoost: Unbiased boosting with categorical fea-tures. In Proceedings of the Advances in Neural Information Processing Systems (NIPS), Montreal, QC, Canada, 3–8 December 2018; pp. 6638–6648. [Google Scholar]
- Moreno-Barea, F.J.; Strazzera, F.; Jerez, J.M.; Urda, D.; Franco, L. Forward Noise Adjustment Scheme for Data Augmentation. In Proceedings of the 2018 IEEE Symposium Series on Computational Intelligence (SSCI), Bangalore, India, 18–21 November 2018; pp. 728–734. [Google Scholar]


| Criteria | Indicators | Variable | References |
|---|---|---|---|
| Disaster-causing factors | Maximum storm surge (cm) | Guo 2020 [25], Shi 2020 [23], Wang 2018 [9], Yang 2016 [22], Nicholls 2008 [33] | |
| Exceeding the local warning water level (cm) | Guo 2020 [25], Shi 2020 [23], Wang 2018 [9], Yang 2016 [22] | ||
| Duration of the typhoon (hour) | Guo 2020 [25] | ||
| Disaster-formative environment | Urban green area (hm2) | Sun 2020 [24], Stefanidis 2013 [26], Peduzzi 2009 [34], Pelling 2004 [35] | |
| The sown area of crops (hm2) | Guo 2020 [25], Stefanidis 2013, Peduzzi 2009 [34], Pelling 2004 [35] | ||
| Aquaculture area (hm2) | Guo 2020 [25], Nicholls 2008 [33] | ||
| The proportion of the old and young population (%) | Sun 2020 [24], Koks 2015 [27], Cutter 2000 [30] | ||
| The proportion of the urban population (%) | Guo 2020 [25], Sun 2020 [24], Almeida 2016 [31], Peduzzi 2009 [34], Pelling 2004 [35] | ||
| Disaster-affected bodies | The disaster-affected population (10,000) | Dickson 2012 [36], Wang 2018 [9] | |
| The length of marine engineering damage (km) | Wang 2018 [9], Lam 2017 [37] | ||
| Disaster prevention capabilities | GDP per capita (CNY 1) | Guo 2020 [25], Sun 2020 [24], Wang 2018 [9], Almeida 2016 [31], Peduzzi 2009 [34], Nicholls2008 [33], Pelling 2004 [35], Davidson 2001 [28] | |
| The unemployment rate (%) | Sun 2020 [24], Peduzzi 2009 [34], Pelling 2004 [35] | ||
| Fiscal expenditure (CNY 100 M) | Sun 2020 [24], Ainuddin 2015 [32], Cardona 2006 [29] | ||
| The number of beds per thousand people | Guo 2020 [25], Sun 2020 [24], Wang 2018 [9], Almeida 2016, Ainuddin 2015 [32], Davidson 2001 [9] | ||
| Number of medical institutions | Guo 2020 [25], Sun 2020 [24], Wang 2018 [9], Ainuddin 2015 [32] | ||
| Commercial insurance costs (CNY 100 M) | Guo 2020 [25], Ainuddin 2015 [32], Cardona 2006 [29] |
| KNN-GN-Based XGBoost | XGBoost | BPNN | SVR | |
|---|---|---|---|---|
| Training set | 0.450 | 0.241 | 0.175 | 0.029 |
| Validation set | 0.304 | 0.384 | 0.857 | 0.837 |
Publisher’s Note: MDPI stays neutral with regard to jurisdictional claims in published maps and institutional affiliations. |
© 2021 by the authors. Licensee MDPI, Basel, Switzerland. This article is an open access article distributed under the terms and conditions of the Creative Commons Attribution (CC BY) license (http://creativecommons.org/licenses/by/4.0/).
Share and Cite
Sun, H.; Wang, J.; Ye, W. A Data Augmentation-Based Evaluation System for Regional Direct Economic Losses of Storm Surge Disasters. Int. J. Environ. Res. Public Health 2021, 18, 2918. https://0-doi-org.brum.beds.ac.uk/10.3390/ijerph18062918
Sun H, Wang J, Ye W. A Data Augmentation-Based Evaluation System for Regional Direct Economic Losses of Storm Surge Disasters. International Journal of Environmental Research and Public Health. 2021; 18(6):2918. https://0-doi-org.brum.beds.ac.uk/10.3390/ijerph18062918
Chicago/Turabian StyleSun, Hai, Jin Wang, and Wentao Ye. 2021. "A Data Augmentation-Based Evaluation System for Regional Direct Economic Losses of Storm Surge Disasters" International Journal of Environmental Research and Public Health 18, no. 6: 2918. https://0-doi-org.brum.beds.ac.uk/10.3390/ijerph18062918