
Effect of a Simulated Heat Wave on Physiological Strain and Labour Productivity

 , , and
Abstract
:1. Introduction
2. Materials and Methods
2.1. Participants
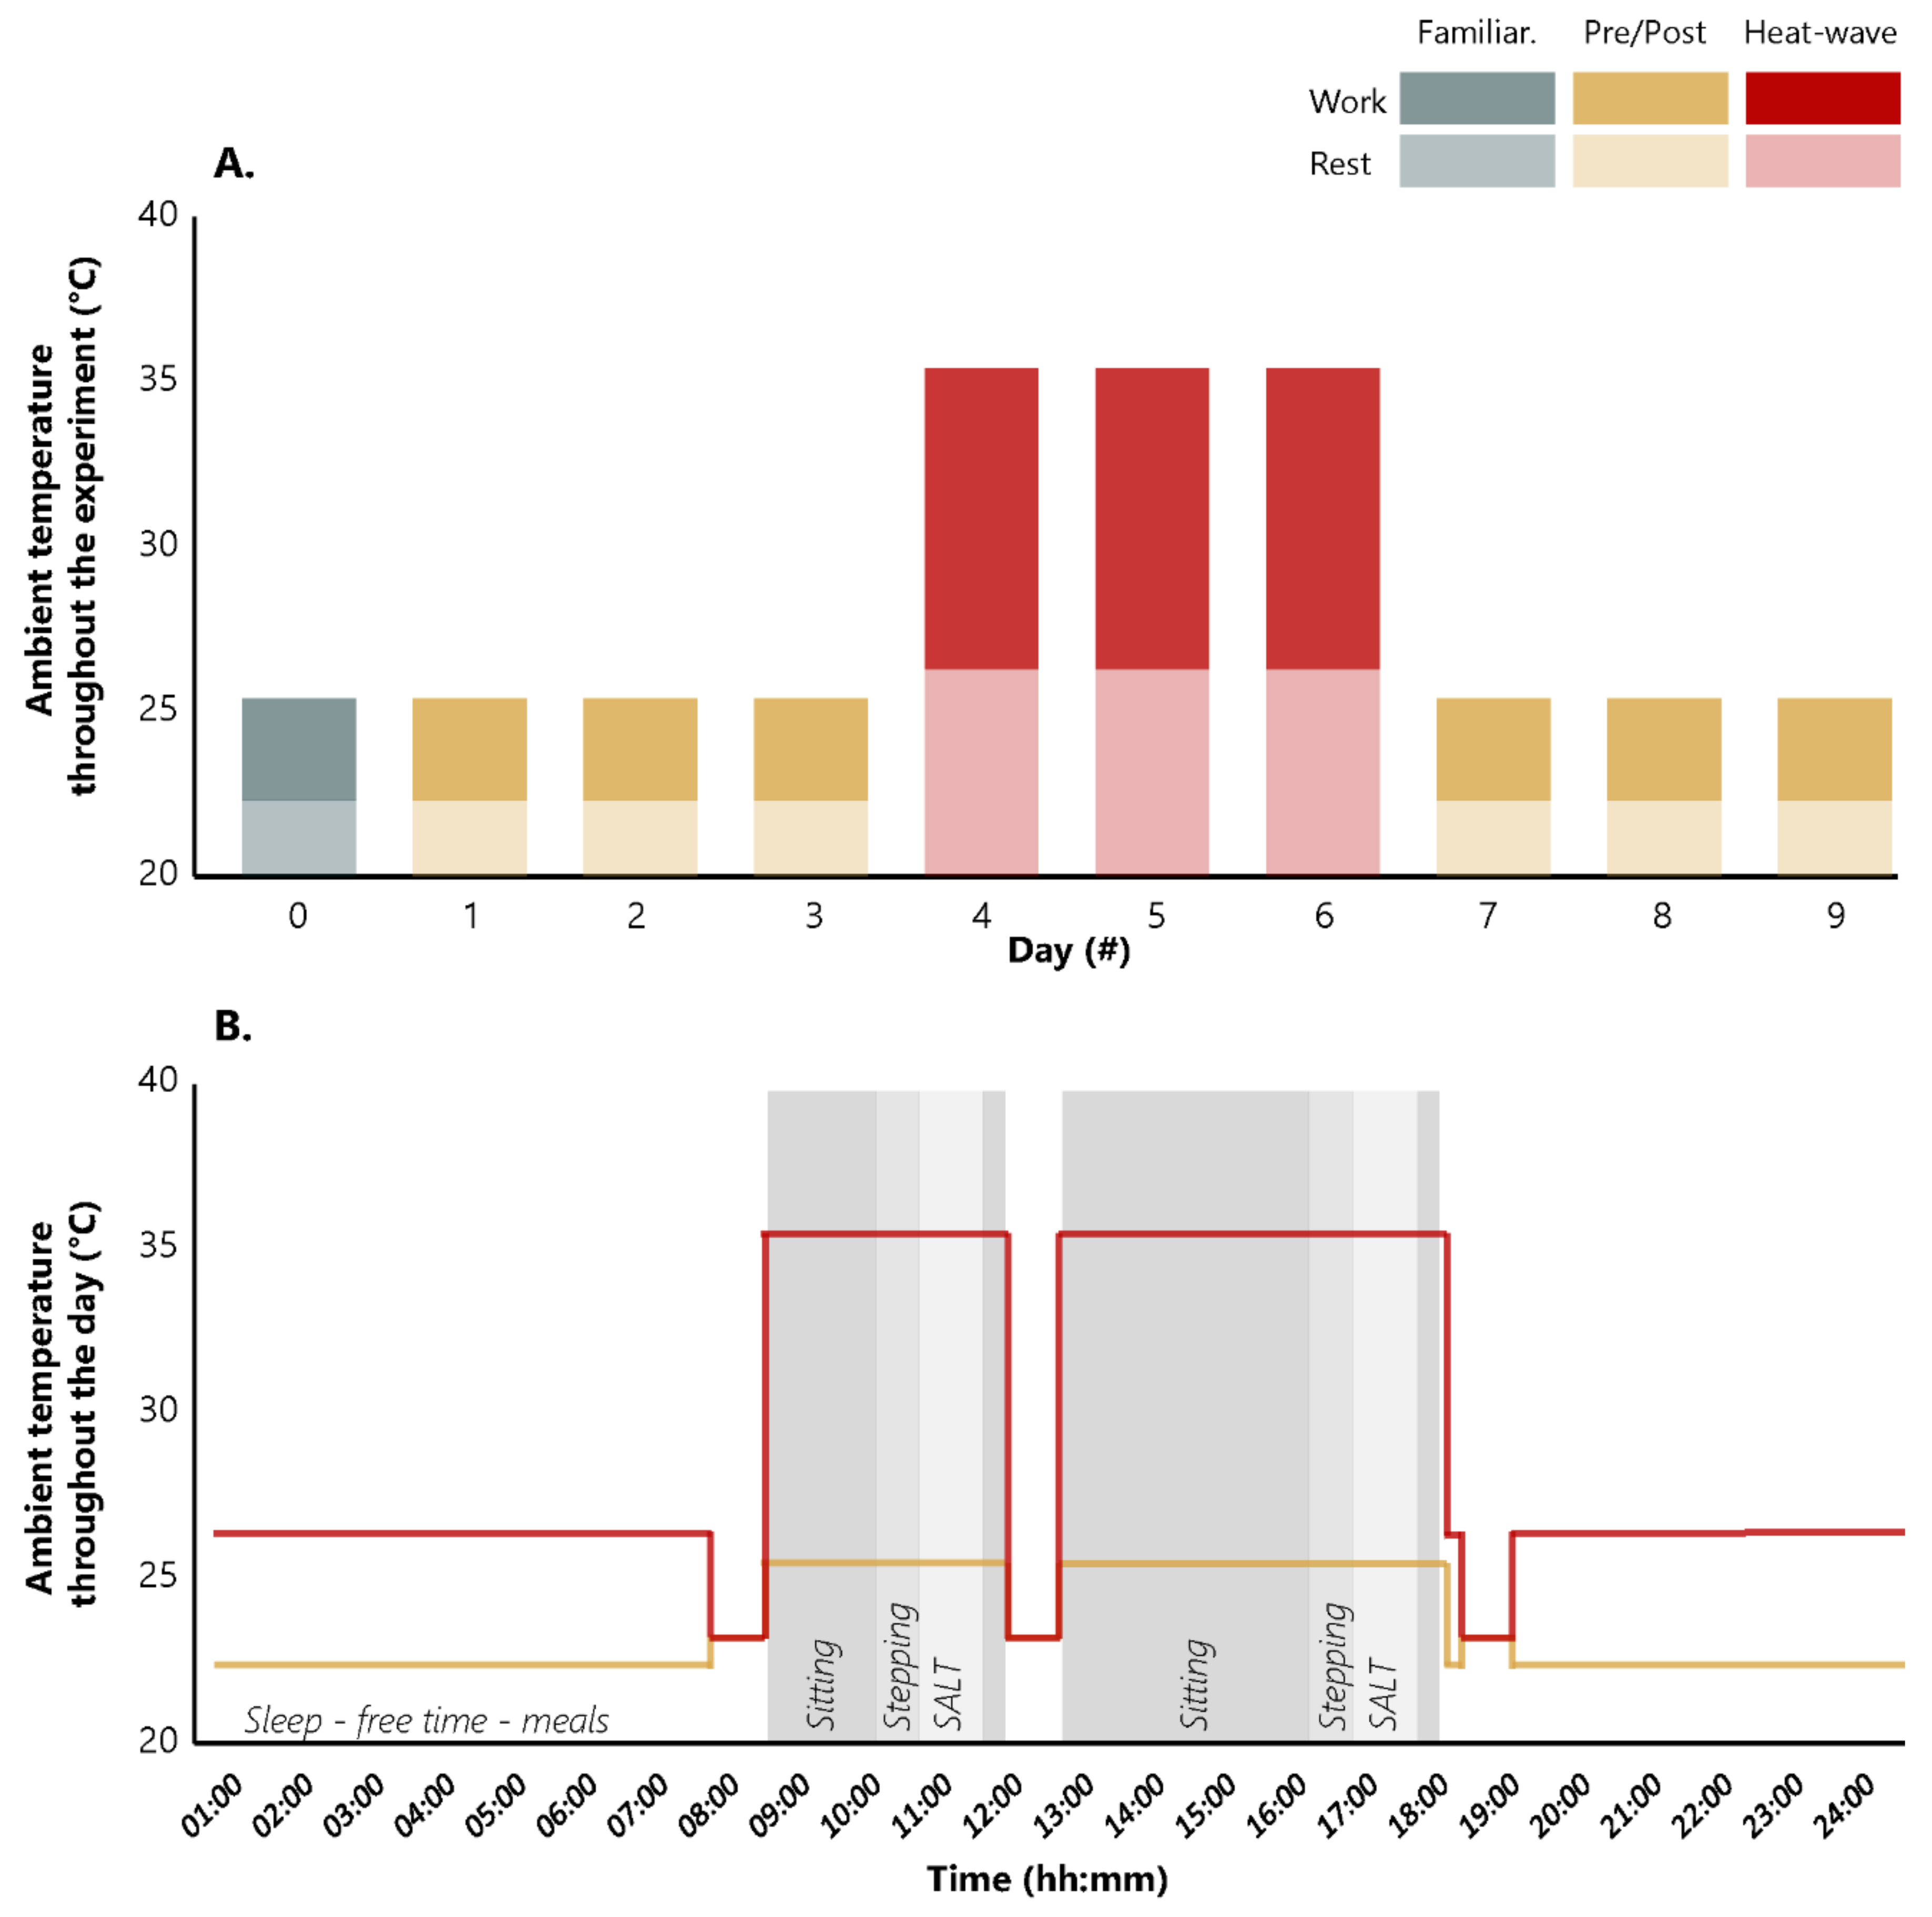
2.2. Procedures
2.3. Data Analysis
3. Results
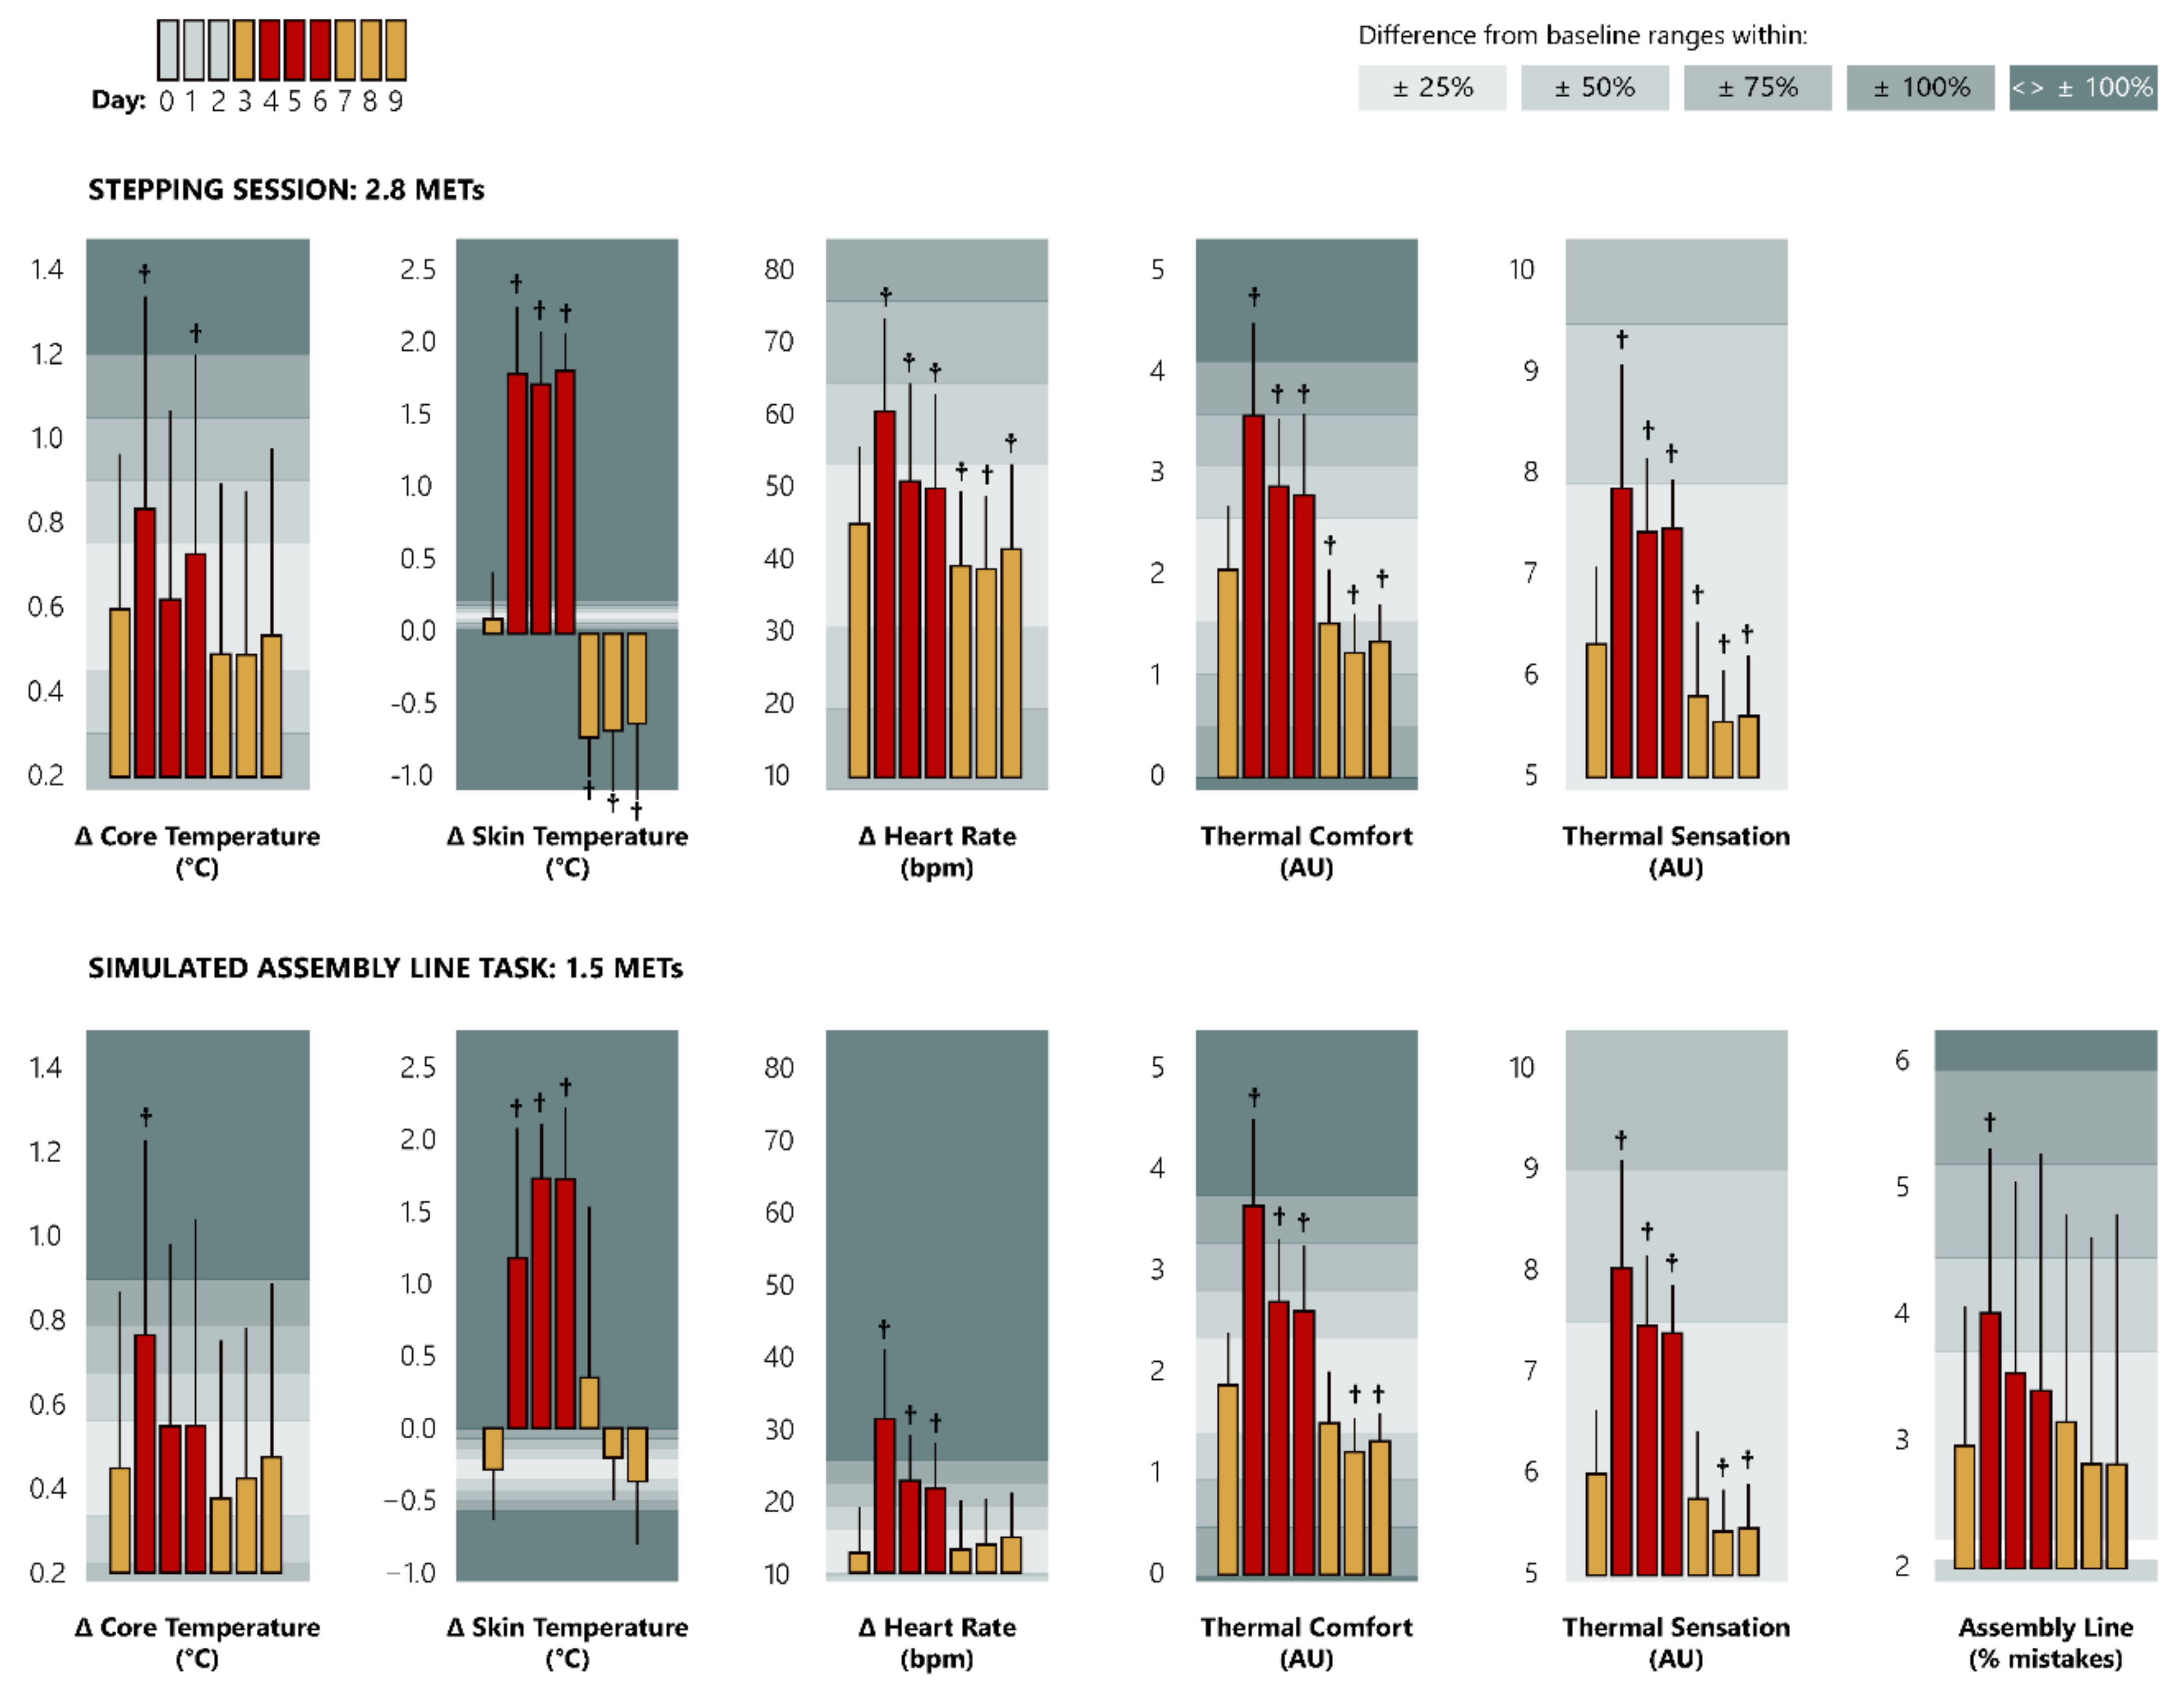
3.1. General Findings
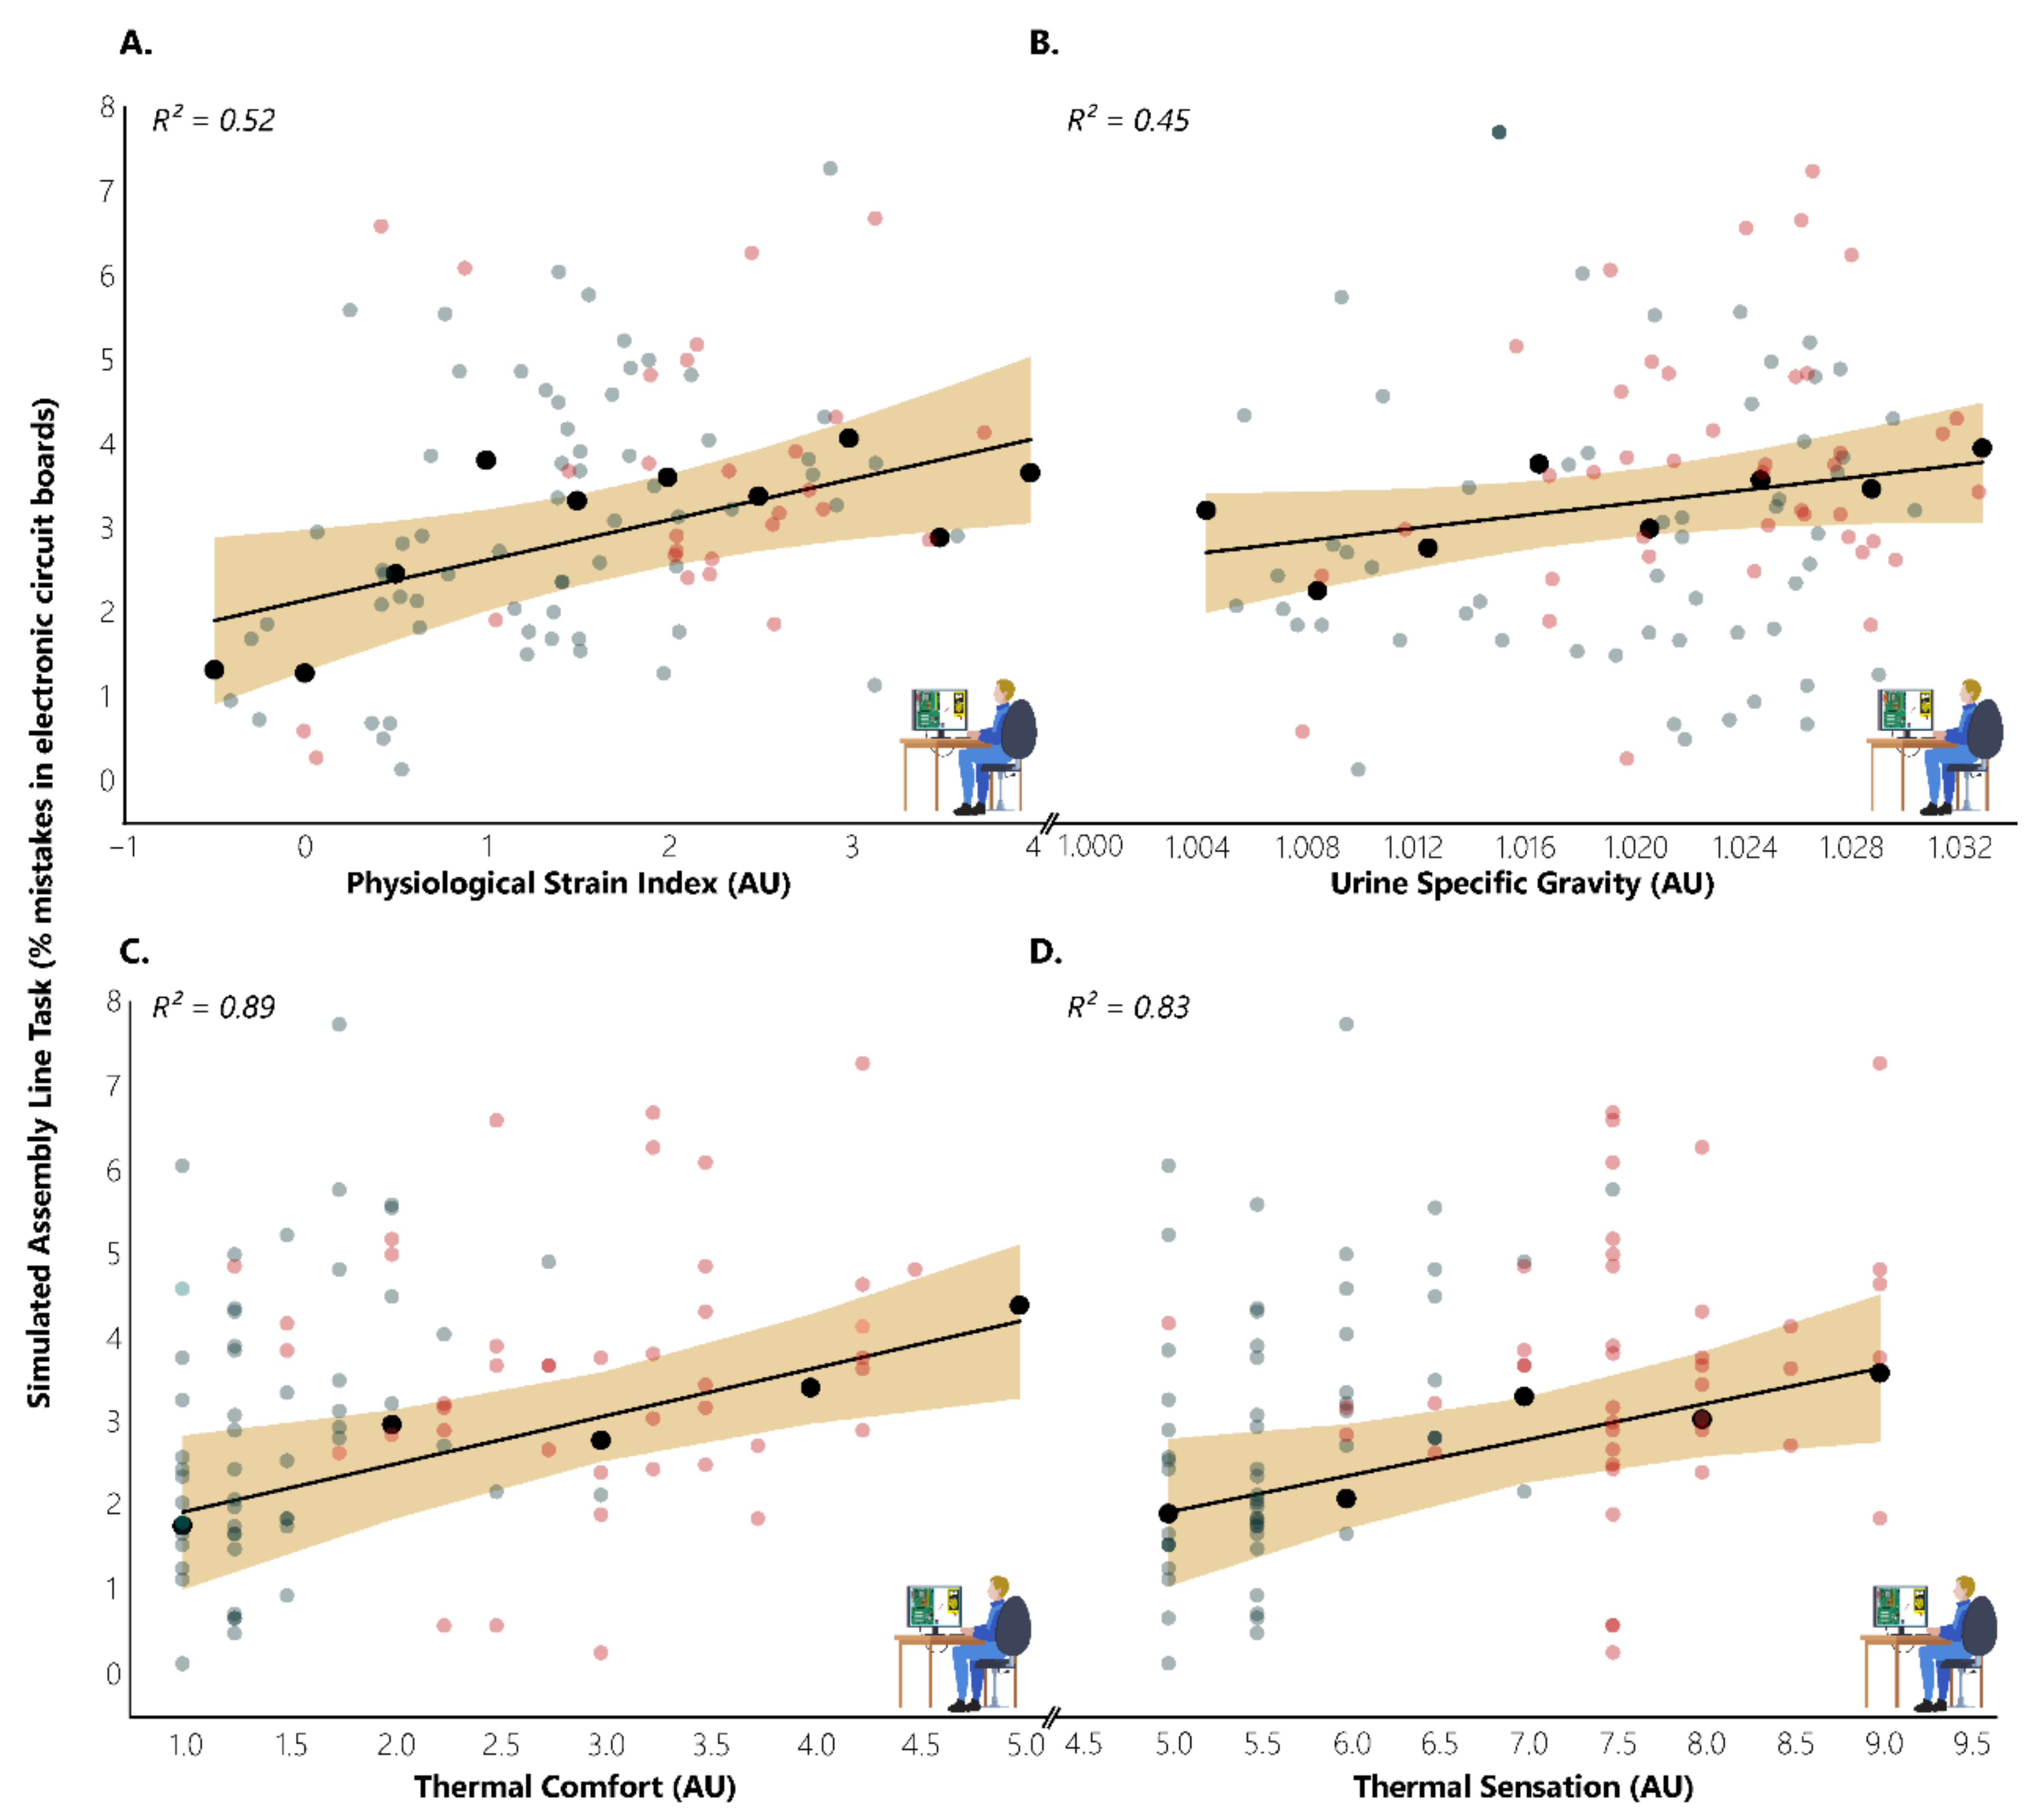
3.2. Effect of Heat-Wave on Simulated Assembly Line Task
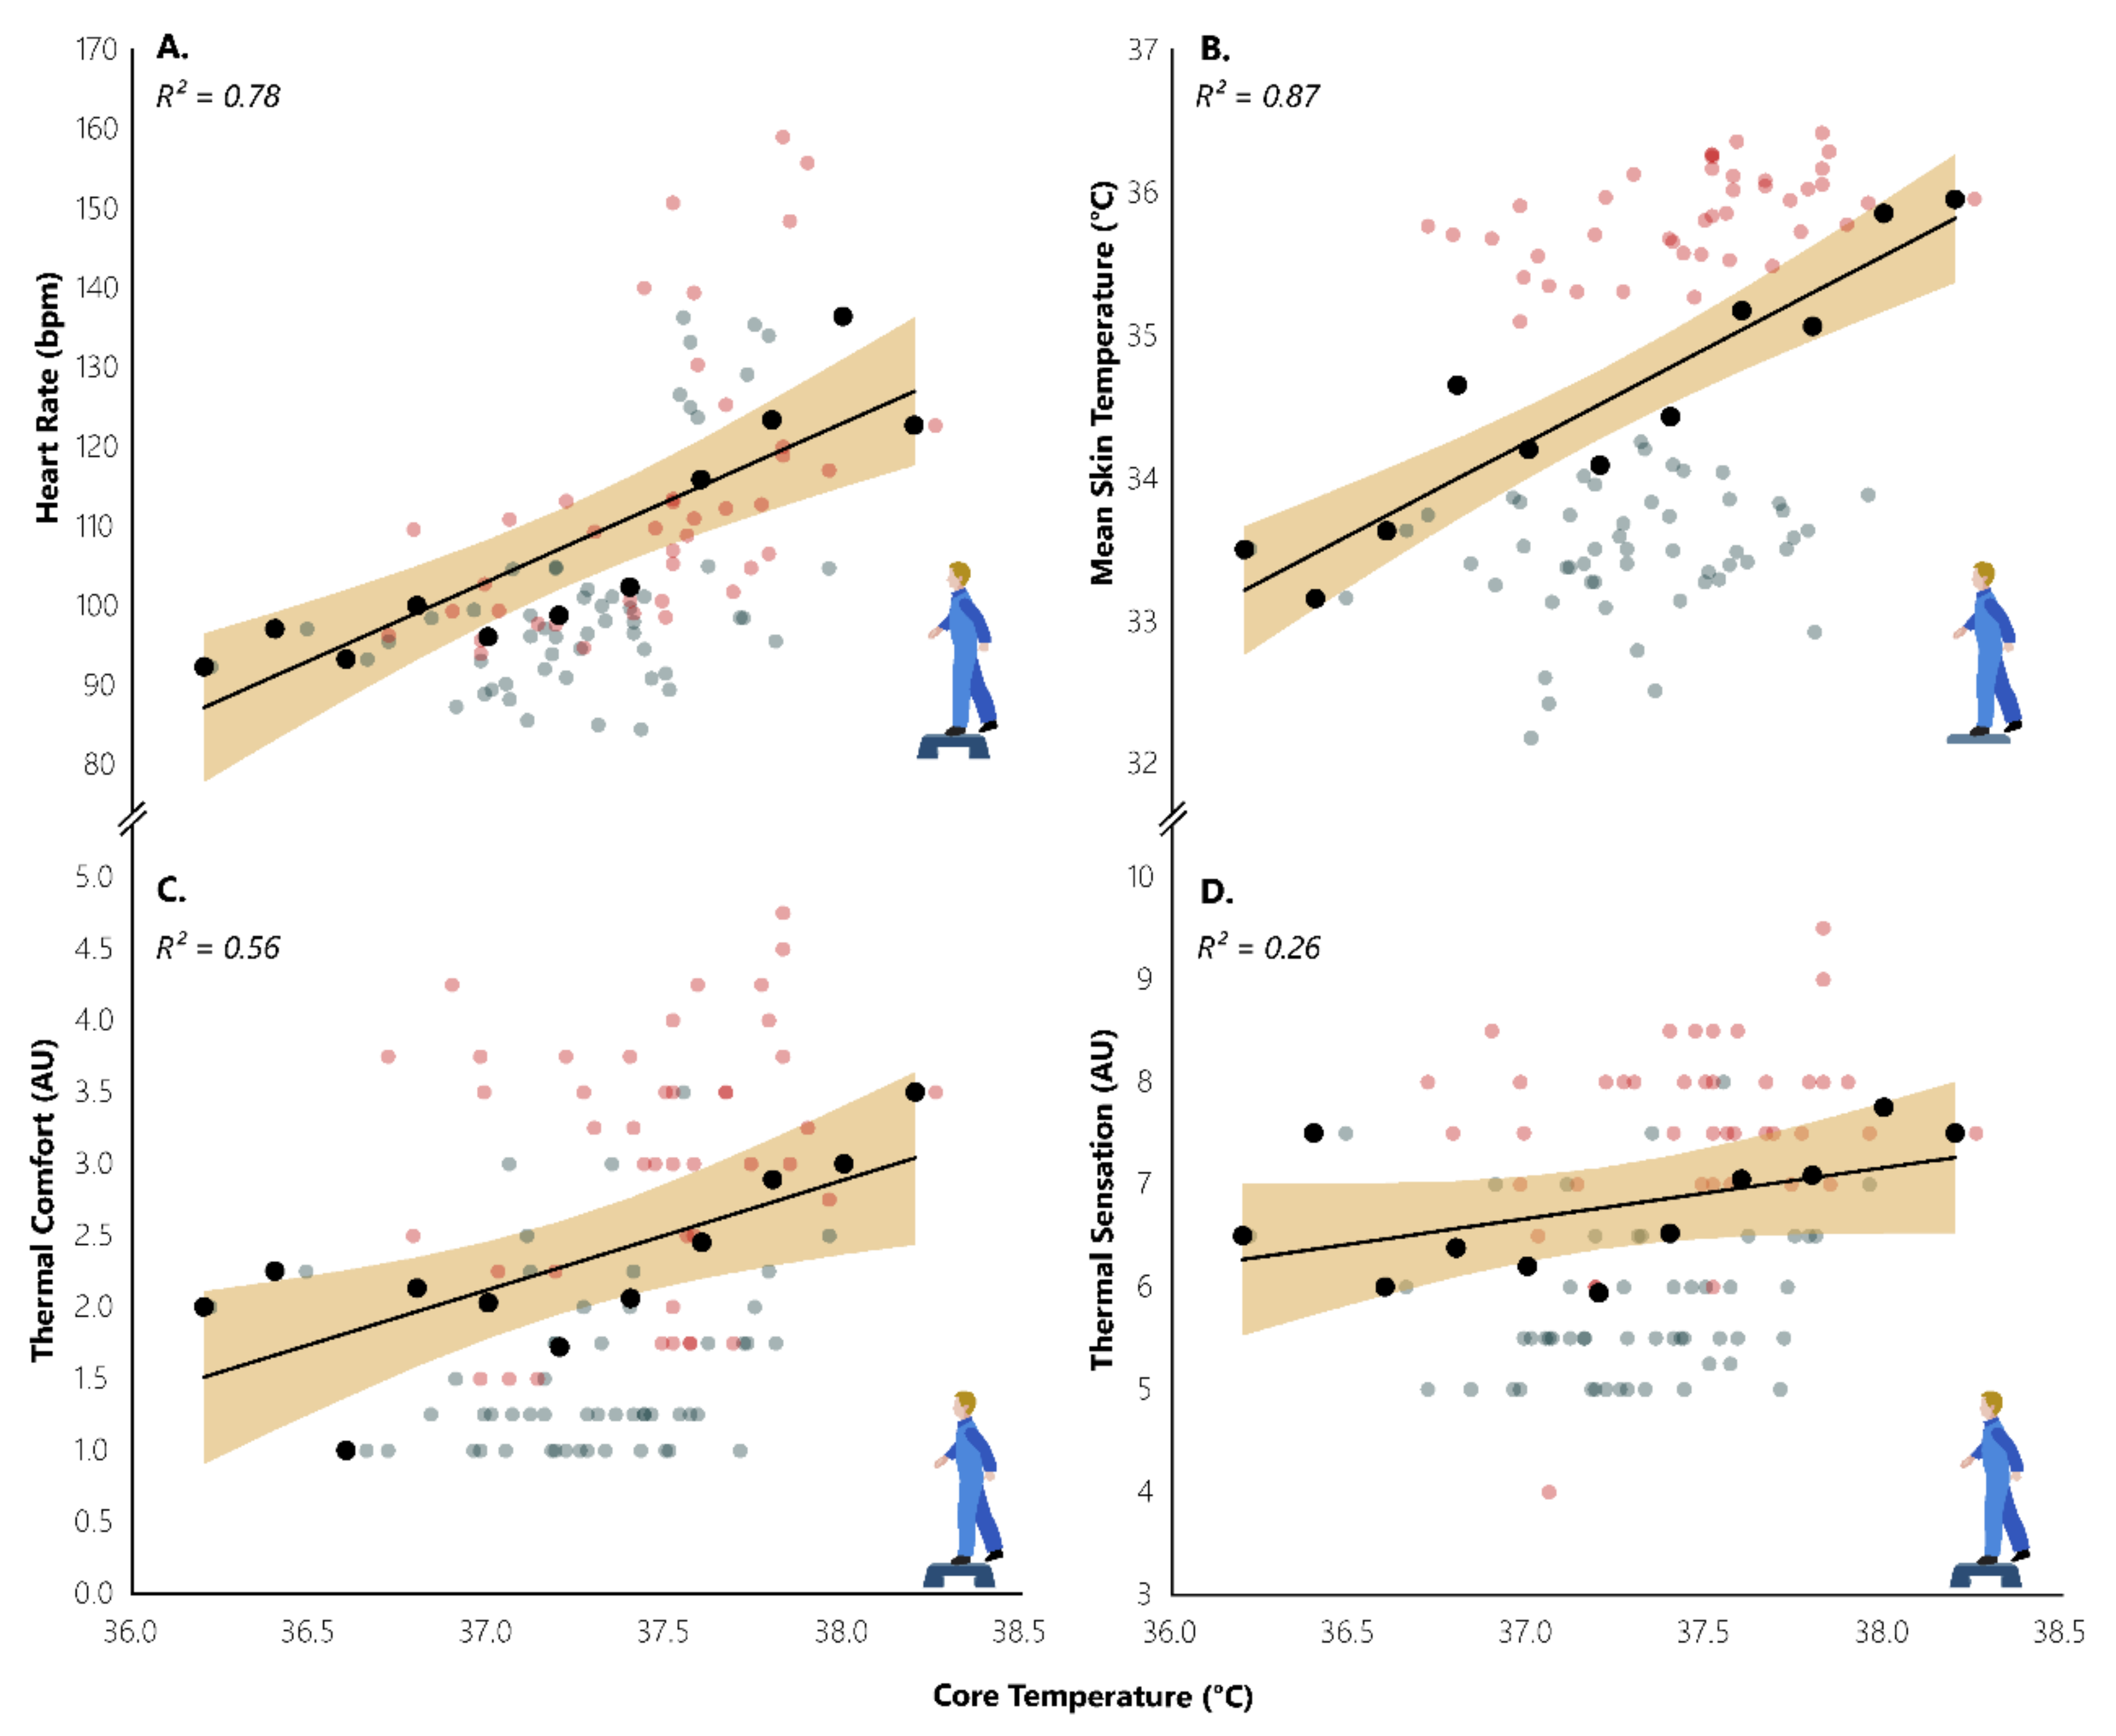
3.3. Effect of Heat-Wave on Physical Activity
4. Discussion
5. Conclusions
Author Contributions
Funding
Institutional Review Board Statement
Informed Consent Statement
Conflicts of Interest
Appendix A

Appendix B


Appendix C

| Baseline | Heat-Wave | Post Heat-Wave | |||||||
|---|---|---|---|---|---|---|---|---|---|
| Session | Variable | 1–3 | 1 | 2 | 3 | 1 | 2 | 3 | |
| SALT | Tcore | Mean (°C) | 37.2 | 37.5 | 37.3 | 37.3 | 37.1 | 37.2 | 37.2 |
| SD (°C) | 0.2 | 0.3 | 0.3 | 0.3 | 0.2 | 0.2 | 0.3 | ||
| Min (°C) | 36.9 | 37.0 | 36.8 | 36.8 | 36.8 | 36.8 | 36.6 | ||
| Max (°C) | 37.6 | 38.1 | 37.7 | 37.9 | 37.7 | 37.6 | 37.7 | ||
| Tsk | Mean (°C) | 33.8 | 35.3 | 35.9 | 35.9 | 34.5 | 33.9 | 33.8 | |
| SD (°C) | 0.6 | 1.0 | 0.4 | 0.5 | 1.2 | 0.4 | 0.4 | ||
| Min (°C) | 32.2 | 33.6 | 35.0 | 34.4 | 32.7 | 33.0 | 32.9 | ||
| Max (°C) | 34.5 | 36.7 | 36.4 | 36.3 | 36.1 | 34.4 | 34.4 | ||
| HR | Mean (bpm) | 72.3 | 91.9 | 82.7 | 82.3 | 73.1 | 73.9 | 75.8 | |
| SD (bpm) | 11.3 | 14.5 | 11.2 | 11.0 | 10.4 | 11.1 | 10.4 | ||
| Min (bpm) | 58.2 | 73.2 | 67.4 | 70.1 | 61.8 | 60.4 | 66.5 | ||
| Max (bpm) | 95.4 | 127.1 | 108.2 | 102.5 | 97.8 | 102.3 | 102.3 | ||
| STEP | Tcore | Mean (°C) | 37.3 | 37.5 | 37.4 | 37.5 | 37.2 | 37.2 | 37.3 |
| SD (°C) | 0.2 | 0.4 | 0.3 | 0.3 | 0.3 | 0.3 | 0.4 | ||
| Min (°C) | 37.0 | 36.9 | 36.7 | 37.0 | 36.5 | 36.7 | 36.2 | ||
| Max (°C) | 37.7 | 38.3 | 37.9 | 38.0 | 37.7 | 37.8 | 37.8 | ||
| Tsk | Mean (°C) | 34.2 | 35.9 | 35.8 | 35.9 | 33.4 | 33.4 | 33.5 | |
| SD (°C) | 0.3 | 0.4 | 0.2 | 0.4 | 0.4 | 0.3 | 0.4 | ||
| Min (°C) | 33.3 | 35.3 | 35.3 | 35.1 | 32.4 | 32.6 | 32.5 | ||
| Max (°C) | 34.5 | 36.4 | 36.2 | 36.3 | 34.1 | 33.8 | 34.3 | ||
| HR | Mean (bpm) | 104.6 | 119.8 | 110.5 | 110.0 | 98.6 | 99.2 | 102.2 | |
| SD (bpm) | 14.6 | 17.4 | 17.1 | 16.8 | 13.4 | 13.4 | 13.8 | ||
| Min (bpm) | 92.5 | 99.4 | 96.3 | 94.0 | 84.5 | 88.9 | 86.9 | ||
| Max (bpm) | 139.7 | 159.0 | 155.8 | 148.5 | 129.2 | 134.0 | 135.4 | ||
References
- World Health Organisation. World Health Assembly resolution WHA60.26, “Workers’ Health: Global Plan of Action”; World Health Organisation: Geneva, Switzerland, 2007. [Google Scholar]
- Flouris, A.D.; Ioannou, L.G.; Dinas, P.C.; Mantzios, K.; Gkiata, P.; Gkikas, G.; Vliora, M.; Amorim, T.; Tsoutsoubi, L.; Kapnia, A.; et al. Assessment of Occupational Heat Strain and Mitigation Strategies in Qatar—Summary of Key Findings; International Labour Organization: Geneva, Switzerland, 2019. [Google Scholar]
- Nybo, L.; Kjellstrom, T.; Bogataj, L.K.; Flouris, A.D. Global heating: Attention is not enough; we need acute and appropriate actions. Temperature 2017, 4, 199–201. [Google Scholar] [CrossRef] [PubMed] [Green Version]
- Perkins, S.; Alexander, L.; Nairn, J. Increasing frequency, intensity and duration of observed global heatwaves and warm spells. Geophys. Res. Lett. 2012, 39. [Google Scholar] [CrossRef]
- Morris, N.B.; Jay, O.; Flouris, A.D.; Casanueva, A.; Gao, C.; Foster, J.; Havenith, G.; Nybo, L. Sustainable solutions to mitigate occupational heat strain—An umbrella review of physiological effects and global health perspectives. Environ. Health 2020, 19, 1–24. [Google Scholar] [CrossRef] [PubMed]
- Flouris, A.D.; Dinas, P.C.; Ioannou, L.G.; Nybo, L.; Havenith, G.; Kenny, G.P.; Kjellstrom, T. Workers’ health and productivity under occupational heat strain: A systematic review and meta-analysis. Lancet Planet. Health 2018, 2, e521–e531. [Google Scholar] [CrossRef] [Green Version]
- Ioannou, L.G.; Tsoutsoubi, L.; Samoutis, G.; Bogataj, L.K.; Kenny, G.P.; Nybo, L.; Kjellstrom, T.; Flouris, A.D. Time-motion analysis as a novel approach for evaluating the impact of environmental heat exposure on labor loss in agriculture workers. Temperature 2017, 4, 330–340. [Google Scholar] [CrossRef]
- International Labour Organization. Working on a Warmer Planet: The Impact of Heat Stress on Labour Productivity and Decent Work; International Labour Organization: Geneva, Switzerland, 2019. [Google Scholar]
- Faul, F.; Erdfelder, E.; Lang, A.G.; Buchner, A. G*Power 3: A flexible statistical power analysis program for the social, behavioral, and biomedical sciences. Behav. Res. Methods 2007, 39, 175–191. [Google Scholar] [CrossRef]
- Masters, G.M. Renewable and Efficient Electric Power Systems; John Wiley & Sons: Hoboken, NJ, USA, 2013. [Google Scholar]
- Liljegren, J.C.; Carhart, R.A.; Lawday, P.; Tschopp, S.; Sharp, R. Modeling the Wet Bulb Globe Temperature Using Standard Meteorological Measurements. J. Occup. Environ. Hyg. 2008, 5, 645–655. [Google Scholar] [CrossRef]
- Ciuha, U.; Pogačar, T.; Bogataj, L.K.; Gliha, M.; Nybo, L.; Flouris, A.D.; Mekjavic, I.B. Interaction between Indoor Occupational Heat Stress and Environmental Temperature Elevations during Heat Waves. Weather Clim. Soc. 2019, 11, 755–762. [Google Scholar] [CrossRef] [Green Version]
- Vandentorren, S.; Suzan, F.; Medina, S.; Pascal, M.; Maulpoix, A.; Cohen, J.-C.; Ledrans, M. Mortality in 13 French cities during the August 2003 heat wave. Am. J. Public Health 2004, 94, 1518–1520. [Google Scholar] [CrossRef]
- Ramanathan, N.L. A New Weighting System for Mean Surface Temperature of the Human Body. J Appl. Physiol. 1964, 19, 531–533. [Google Scholar] [CrossRef] [Green Version]
- Schweiker, M.; Fuchs, X.; Becker, S.; Shukuya, M.; Dovjak, M.; Hawighorst, M.; Kolarik, J. Challenging the assumptions for thermal sensation scales. Build. Res. Inf. 2017, 45, 572–589. [Google Scholar] [CrossRef] [Green Version]
- American College of Sports, M.; Sawka, M.N.; Burke, L.M.; Eichner, E.R.; Maughan, R.J.; Montain, S.J.; Stachenfeld, N.S. American College of Sports Medicine position stand. Exercise and fluid replacement. Med. Sci. Sports Exerc. 2007, 39, 377–390. [Google Scholar]
- Jette, M.; Sidney, K.; Blümchen, G. Metabolic equivalents (METS) in exercise testing, exercise prescription, and evaluation of functional capacity. Clin. Cardiol. 1990, 13, 555–565. [Google Scholar] [CrossRef] [PubMed]
- Ainsworth, B.E.; Haskell, W.L.; Whitt, M.C.; Irwin, M.L.; Swartz, A.M.; Strath, S.J.; O Brien, W.L.; Bassett, D.R.; Schmitz, K.H.; Emplaincourt, P.O. Compendium of physical activities: An update of activity codes and MET intensities. Med. Sci. Sports Exerc. 2000, 32, S498–S504. [Google Scholar] [CrossRef] [PubMed] [Green Version]
- Schweitzer, P.K.; Muehlbach, M.J.; Walsh, J.K. Countermeasures for night work performance deficits: The effect of napping or caffeine on continuous performance at night. Work Stress 1992, 6, 355–365. [Google Scholar] [CrossRef]
- Ioannou, L.G.; Tsoutsoubi, L.; Mantzios, K.; Flouris, A.D. A free software to predict heat strain according to the ISO 7933:2018. Ind. Health 2019, 57, 711–720. [Google Scholar] [CrossRef] [PubMed] [Green Version]
- American Conference of Governmental Industrial Hygienists. TLVs and BEIs—Based on the Documentation of the Threshold Limit Values for Chemical Substances and Physical Agents & Biological Exposure Indices; ACGIH: Cincinnati, OH, USA, 2012. [Google Scholar]
- ISO. Ergonomics of the Thermal Environment—Analytical Determination and Interpretation of Heat Stress Using Calculation of the Predicted Heat Strain; ISO 7933; ISO: Geneve, Switzerland, 2004. [Google Scholar]
- Orlov, A.; Sillmann, J.; Aaheim, A.; Aunan, K.; de Bruin, K. Economic Losses of Heat-Induced Reductions in Outdoor Worker Productivity: A Case Study of Europe. Econ. Disasters Clim. Chang. 2019, 3, 191–211. [Google Scholar] [CrossRef]
- Hancock, P.A.; Vasmatzidis, I. Effects of heat stress on cognitive performance: The current state of knowledge. Int. J. Hyperth. 2003, 19, 355–372. [Google Scholar] [CrossRef]
- Gaoua, N.; Racinais, S.; Grantham, J.; El Massioui, F. Alterations in cognitive performance during passive hyperthermia are task dependent. Int. J. Hyperth. 2011, 27, 1–9. [Google Scholar] [CrossRef]
- Sawka, M.N.; Montain, S.J.; Latzka, W.A. Hydration effects on thermoregulation and performance in the heat. Comp. Biochem. Physiol. Part A Mol. Integr. Physiol. 2001, 128, 679–690. [Google Scholar] [CrossRef]
- Robert, A.O.; Scott, A.M.; LeRoy, A.P.; Carl, V.G. Accuracy of Urine Specific Gravity and Osmolality as Indicators of Hydration Status. Int. J. Sport Nutr. Exerc. Metab. 2005, 15, 236–251. [Google Scholar]
- Piil, J.F.; Lundbye-Jensen, J.; Christiansen, L.; Ioannou, L.; Tsoutsoubi, L.; Dallas, C.N.; Mantzios, K.; Flouris, A.D.; Nybo, L. High prevalence of hypohydration in occupations with heat stress—Perspectives for performance in combined cognitive and motor tasks. PLoS ONE 2018, 13, e0205321. [Google Scholar] [CrossRef] [Green Version]
- Masento, N.A.; Golightly, M.; Field, D.T.; Butler, L.T.; van Reekum, C.M. Effects of hydration status on cognitive performance and mood. Br. J. Nutr. 2014, 111, 1841–1852. [Google Scholar] [CrossRef]
- Lipczynska, A.; Schiavon, S.; Graham, L.T. Thermal comfort and self-reported productivity in an office with ceiling fans in the tropics. Build. Environ. 2018, 135, 202–212. [Google Scholar] [CrossRef] [Green Version]
- Romanovsky, A.A. Skin temperature: Its role in thermoregulation. Acta Physiol. 2014, 210, 498–507. [Google Scholar] [CrossRef]
- Schlader, Z.J.; Stannard, S.R.; Mündel, T. Exercise and heat stress: Performance, fatigue and exhaustion—A hot topic. Br. J. Sports Med. 2011, 45, 3–5. [Google Scholar] [CrossRef] [PubMed]
- Périard, J.; Racinais, S.; Sawka, M.N. Adaptations and mechanisms of human heat acclimation: Applications for competitive athletes and sports. Scand. J. Med. Sci. Sports 2015, 25, 20–38. [Google Scholar] [CrossRef]
- Sotiridis, A.; Debevec, T.; McDonnell, A.C.; Ciuha, U.; Eiken, O.; Mekjavic, I.B. Exercise cardiorespiratory and thermoregulatory responses in normoxic, hypoxic, and hot environment following 10-day continuous hypoxic exposure. J. Appl. Physiol. 2018, 125, 1284–1295. [Google Scholar] [CrossRef] [PubMed]
- Ioannou, L.G.; Tsoutsoubi, L.; Nybo, L.; Tsianos, G.I.; Flouris, A.D. Habitual heat exposure and acclimatization associated with athletic performance in the multistage marathon des sables. J. Hum. Perform. Extrem. Environ. 2018, 14, 9. [Google Scholar] [CrossRef] [Green Version]
- Radakovic, S.S.; Maric, J.; Surbatovic, M.; Radjen, S.; Stefanova, E.; Stankovic, N.; Filipovic, N. Effects of Acclimation on Cognitive Performance in Soldiers during Exertional Heat Stress. Mil. Med. 2007, 172, 133–136. [Google Scholar] [CrossRef] [Green Version]
- Fox, R.H.; Goldsmith, R.; Kidd, D.J.; Lewis, H.E. Acclimatization to heat in man by controlled elevation of body temperature. J. Physiol. 1963, 166, 530–547. [Google Scholar] [CrossRef]
- Corbett, J.; Neal, R.A.; Lunt, H.C.; Tipton, M.J. Adaptation to Heat and Exercise Performance Under Cooler Conditions: A New Hot Topic. Sports Med. 2014, 44, 1323–1331. [Google Scholar] [CrossRef] [PubMed] [Green Version]
- Piil, J.F.; Christiansen, L.; Morris, N.B.; Mikkelsen, C.J.; Ioannou, L.G.; Flouris, A.D.; Lundbye-Jensen, J.; Nybo, L. Direct exposure of the head to solar heat radiation impairs motor-cognitive performance. Sci. Rep. 2020, 10, 7812. [Google Scholar] [CrossRef] [PubMed]
- Flouris, A.D.; McGinn, R.; Poirier, M.P.; Louie, J.C.; Ioannou, L.G.; Tsoutsoubi, L.; Sigal, R.J.; Boulay, P.; Hardcastle, S.G.; Kenny, G.P. Screening criteria for increased susceptibility to heat stress during work or leisure in hot environments in healthy individuals aged 31–70 years. Temperature 2018, 5, 86–99. [Google Scholar] [CrossRef] [PubMed] [Green Version]
- Morris, N.B.; Levi, M.; Morabito, M.; Messeri, A.; Ioannou, L.G.; Flouris, A.D.; Samoutis, G.; Pogačar, T.; Bogataj, L.K.; Piil, J.F.; et al. Health vs. wealth: Employer, employee and policy-maker perspectives on occupational heat stress across multiple European industries. Temperature 2020, 1–18. [Google Scholar] [CrossRef]
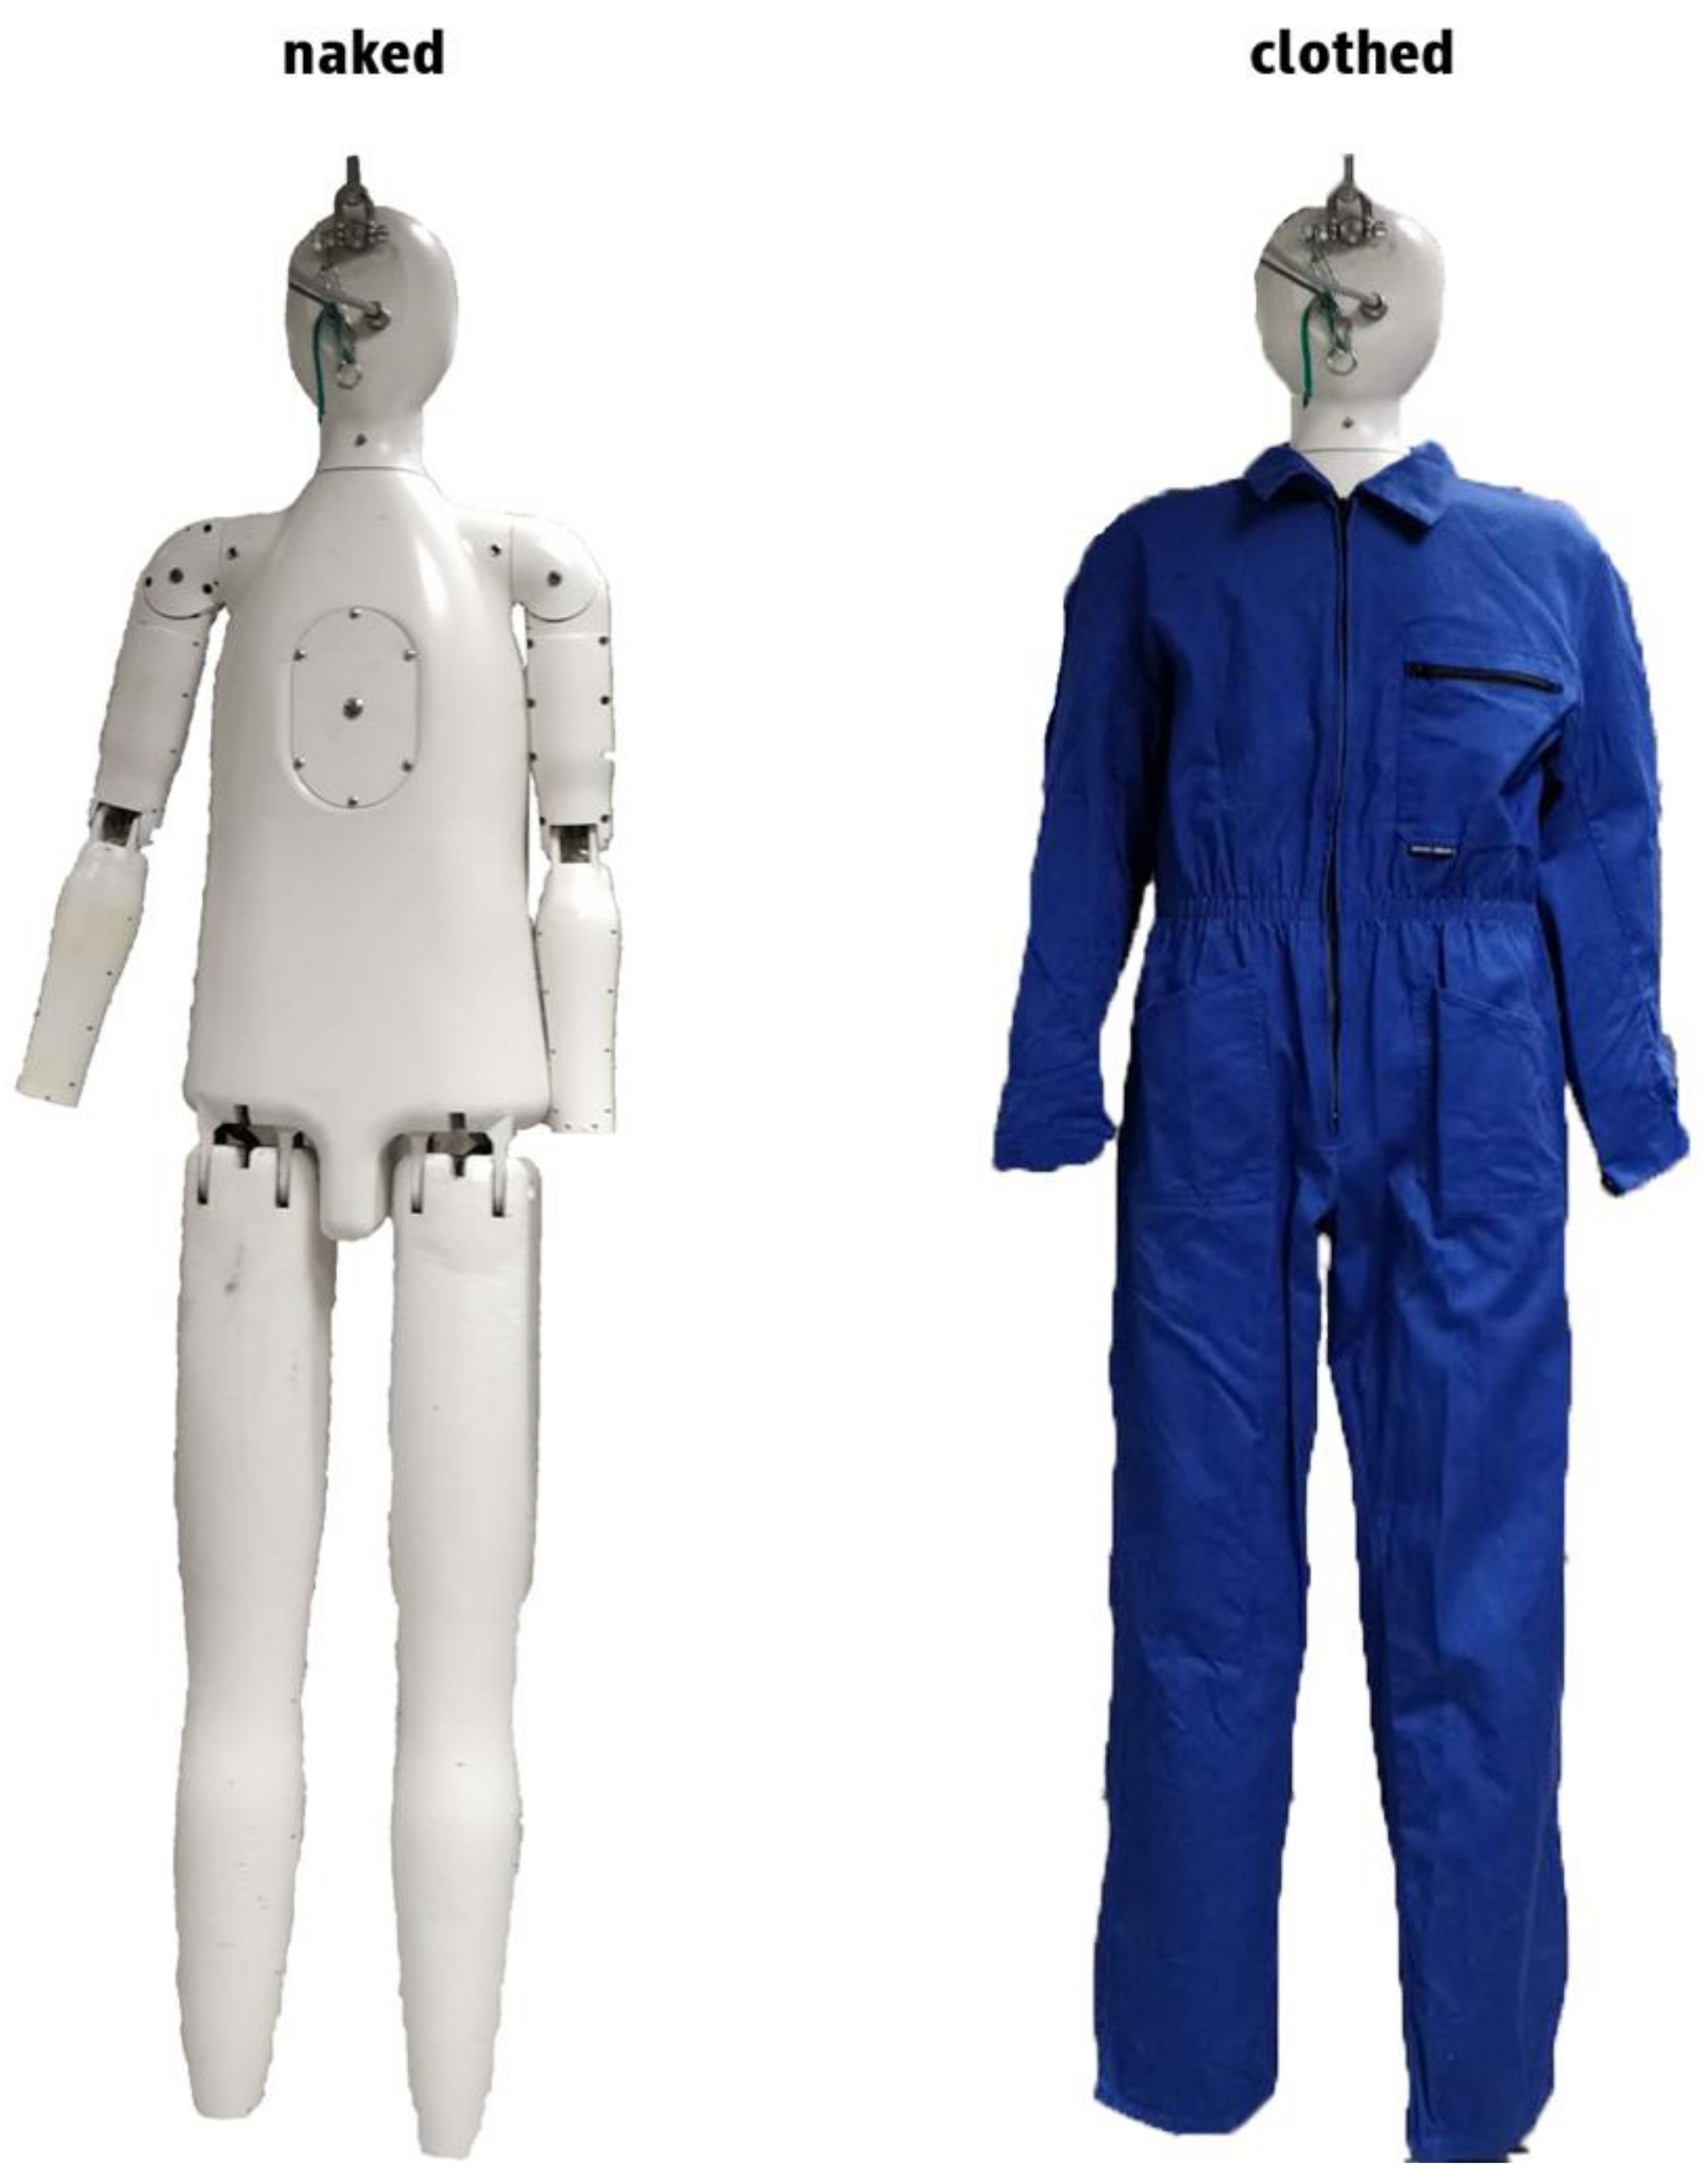
- International Organization for Standardization. Clothing—Physiological Effects—Measurement of Thermal Insulation by Means of a Thermal Manikin; ISO 15831: 2004; ISO: Geneva, Switzerland, 2004. [Google Scholar]


Publisher’s Note: MDPI stays neutral with regard to jurisdictional claims in published maps and institutional affiliations. |
© 2021 by the authors. Licensee MDPI, Basel, Switzerland. This article is an open access article distributed under the terms and conditions of the Creative Commons Attribution (CC BY) license (http://creativecommons.org/licenses/by/4.0/).
Share and Cite
Ioannou, L.G.; Mantzios, K.; Tsoutsoubi, L.; Panagiotaki, Z.; Kapnia, A.K.; Ciuha, U.; Nybo, L.; Flouris, A.D.; Mekjavic, I.B. Effect of a Simulated Heat Wave on Physiological Strain and Labour Productivity. Int. J. Environ. Res. Public Health 2021, 18, 3011. https://0-doi-org.brum.beds.ac.uk/10.3390/ijerph18063011
Ioannou LG, Mantzios K, Tsoutsoubi L, Panagiotaki Z, Kapnia AK, Ciuha U, Nybo L, Flouris AD, Mekjavic IB. Effect of a Simulated Heat Wave on Physiological Strain and Labour Productivity. International Journal of Environmental Research and Public Health. 2021; 18(6):3011. https://0-doi-org.brum.beds.ac.uk/10.3390/ijerph18063011
Chicago/Turabian StyleIoannou, Leonidas G., Konstantinos Mantzios, Lydia Tsoutsoubi, Zoe Panagiotaki, Areti K. Kapnia, Ursa Ciuha, Lars Nybo, Andreas D. Flouris, and Igor B. Mekjavic. 2021. "Effect of a Simulated Heat Wave on Physiological Strain and Labour Productivity" International Journal of Environmental Research and Public Health 18, no. 6: 3011. https://0-doi-org.brum.beds.ac.uk/10.3390/ijerph18063011