
Revisiting the Concept of Quietness in the Urban Environment—Towards Ecosystems’ Health and Human Well-Being

 ,
,  ,
, 
Abstract
:1. Introduction
2. Scientific Background: Revisiting Quietness
2.1. Factors of Quietness
2.2. The Fuzziness of Quietness
2.3. Combining the Practical and the Pleasurable Benefits of Quietness
2.4. The Equity in Quietness
3. Materials and Methods
3.1. The Composite Urban Quietness Index
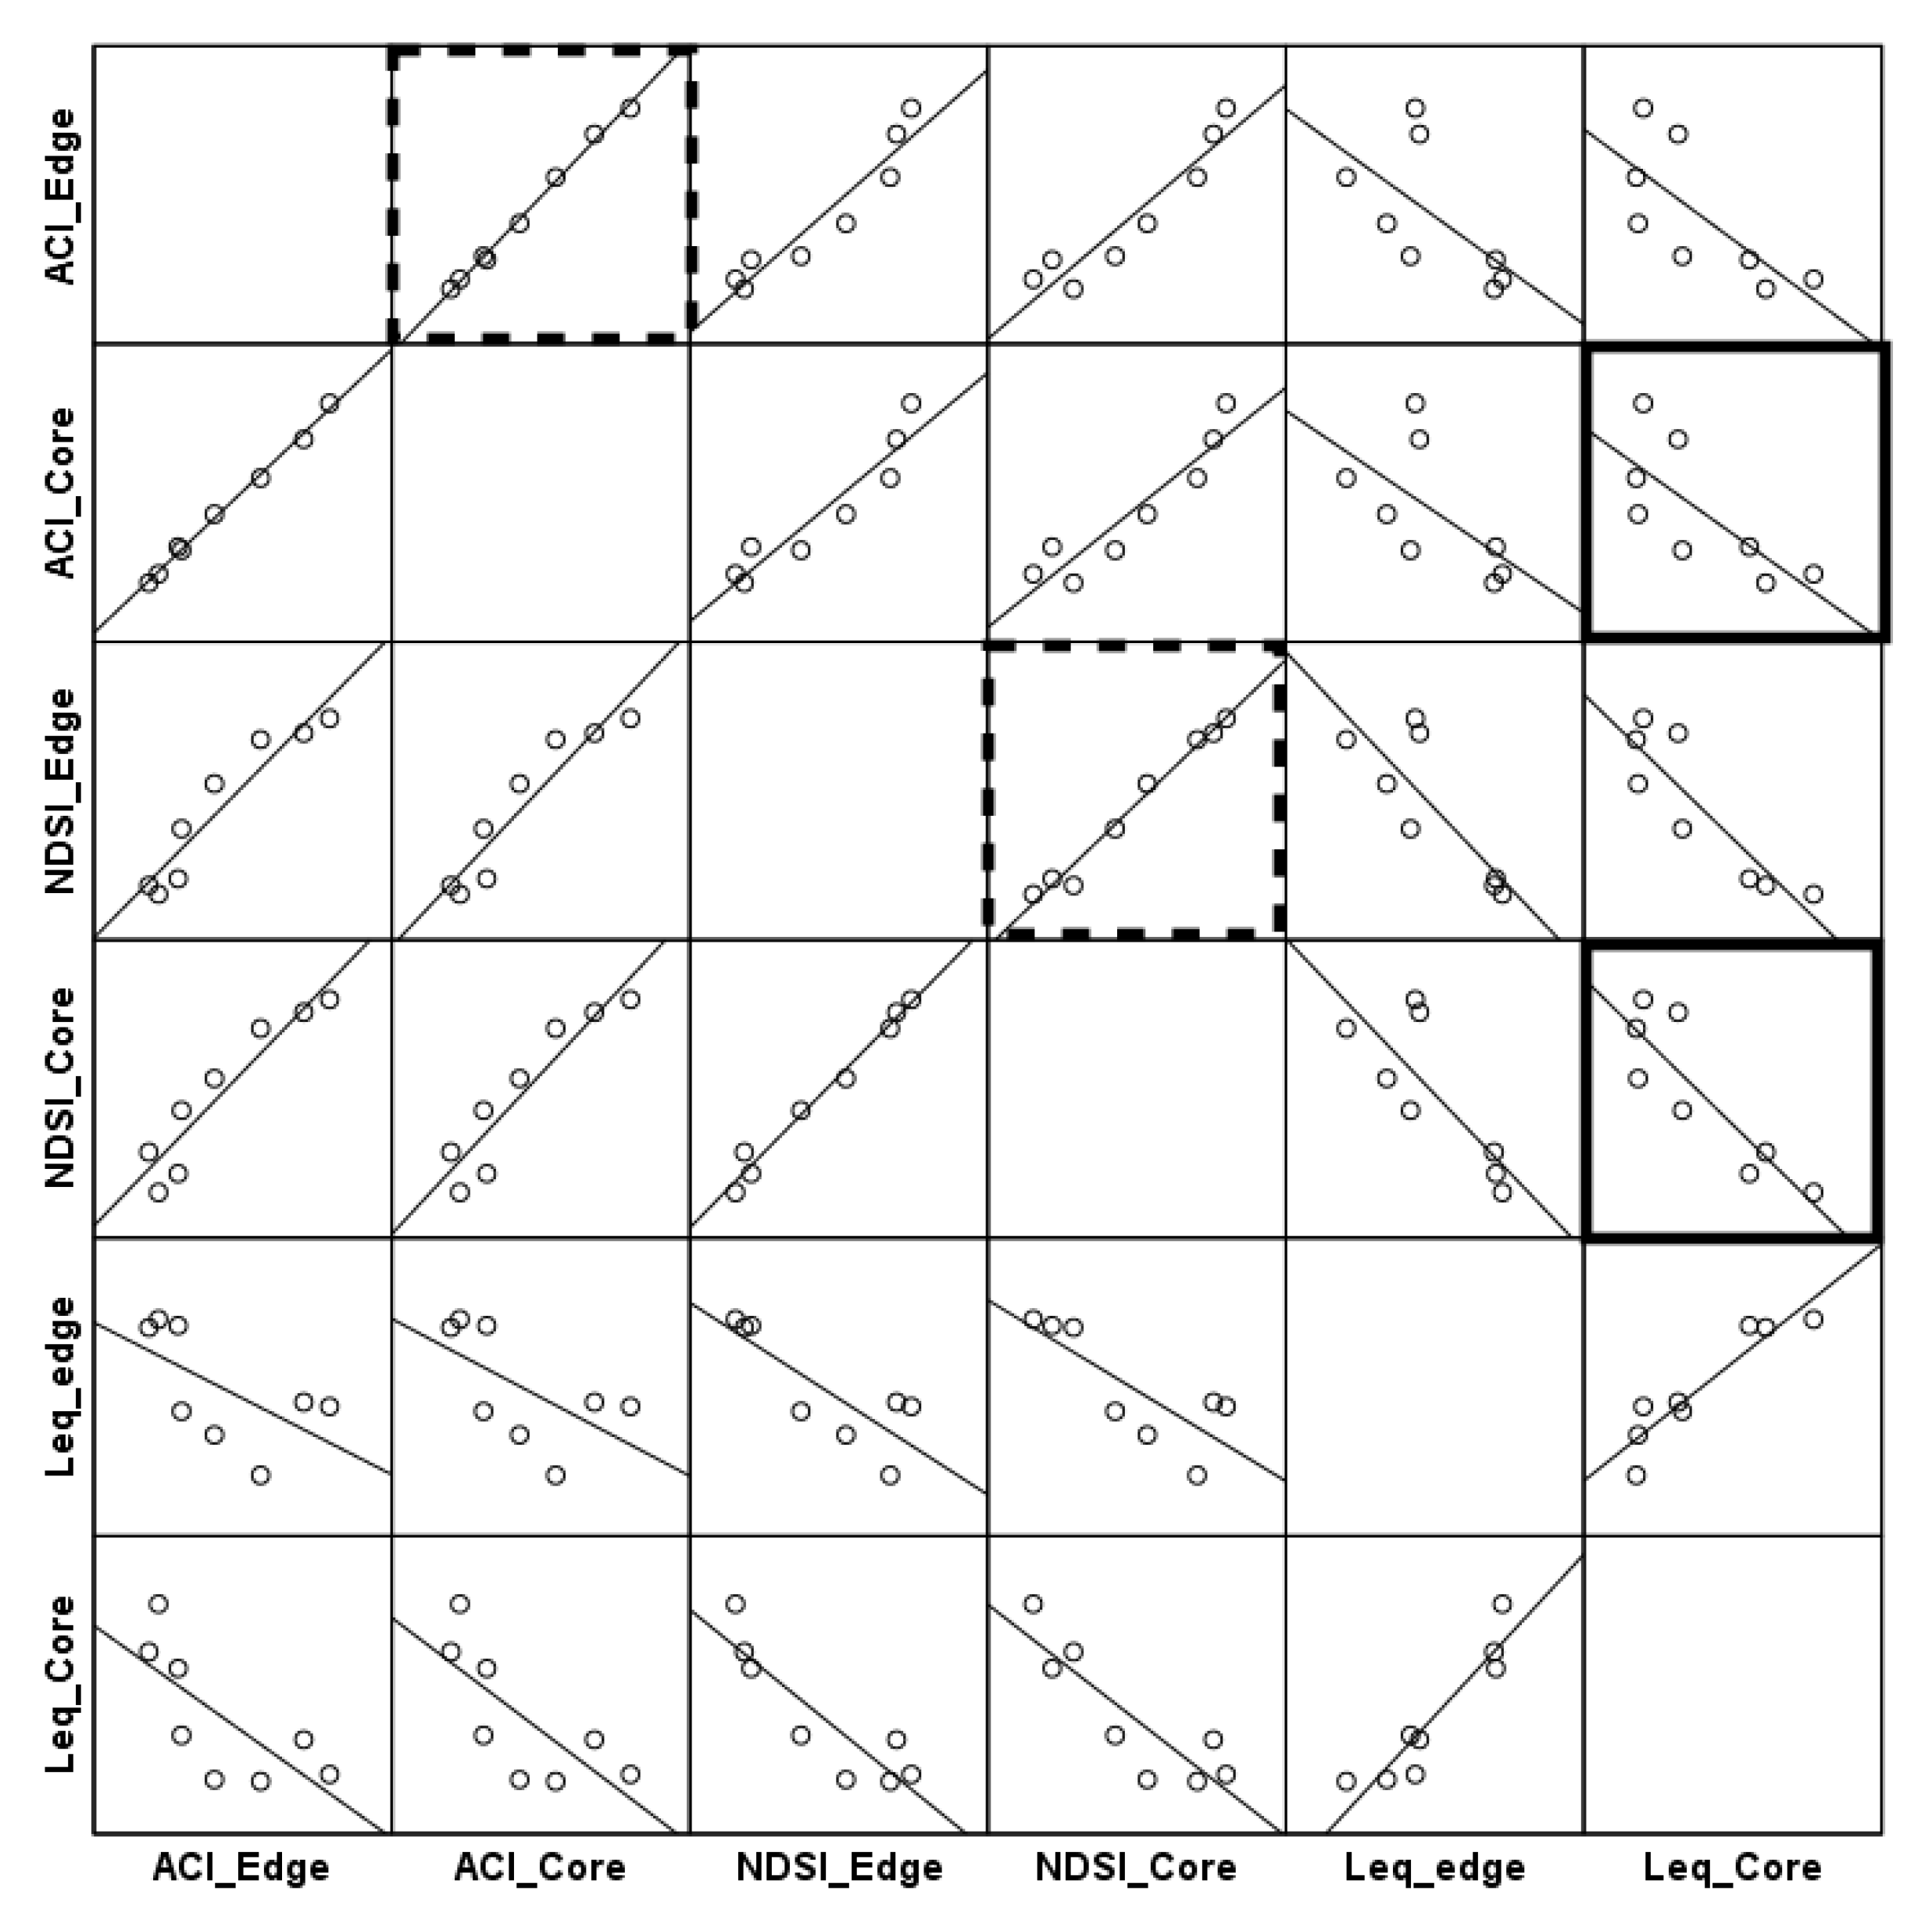
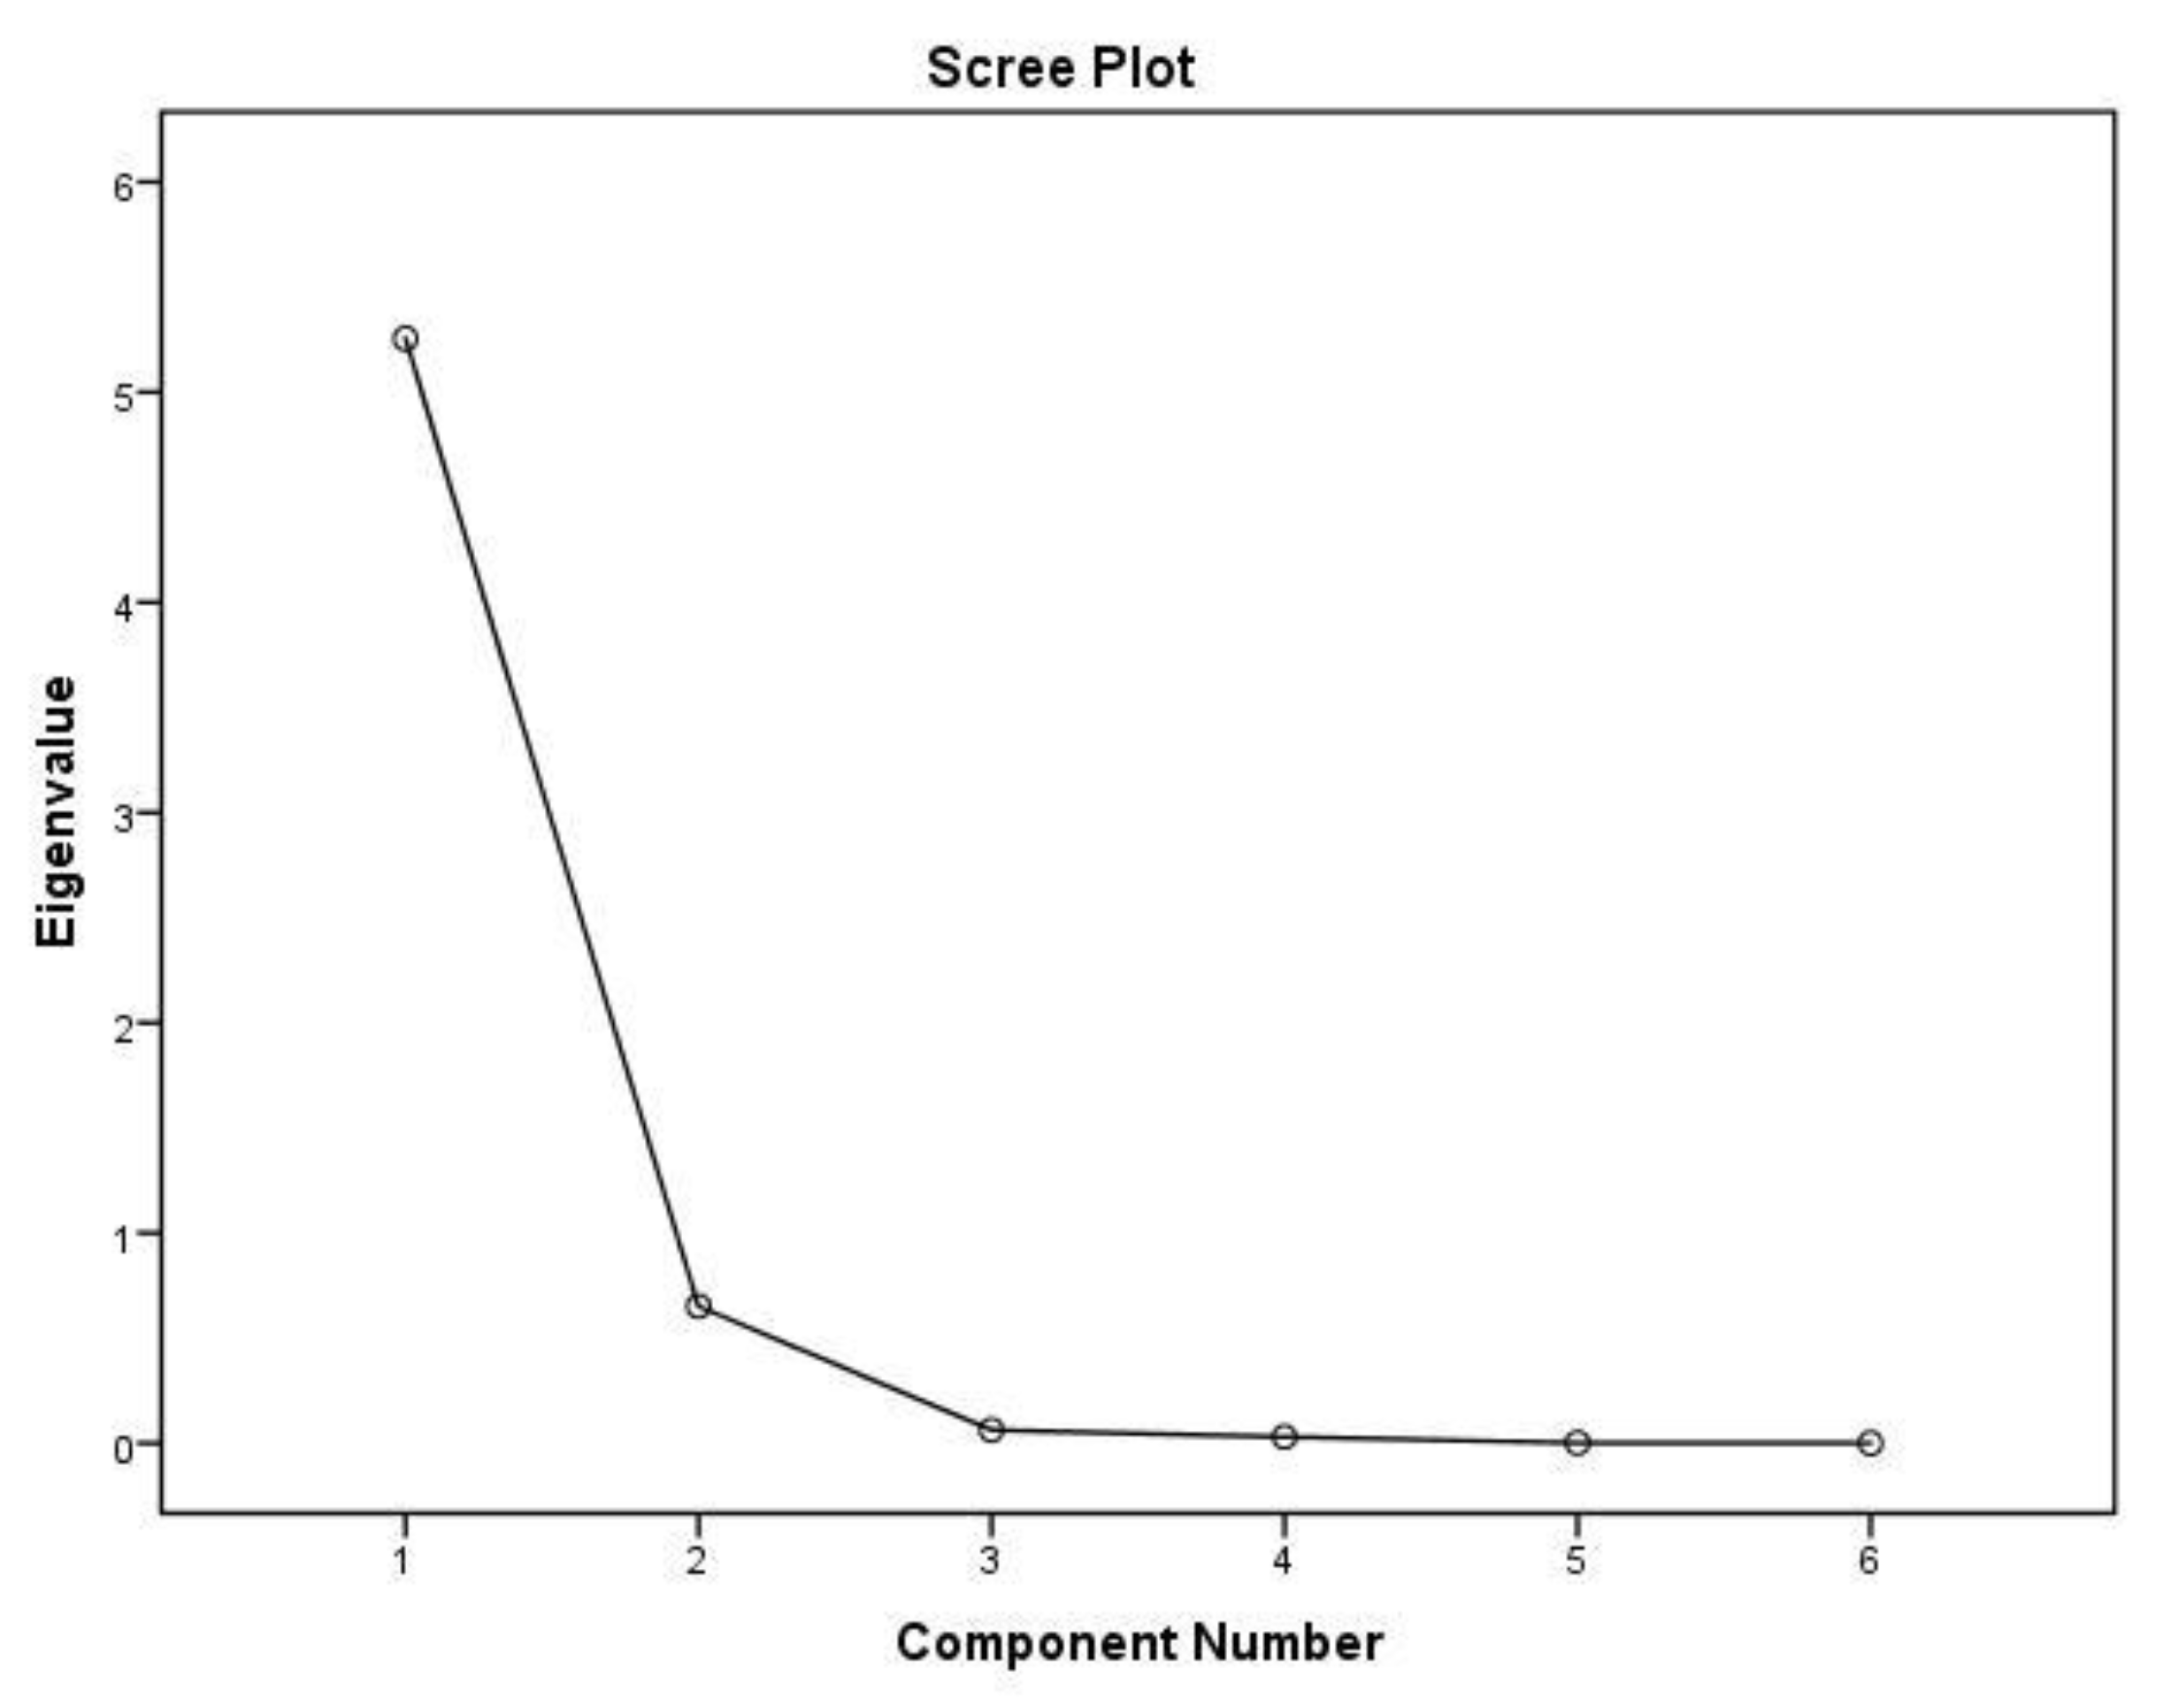
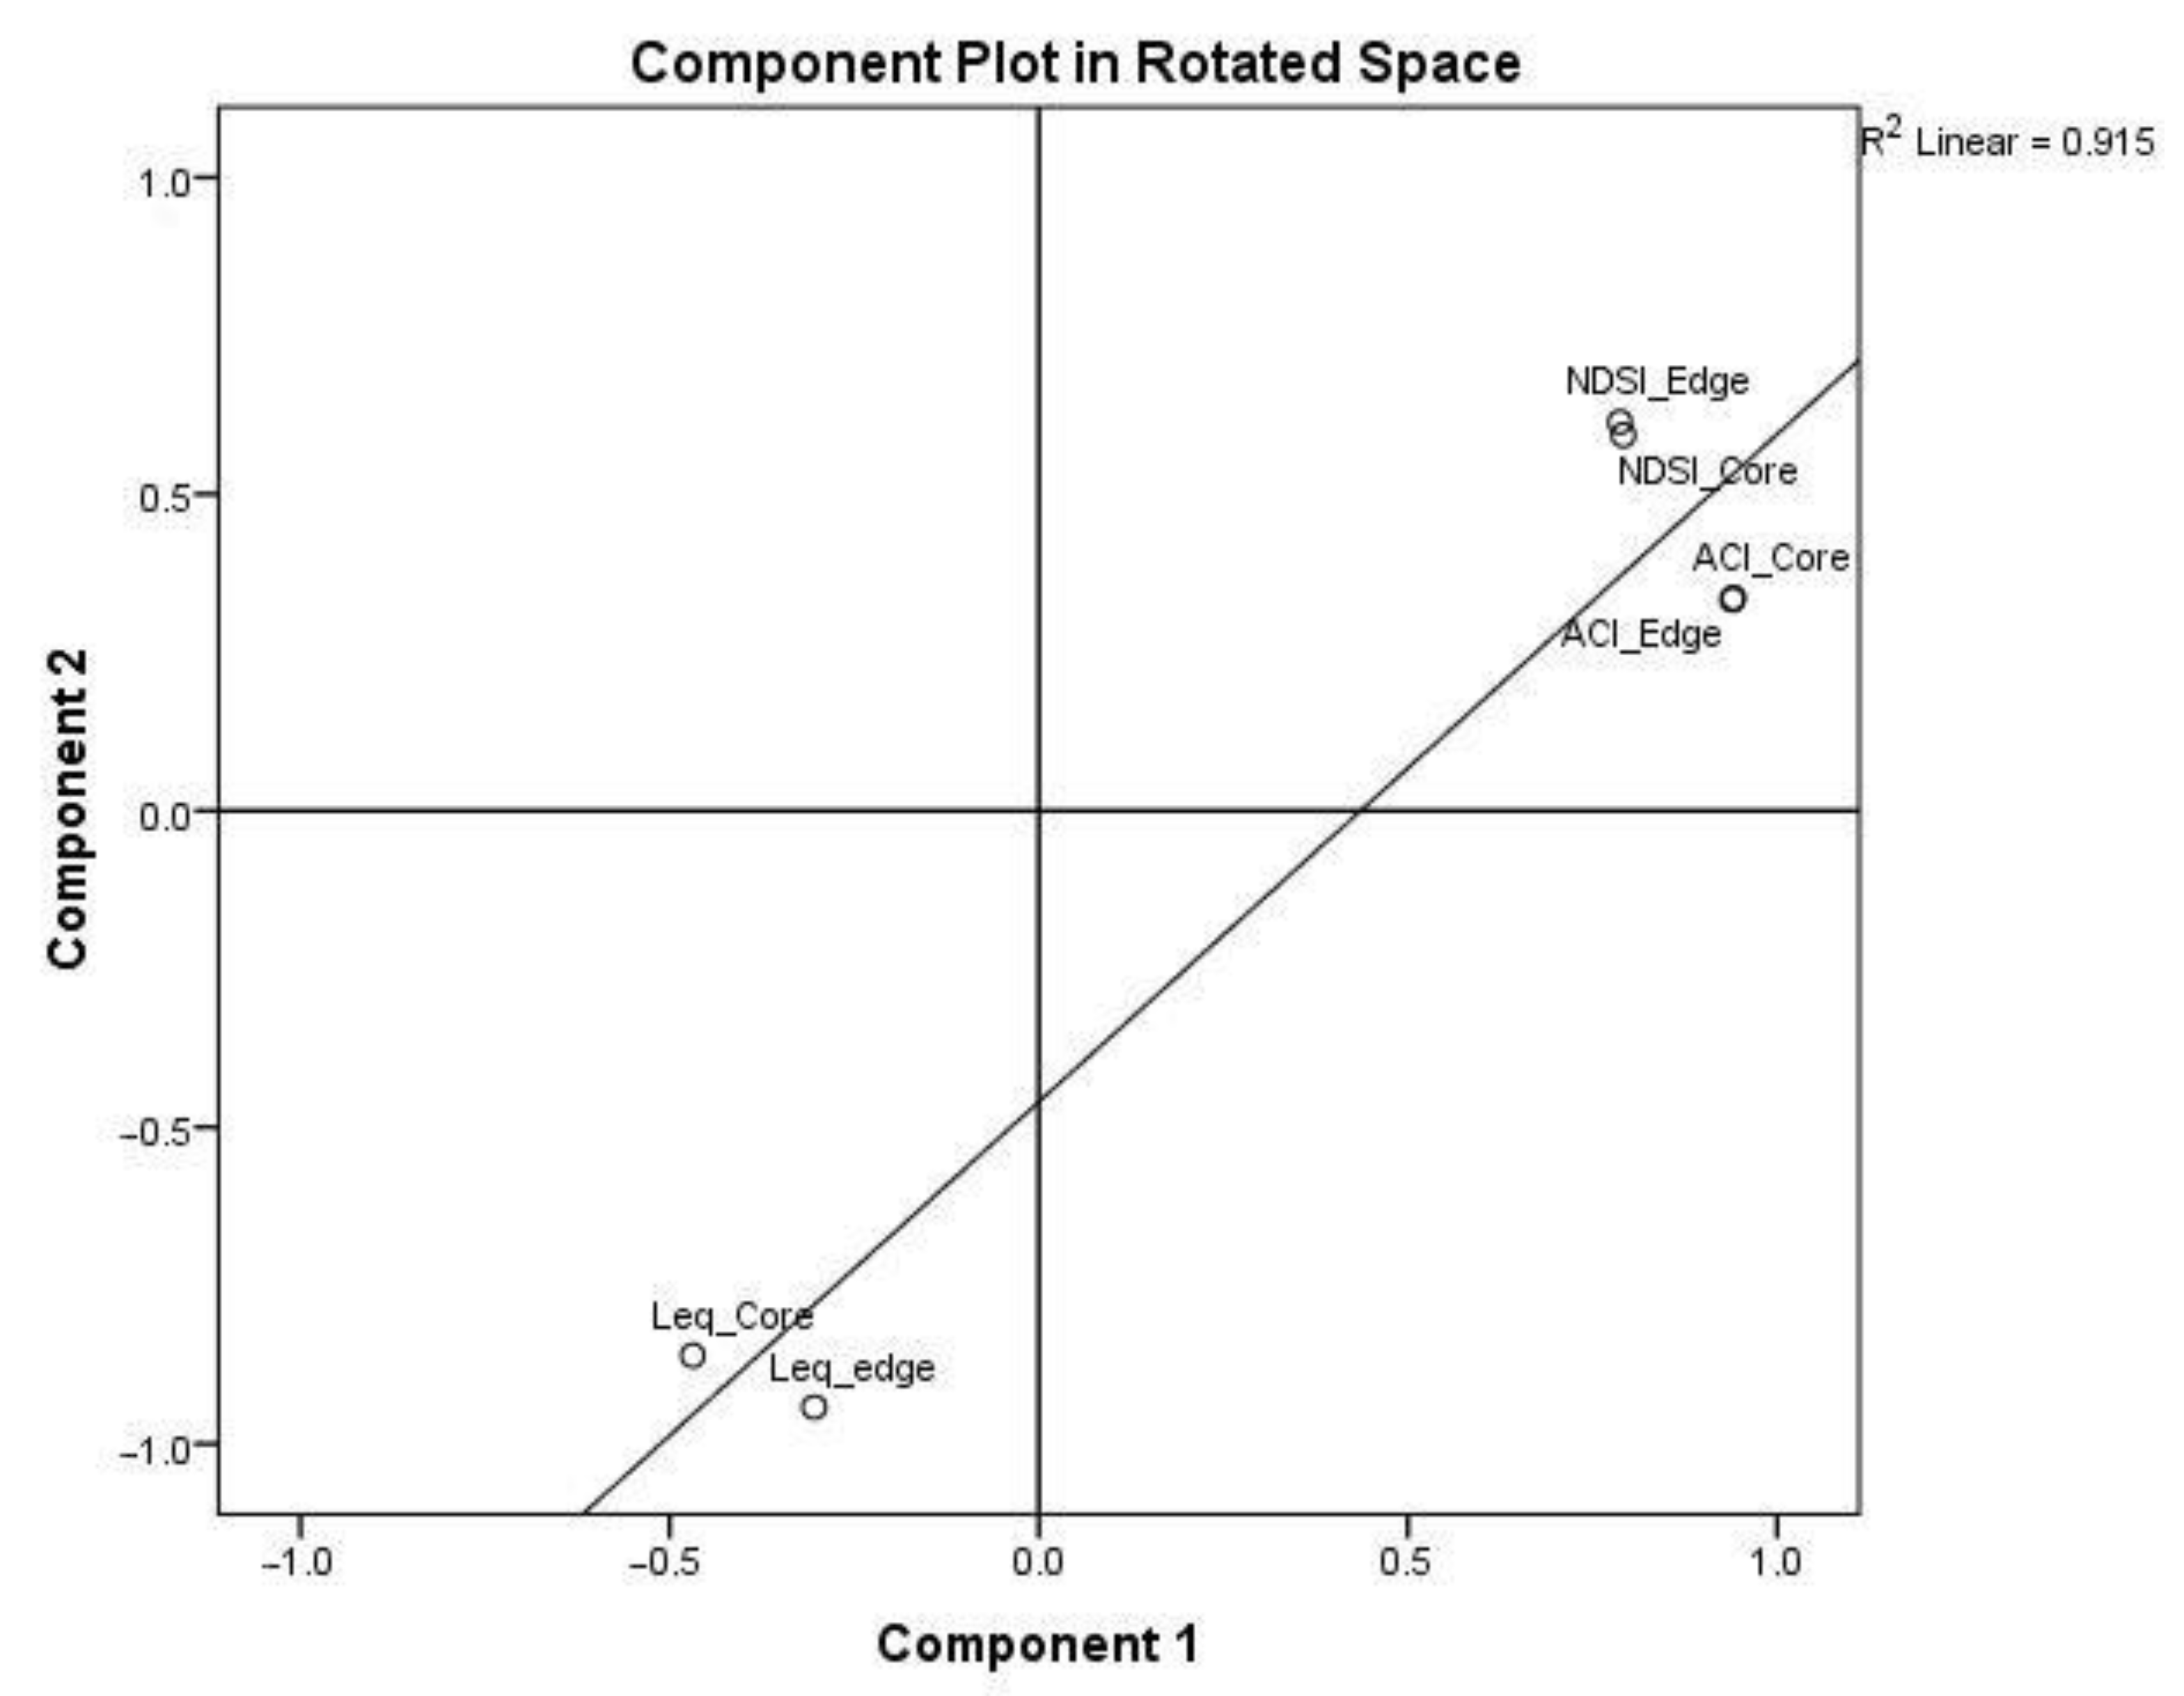
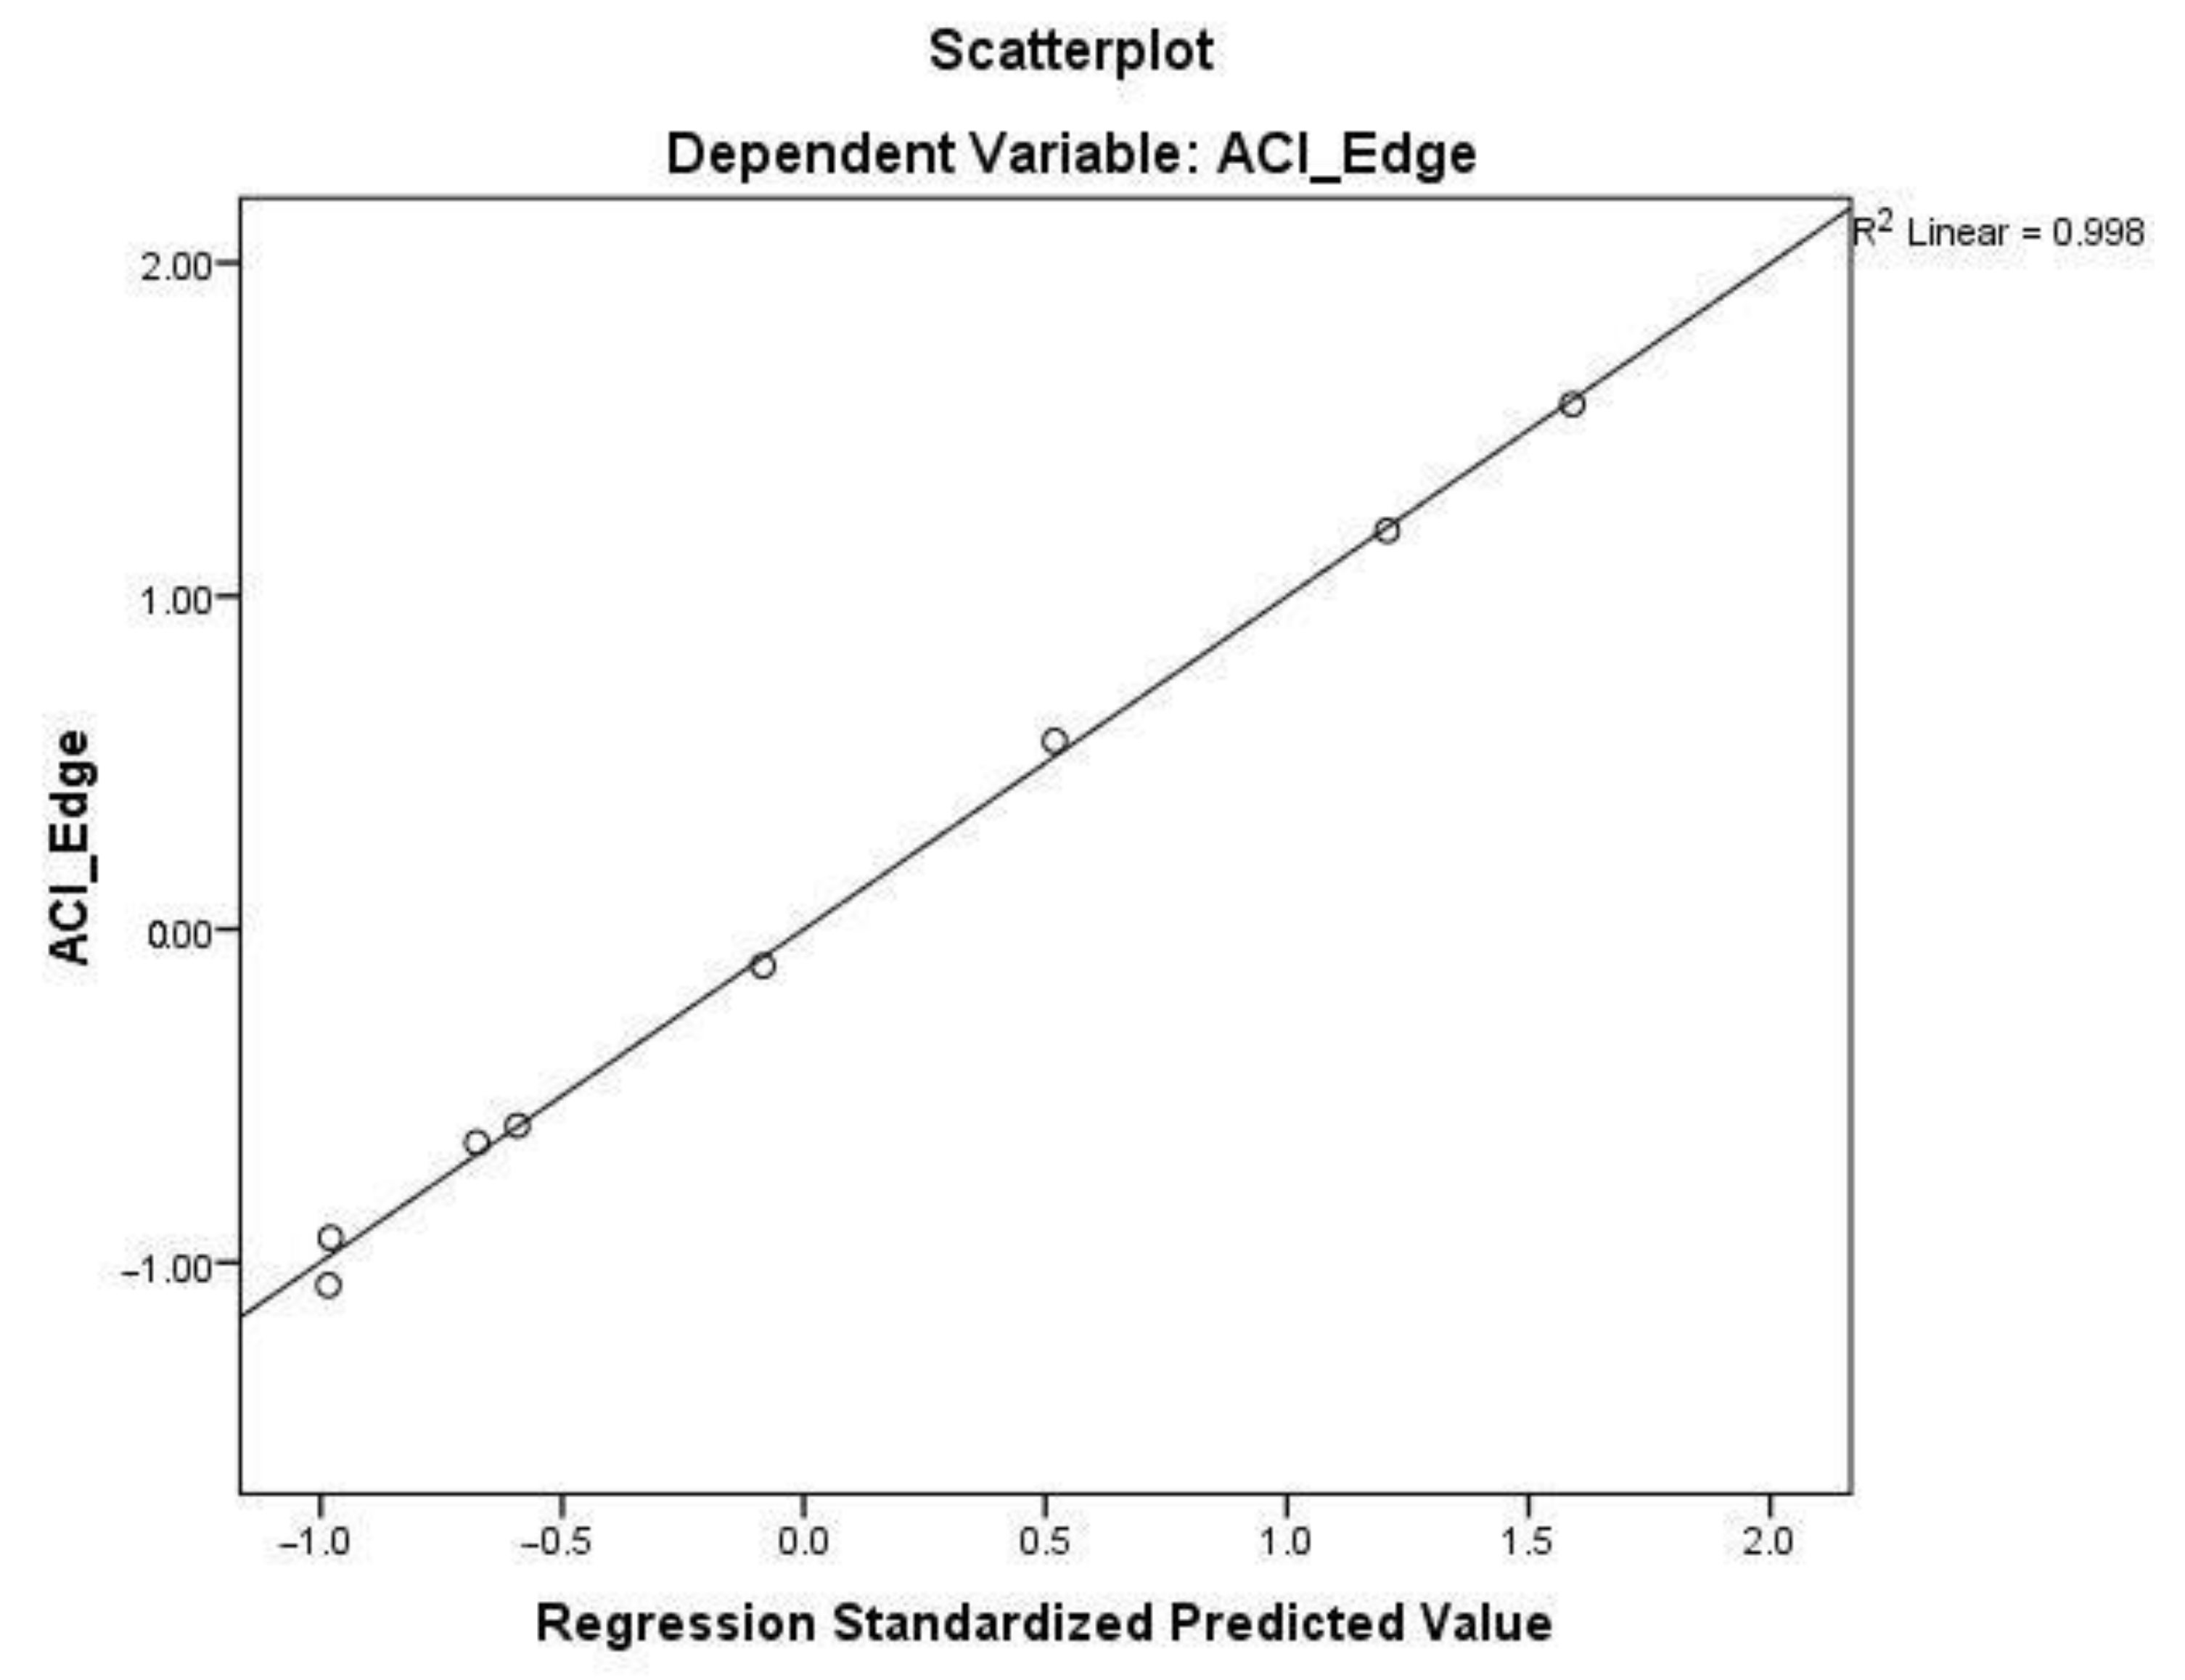
3.2. Principal Component Analysis of Acoustic Environment Factors
3.3. CUQI Rationale and the Definition of Quietness
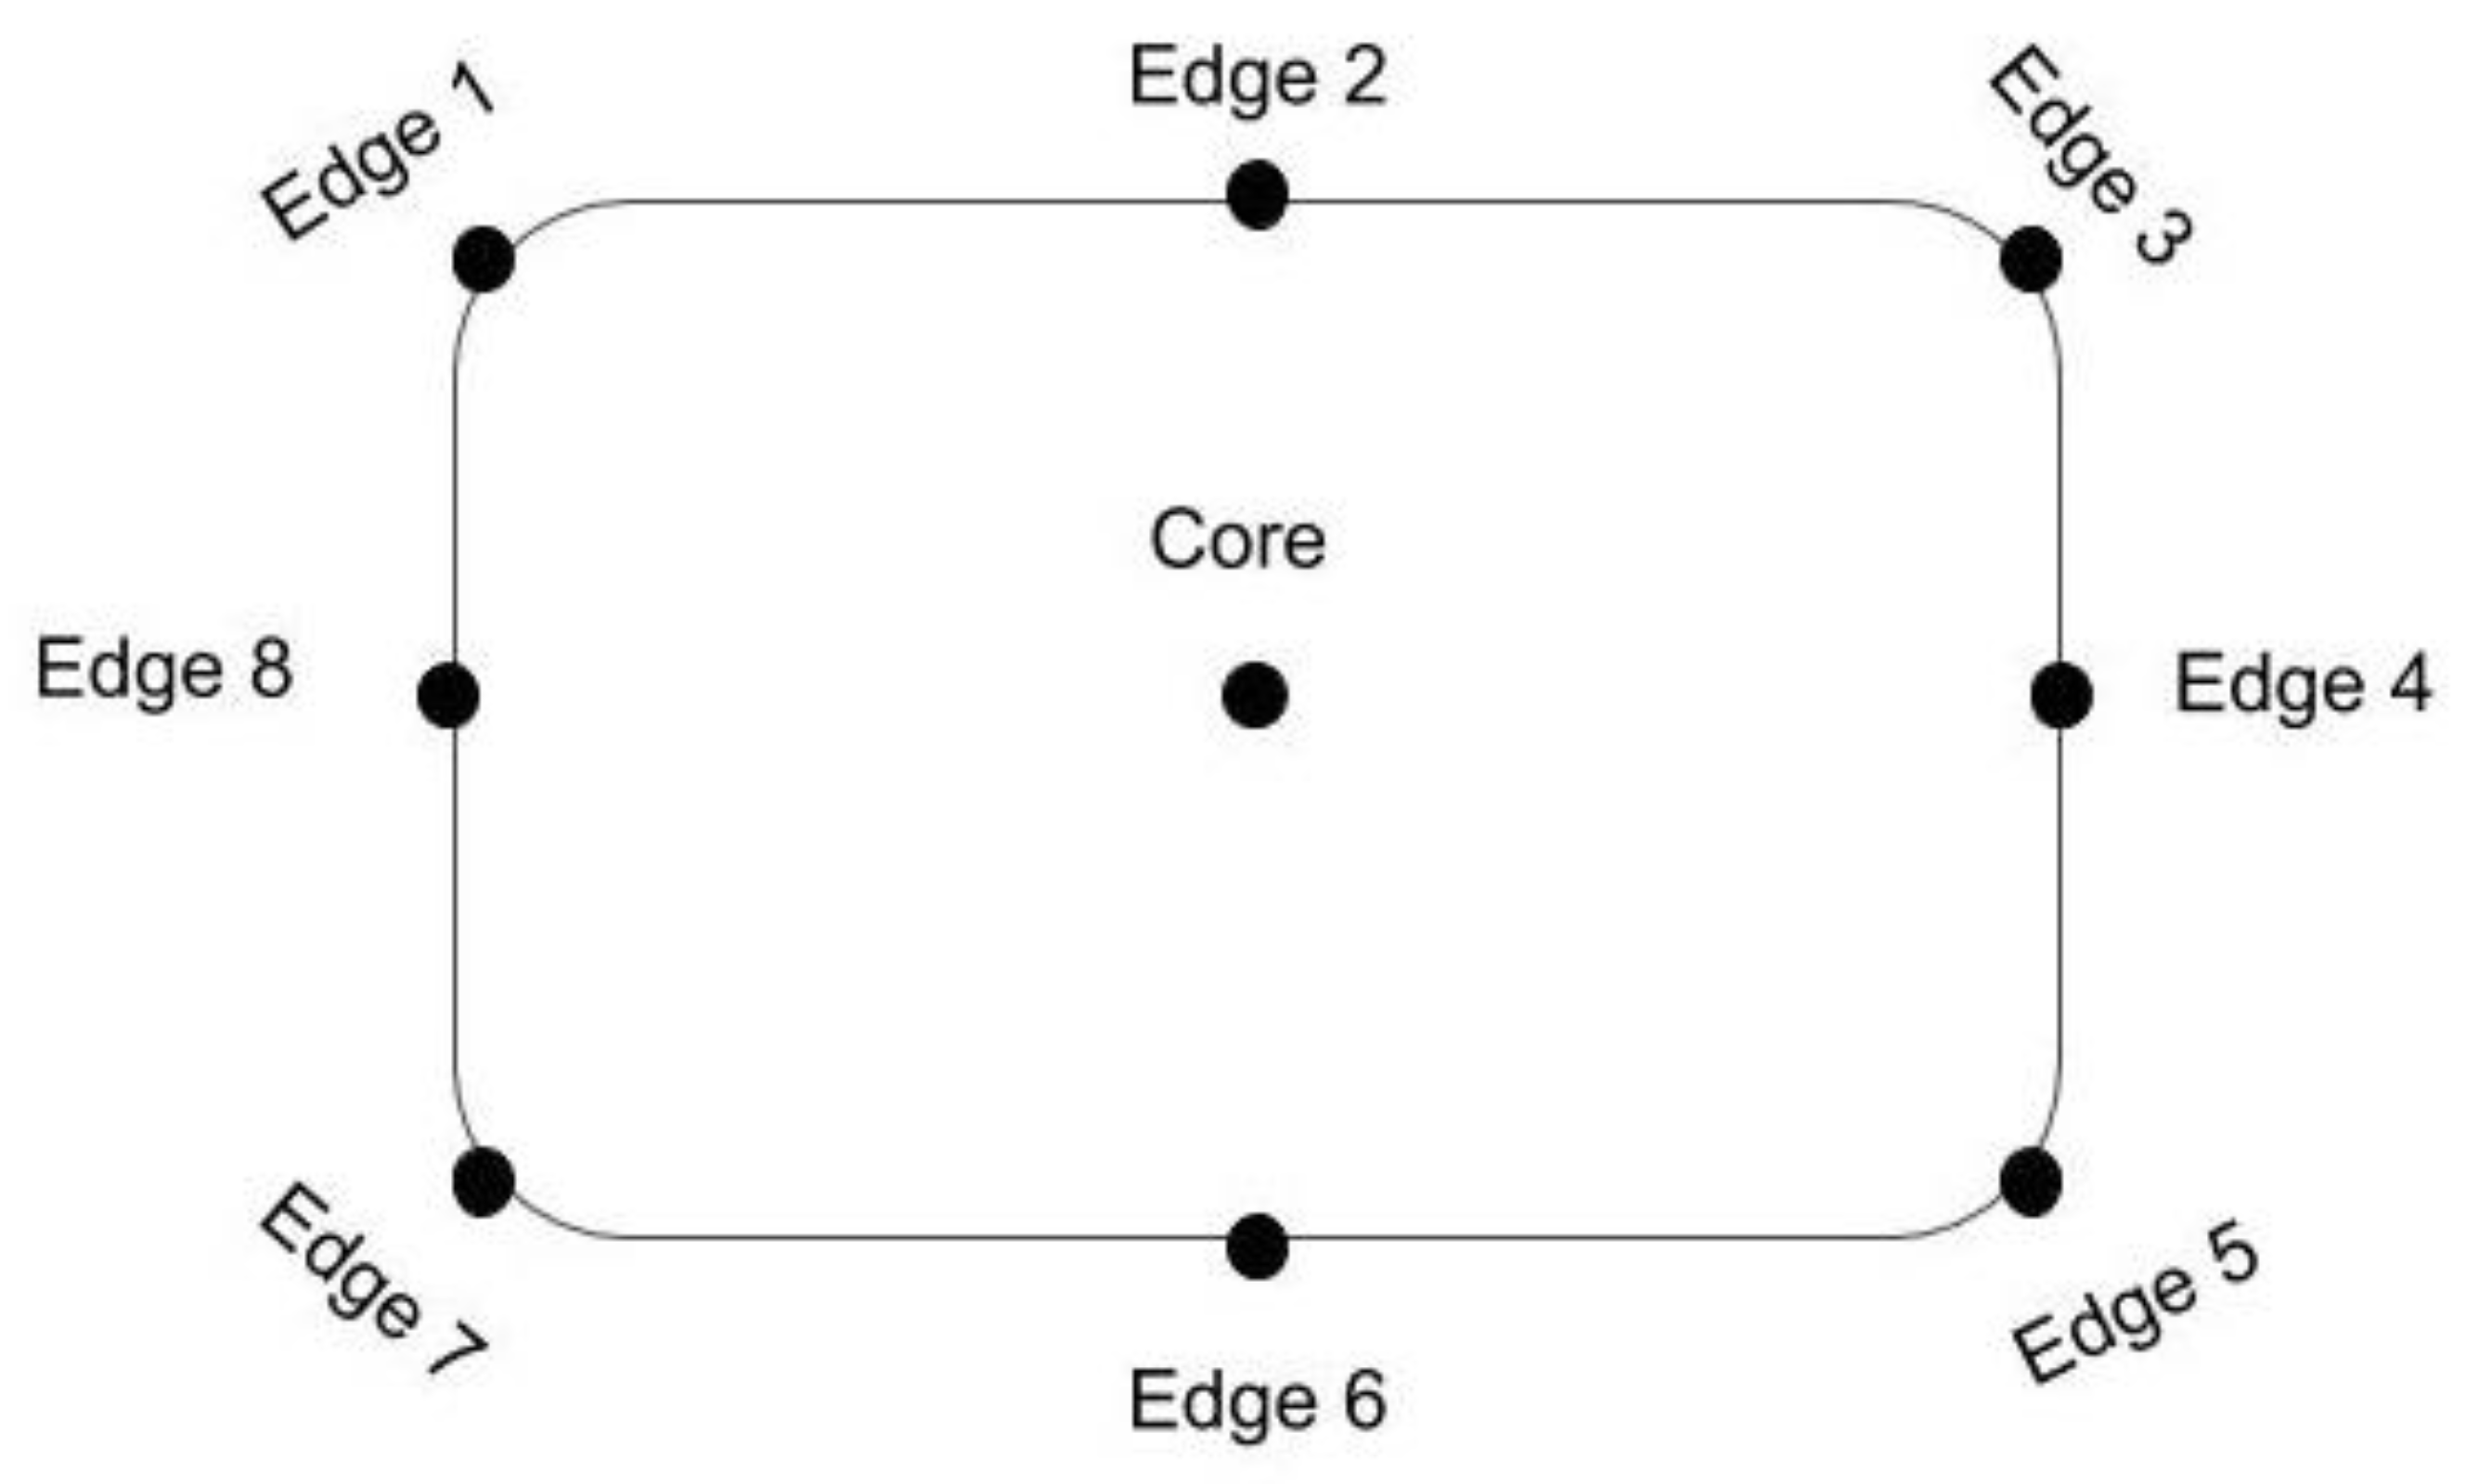
3.4. CUQI Data Collection Protocol
3.5. Testing the CUQI in Mytilene (Lesbos Island–Greece)
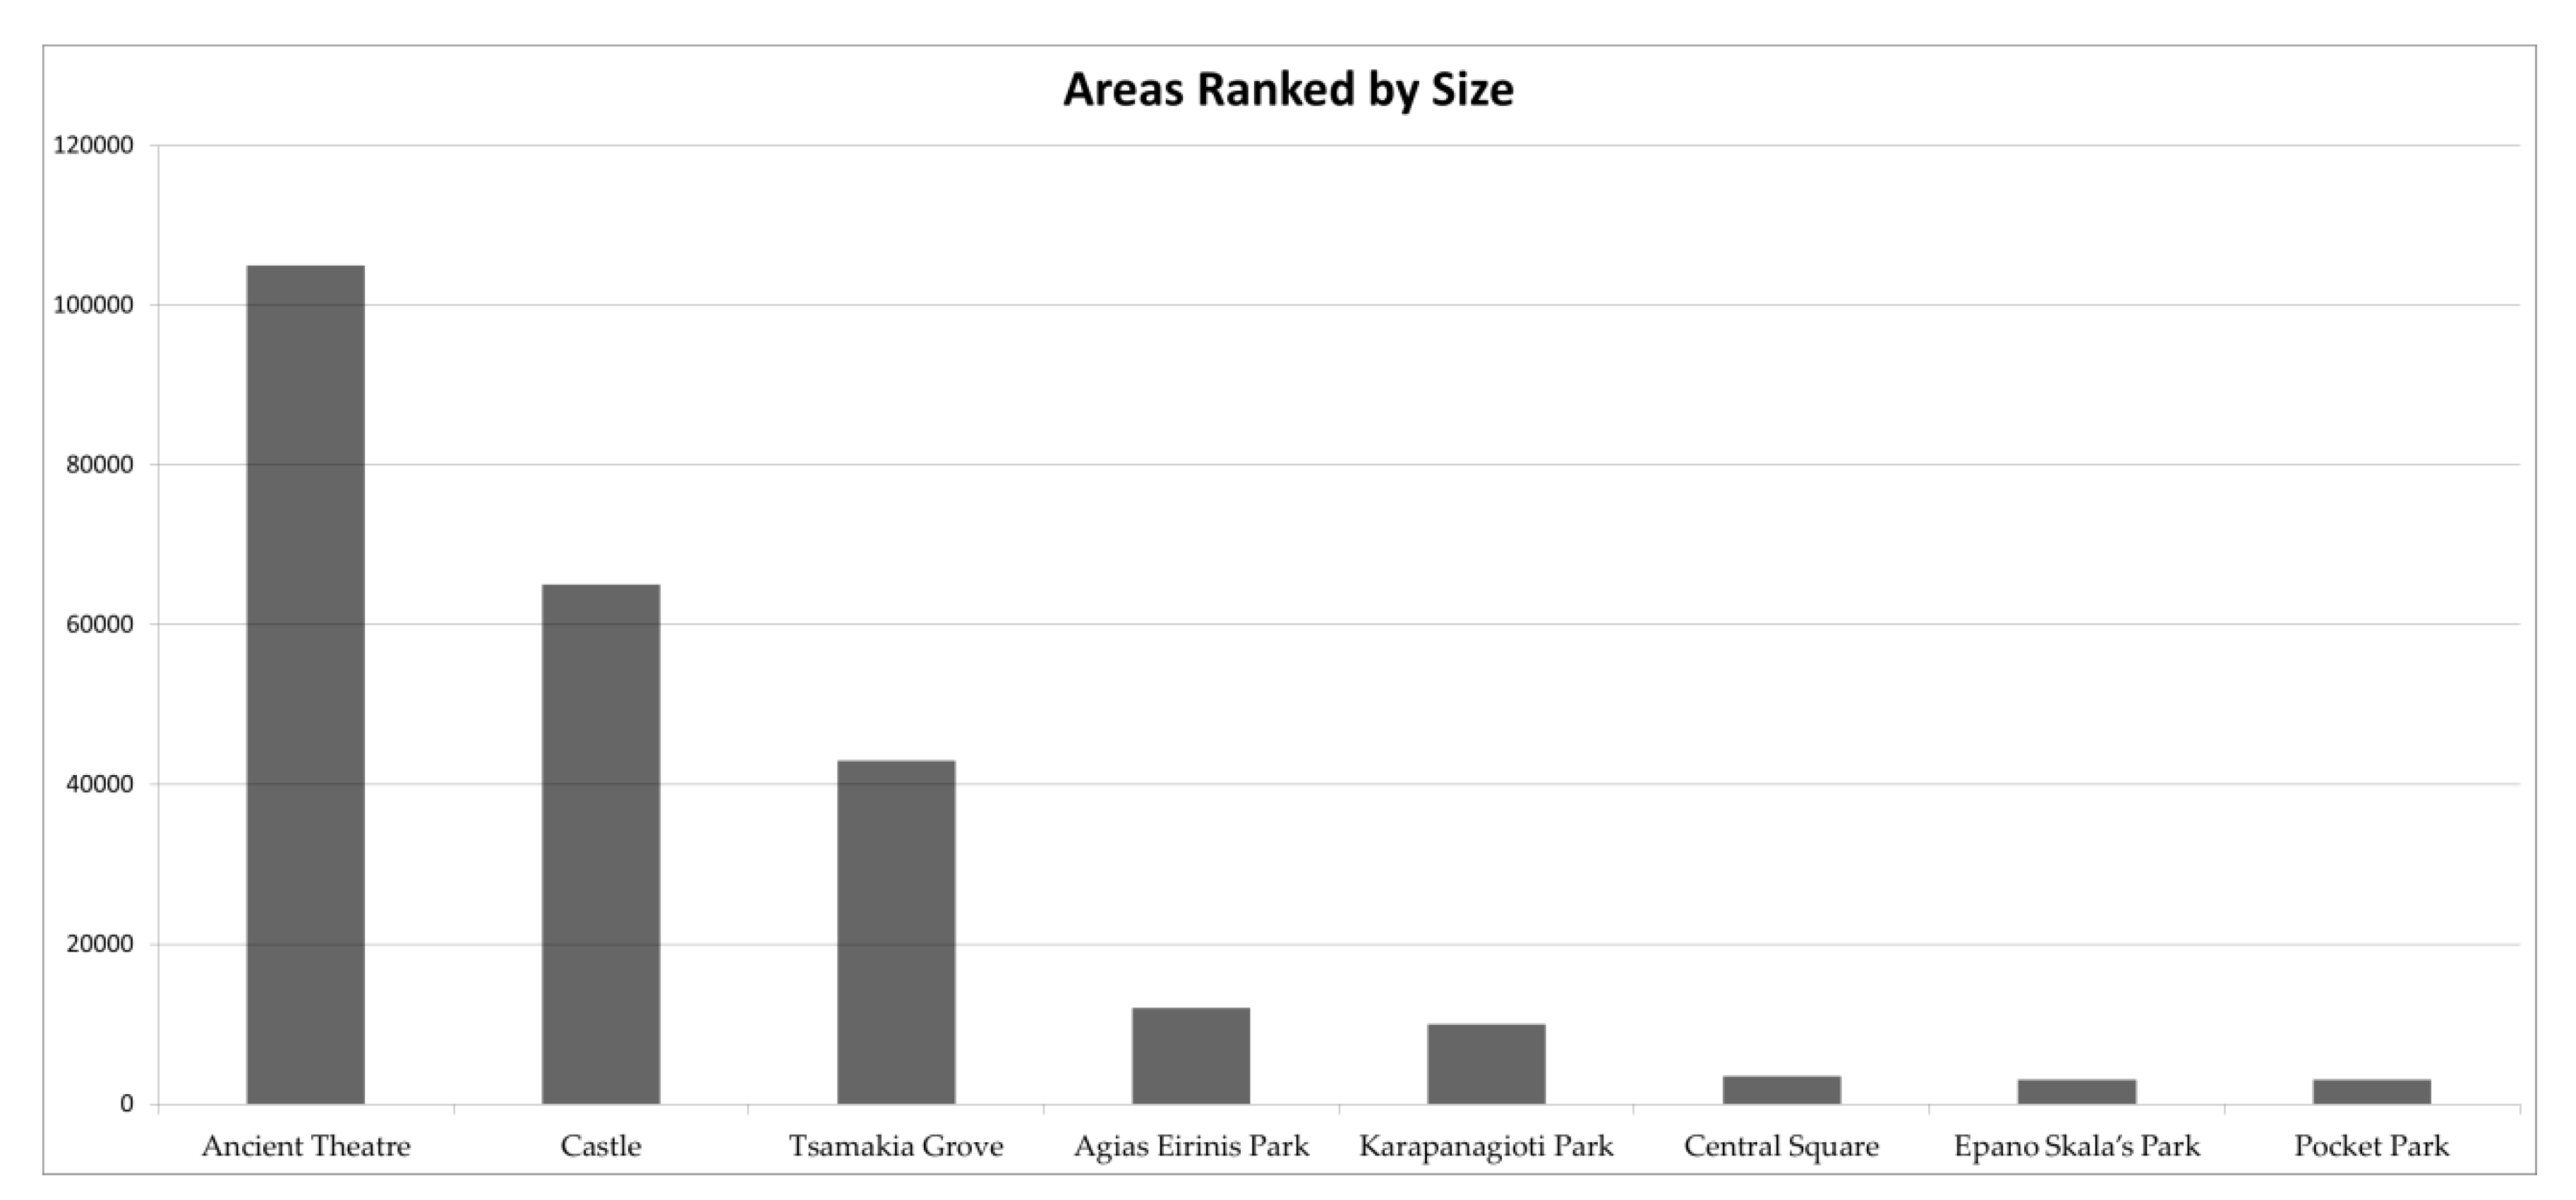
3.5.1. Case Study Areas
Tsamakia Grove
Pocket Park
Epano Skala Park
Agias Eirinis Park
Karapanagioti Park
Central Square
Ancient Theater
Castle
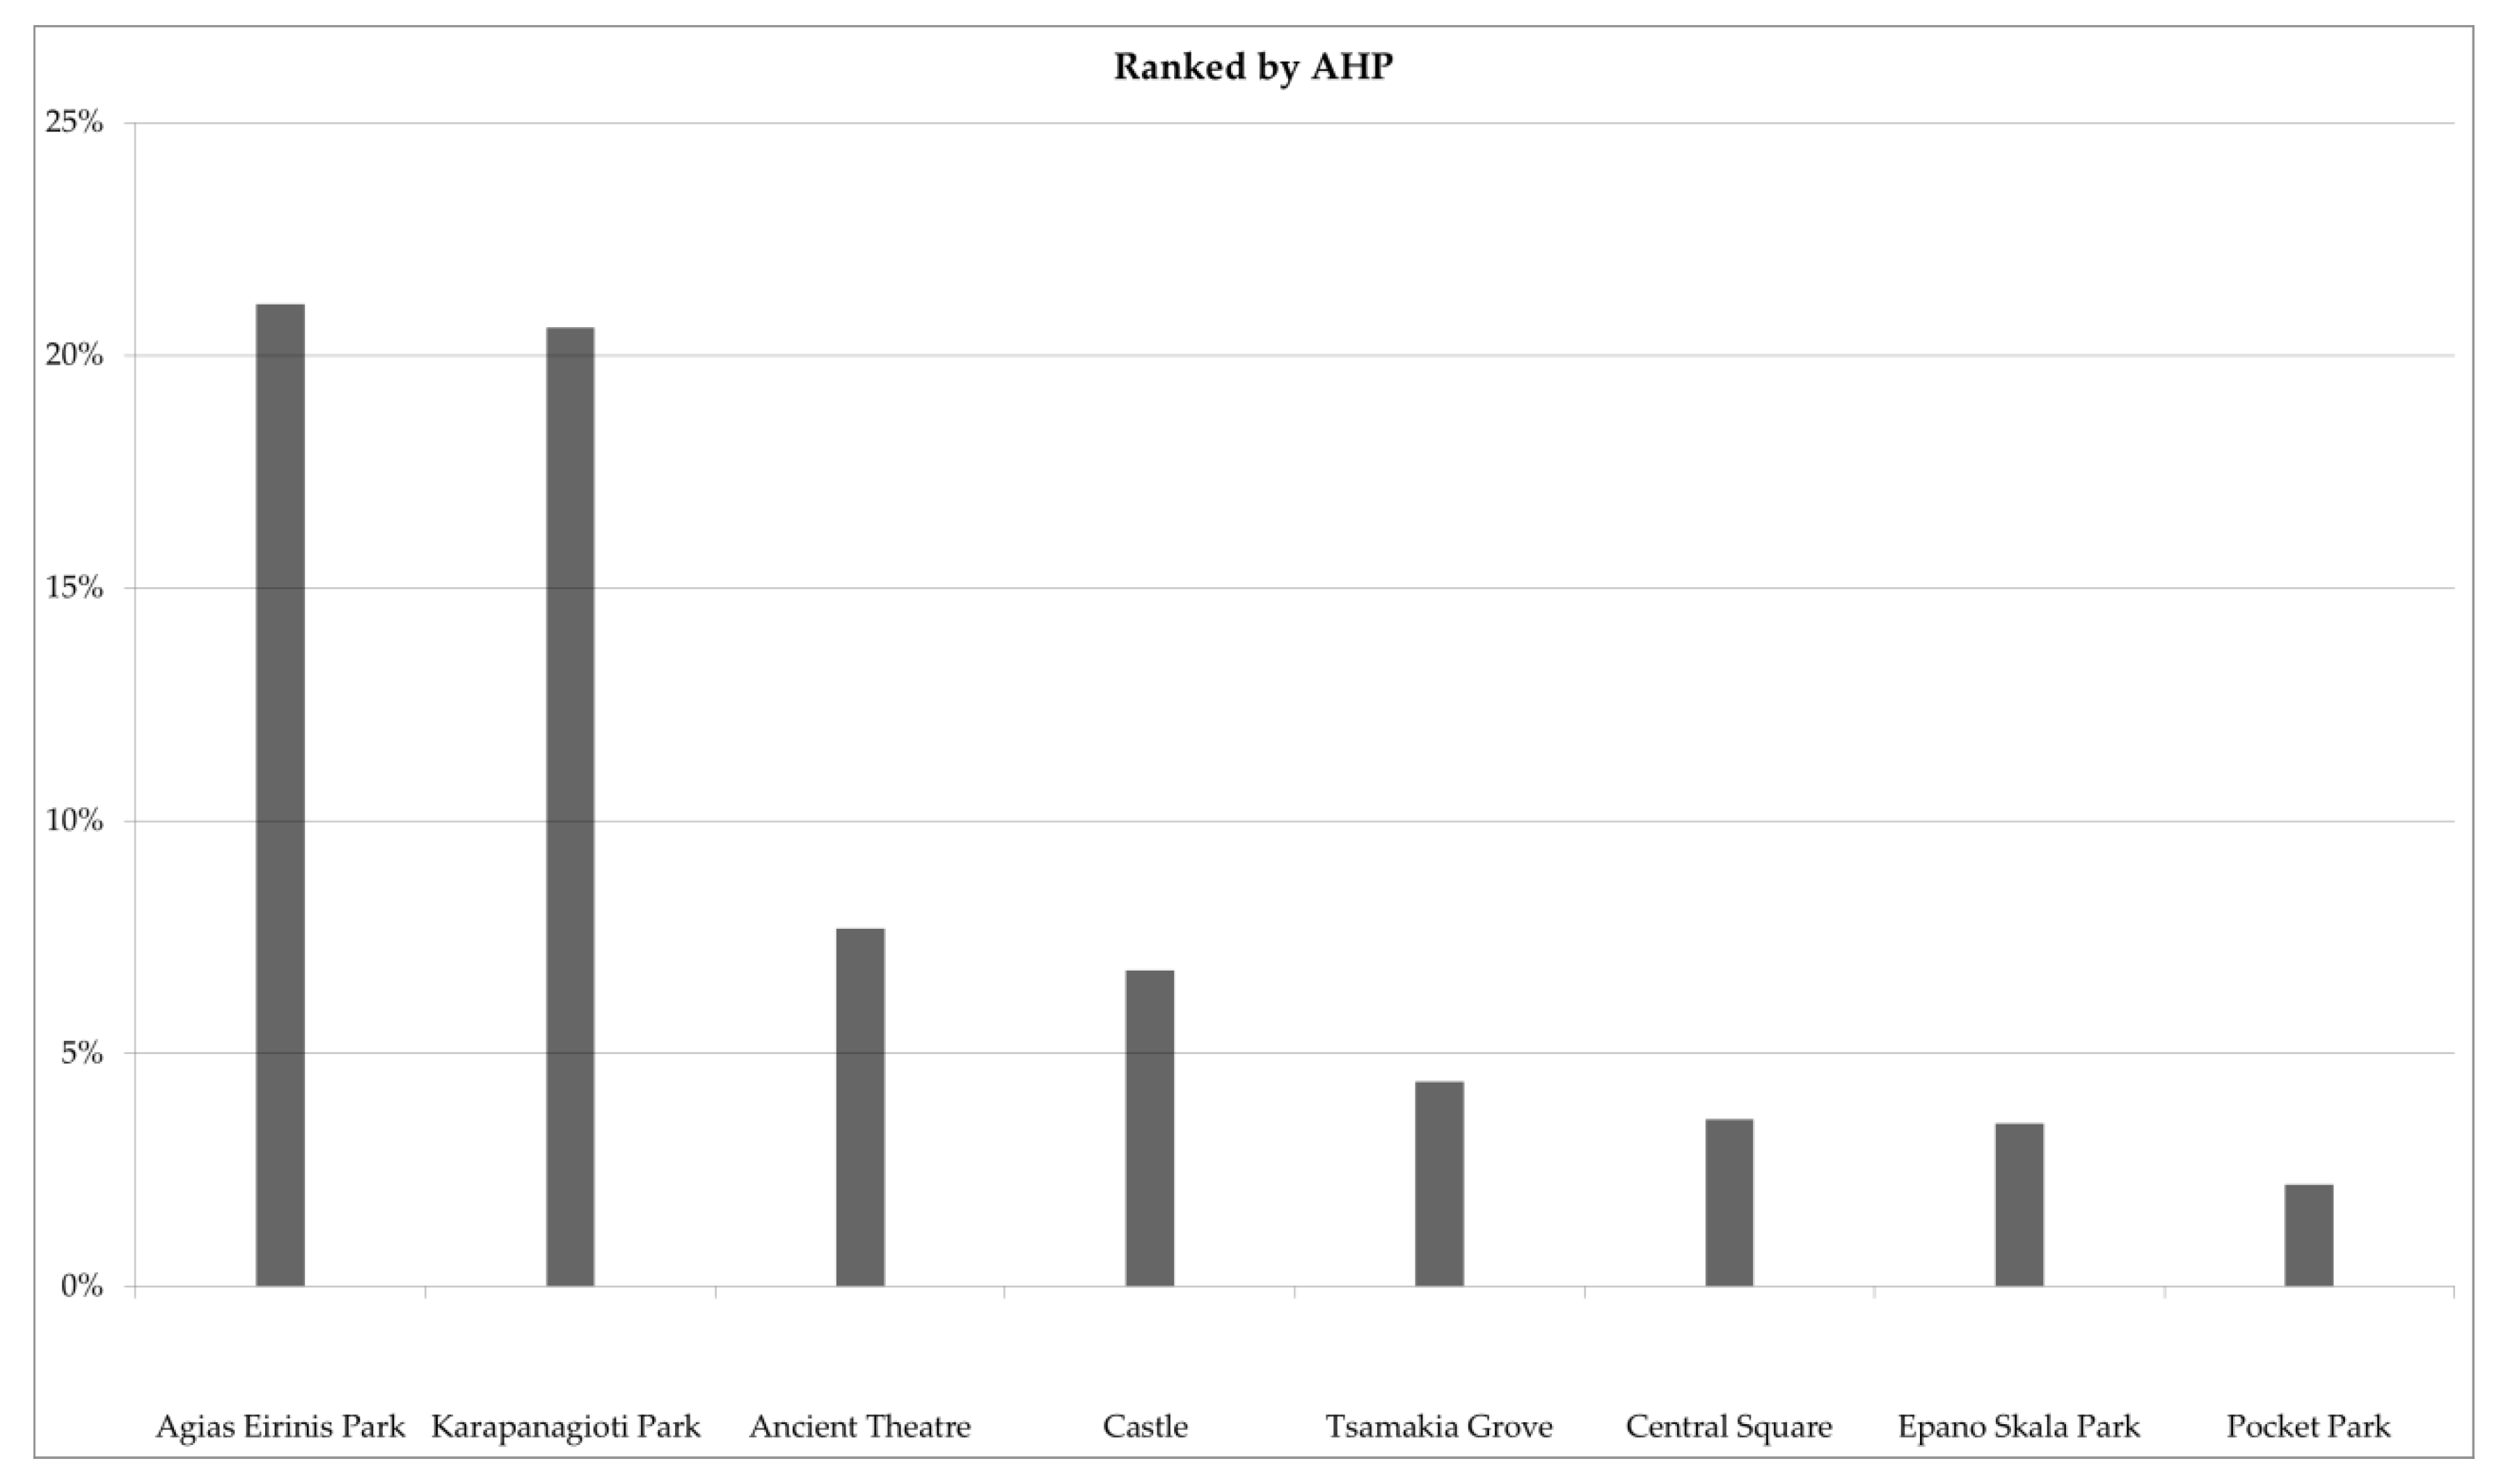
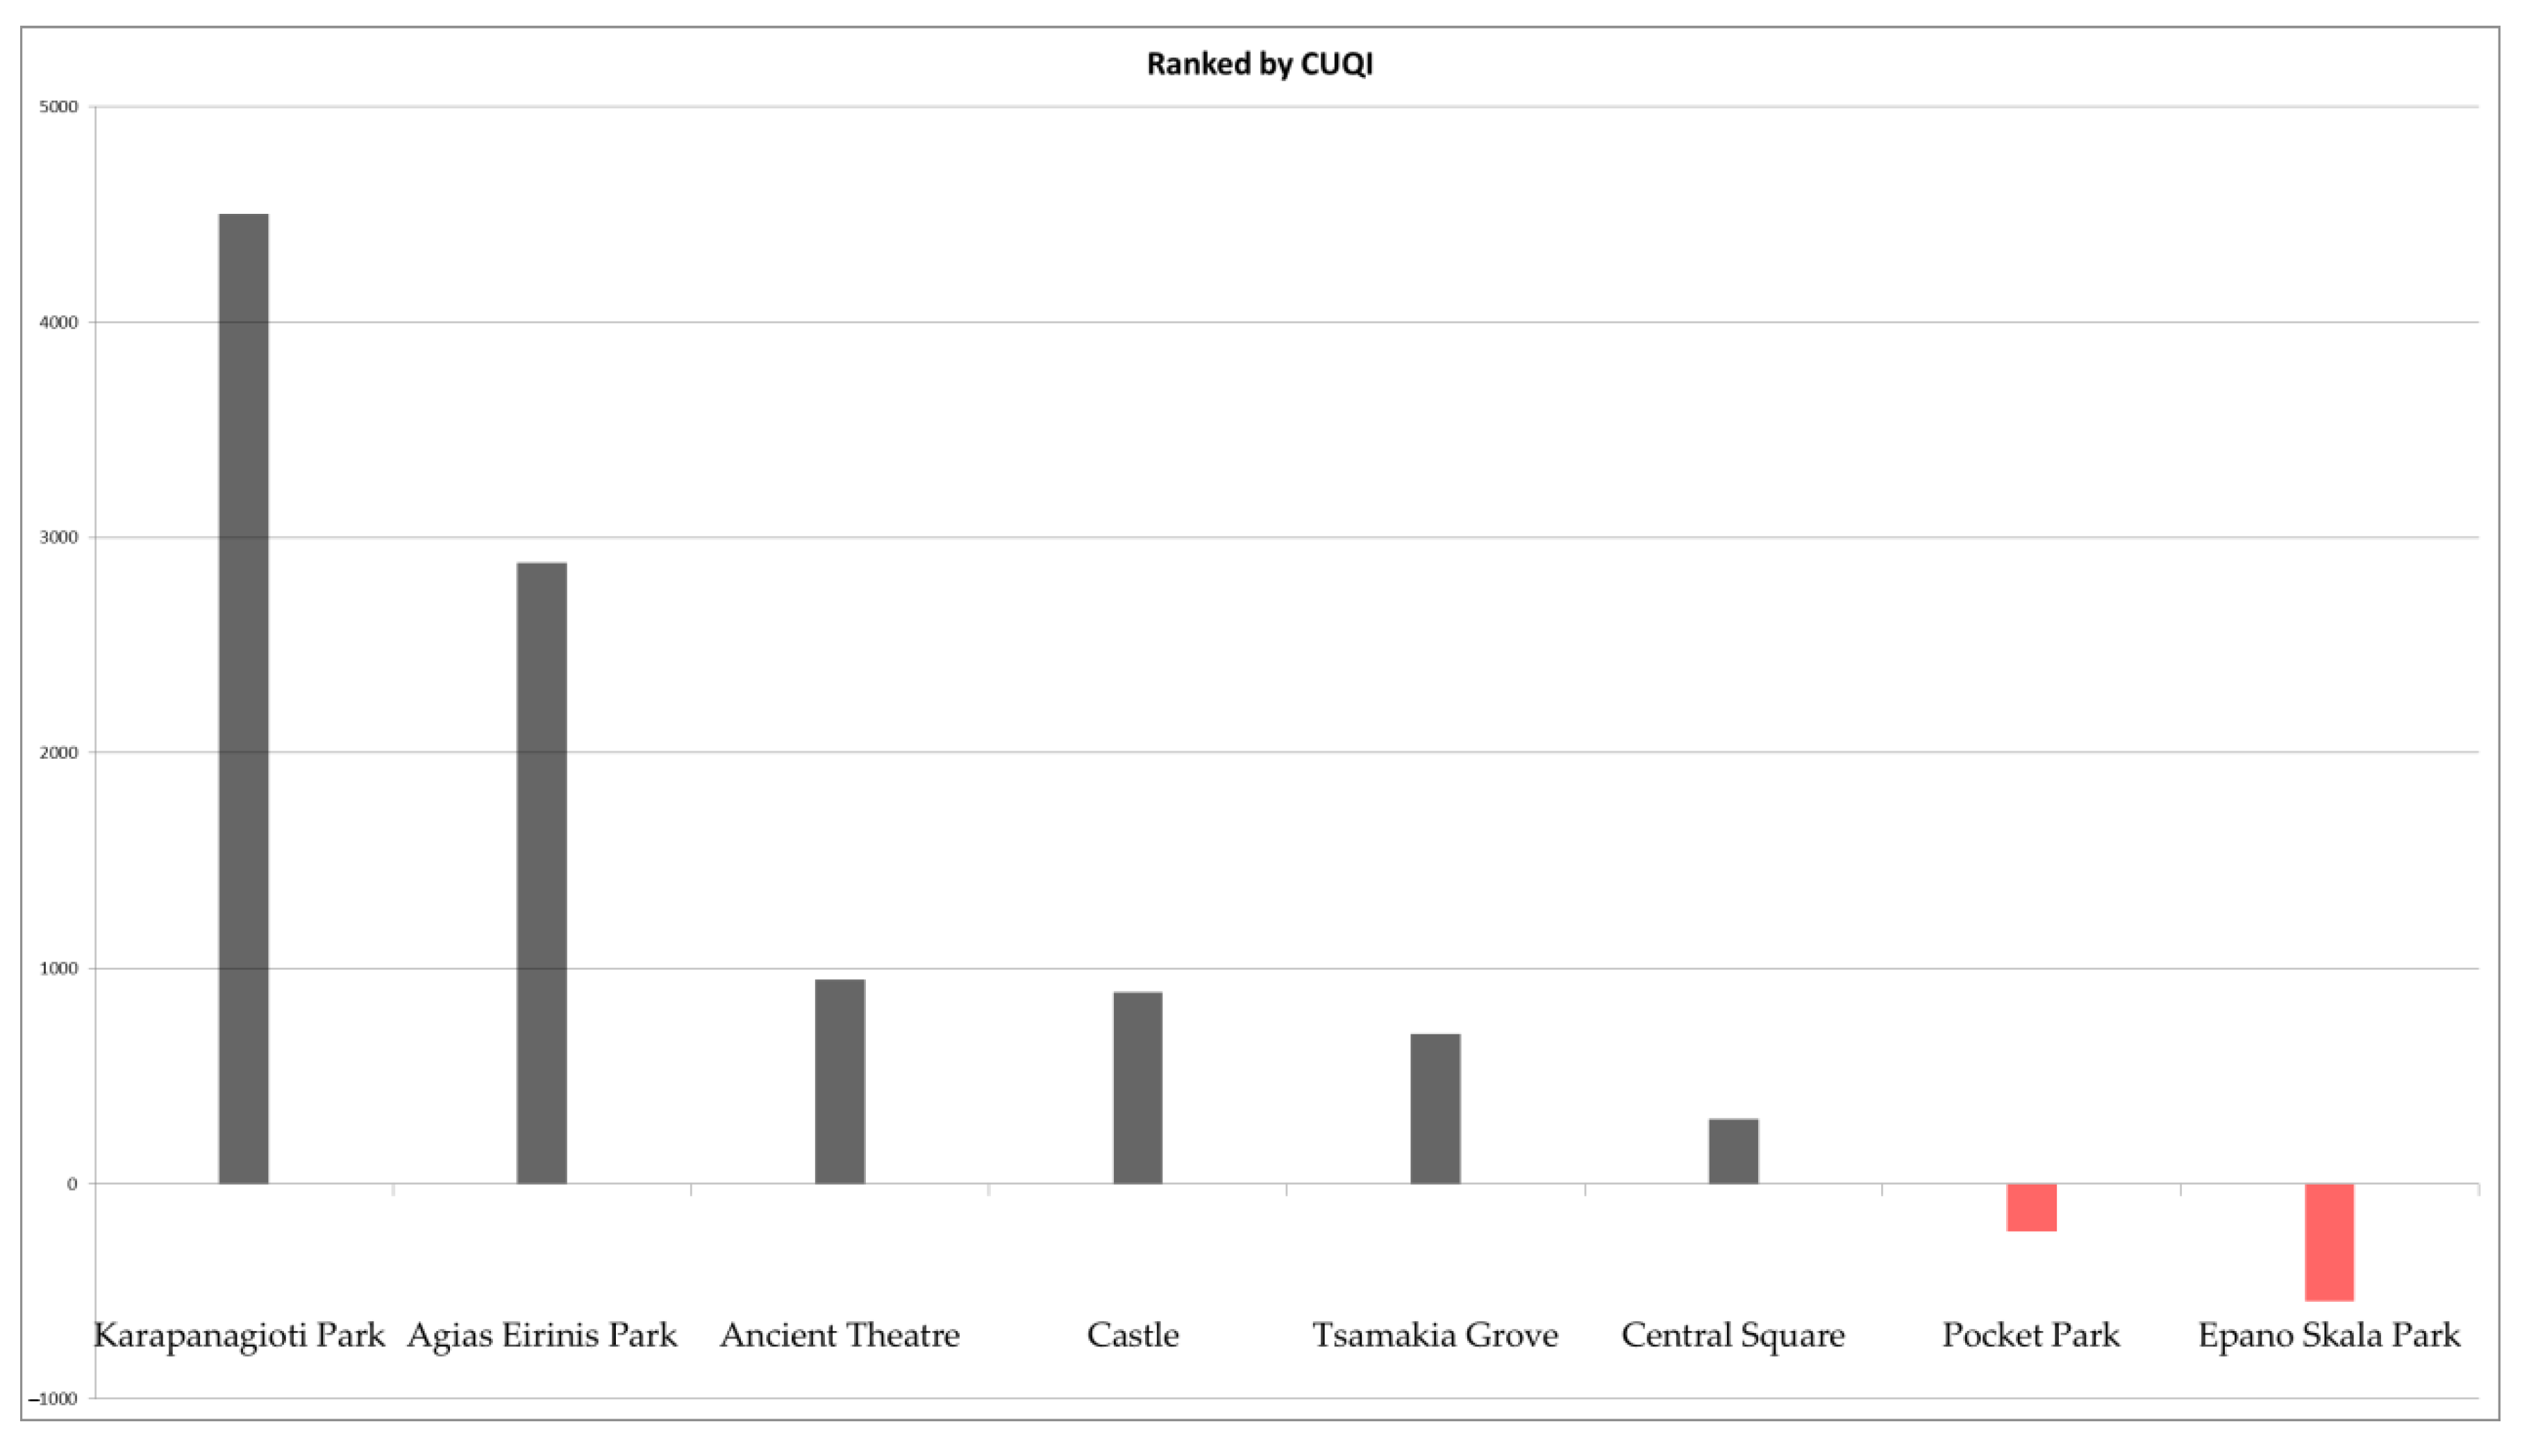
4. Results
Verification of Quiet Areas Using CUQI
5. Discussion
6. Conclusions
Author Contributions
Funding
Institutional Review Board Statement
Informed Cons ent Statement
Acknowledgments
Conflicts of Interest
References
- Gidlöf-Gunnarsson, A.; Öhrström, E. Noise and well-being in urban residential environments: The potential role of perceived availability to nearby green areas. Landsc. Urban Plan. 2007, 83, 115–126. [Google Scholar] [CrossRef]
- Chiesura, A. The role of urban parks for the sustainable city. Landsc. Urban Plan. 2004, 68, 129–138. [Google Scholar] [CrossRef]
- Ritschard, M.; Riebel, K.; Brumm, H. Female zebra finches prefer high-amplitude song. Anim. Behav. 2010, 79, 877–883. [Google Scholar] [CrossRef]
- Sueur, J.; Farina, A. Ecoacoustics: The Ecological Investigation and Interpretation of Environmental Sound. Biosemiotics 2015, 8, 493–502. [Google Scholar] [CrossRef]
- Bolund, P.; Hunhammar, S. Ecosystem services in urban areas. Ecol. Econ. 1999, 29, 293–301. [Google Scholar] [CrossRef]
- Munang, R.T.; Thiaw, I.; Rivington, M. Ecosystem Management: Tomorrow’s Approach to Enhancing Food Security under a Changing Climate. Sustain. J. Rec. 2011, 3, 937–954. [Google Scholar] [CrossRef] [Green Version]
- Elmqvist, T.; Setälä, H.; Handel, S.; van der Ploeg, S.; Aronson, J.; Blignaut, J.; Gómez-Baggethun, E.; Nowak, D.; Kronenberg, J.; de Groot, R. Benefits of restoring ecosystem services in urban areas. Curr. Opin. Environ. Sustain. 2015, 14, 101–108. [Google Scholar] [CrossRef] [Green Version]
- Aspuru, I.; Garcia, I.; Bartalucci, C.; Borchi, F.; Carfagni, M.; Governi, L.; Bellomini, R.; Luzzi, S.; Wolfert, H.; Gaudibert, P. LIFE+2010 QUADMAP Project: A new methodology to select, analyze and manage Quiet Urban Areas defined by the European Directive 2002/49/EC. Noise Mapp. 2016, 3. [Google Scholar] [CrossRef] [Green Version]
- Kang, J. From dBA to soundscape indices: Managing our sound environment. Front. Eng. Manag. 2017, 4, 184–192. [Google Scholar] [CrossRef] [Green Version]
- Farina, A. Soundscape Ecology Principles, Patterns, Methods and Applications; Spinger: Berlin/Heidelberg, Germany, 2014; ISBN 978-94-007-7373-8. [Google Scholar]
- Pijanowski, B.C.; Farina, A.; Gage, S.H.; Dumyahn, S.L.; Krause, B.L. What is soundscape ecology? An introduction and overview of an emerging new science. Landsc. Ecol. 2011, 26, 1213–1232. [Google Scholar] [CrossRef]
- Farina, A.; Belgrano, A. The eco-field: A new paradigm for landscape ecology. Ecol. Res. 2004, 19, 107–110. [Google Scholar] [CrossRef]
- Matsinos, Y.G.; Tsaligopoulos, A. Hot spots of ecoacoustics in Greece and the issue of background noise. J. Ecoacoustics 2018, 2, 1. [Google Scholar] [CrossRef]
- Aletta, F.; Kang, J.; Axelsson, Ö. Soundscape descriptors and a conceptual framework for developing predictive soundscape models. Landsc. Urban. Plan. 2016, 149, 65–74. [Google Scholar] [CrossRef]
- Martello, N.Z.; Aletta, F.; Fausti, P.; Kang, J.; Secchi, S. A Psychoacoustic Investigation on the Effect of External Shading Devices on Building Facades. Appl. Sci. 2016, 6, 429. [Google Scholar] [CrossRef] [Green Version]
- Erfanian, M.; Mitchell, A.J.; Kang, J.; Aletta, F. The Psychophysiological Implications of Soundscape: A Systematic Review of Empirical Literature and a Research Agenda. Int. J. Environ. Res. Public Health 2019, 16, 3533. [Google Scholar] [CrossRef] [Green Version]
- Davies, W.J.; Adams, M.D.; Bruce, N.S.; Cain, R.; Jennings, P.; Carlyle, A.; Cusack, P.; Hume, K.; Plack, C. A Positive Soundscape Evaluation Tool. In Proceedings of the 8th European Conference on Noise Control 2009, EURONOISE 2009—Proceedings of the Institute of Acoustics, Edinburgh, UK, 26–28 October 2009; Volume 31. [Google Scholar]
- Aiello, L.M.; Schifanella, R.; Quercia, D.; Aletta, F. Chatty maps: Constructing sound maps of urban areas from social media data. R. Soc. Open Sci. 2016, 3, 150690. [Google Scholar] [CrossRef] [Green Version]
- Liu, J.; Kang, J.; Behm, H.; Luo, T. Effects of landscape on soundscape perception: Soundwalks in city parks. Landsc. Urban Plan. 2014, 123, 30–40. [Google Scholar] [CrossRef] [Green Version]
- Dökmeci, P.N.; Kang, J. A Comparative Case Study of Indoor Soundscape Approach on Objective Analyses and Subjective Evaluations of Libraries. In Proceedings of the Acoustics 2012 Nantes Conference, Nantes, France, 23–27 April 2012. [Google Scholar]
- Sudarsono, A.S.; Lam, Y.W.; Davies, W.J. The effect of sound level on perception of reproduced soundscapes. Appl. Acoust. 2016, 110, 53–60. [Google Scholar] [CrossRef]
- Axelsson, Ö.; Nilsson, M.E.; Berglund, B. A principal components model of soundscape perception. J. Acoust. Soc. Am. 2010, 128, 2836–2846. [Google Scholar] [CrossRef]
- Czerwinski, A.; Kolbe, T.H.; Plümer, L.; Stöcker-meier, E.; Tochtermann, K. Spatial Data Infrastructure Techniques for Flexible Noise Mapping Strategies; Tochtermann, K., Scharl, A., Eds.; Managing Environmental Knowledge; Shaker Verlag: Aachen, Germany, 2006. [Google Scholar]
- Votsi, N.-E.P.; Drakou, E.G.; Mazaris, A.D.; Kallimanis, A.S.; Pantis, J.D. Distance-based assessment of open country Quiet Areas in Greece. Landsc. Urban Plan. 2012, 104, 279–288. [Google Scholar] [CrossRef]
- Aletta, F.; Kang, J. Soundscape approach integrating noise mapping techniques: A case study in Brighton, UK. Noise Mapp. 2015, 2, 2. [Google Scholar] [CrossRef] [Green Version]
- Lindquist, M.; Lange, E. Sensory Aspects of Simulation and Representation in Landscape and Environmental Planning: A Soundscape Perspective. In Innovative Technologies in Urban Mapping: Built Space and Mental Space; Contin, A., Paolini, P., Salerno, R., Eds.; Springer International Publishing: Berlin/Heidelberg, Germany, 2014; pp. 93–106. ISBN 978-3-319-03798-1. [Google Scholar]
- Salomons, E. QSIDE, Noise and Quietness in Cities. Available online: http://www.qside.se/overview.html (accessed on 17 March 2021).
- Directive Noise Environment European Commission. Available online: http://ec.europa.eu/environment/noise/directive_en.htm (accessed on 2 March 2016).
- Delaunay, D.; Apparicio, P.; Séguin, A.-M.; Gelb, J.; Carrier, M. L’identification des zones calmes et un diagnostic d’équité environnementale à Montréal. Can. Geogr. Géogr. Can. 2019, 63, 184–197. [Google Scholar] [CrossRef] [Green Version]
- Lagonigro, R.; Martori, J.C.; Apparicio, P. Environmental noise inequity in the city of Barcelona. Transp. Res. Part D Transp. Environ. 2018, 63, 309–319. [Google Scholar] [CrossRef]
- Farina, A.; Ceraulo, M.; Bobryk, C.; Pieretti, N.; Quinci, E.; Lattanzi, E. Spatial and temporal variation of bird dawn chorus and successive acoustic morning activity in a Mediterranean landscape. Bioacoustics 2015, 24, 269–288. [Google Scholar] [CrossRef]
- Jeon, J.Y.; Lee, P.J.; Hong, J.Y.; Cabrera, D. Non-auditory factors affecting urban soundscape evaluation. J. Acoust. Soc. Am. 2011, 130, 3761–3770. [Google Scholar] [CrossRef] [PubMed]
- Yu, L.; Kang, J. Effects of social, demographical and behavioral factors on the sound level evaluation in urban open spaces. J. Acoust. Soc. Am. 2008, 123, 772–783. [Google Scholar] [CrossRef] [PubMed]
- Watts, G.; Miah, A.; Pheasant, R. Tranquillity and Soundscapes in Urban Green Spaces—Predicted and Actual Assessments from a Questionnaire Survey. Environ. Plan. B Plan. Des. 2013, 40, 170–181. [Google Scholar] [CrossRef]
- Hong, J.Y.; Jeon, J.Y. Influence of urban contexts on soundscape perceptions: A structural equation modeling approach. Landsc. Urban Plan. 2015, 141, 78–87. [Google Scholar] [CrossRef]
- Truax, B. Handbook for Acoustic Ecology. Available online: http://www.sfu.ca/sonic-studio/handbook/ (accessed on 1 March 2016).
- Korkontzila, A.; Karapostoli, A.; Tsaligopoulos, A.; Matsinos, Y.G. Assessing the Effects of Noise on Sound Identities of Historical Landmarks. Acoustics 2020, 2, 719–734. [Google Scholar] [CrossRef]
- Towsey, M.; Wimmer, J.; Williamson, I.; Roe, P. The use of acoustic indices to determine avian species richness in audio-recordings of the environment. Ecol. Inform. 2014, 21, 110–119. [Google Scholar] [CrossRef] [Green Version]
- Sueur, J.; Farina, A.; Gasc, A.; Pieretti, N.; Pavoine, S. Acoustic Indices for Biodiversity Assessment and Landscape Investigation. Acta Acust. United Acust. 2014, 100, 772–781. [Google Scholar] [CrossRef] [Green Version]
- Fuller, S.; Axel, A.C.; Tucker, D.; Gage, S.H. Connecting Soundscape to Landscape: Which Acoustic Index Best Describes Landscape Configuration? Ecol. Indic. 2015, 58, 207–215. [Google Scholar] [CrossRef] [Green Version]
- Kasten, E.P.; Gage, S.H.; Fox, J.; Joo, W. The remote environmental assessment laboratory’s acoustic library: An archive for studying soundscape ecology. Ecol. Inform. 2012, 12, 50–67. [Google Scholar] [CrossRef]
- Pieretti, N.; Farina, A. Application of a recently introduced index for acoustic complexity to an avian soundscape with traffic noise. J. Acoust. Soc. Am. 2013, 134, 891–900. [Google Scholar] [CrossRef] [PubMed]
- Pieretti, N.; Farina, A.; Morri, D. A new methodology to infer the singing activity of an avian community: The Acoustic Complexity Index (ACI). Ecol. Indic. 2011, 11, 868–873. [Google Scholar] [CrossRef]
- Bradfer-Lawrence, T.; Gardner, N.; Bunnefeld, L.; Bunnefeld, N.; Willis, S.G.; Dent, D.H. Guidelines for the use of acoustic indices in environmental research. Methods Ecol. Evol. 2019, 10, 1796–1807. [Google Scholar] [CrossRef]
- Villanueva-Rivera, L.J.; Pijanowski, B.C.; Doucette, J.; Pekin, B. A primer of acoustic analysis for landscape ecologists. Landsc. Ecol. 2011, 26, 1233–1246. [Google Scholar] [CrossRef]
- De Souza, L.C.L.; Giunta, M.B. Urban indices as environmental noise indicators. Comput. Environ. Urban Syst. 2011, 35, 421–430. [Google Scholar] [CrossRef]
- Masullo, M.; Castanò, F.; Toma, R.A.; Maffei, L. Historical Cloisters and Courtyards as Quiet Areas. Sustain. J. Rec. 2020, 12, 2887. [Google Scholar] [CrossRef] [Green Version]
- Kogan, P.; Arenas, J.P.; Bermejo, F.; Hinalaf, M.; Turra, B. A Green Soundscape Index (GSI): The potential of assessing the perceived balance between natural sound and traffic noise. Sci. Total Environ. 2018, 642, 463–472. [Google Scholar] [CrossRef]
- Sztubecka, M.; Skiba, M.; Mrówczyńska, M.; Mathias, M. Noise as a Factor of Green Areas Soundscape Creation. Sustain. J. Rec. 2020, 12, 999. [Google Scholar] [CrossRef] [Green Version]
- Kosko, B. Fuzzy cognitive maps. Int. J. Man-Mach. Stud. 1986, 24, 65–75. [Google Scholar] [CrossRef]
- Martorana, R. Representation of Silence in Soundscape Perception. Master’s Thesis, Media Technology MSc Program, Leiden University, Leiden, The Netherlands, 2017. [Google Scholar]
- Elizalde, I.R. Ssssssssssssilence. Perform. Res. 2019, 24, 117–122. [Google Scholar] [CrossRef]
- Garner, W.; Schafer, R.M. The Tuning of the World. Leon 1983, 16, 69. [Google Scholar] [CrossRef]
- Özesmi, U.; Özesmi, S.L. Ecological models based on people’s knowledge: A multi-step fuzzy cognitive mapping approach. Ecol. Model. 2004, 176, 43–64. [Google Scholar] [CrossRef] [Green Version]
- Giabbanelli, P.J.; Gray, S.A.; Aminpour, P. Combining fuzzy cognitive maps with agent-based modeling: Frameworks and pitfalls of a powerful hybrid modeling approach to understand human-environment interactions. Environ. Model. Softw. 2017, 95, 320–325. [Google Scholar] [CrossRef]
- Kokkinos, K.; Lakioti, E.; Papageorgiou, E.; Moustakas, K.; Karayannis, V. Fuzzy Cognitive Map-Based Modeling of Social Acceptance to Overcome Uncertainties in Establishing Waste Biorefinery Facilities. Front. Energy Res. 2018, 6, 6. [Google Scholar] [CrossRef] [Green Version]
- Medvedev, O.; Shepherd, D.; Hautus, M.J. The restorative potential of soundscapes: A physiological investigation. Appl. Acoust. 2015, 96, 20–26. [Google Scholar] [CrossRef]
- Kang, J.; Zhang, M. Semantic differential analysis of the soundscape in urban open public spaces. Build. Environ. 2010, 45, 150–157. [Google Scholar] [CrossRef]
- Ma, K.W.; Mak, C.M.; Wong, H.M. Effects of environmental sound quality on soundscape preference in a public urban space. Appl. Acoust. 2021, 171, 107570. [Google Scholar] [CrossRef]
- Hong, X.; Wang, G.; Liu, J.; Lan, S. Cognitive persistence of soundscape in urban parks. Sustain. Cities Soc. 2019, 51, 51. [Google Scholar] [CrossRef]
- Krause, B.; Farina, A. Using ecoacoustic methods to survey the impacts of climate change on biodiversity. Biol. Conserv. 2016, 195, 245–254. [Google Scholar] [CrossRef]
- Kisser, J.; Wirth, M.; De Gusseme, B.; Van Eekert, M.; Zeeman, G.; Schoenborn, A.; Vinnerås, B.; Finger, D.C.; Repinc, S.K.; Bulc, T.G.; et al. A review of nature-based solutions for resource recovery in cities. Blue-Green Syst. 2020, 2, 138–172. [Google Scholar] [CrossRef] [Green Version]
- Hilborn, R. Living with Uncertainty in Resource Management. N. Am. J. Fish. Manag. 1987, 7, 1–5. [Google Scholar] [CrossRef]
- Huntzinger, D.N.; Michalak, A.M.; Schwalm, C.; Ciais, P.; King, A.W.; Fang, Y.; Schaefer, K.; Wei, Y.; Cook, R.B.; Fisher, J.B.; et al. Uncertainty in the response of terrestrial carbon sink to environmental drivers undermines carbon-climate feedback predictions. Sci. Rep. 2017, 7, 4765. [Google Scholar] [CrossRef]
- Latif, M. Uncertainty in climate change projections. J. Geochem. Explor. 2011, 110, 1–7. [Google Scholar] [CrossRef] [Green Version]
- Marx, S.M.; Weber, E.U.; Orlove, B.S.; Leiserowitz, A.; Krantz, D.H.; Roncoli, C.; Phillips, J. Communication and mental processes: Experiential and analytic processing of uncertain climate information. Glob. Environ. Chang. 2007, 17, 47–58. [Google Scholar] [CrossRef]
- Weber, E.U. Experience-Based and Description-Based Perceptions of Long-Term Risk: Why Global Warming does not Scare us (Yet). Clim. Chang. 2006, 77, 103–120. [Google Scholar] [CrossRef]
- Simpson, P. ‘Failing on Deaf Ears’: A Postphenomenology of Sonorous Presence. Environ. Plan. A Econ. Space 2009, 41, 2556–2575. [Google Scholar] [CrossRef]
- Schulte-Fortkamp, B.; Fiebig, A. Going beyond noise in urban planning—Human perception will be the trusted guide. J. Acoust. Soc. Am. 2017, 142, 2672. [Google Scholar] [CrossRef]
- Forrest, J.; Miller-Rushing, A.J. Toward a synthetic understanding of the role of phenology in ecology and evolution. Philos. Trans. R. Soc. B Biol. Sci. 2010, 365, 3101–3112. [Google Scholar] [CrossRef] [PubMed] [Green Version]
- Votsi, N.-E.P.; Kallimanis, A.S.; Mazaris, A.D.; Pantis, J.D. Integrating environmental policies towards a network of protected and quiet areas. Environ. Conserv. 2013, 41, 321–329. [Google Scholar] [CrossRef]
- Booi, H.; Berg, F.V.D. Quiet Areas and the Need for Quietness in Amsterdam. Int. J. Environ. Res. Public Health 2012, 9, 1030–1050. [Google Scholar] [CrossRef]
- Tong, H.; Kang, J. Relationships between noise complaints and socio-economic factors in England. Sustain. Cities Soc. 2021, 65, 102573. [Google Scholar] [CrossRef]
- Matsinos, Y.G.; Tsaligopoulos, A.; Economou, C. The Interdisciplinary Development of the Term “Soundscape”, Tracing Its Ecological Roots. AEgean J. Environ. Sci. 2016, 2, 11–23. [Google Scholar]
- Rehan, R.M. The phonic identity of the city urban soundscape for sustainable spaces. HBRC J. 2016, 12, 337–349. [Google Scholar] [CrossRef] [Green Version]
- Karapostoli, A.; Votsi, N.-E. Urban soundscapes in the historic centre of Thessaloniki: Sonic architecture and sonic identity. Sound Stud. 2018, 4, 162–177. [Google Scholar] [CrossRef]
- Keizer, G.; Miller, N.P. The Unwanted Sound of Everything We Want, A Book about Noise. Noise Control. Eng. J. 2010, 58, 466. [Google Scholar] [CrossRef]
- Verbeek, T. Unequal residential exposure to air pollution and noise: A geospatial environmental justice analysis for Ghent, Belgium. SSM Popul. Health 2019, 7, 100340. [Google Scholar] [CrossRef]
- Dale, L.M.; Goudreau, S.; Perron, S.; Ragettli, M.S.; Hatzopoulou, M.; Smargiassi, A. Socioeconomic status and environmental noise exposure in Montreal, Canada. BMC Public Health 2015, 15, 205. [Google Scholar] [CrossRef] [Green Version]
- Nega, T.H.; Chihara, L.; Smith, K.; Jayaraman, M. Traffic Noise and Inequality in the Twin Cities, Minnesota. Hum. Ecol. Risk Assess. Int. J. 2013, 19, 601–619. [Google Scholar] [CrossRef]
- Leijssen, J.B.; Snijder, M.B.; Timmermans, E.J.; Generaal, E.; Stronks, K.; Kunst, A.E. The association between road traffic noise and depressed mood among different ethnic and socioeconomic groups. The HELIUS study. Int. J. Hyg. Environ. Health 2019, 222, 221–229. [Google Scholar] [CrossRef] [PubMed]
- Aletta, F.; Oberman, T.; Mitchell, A.; Tong, H.; Kang, J. Assessing the changing urban sound environment during the COVID-19 lockdown period using short-term acoustic measurements. Noise Mapp. 2020, 7, 123–134. [Google Scholar] [CrossRef]
- Radicchi, A.; Yelmi, P.C.; Chung, A.; Jordan, P.; Stewart, S.; Tsaligopoulos, A.; McCunn, L.; Grant, M. Sound and the healthy city. Cities Health 2021, 5, 1–13. [Google Scholar] [CrossRef]
- Derryberry, E.P.; Phillips, J.N.; Derryberry, G.E.; Blum, M.J.; Luther, D. Singing in a silent spring: Birds respond to a half-century soundscape reversion during the COVID-19 shutdown. Science 2020, 370, 575–579. [Google Scholar] [CrossRef] [PubMed]
- EEA Technical Report No 4/2014. Available online: http://acm.eionet.europa.eu/reports/EEA_TR_4_2014_practice_guide_quiet_areas (accessed on 29 June 2017).
- De Montis, A.; Serra, V.; Ganciu, A.; Ledda, A. Assessing Landscape Fragmentation: A Composite Indicator. Sustain. J. Rec. 2020, 12, 9632. [Google Scholar] [CrossRef]
- Matsinos, Y.G.; Tsaligopoulos, A.; Economou, C. Identifying the Quiet Areas of a Small Urban Setting: The Case of Mytilene. Glob. NEST J. 2017, 19, 674–681. [Google Scholar] [CrossRef]
- Sueur, J.; Aubin, T.; Simonis, C. Seewave, a free modular tool for sound analysis and synthesis. Bioacoustics 2008, 18, 213–226. [Google Scholar] [CrossRef]
- Zeileis, A.; Kleiber, C. Ineq: Measuring Inequality, Concentration, and Poverty, CRAN—Package Ineq. Available online: https://cran.r-project.org/web/packages/ineq/index.html (accessed on 17 March 2021).
- Evensen, K.H.; Raanaas, R.K.; Fyhri, A. Soundscape and perceived suitability for recreation in an urban designated quiet zone. Urban For. Urban. Green. 2016, 20, 243–248. [Google Scholar] [CrossRef]
- Parrott, L. Measuring ecological complexity. Ecol. Indic. 2010, 10, 1069–1076. [Google Scholar] [CrossRef]
- Torresin, S.; Albatici, R.; Aletta, F.; Babich, F.; Oberman, T.; Kang, J. Acoustic Design Criteria in Naturally Ventilated Residential Buildings: New Research Perspectives by Applying the Indoor Soundscape Approach. Appl. Sci. 2019, 9, 5401. [Google Scholar] [CrossRef] [Green Version]
- Devos, P.; Aletta, F.; Thomas, P.; Petrovic, M.; Mynsbrugge, T.V.; Van De Velde, D.; De Vriendt, P.; Botteldooren, D. Designing Supportive Soundscapes for Nursing Home Residents with Dementia. Int. J. Environ. Res. Public Health 2019, 16, 4904. [Google Scholar] [CrossRef] [PubMed] [Green Version]
- Tsaligopoulos, A.; Economou, C.; Matsinos, Y.G. Identification, Prioritization, and Assessment of Urban Quiet Areas. Available online: www.igi-global.com/chapter/identification-prioritization-and-assessment-of-urban-quiet-areas/198160 (accessed on 25 February 2021).
- Tsaligopoulos, A.; Karapostoli, A.; Radicchi, A.; Economou, C.; Kyvelou, S.; Matsinos, Y.G. Ecological connectivity of urban quiet areas: The case of Mytilene, Greece. Cities Health 2021, 5, 20–32. [Google Scholar] [CrossRef]


Publisher’s Note: MDPI stays neutral with regard to jurisdictional claims in published maps and institutional affiliations. |
© 2021 by the authors. Licensee MDPI, Basel, Switzerland. This article is an open access article distributed under the terms and conditions of the Creative Commons Attribution (CC BY) license (http://creativecommons.org/licenses/by/4.0/).
Share and Cite
Tsaligopoulos, A.; Kyvelou, S.; Votsi, N.-E.; Karapostoli, A.; Economou, C.; Matsinos, Y.G. Revisiting the Concept of Quietness in the Urban Environment—Towards Ecosystems’ Health and Human Well-Being. Int. J. Environ. Res. Public Health 2021, 18, 3151. https://0-doi-org.brum.beds.ac.uk/10.3390/ijerph18063151
Tsaligopoulos A, Kyvelou S, Votsi N-E, Karapostoli A, Economou C, Matsinos YG. Revisiting the Concept of Quietness in the Urban Environment—Towards Ecosystems’ Health and Human Well-Being. International Journal of Environmental Research and Public Health. 2021; 18(6):3151. https://0-doi-org.brum.beds.ac.uk/10.3390/ijerph18063151
Chicago/Turabian StyleTsaligopoulos, Aggelos, Stella Kyvelou, Nefta-Eleftheria Votsi, Aimilia Karapostoli, Chris Economou, and Yiannis G. Matsinos. 2021. "Revisiting the Concept of Quietness in the Urban Environment—Towards Ecosystems’ Health and Human Well-Being" International Journal of Environmental Research and Public Health 18, no. 6: 3151. https://0-doi-org.brum.beds.ac.uk/10.3390/ijerph18063151