1. Introduction
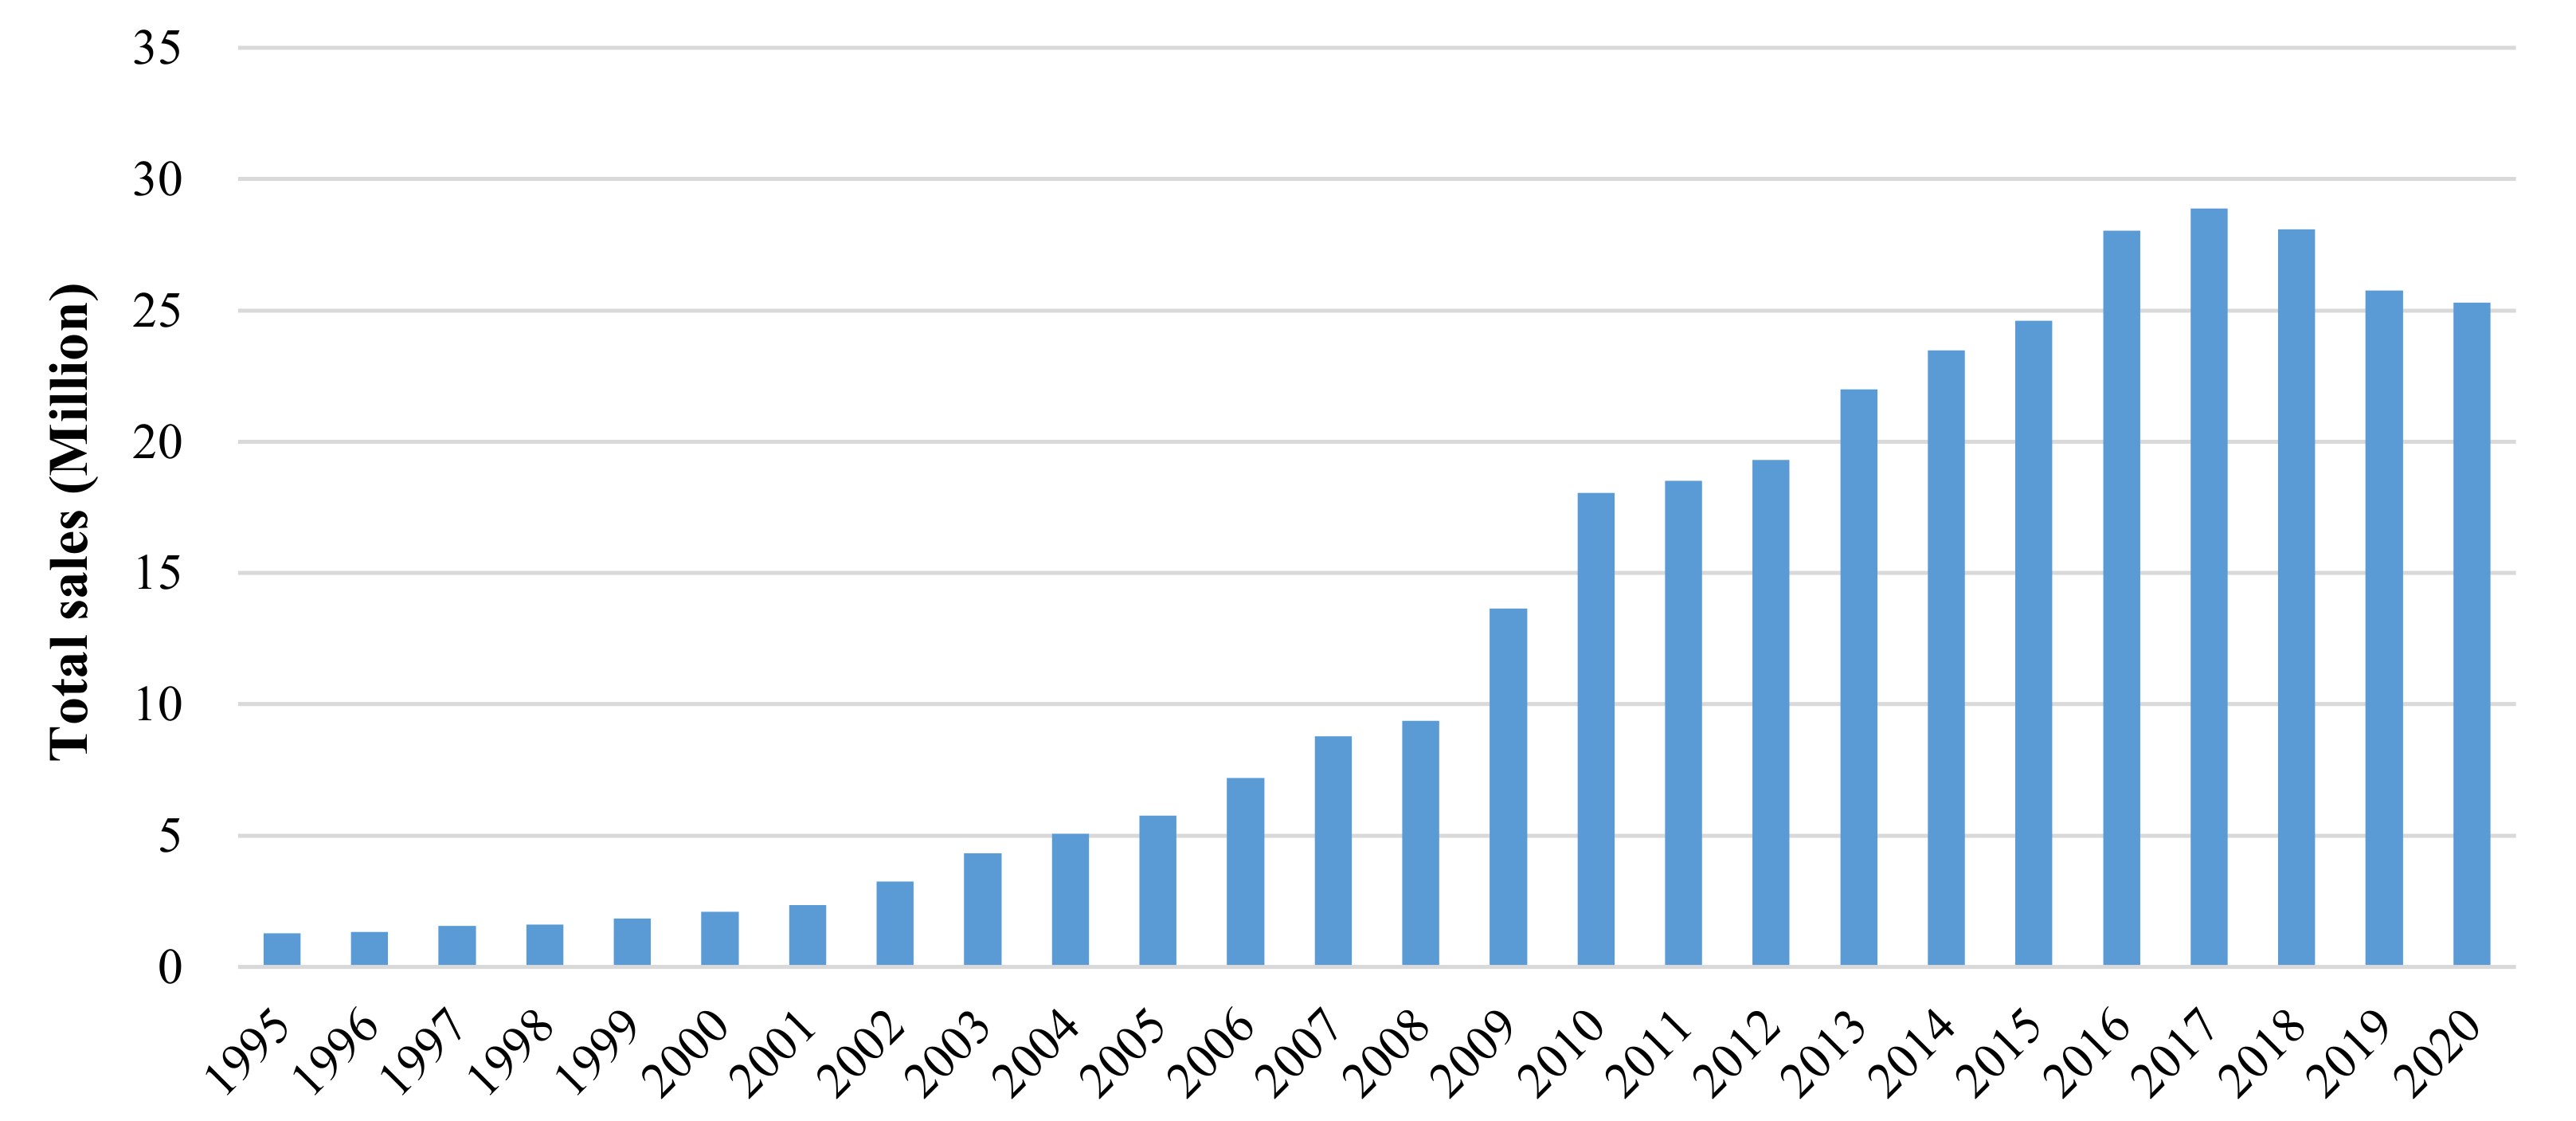
The Chinese automobile market has achieved dramatic development since 2000. From the perspective of market volume, the market ranks first in the world, accounting for about 28.2% of global automobile sales volume [
1], exceeding 20 million for 8 consecutive years since 2013. The automobile production volume and sales volume respectively declined to 25.23 million and 25.31 million in 2020, with year-on-year decreases of 2% and 1.9% [
2], due to the impacts of reduced economic growth and the Covid-19 epidemic, but the market is expected to rebound in the coming years.
Figure 1 presents the annual sales of automobiles in China from 1995 to 2020.
However, with its rapid development, China is also facing severe energy and environmental problems [
5,
6,
7]. China’s external dependence on oil has continually exceeded the 50% international safety warning line since 2009. In 2011, the number exceeded that of the United States for the first time, reaching 55.2%, and it reached 70.8% in 2019 [
6,
8], far exceeding the safety warning level. Meanwhile, influenced by the explosion of the automobile market, China has replaced the United States as the world’s largest carbon dioxide emitter since 2006, accounting for 27.6% of global carbon emissions [
9]. At the Paris Climate Summit in 2015, China proposed the goal of reducing carbon emissions per gross domestic product (GDP) by 60–65% in 2030, compared with 2005 [
10]. After that, at the 75th United Nations General Assembly in 2020, China further announced the goal of striving to reach the peak of carbon emissions before 2030 and achieve carbon neutrality before 2060 [
11].
To accelerate the cultivation and development of energy–saving and new energy vehicles, reduce the fuel consumption of vehicles, and relieve the pressure on energy and the environment, the Chinese government has issued and implemented five stages of fuel consumption regulations since 2005, as shown in
Table 1. The Phase I and Phase II national fuel consumption limits of passenger vehicles were implemented in 2005 and 2008, respectively [
12]. The Phase III regulation was implemented in 2012 [
13], which introduced the corporate average fuel consumption (CAFC) evaluation system based on the single-vehicle limit requirements, and automakers could plan their products at their option under the compliance of CAFC regulation. In 2016, China implemented the Phase IV standard, which further tightened the single-vehicle limit and reduced the CAFC targets to 5.0 L/100 km in 2020 [
14,
15].
Subsequently, China officially issued the Phase V regulations in 2019, which will be implemented since 2021, aiming to further reduce the average fuel consumption to 4.0 L/100 km (the NEDC test) in 2025 [
17,
18] and promote the market share of new energy vehicles to more than 20% [
19,
20]. Different from the past four phases regulations, the Phase V fuel consumption regulation replaces the new European driving cycle (NEDC) with the worldwide harmonized light duty test cycle (WLTC) and test procedure (WLTP), which poses great impacts on the effectiveness of energy–saving and new energy vehicle technologies [
21,
22,
23,
24], as well as the national technology roadmap and fuel consumption targets.
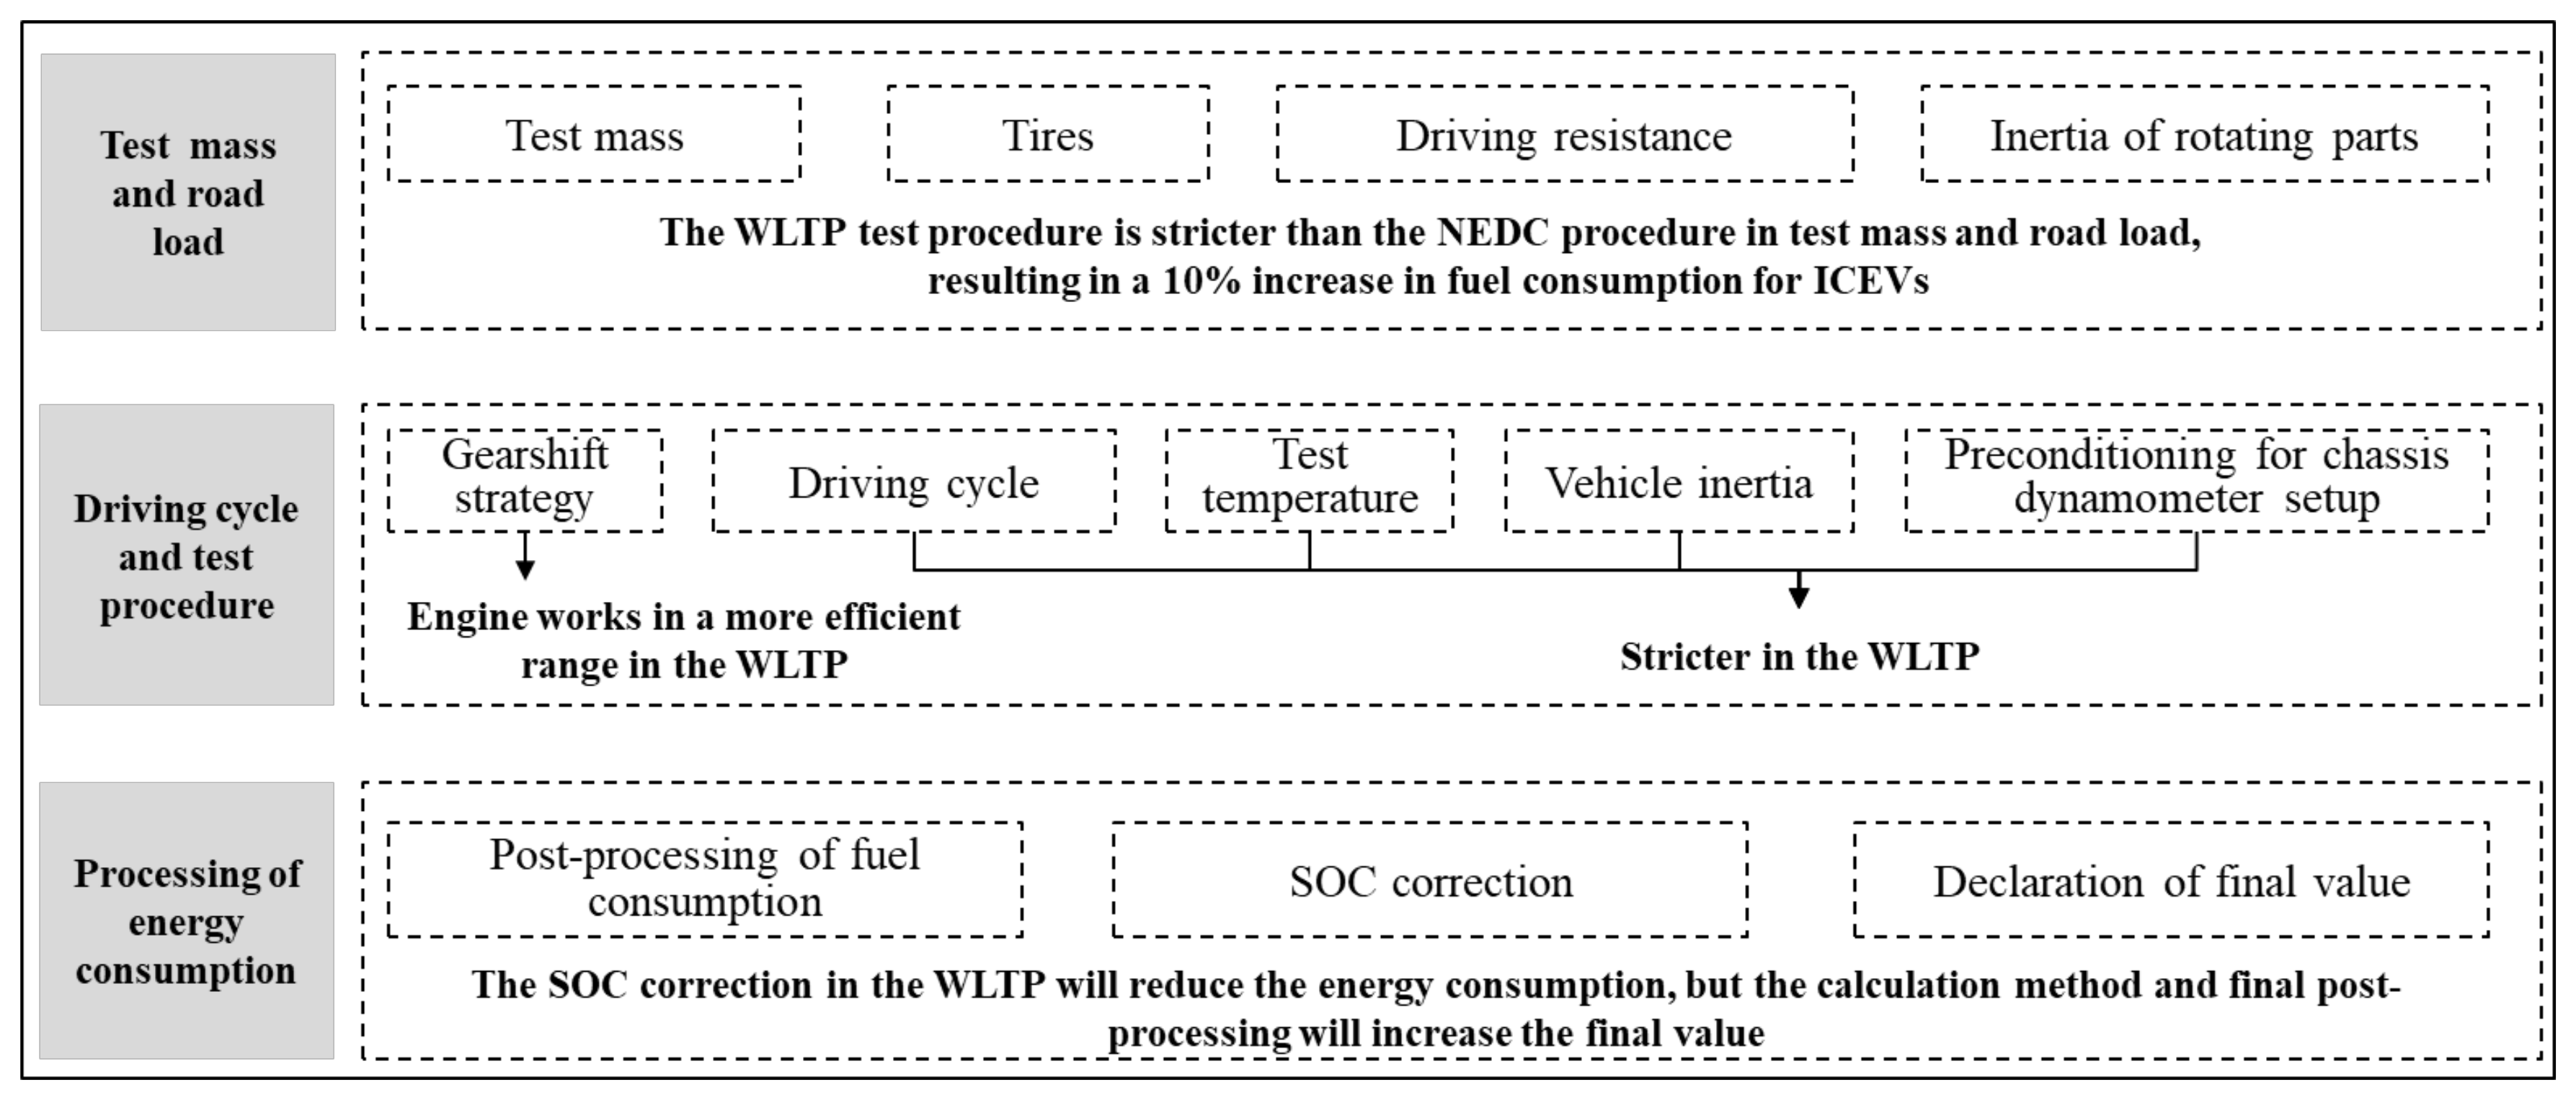
As shown in
Figure 2, the WLTP test procedure is different from the NEDC test procedure mainly in three aspects: test mass and road load, driving cycle and test procedure, and post-processing of results [
21]. From the perspective of test mass, the vehicle test mass in the NEDC method only includes the benchmark mass, which is curb weight plus 100 kg [
22]. In the WLTP, the test mass not only includes the benchmark mass but also includes the mass of optional equipment and representative vehicle load. The total test mass in the WLTP is larger than that of the NEDC procedure [
23,
24]. In terms of tire selection and tire pressure requirements, the required coefficient of tire rolling resistance is also larger in the WLTP. As for driving resistance, the road load coefficient of the NEDC is lower than that of the WLTP. In addition, the inertia of rotating parts is not taken into account in the NEDC test, which also leads to the driving resistance of the WLTP being higher than that of the NEDC.
From the perspective of the driving cycle, the acceleration and deceleration conditions are more frequent in the WLTC, and the maximum speed, as well as the average speed in the WLTC are also larger than that in the NEDC, which increases the fuel consumption of vehicles in the WLTC. In addition, the proportion of idle conditions decrease by half and the constant speed conditions decrease by 36.6%, which directly weakens the effect of hybrid electric technologies. Also, the required starting temperature of the engine has dropped from 23 °C in the NEDC to 14 °C in the WLTP [
25]. However, the gearshift strategy in the WLTP test is more flexible, which keeps the engine working in a more efficient area and reduces fuel consumption [
26].
Figure 3 depicts the relative speed and acceleration profiles over time of the NEDC and WLTC cycles.
In the post-processing of final energy consumption, more details are considered to modify the fuel consumption in charge depleting (CD) and charge sustaining (CS) modes of PHEVs, for example, the state of charge (SOC) correction in CS mode. In addition, considering the difference between the declared value and the laboratory testing value, different calculation methods are adopted to determine the final type-approved fuel consumption, which also results in a 5% higher number in the WLTP [
28].
Since the European Union has replaced the NEDC test procedure with the WLTP test procedure for fuel consumption and emission assessment of light vehicles from 2017, there is extensive research on the comparisons between the NEDC test and the WLTP test, which shows that the WLTC is closer to the real driving condition and more stringent than the NEDC. Marotta et al. tested 21 vehicles both in the NEDC and WLTP and then calculated the WLTP/NEDC emission ratio of different pollutants. The results showed that the road load and test mass have greater influence on the result of carbon emission than the driving cycle. In addition, due to the limited peak power, small vehicles with curb weight less than 1100 kg emit more carbon dioxide in the WLTP than that of the NEDC [
24]. Pavlovic et al. tested 20 gasoline vehicles and 11 diesel vehicles in the WLTP and NEDC respectively, and the results showed that with the change in time duration (increasing from 1180 s in the NEDC to 1800 s in the WLTC), test distance (increasing from 11.03 km in the NEDC to 23.27 km in the WLTC), test mass, average speed, acceleration and deceleration, idle duration, and so on, under the best and worst scenarios, carbon emissions in the WLTP test are 1% and 11% higher than that of the NEDC test, and the energy consumption is 26% and 44% higher than that of the NEDC cycle, respectively. In addition, diesel vehicles are more affected by the switching of test procedure [
21,
28]. Tsiakmakis et al. simulated the test of vehicles with different powertrains in two test cycles based on the PyCSIS model and studied the impacts on carbon emissions. The results showed that almost all vehicles have higher carbon emissions in the WLTP than in the NEDC test. The weighted average WLTP/NEDC emission ratio of the whole European fleet is 1.21, which means the introduction of the new cycle increased the tested fleet’s carbon emissions value by nearly 21%. In addition, with the increase of vehicle carbon emissions, the WLTP/NEDC ratio gradually decreases, that is, the impacts on large vehicles are smaller than that of small vehicles. In terms of different powertrains, test cycle switching has a similar impact on gasoline cars and diesel cars. The WLTP/NEDC ratios of battery electric vehicles (BEVs), fuel cell vehicles (FCVs), and hybrid electric vehicles (HEVs) are larger than that of traditional vehicles, which indicates that the test procedure switching poses a greater impact on electric vehicles [
29,
30]. Mock et al. compared the similarities and differences between the two cycles, identified the main factors, and quantified the impacts. The results showed that the changes in test mass increase the final carbon emissions and fuel consumption by 3.5%. The changes in the driving cycle and the fleet structure increase the fuel consumption and carbon emissions by 2.1% and the engine starting temperature changes bring an average 1.9% increase. Generally, the impact of test procedure switching on the carbon emission target for 2020 is 7.5% [
24].
However, few studies have systematically investigated the impacts of the new WLTP test procedure on the Chinese fuel consumption regulation, market, and technology effectiveness. On the one hand, China’s Phase V fuel consumption regulation was newly issued. The relevant research has not yet caught up. On the other hand, most of the former research aims at the European markets rather than the Chinese market, and almost all these studies focus on the vehicle level rather than the technical level.
To fill these research gaps, this study establishes a “technology–vehicle–fleet” multi-scale and bottom–up research framework to estimate the impacts of test procedure switching on technology effectiveness and regulation stringency. First, extensive technologies are identified, screened, and unified for the Chinese market, and finally, the effectiveness of 10 powertrains and 64 technologies are determined and investigated based on the Passenger car and Heavy duty Emission Model (PHEM) [
31] and multi-source data. In addition, the stringency of national CAFC regulations is analyzed from the perspective of the whole fleet, in order to provide implications and quantitative suggestions for the determinations of national fuel consumption targets and technical routes under the new phase of regulations. This study includes evaluations of technology effectiveness, predictions of fleet trends, and an explicit assessment of policy implications. The paper is organized as follows.
Section 2 describes the research framework, methodology, key assumptions, and data.
Section 3 analyzes and discusses the main results from two aspects of technology and regulation.
Section 4 presents the policy implications, proposes suggestions for the government and automakers, and summarizes the whole study.
2. Materials and Methods
In this section, the overarching framework of the research is introduced first. Then, a detailed description of the database is given, and then the specific calculation methods are explained, including the definition of the change rate of fuel consumption, technical effect, the change rate of technical effect, and the fleet impact factor.
A bottom–up research framework that is multi-scale and covers the technology level, vehicle level, and fleet level is established in this study. First, extensive technologies from different mainstream markets are identified, screened, and unified for the Chinese market. These include various combustion, electric-drive, and hybrid-drive vehicles, where a total of 10 powertrains and 64 energy–saving and new energy technologies are identified. Then, vehicles with different powertrains and technologies are simulated and investigated based on the PHEM model [
31] and multi-source data. The effectiveness of various technologies and the preference of the WLTP are also evaluated. Finally, the stringency of national CAFC regulations are analyzed from the perspective of the whole fleet based on technology effectiveness, and the predictions of fleet structure and technology penetration.
2.1. Data and Assumptions
As mentioned above, the impact of the new WLTP test procedure on the fuel consumption of vehicles and the effect of different technologies are extremely complicated and affected by a variety of factors. More accurate results can be gained from real vehicle tests or simulations. The main technical data sources of this study are simulations, and the data are modified further according to other data sources. Ricardo and TU Graz conducted extensive simulations of the impacts of different technologies on the CO2 emissions from different light-duty vehicle segments, powertrain types, and test cycles using the PHEM model [
31,
32]. Based on the original technical data from Ricardo and TU Graz [
31], data calibration, cleaning, and localization are performed through other multi-source data from Joint Research Center (JRC), US National Research Committee (NRC), International Council on Clean Transportation (ICCT), China Automotive Technology & Research Center (CATARC), Society of Automotive Engineers (SAE-China), and enterprise survey [
32,
33,
34]. The baseline passenger vehicles in the Chinese market are divided into four segments: small (A00 and A0), compact (A), midsize (B), and large (C and D). Since the factor measured in the Chinese market is fuel consumption rather than carbon emission, the original carbon emission data are converted to fuel consumption by the ICCT energy consumption conversion model [
35].
On the processing of various technologies from different mainstream markets, we identify the concepts and technical principle of all advanced energy–saving and new energy technologies, and we screen and unify all these technologies for the Chinese market, as shown in
Table 2. The 4 categories (engine, transmission, vehicle and accessory, electric), as well as the assignments of 64 different technologies, are set according to the technology attributes, which are widely used by the US NRC, Environmental Protection Agency (EPA), and other official institutes.
The market data for China’s passenger vehicles are mainly from the historical and prediction material published by the Chinese government, CATARC, SAE–China, China Passenger Car Association (CPCA), etc. [
1,
3,
4,
36,
37]. The technology penetration rate data is determined according to the technology pathway selection and optimization model [
38,
39,
40] and the newly issued Energy–saving and New Energy Technology Roadmap 2.0 [
41]. Parameters of baseline vehicles are shown in
Table 3.
2.2. Calculation Methods
The specific calculation methods are explained in this section. Main indicators including the change rate of fuel consumption, technology effectiveness, the change rate of technology effectiveness, and the fleet impact factor, are defined and indicated in Equations (1)–(6). For a certain year within the time frame (2015, 2020, 2025, 2030), we investigate the impact from these indicators.
where
i represents the vehicle segment, including four types: small, compact, midsize, and large;
j represents the powertrain type, including ICE gasoline, ICE diesel, Start–stop, Micro hybrid, Mild hybrid, Strong hybrid, PHEV, REEV, BEV, FCV;
fi,j,WLTP represents the fuel consumption of vehicle with segment i, powertrain j in the WLTP test;
fi,j,NEDC represents the fuel consumption of vehicle with segment i, powertrain j in the NEDC test;
ri,j represents the fuel consumption change rate of vehicle with segment i, powertrain j between two test procedures, which represents the attributes of baseline vehicles. The larger the ri,j, the higher the test cycle-switching impact on the fuel consumption of the baseline vehicle.
where
k represents the type of advanced energy–saving and new energy technology, including 64 kinds of technologies; and
ri,j,k represents the fuel consumption change rate of vehicle with technology
k, segment
i, and powertrain
j between two test procedures. The larger the r
i,j,k, the higher the test cycle-switching impact on fuel consumption of single vehicle with technology
k.
where
Ei,j,k,NEDC represents the effectiveness of technology
k deployed in vehicle with segment
i, powertrain
j in the NEDC test. The larger the
Ei,j,k,NEDC, the higher the technology effectiveness in the NEDC test.
fi,j,0,NEDC represents the fuel consumption of the vehicle (segment i, powertrain j) without technology k in the NEDC test;
where
Ei,j,k,WLTP represent the effectiveness of technology
k deployed in vehicle with segment
i, powertrain
j in the WLTP test. The larger the
Ei,j,k,WLTP, the higher the technology effectiveness in the WLTP test.
where Δ
Ei,j,k represent the effectiveness difference of technology
k deployed in vehicle with segment
i, powertrain
j between two tests. The larger the Δ
Ei,j,k, the higher the test cycle-switching impact on effectiveness of single technology.
where
wi represents the penetration rate of vehicle with segment
i;
wi,j represents the penetration rate of vehicle with segment i, powertrain j;
wi,j,k represent the penetration rate of technology k deployed in vehicle with segment i, powertrain j;
Pfleet represents the impact factor of test procedure switching on the fleet.
The effectiveness changes of various technologies will pose an impact on the fuel consumption of vehicles. Combined with the penetrations of vehicles and technologies, the final change of fleet fuel consumption could be obtained. Pfleet represents the change rate of fleet fuel consumption caused by the test cycle switching. In addition, the larger the Pfleet, the higher the test cycle switching impact on fuel consumption of the whole fleet.
3. Results and Discussion
As mentioned above, an important difference between China’s Phase V fuel consumption and the previous four phase regulations is the change of the test procedure, from NEDC to WLTC, where new indicators are based on the WLTP test. The new test procedure will pose a significant impact on vehicle fuel consumption, regulations, and technology routes. In this section, the effectiveness of 10 powertrains and 64 technologies are investigated, and the stringency of national CAFC regulations is analyzed from the perspective of the whole fleet, in order to provide implications and quantitative suggestions for the determinations of national fuel consumption targets and technical routes under the new phase of regulations.
3.1. Impacts on the Effectiveness of Energy–Saving and New Energy Technologies
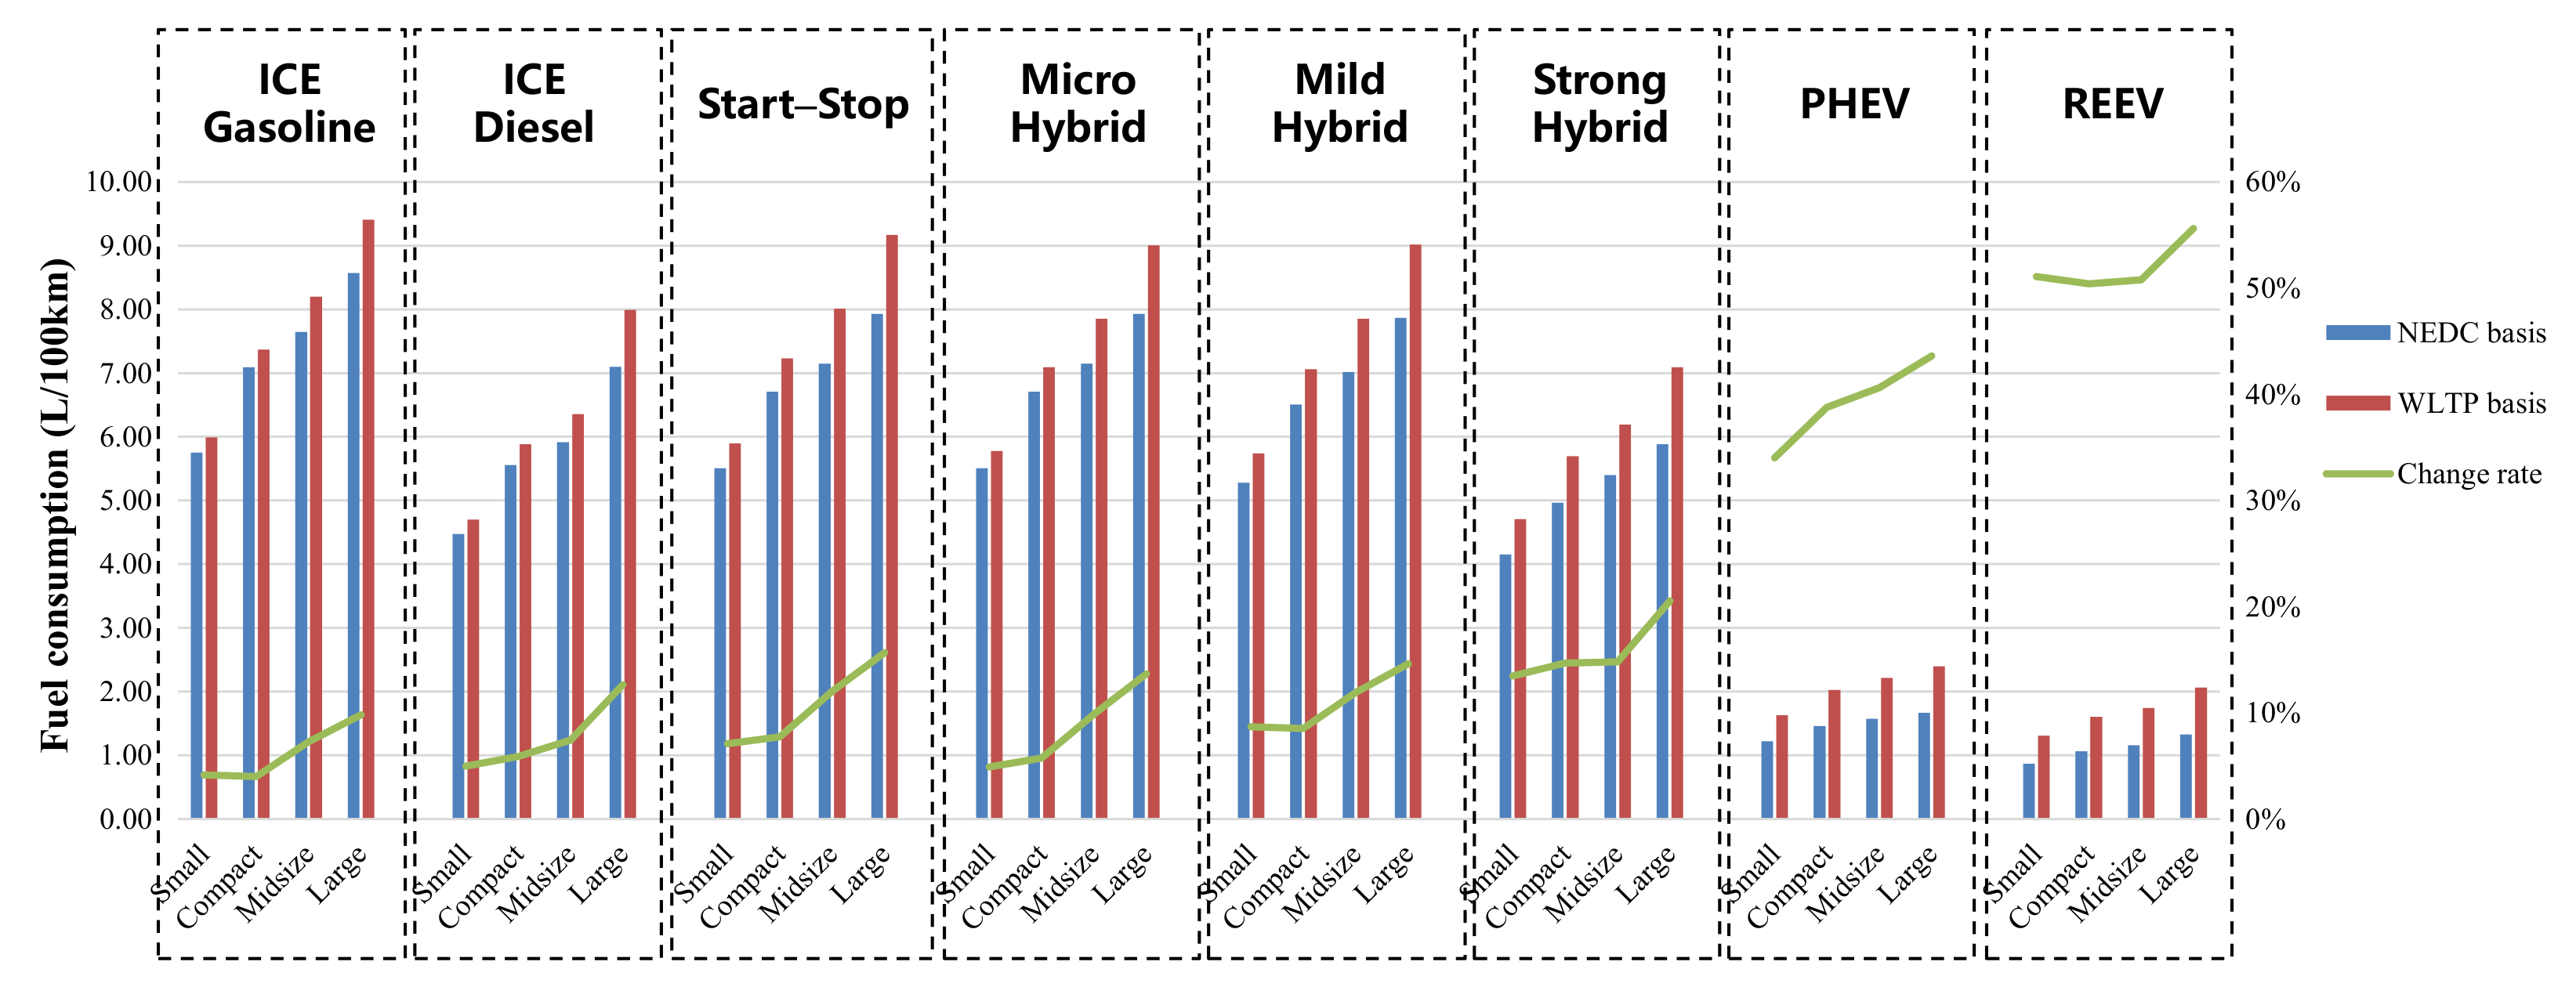
The baseline vehicles in this study are vehicles in four segments with 10 different powertrains. Since the fuel consumption of BEVs and FCVs is calculated as 0 in the Phase V regulation, the change of test procedures has no effect on the fuel consumption. So, they are not presented in this part. The fuel consumption of different baseline vehicles is shown in
Figure 4.
It can be seen from the simulation results of fuel consumption of baseline vehicles that the comprehensive fuel consumption of almost all vehicles, whether gasoline or diesel, in the WLTP is higher than that in the NEDC. The fuel consumption difference between different test procedures gradually increases with the increase of vehicle mass. Compared with gasoline vehicles, diesel vehicles are more impacted by the transition of test procedure from NEDC to WLTP, although diesel vehicles have lower fuel consumption. From the perspective of electrification degree, vehicles with higher electrification are more effected by the transition. Among them, PHEVs and REEVs are the most affected, mainly due to the significant change of driving cycle and the calculation method of energy consumption. However, the fuel economy rankings have not been changed; vehicles with a higher electrification degree still have higher fuel economy, no matter in which test procedure.
Specifically, in terms of the energy–saving effects of various advanced technologies in NEDC and WLTP,
Figure 5,
Figure 6,
Figure 7 and
Figure 8 show the effectiveness of 64 technologies in four categories, including advanced gasoline engine technology, advanced diesel engine technology, transmission and electric technology, and vehicle and accessory technology under different test cycles and at different time points.
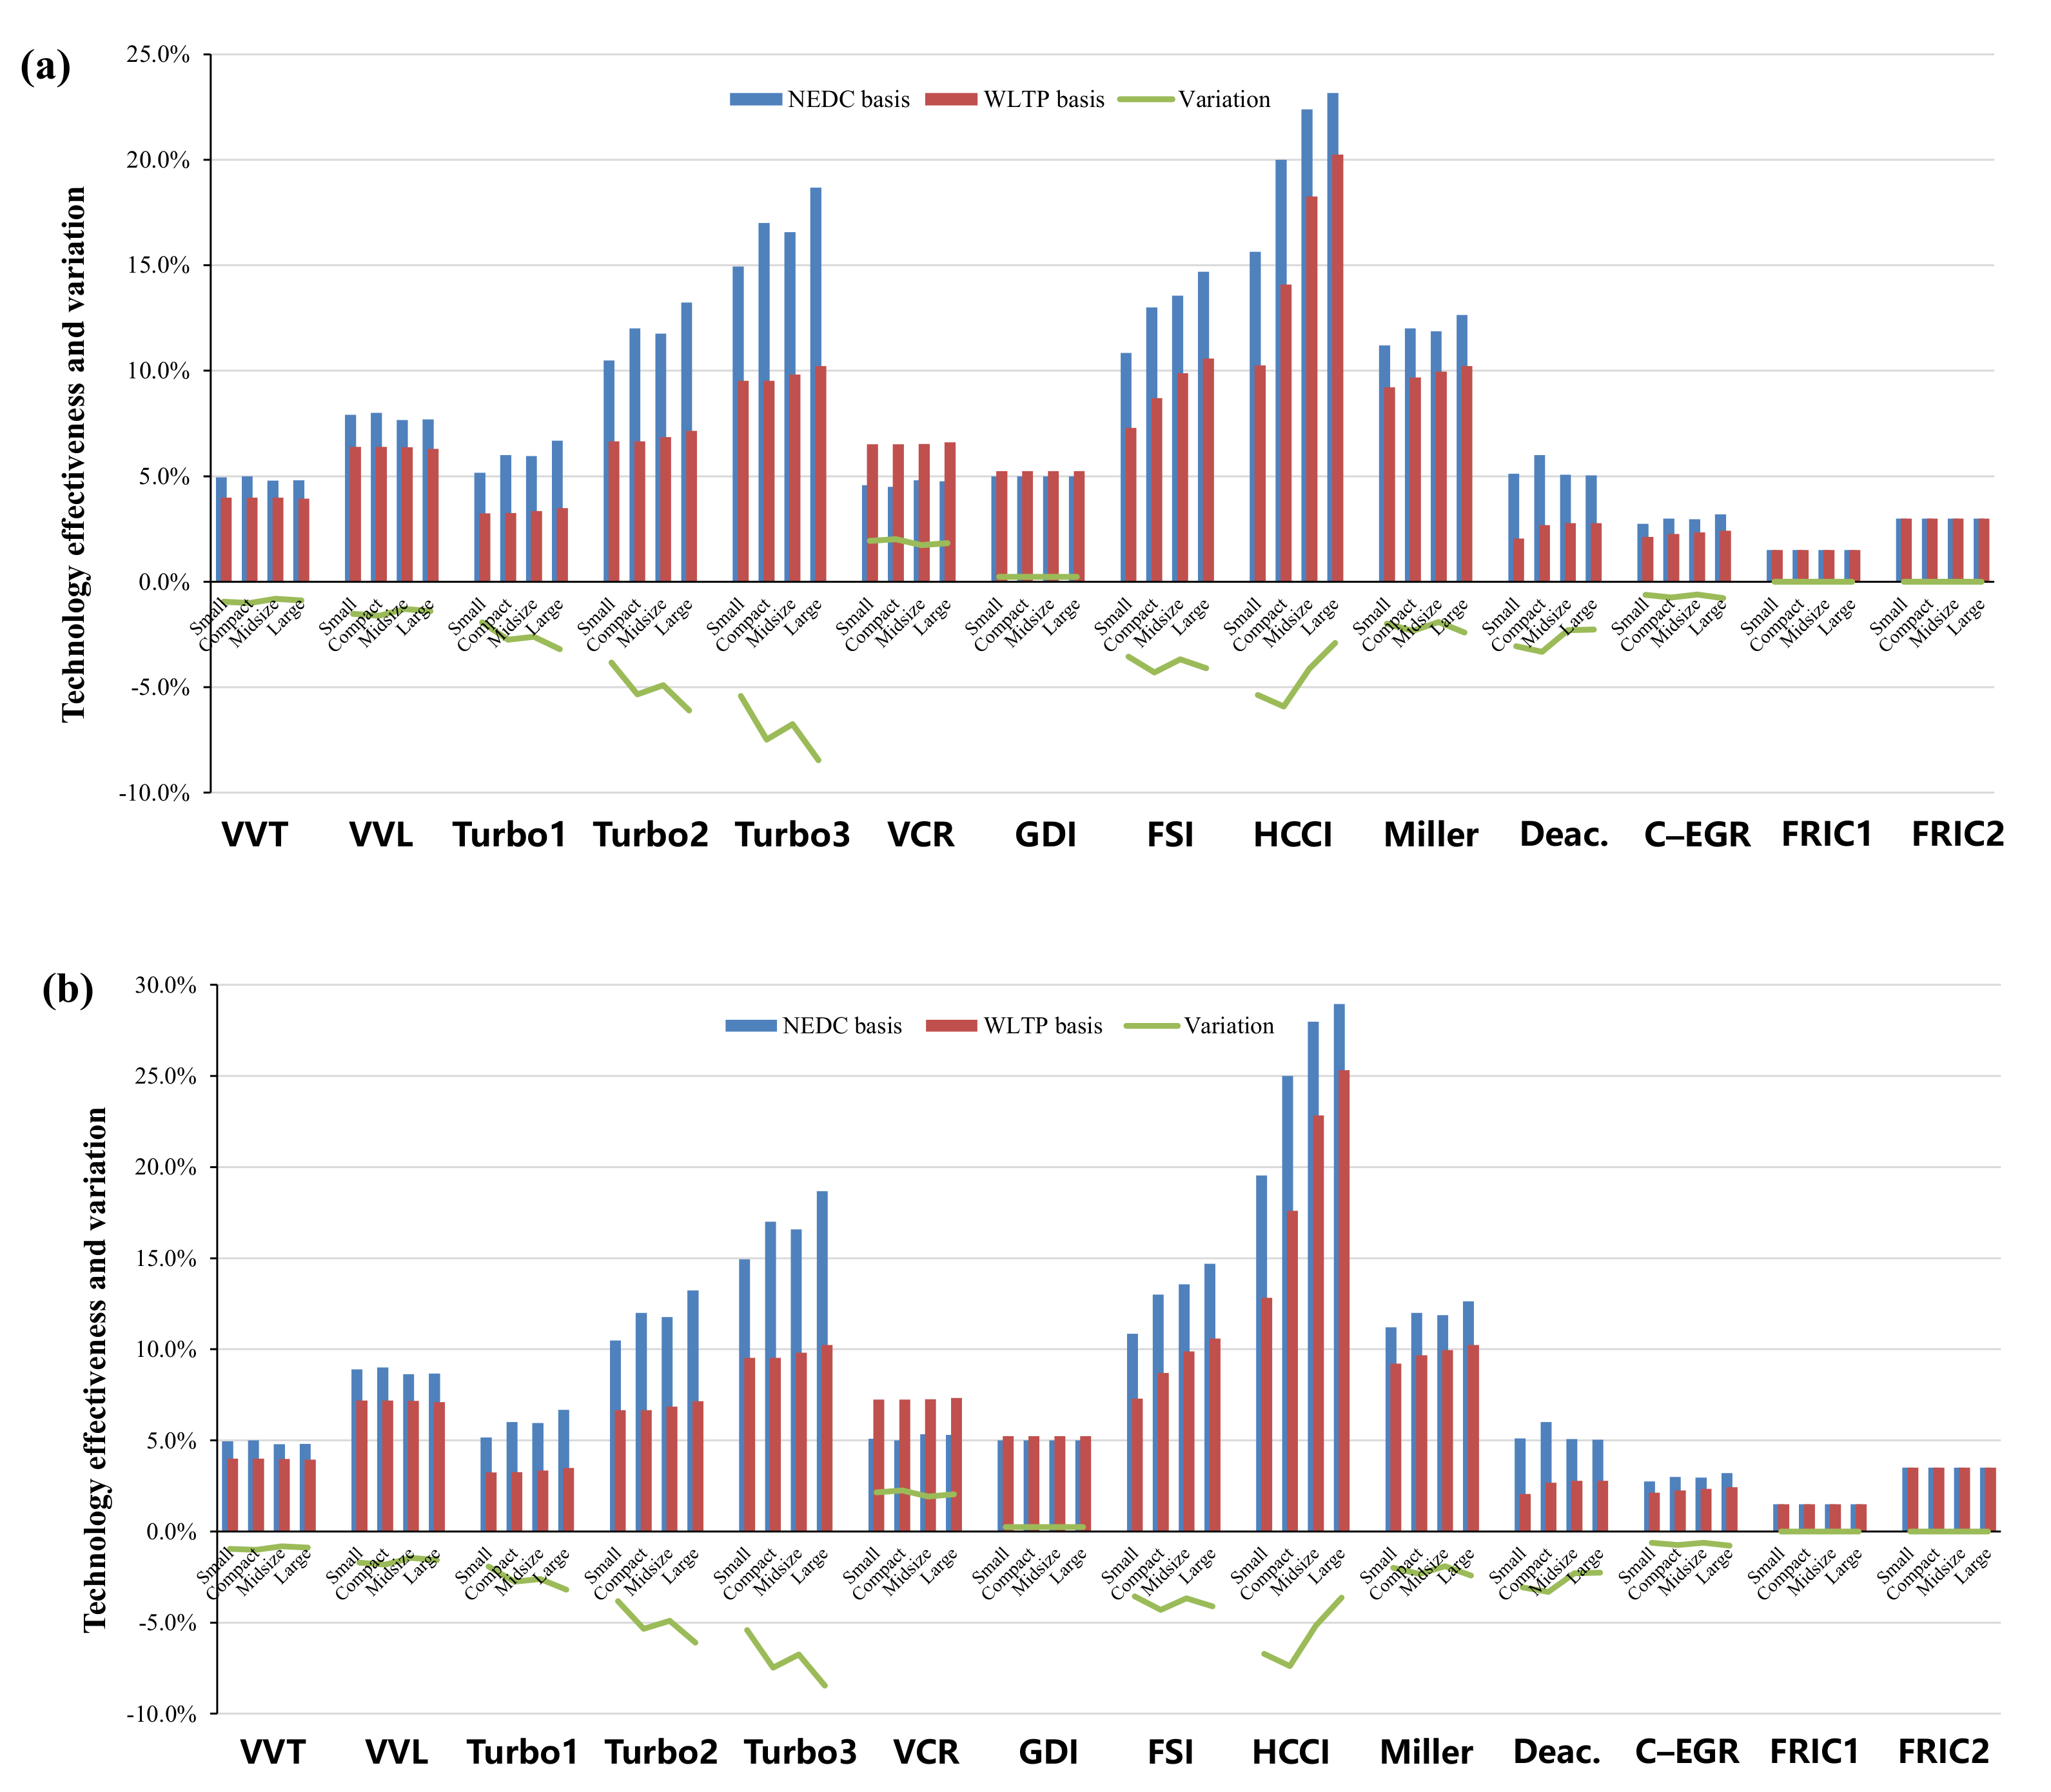
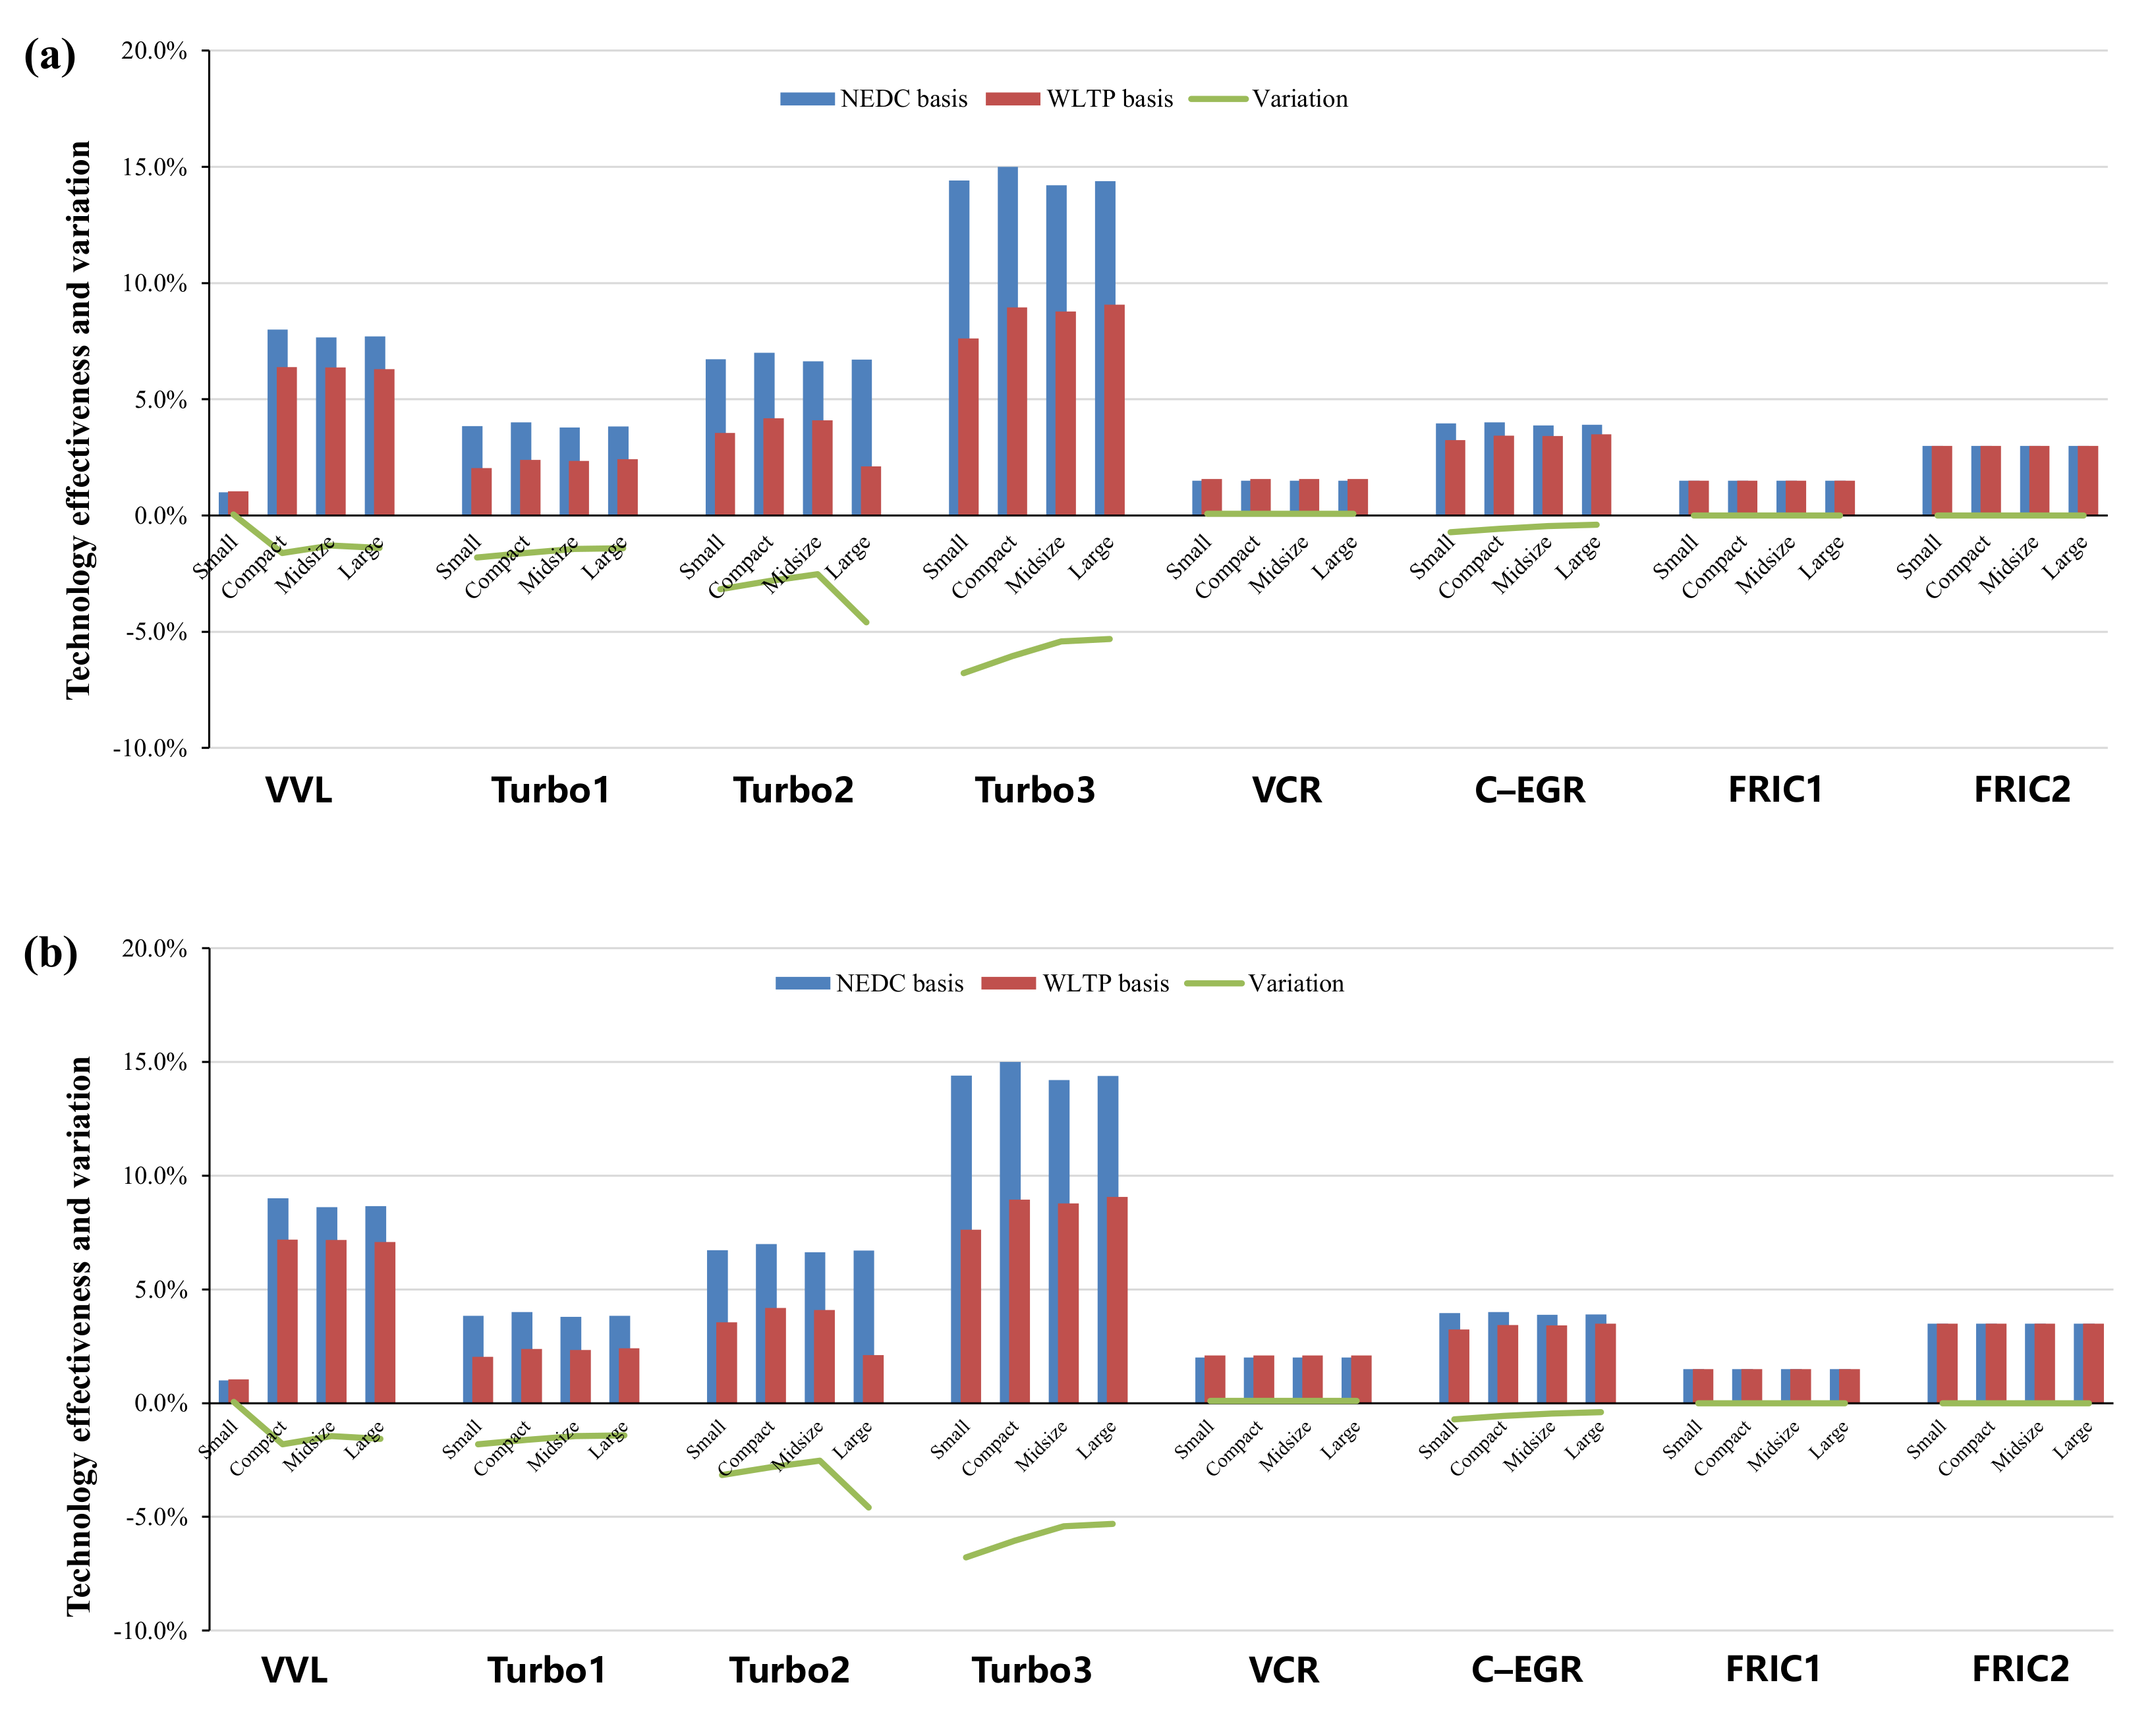
As shown in
Figure 5a,b, among all gasoline technologies, homogeneous charge compression ignition (HCCI) has the greatest energy–saving potential. In 2030, the highest effectiveness in the WLTP of HCCI can reach about 25%, followed by turbocharging and the Miller cycle, which reach 16.6% and 12.6%, respectively. The effects of technologies that could gain more obvious effects under low load conditions (turbocharging and downsizing, cylinder deactivation, FSI, HCCI, VVT) are generally deteriorated in the WLTP test. Of these, the turbocharging and downsizing technology is facing the largest impact, with a maximum decline of 8.5%. As for cylinder deactivation, FSI, HCCI, and VVT technologies, the decline range is respectively 1.9–3.3%, 2.5–4.3%, 0.8–7.4%, and 0.5–1% for different segments. The VCR and SGDI technologies are the few technologies that benefit from the WLTP test due to the higher load variation, where the effectiveness of VCR increases by 1.6% and that of SGDI increases by 0.2% on average. In addition, there is no effect on the friction reduction technology of gasoline engines.
In terms of advanced diesel engine technologies, the effects of turbocharging and downsizing also drop off significantly, with a decrease of 1.4–6.8%, as shown in
Figure 6. The effectiveness of VCR increases by about 0.1% in the WLTP. The friction reduction technology of diesel engines is also almost not affected by the change of test procedure.
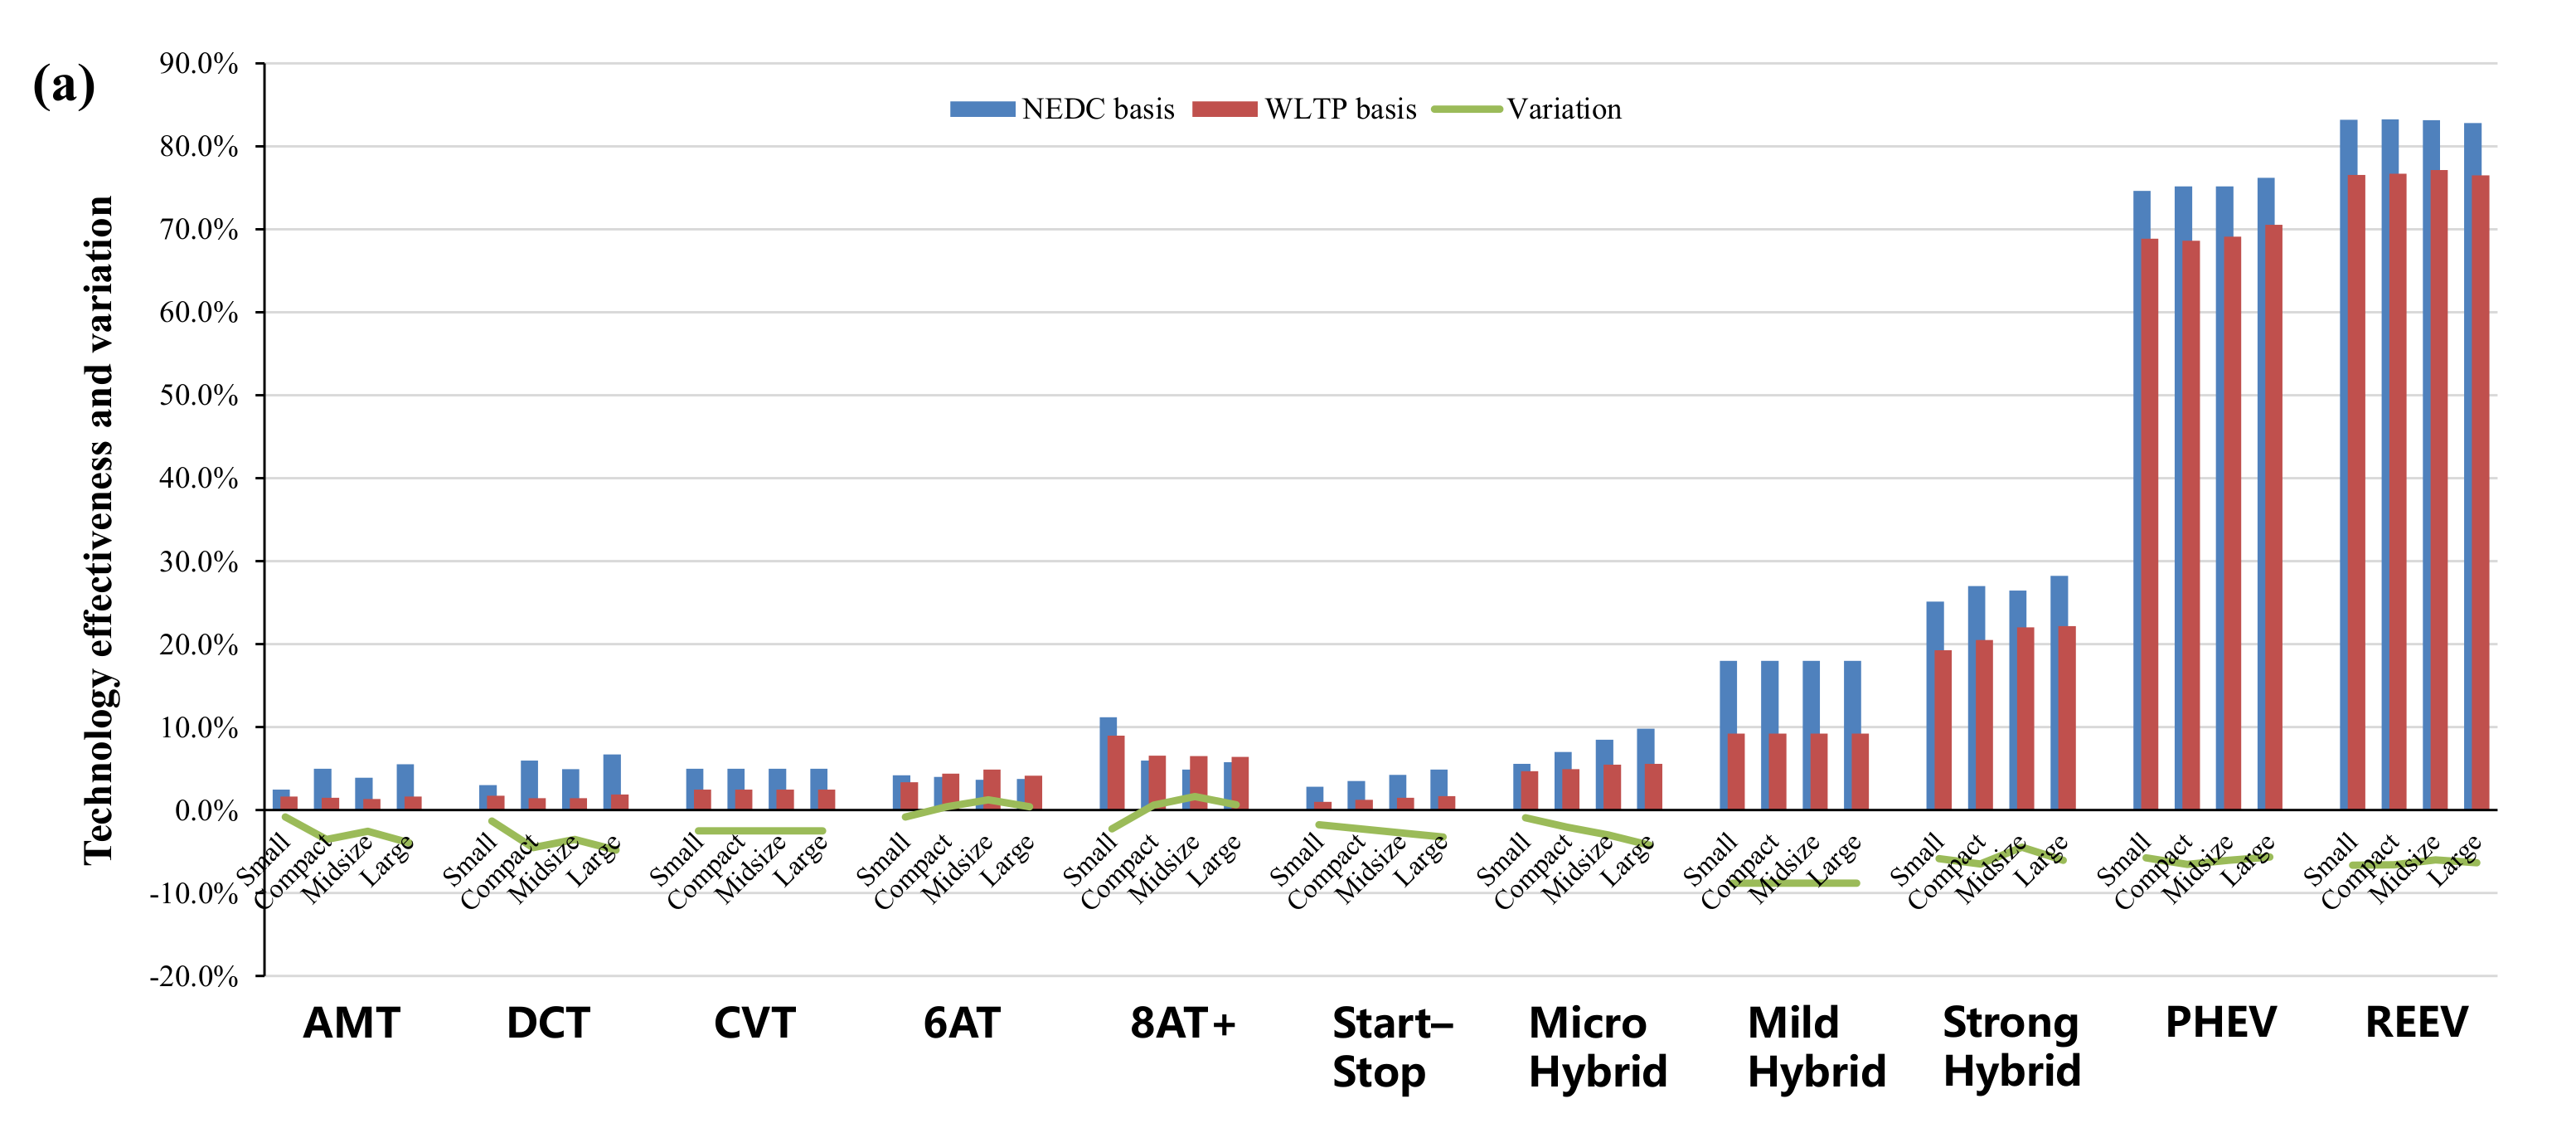
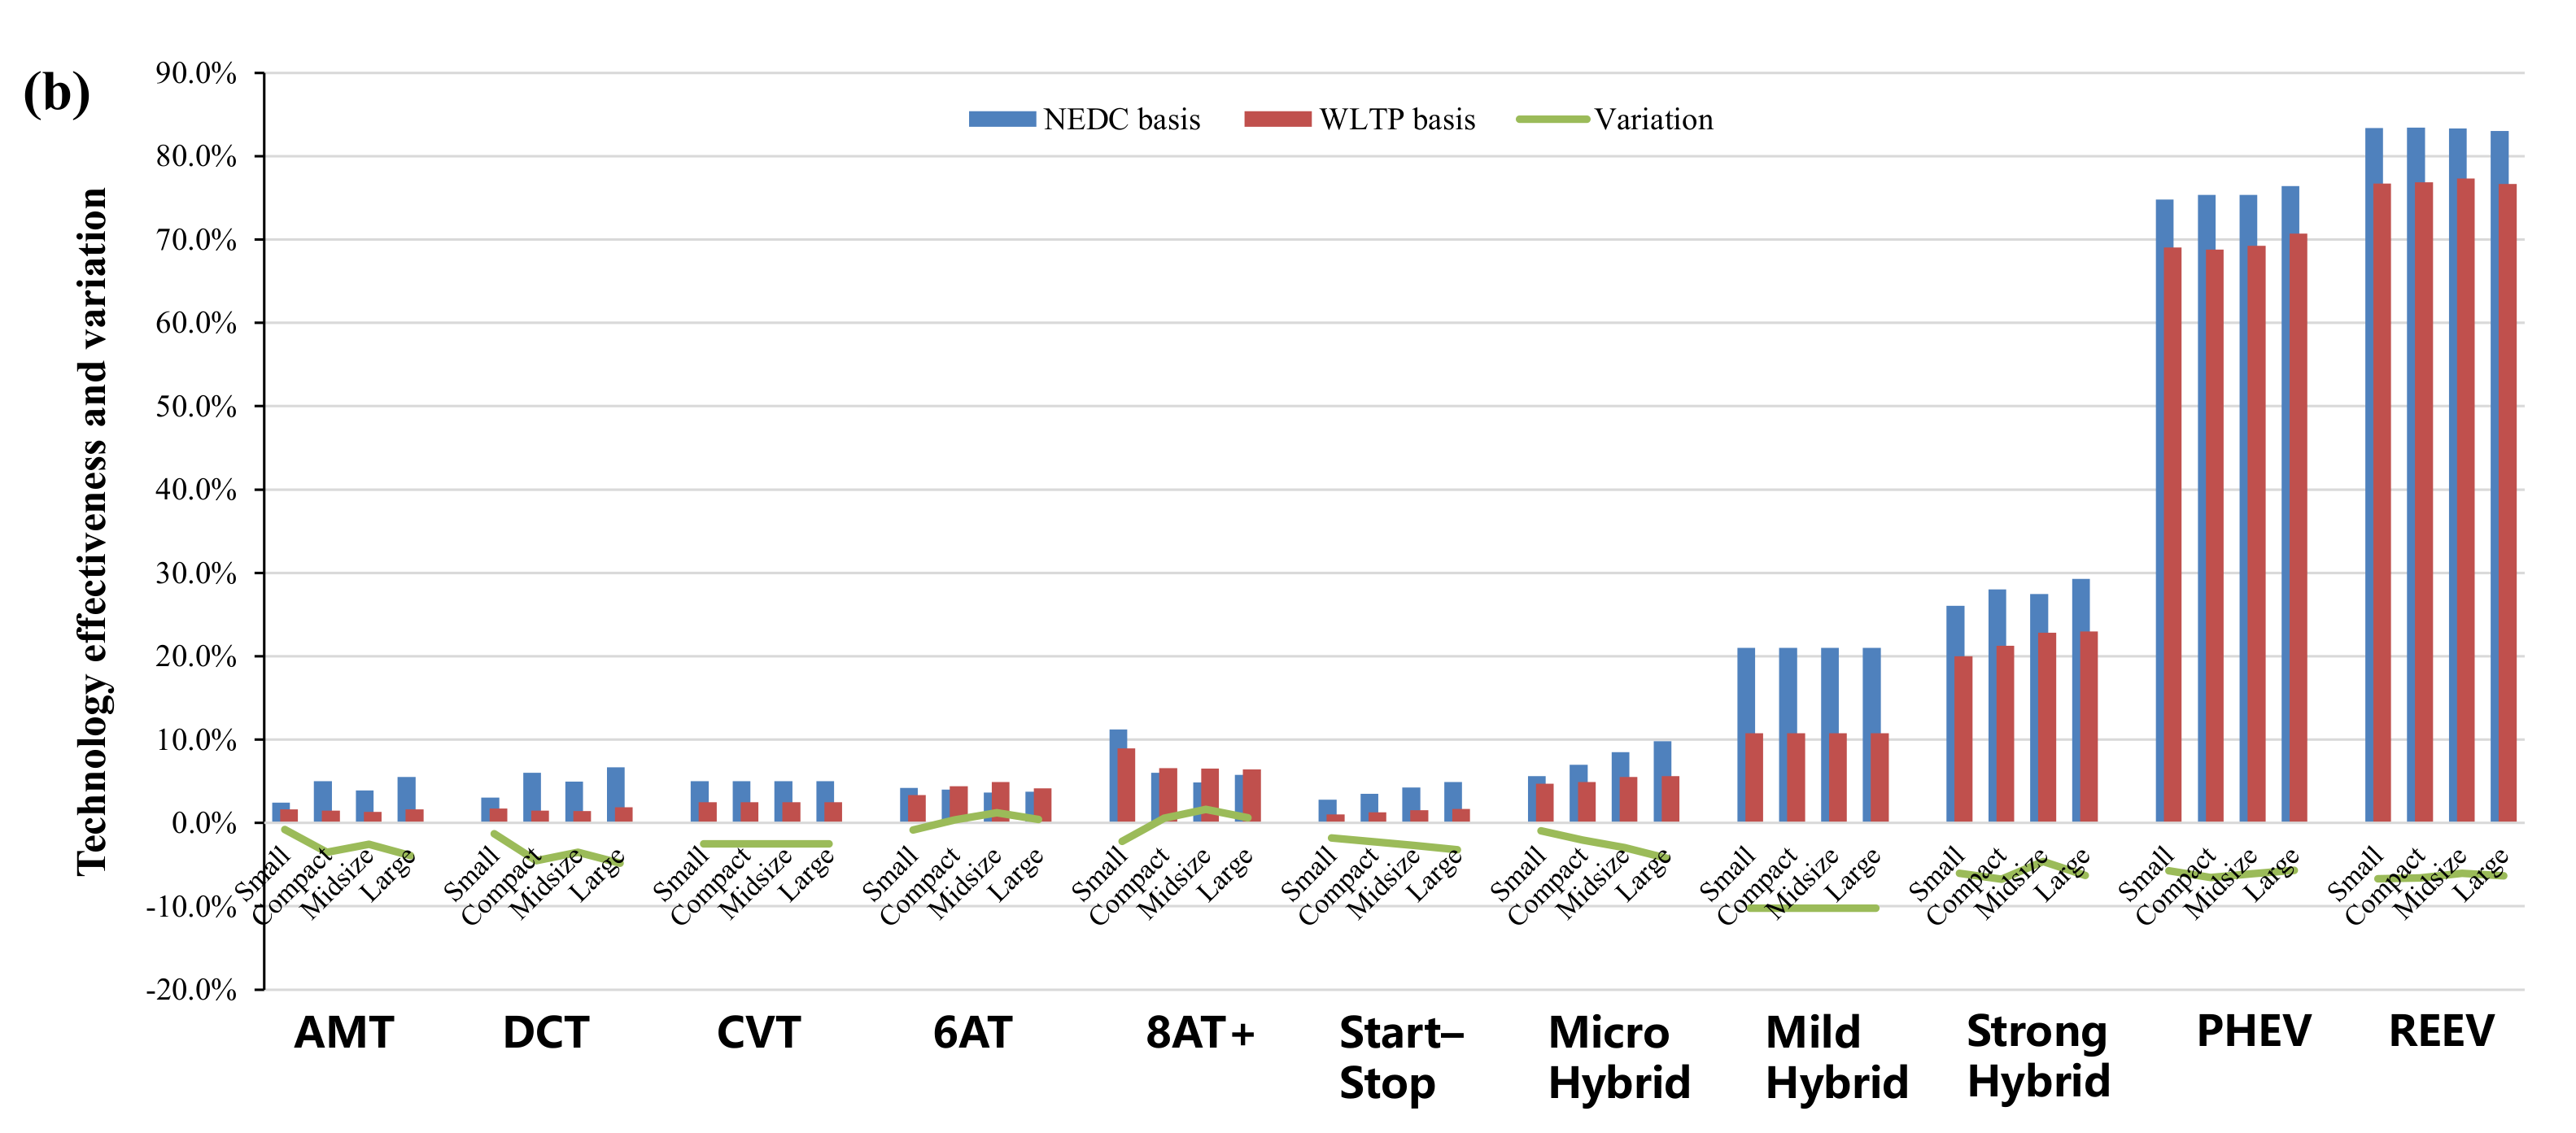
With regard to the transmission technologies, the multi–speed technology has more obvious advantages under the WLTP test which contains higher average speed and more transient conditions, as shown in
Figure 7. However, the effectiveness of other automatic transmissions decrease in the WLTP test.
In terms of electric technologies, also shown in
Figure 7, compared to the NEDC cycle, the percentage of idle conditions in the WLTP driving cycle has fallen sharply. Thus, the effects of hybrid electric technologies, such as start–stop and mild hybrid technologies, are significantly lower than that in the NEDC test. As for PHEVs and REEVs, the fuel-saving effects of PHEVs and REEVs under the WLTP test procedure is about 6% lower than that under the NEDC procedure due to the change of driving cycle and energy consumption calculation method.
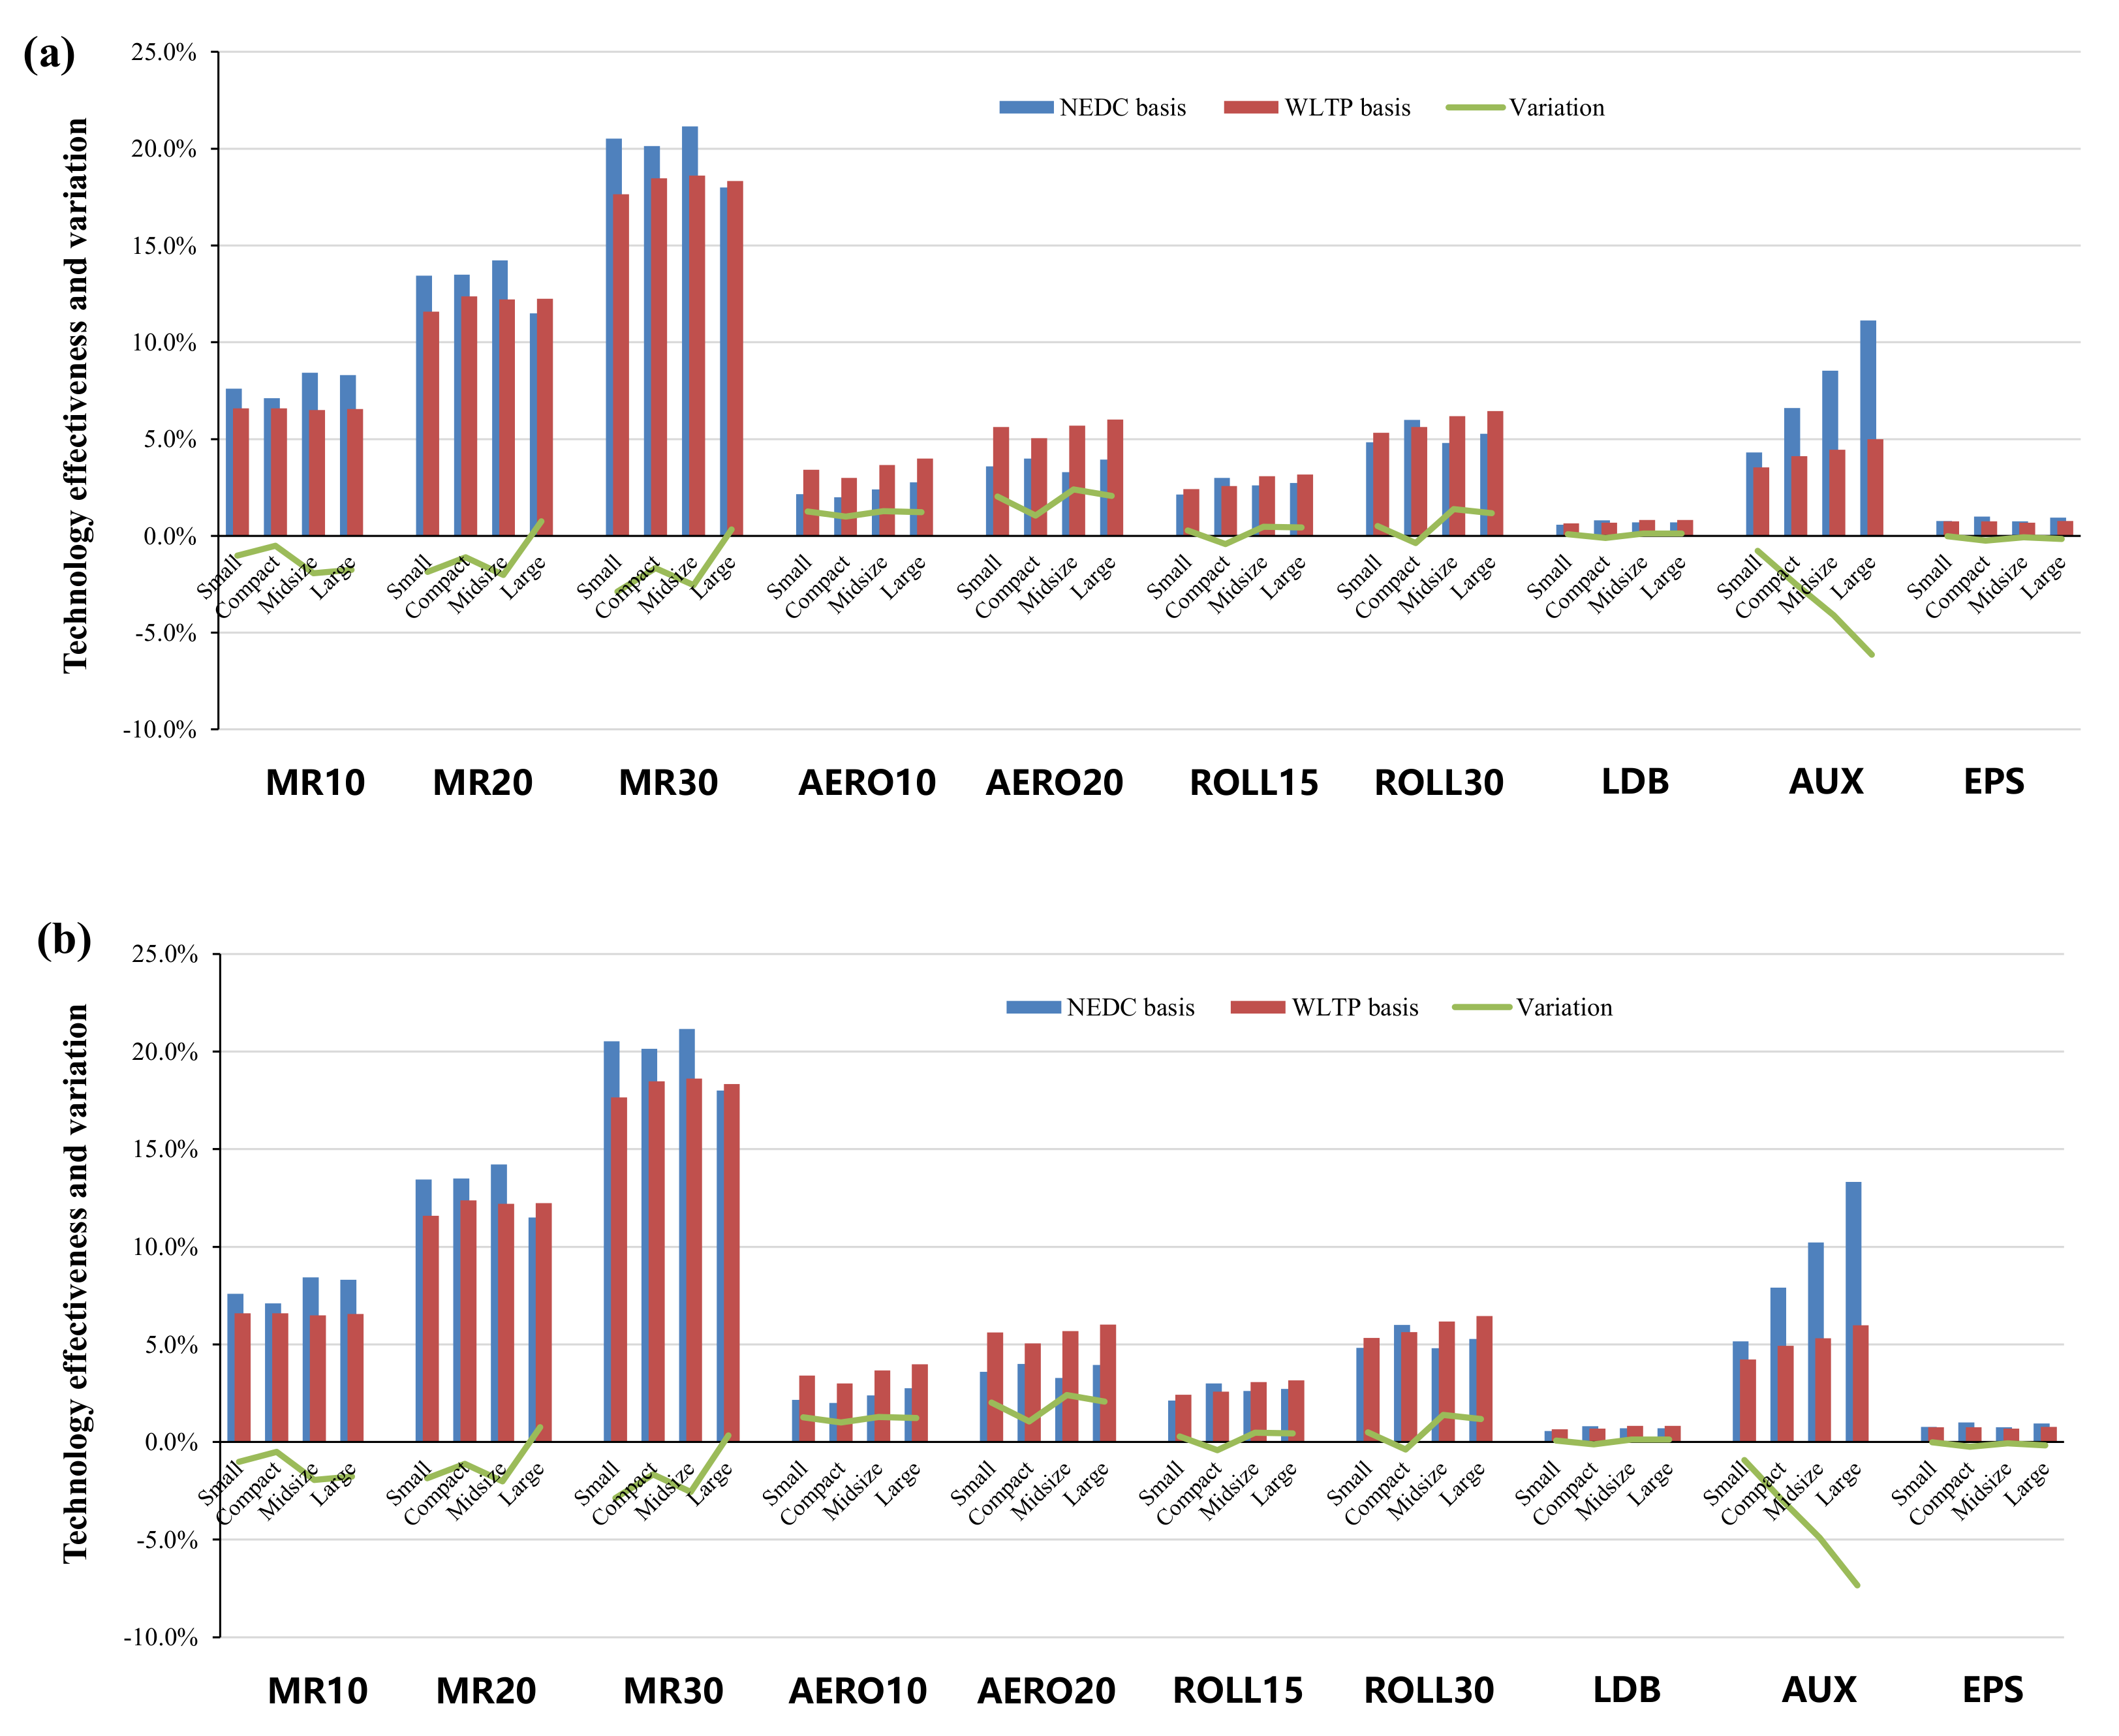
We also examined vehicle and accessory technologies, where a high level of lightweight technology (20–30% lightweight rate) applied to large vehicles under the WLTP show increased effectiveness compared with that of the NEDC, while the energy–saving effect is decreased for other technologies. Due to the higher speed in the WLTP, the effectiveness of low wind resistance, low rolling resistance, and low drag braking is improved by about 1.2–2.4%, 0.4–1.4%, and 0.1%, respectively. The auxiliary systems efficiency improvement (AUX) and electric power steering (EPS) are faced with decreased effectiveness, and the deterioration of AUX is more obvious with a range of 0.8–6.1%, where the larger the model, the more serious the deterioration will be.
3.2. Impacts on the Stringency of National Fuel Consumption Regulations
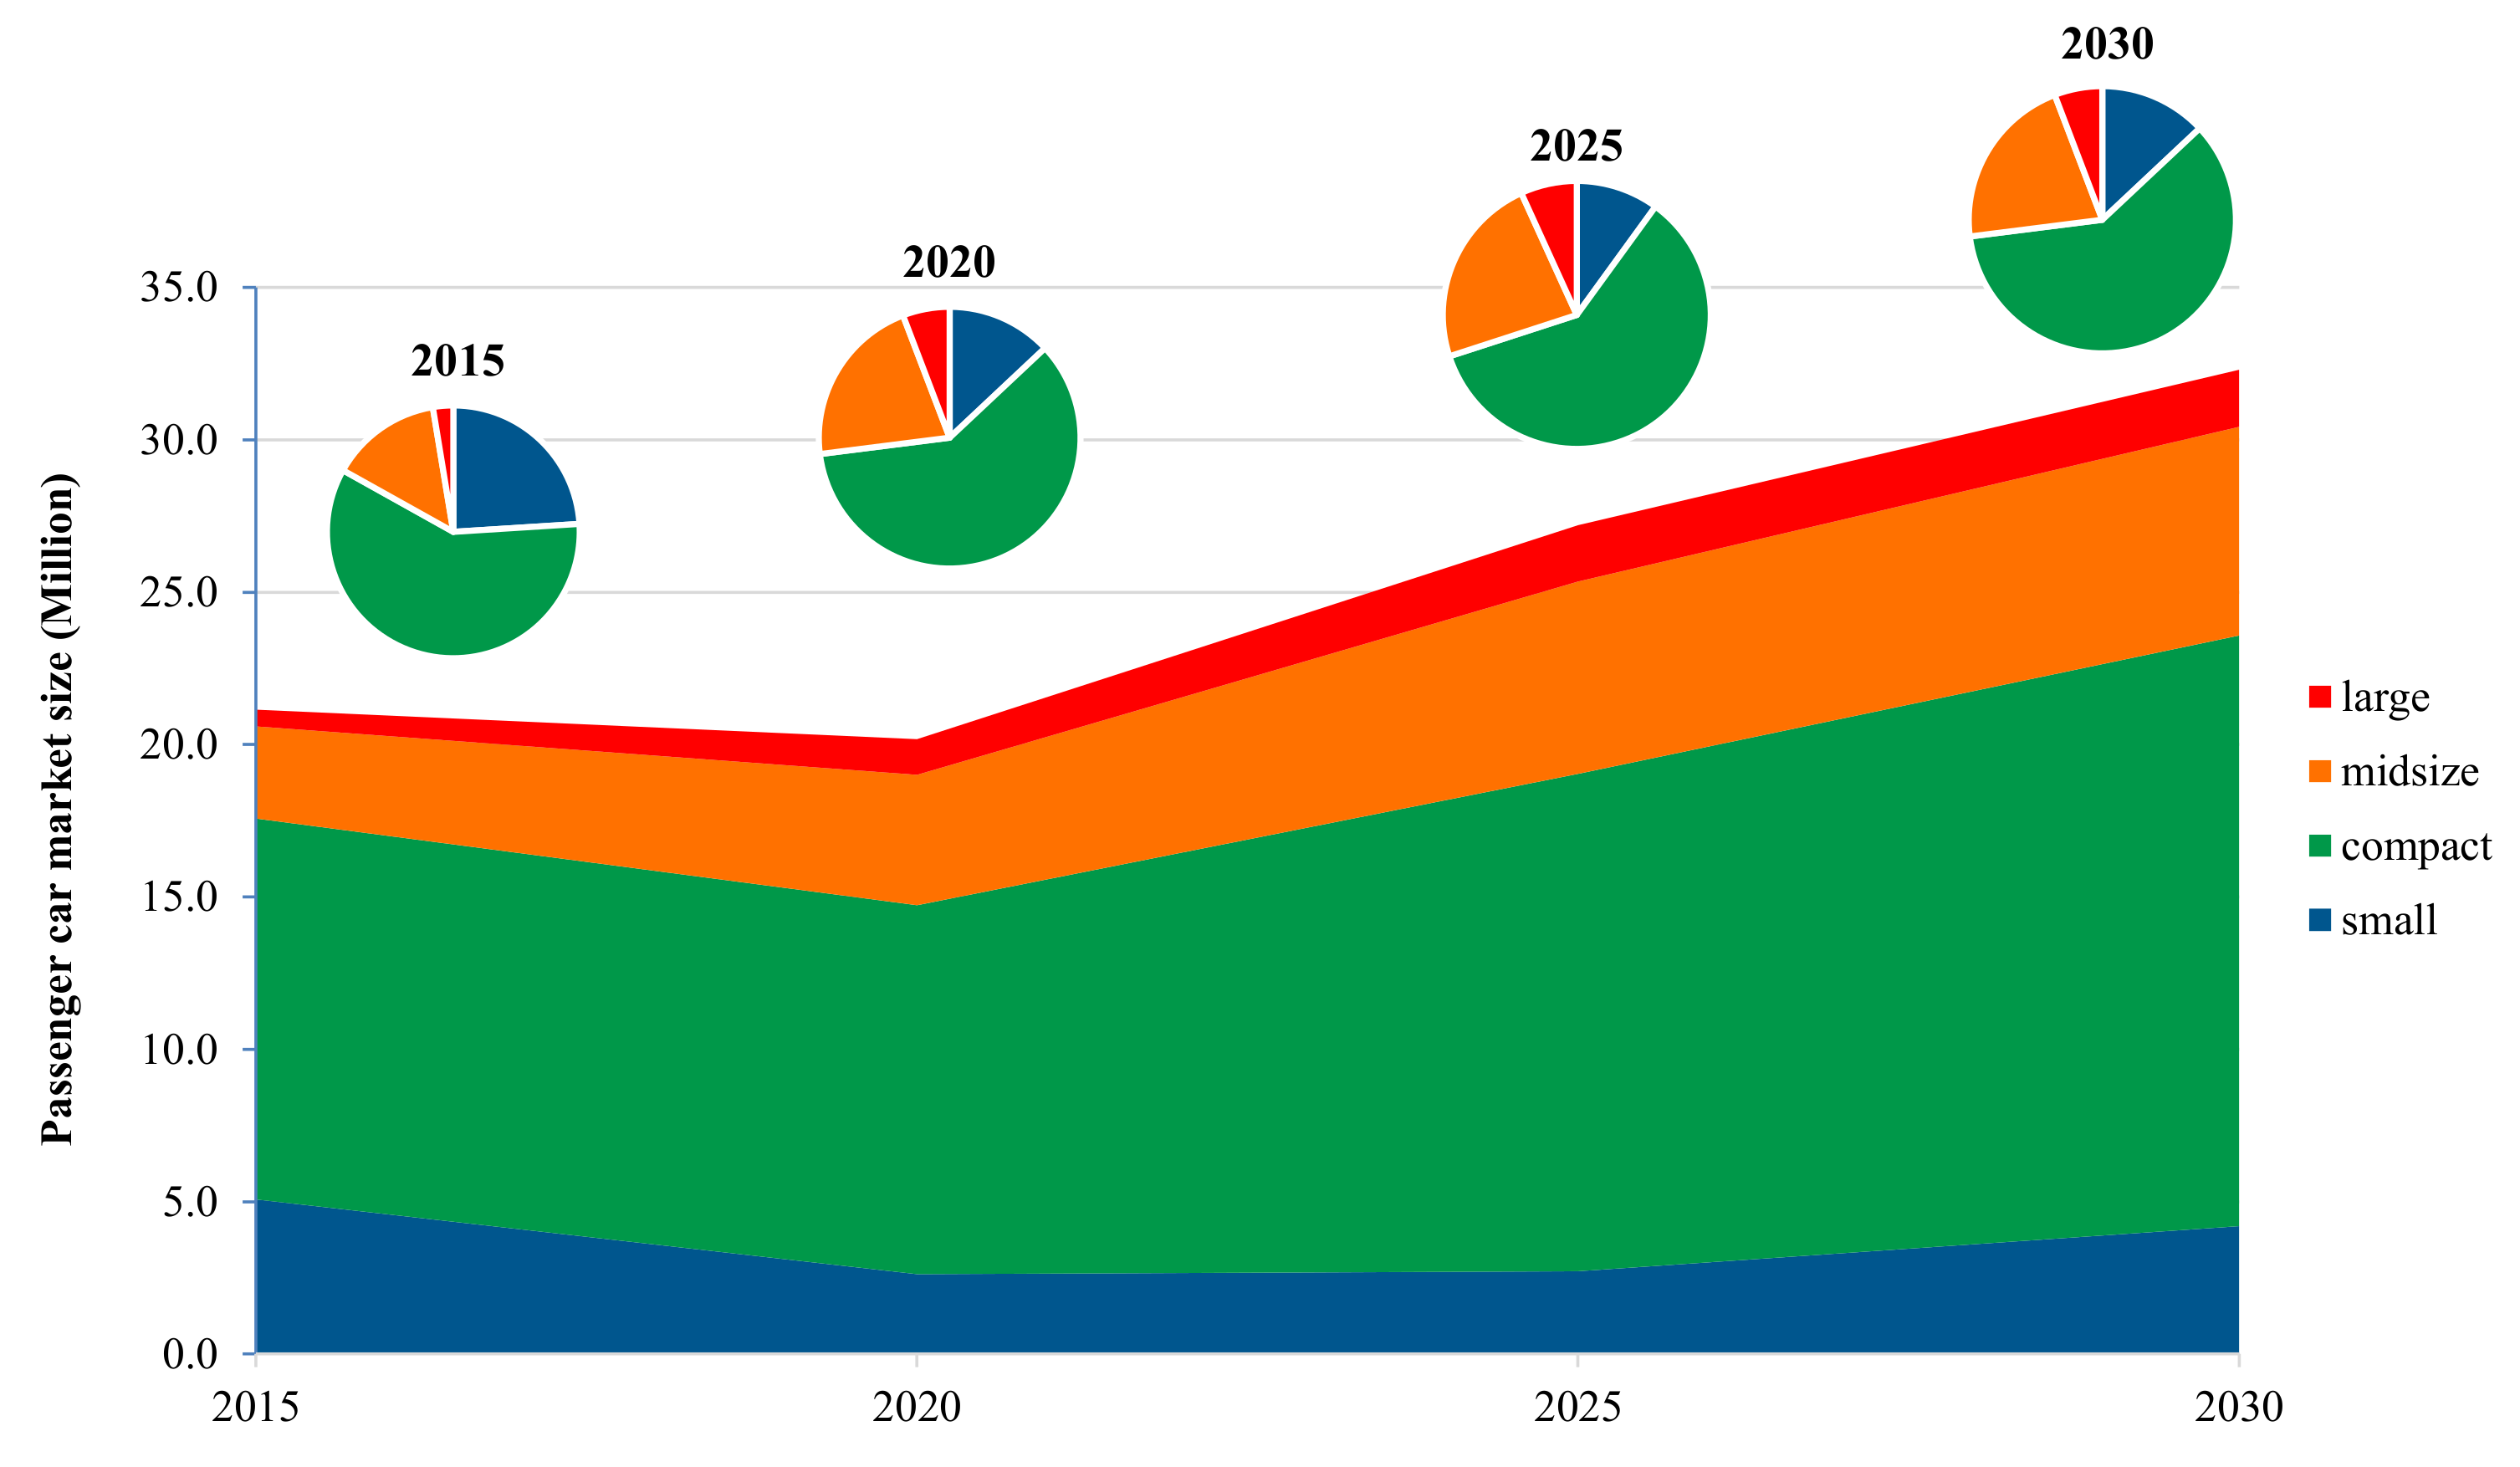
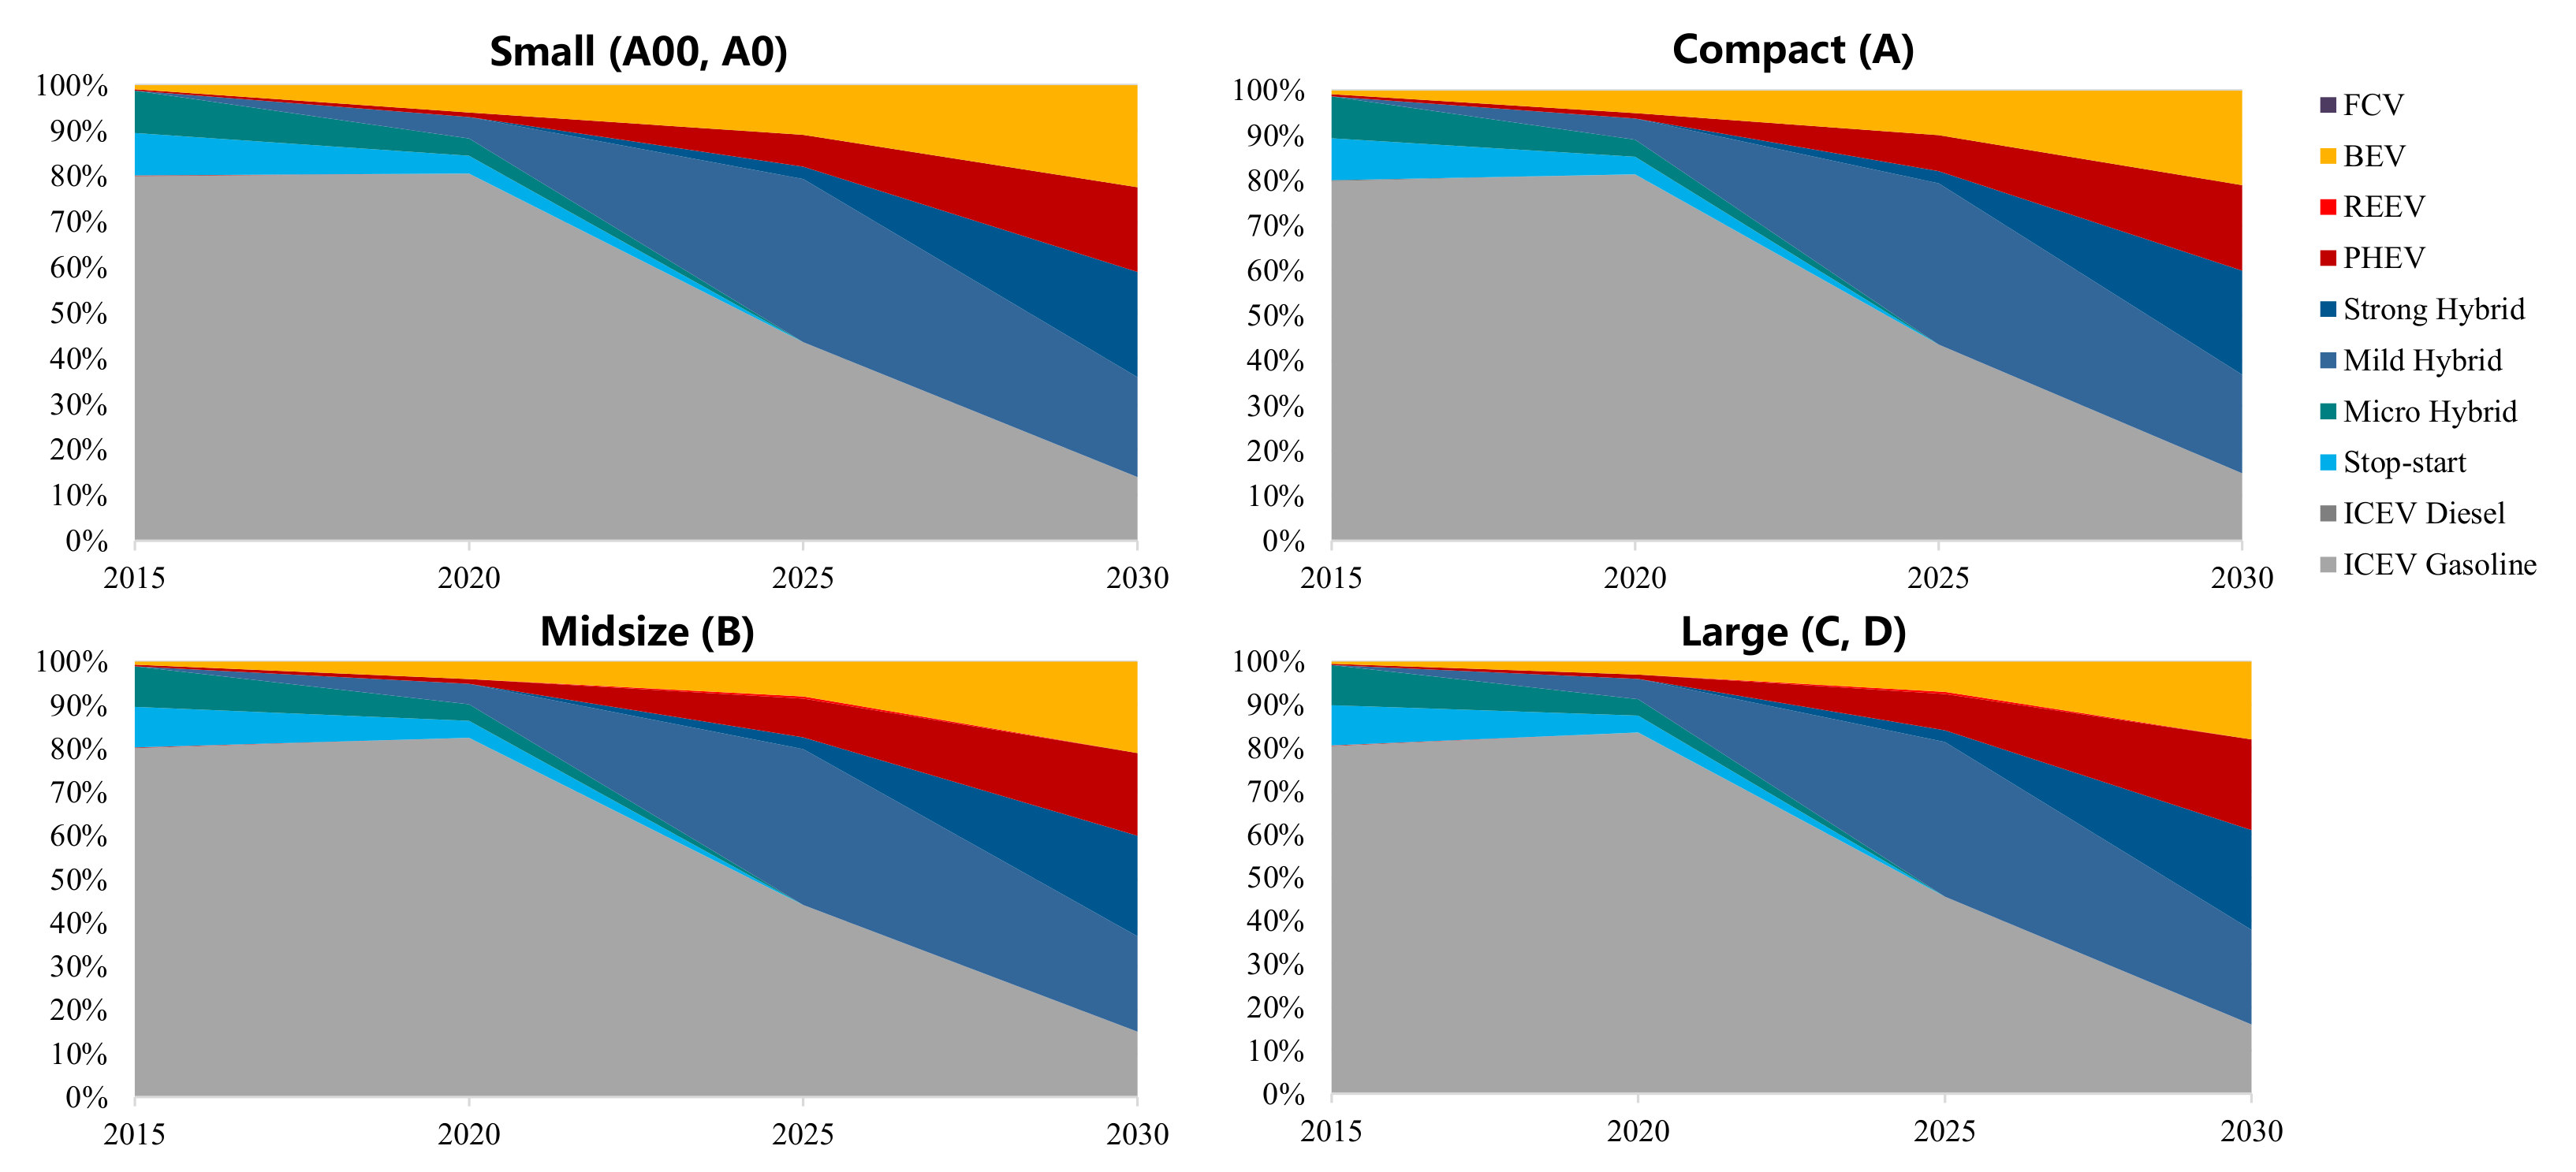
In order to study the impact of the new WLTP test procedure on the fleet fuel consumption, this study combined the calculation results of the technology route selection model and the planning of national technology roadmap 2.0 to forecast the market structure and market share of different powertrains and technologies in China, as shown in
Figure 9 and
Figure 10. In terms of the development of the vehicle segment in the Chinese market, the trend of large passenger cars is obvious in recent years. The average curb weight of passenger vehicles increases by about 1.5% per year since 2016 [
42,
43,
44]. In 2015, small, compact, midsize, and large passenger vehicles account for 24%, 59.1%, 14.3%, and 2.6% of the whole market, respectively. The percentages become 13%, 60%, 21.2%, and 5.8% in 2020, where the relative number of small cars that is projected decreases, while larger cars see a considerable growth. The structure of the passenger car market will be mainly driven by the preference of Chinese consumers and the demand for energy–saving and emission reduction in the future. It is predicted that the proportion of SUV sales in China will gradually reach the saturation point, and then, with the trend of electrification and the requirements of energy–saving and emission reduction, passenger cars will present a trend of miniaturization [
45].
From the perspective of powertrains, for the continuously tightening regulations, hybrid technology, especially integrated starter generator (ISG) technology will be substantially deployed. The penetration rate of electric powertrains in small vehicles is expected to see the fastest and most rapid increase compared to other segment vehicles. Due to the higher requirements for driving range, PHEV powertrains will be deployed in midsize and large vehicles with a relatively higher penetration than other segments. The penetration of BEV is approximately 10% in 2025, by which time the total market share of new energy vehicles will be close to 20%.
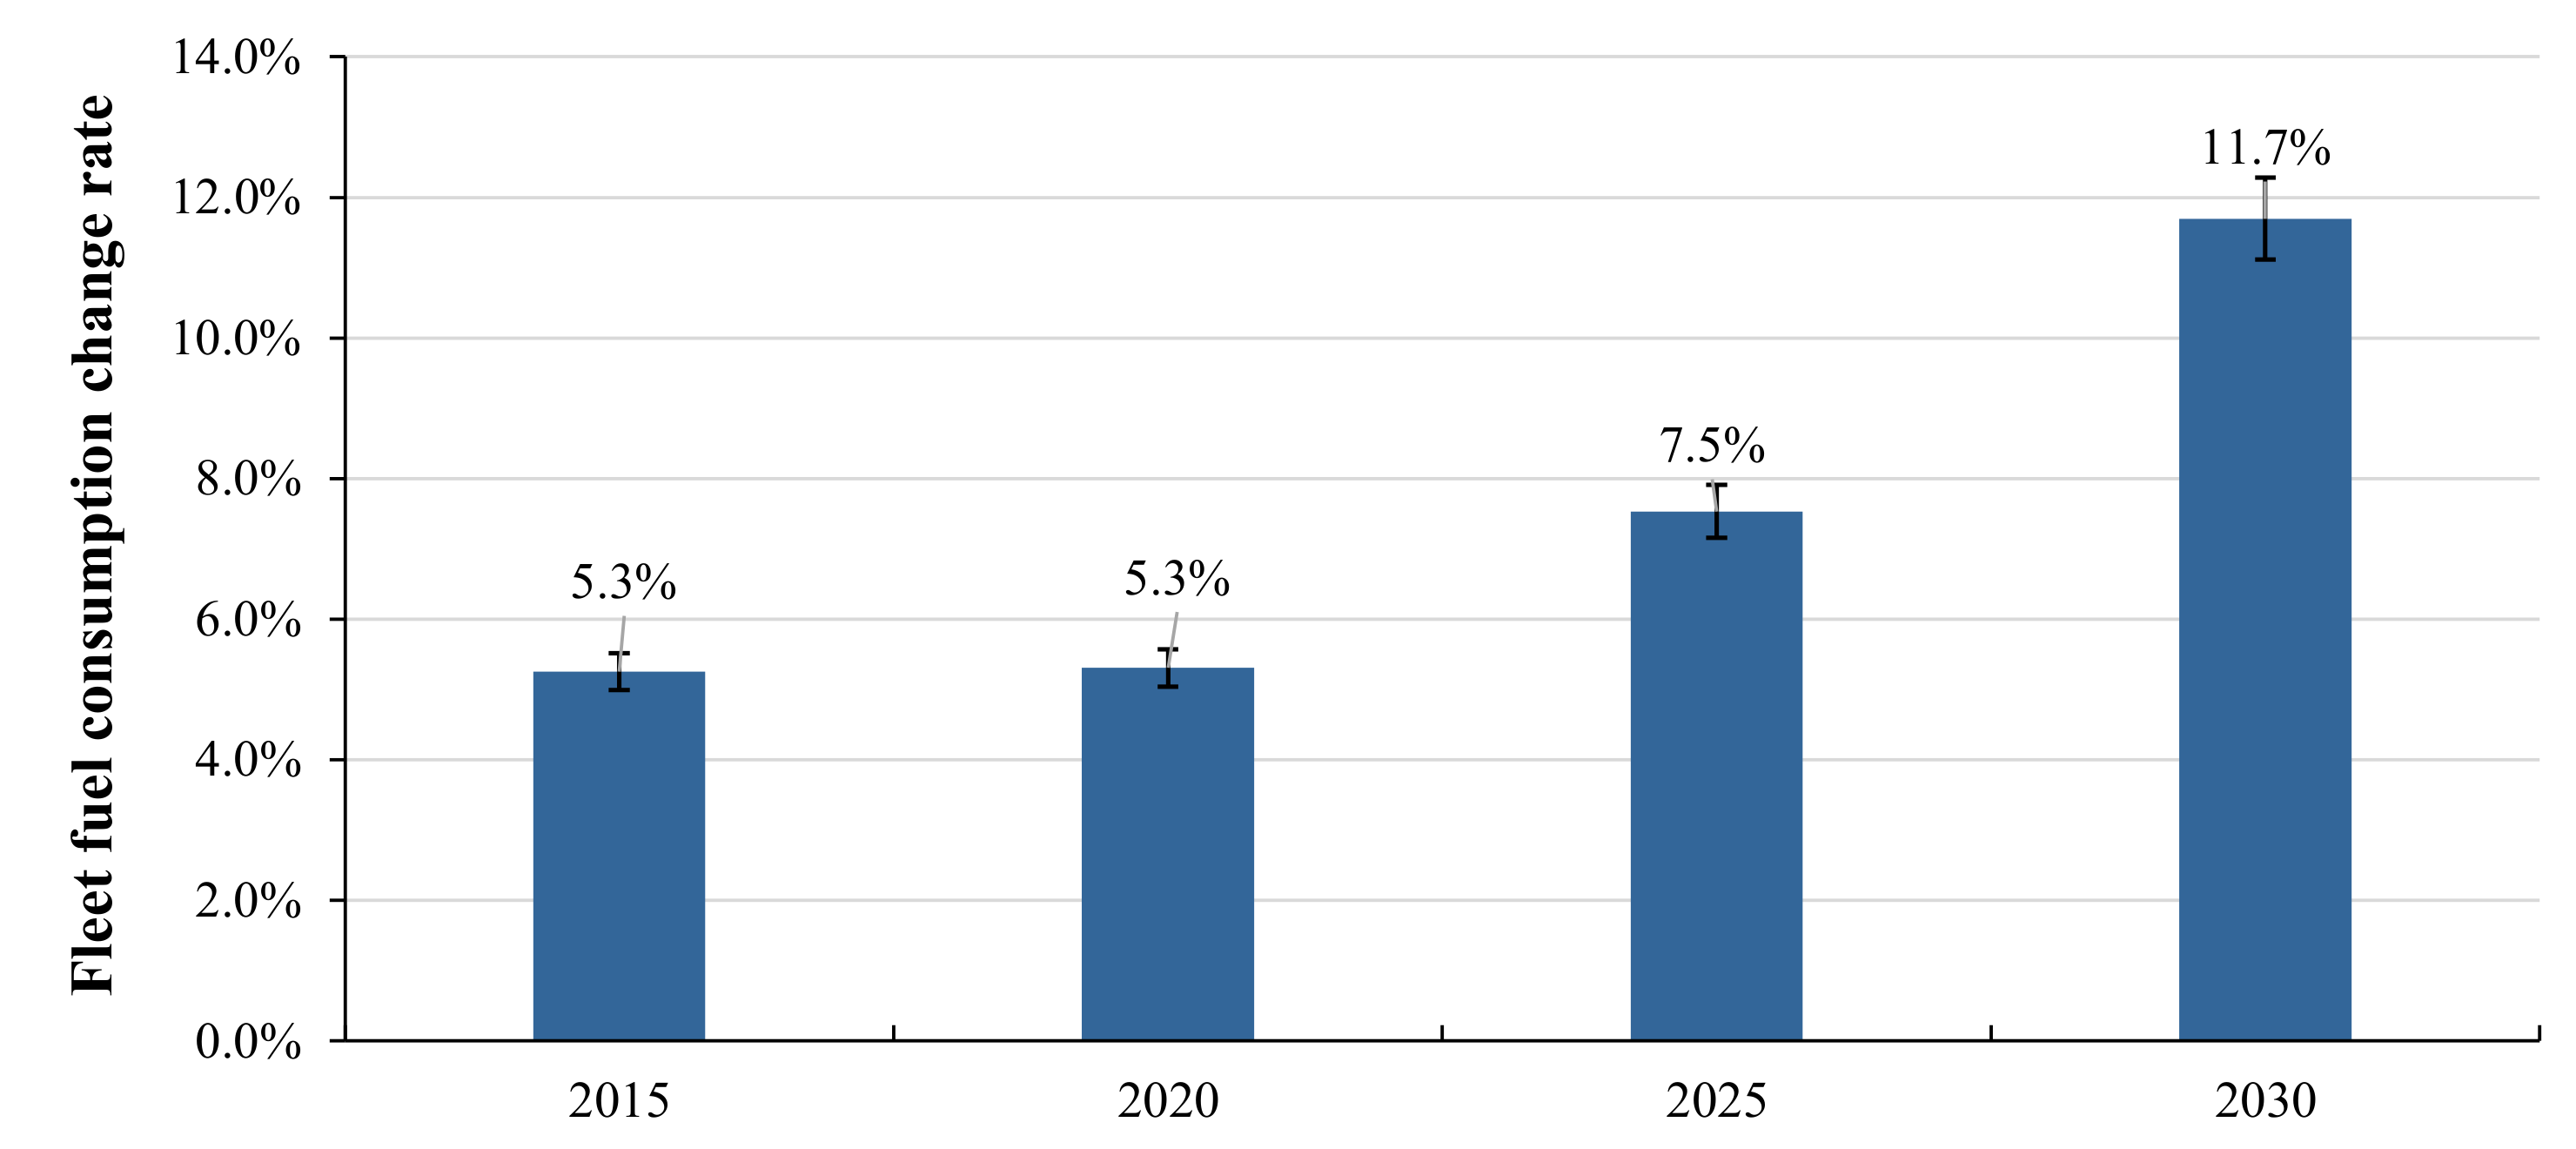
According to the bottom–up research framework of “technology–vehicle–fleet”, the final impacts on the whole Chinese passenger car fleet can be gained based on the analyses of technology effectiveness, fleet structure, and technology penetration. The results show that the effectiveness of most technologies will drop off, which directly increases the difficulty of compliance with national fuel consumption regulation. The average fleet fuel consumption in the WLTP test in 2025 will increase by about 7.5% relative to that in the NEDC test, and the national target should be increased from 4 L/100 km in the NEDC to 4.3 L/100 km in the WLTP if keeps the same stringency in different test procedures. If the WLTP is still used in the Phase VI regulation, the average fleet fuel consumption in 2030 will increase by about 11.7%, and the national fuel consumption target value will be increased from 3.2 to 3.6 L/100 km if keeps the same stringency, as shown in
Figure 11.
The average reduction rate of the national fuel consumption target in each phase is 20%. According to China’s newly issued energy–saving and new energy technology roadmap 2.0 and the Phase V fuel consumption regulation, China will adjust the national average fuel consumption target to 4.6 L/100 km in 2025. Considering the switching difficulty of enterprise products to different driving cycles, the national average fuel consumption target is relaxed 0.3 L/100 km compared to the numerical value in the NEDC. However, the government is expected to keep the target value of 3.2 L/100 km in 2030, which means that from the 4.6 L/100 km in the Phase V to the 3.2 L/100 km in the Phase VI, the target has been tightened by 30.4% with an average annual compound tightened rate of 7.5%. This is far above the international average tightened rates of 3–6% [
46,
47,
48]. Therefore, from the perspective of the stringency of regulation, the difficulty of complying with China’s Phase V fuel consumption regulation will be lower than expected, but the Phase VI regulation for 2025–2030 will be a great challenge for automakers, and this will bring great pressure on the planning of products and technologies.
4. Conclusions
As a main measure to promote the technology development of China’s energy–saving and new energy vehicles, alleviate the pressure on energy and the environment, and drive the transformation of the national energy structure, the CAFC regulation has played an important role in the past ten years and will continue to pose a dramatic impact on the development of the Chinese automobile market. Different from the past four phases, great changes are set in the Chinese Phase V fuel consumption regulation from two aspects: the test procedure and the evaluation system of the regulatory target value. Among them, the switch of test procedure not only has an impact on the effectiveness of various energy–saving and new energy technologies but also affects the setting of national targets and the selection of industry technology routes. However, due to China’s Phase V fuel consumption regulation being newly issued, few studies have systematically investigated the impacts of the new WLTP test procedures on the Chinese fuel consumption regulation, market, and technologies. Most of the research is aimed at the European markets, and almost all these studies only involve the vehicle level rather than the technology level.
This paper focuses on the research gap and establishes a “technology–vehicle–fleet” multi-scale and bottom–up research framework to estimate the impacts of test procedure switching on technology effectiveness and regulation stringency. First, the technology effectiveness of 10 powertrains and 64 technologies are investigated based on the PHEM simulation model and the ICCT energy consumption conversion model. In addition, the compliance of national CAFC regulations is analyzed from the perspective of the whole fleet to provide implications and suggestions for the selection of national targets and technical routes under the new phase of regulations.
The results show that almost all baseline vehicles under the WLTP test have higher fuel consumption than the NEDC procedure since the WLTP is closer to the real road condition and more stringent than the NEDC. In addition, it can be seen from the comparisons between gasoline vehicles and diesel vehicles that the influence on diesel vehicles is slightly greater than that of gasoline vehicles. By comparing different powertrains, it can be seen that the overall trend is that with the enhancement of electrification, the test procedure impacts on the fuel consumption is greater.
In terms of advanced gasoline engines, the effects of technologies with more obvious effects under low load conditions (turbocharging and downsizing, cylinder deactivation, FSI, HCCI, VVT) are generally deteriorated, among which turbocharging and downsizing had the largest impact, with a maximum decline of 8.5%. In addition, VCR and SGDI technologies are the few technologies that benefit from the WLTP cycle due to the greater load variation, where VCR technology increases by 1.6% and SGDI technology increases by 0.2% on average. The gasoline engine friction reduction technology effect is not affected by the change of driving cycle. The same trend also occurs in the advanced diesel engines, and the effect of turbocharging and downsizing also decreased significantly, with a decrease of 1.4–6.8%. The effectiveness of VCR increases by about 0.1% under the WLTP cycle, and the friction reduction technology of diesel engines is almost not affected by the change of test procedure. As for the transmission technology, the multi–speed technology has more obvious advantages under the WLTP. However, the effectiveness of other automatic transmissions decreases in the WLTP test.
With regard to electric technologies, compared to the NEDC driving cycle, the percentage of idle durations in the WLTP driving cycle has fallen sharply; thus, the effects of hybrid electric technologies such as start–stop are significantly lower than that in the NEDC. As for PHEVs and REEVs, the average fuel-saving effect of PHEVs and REEVs under the WLTP is about 6% lower than that under the NEDC procedure due to the change of driving cycle and energy consumption calculation method. In terms of vehicle and accessory technologies, due to the higher speed in the WLTP, the effectiveness of low wind resistance, low rolling resistance, and low drag braking is improved by about 1.2–2.4%, 0.4–1.4%, and 0.1% respectively. The AUX and EPS are faced with decreases in energy-saving, and the deterioration of AUX is more obvious; where the larger the segment is, the more serious the deterioration will be.
From the perspective of the whole Chinese market and the targets of national regulations, the test procedure in Phase V will be changed from NEDC to WLTP, which will be closer to the real driving condition and increase the national average fuel consumption by about 7.5% in 2025. Compared with the target of 4 L/100 km under the NEDC, the target value should be increased from 4 to 4.3 L/100 km. If the WLTP is still maintained in Phase VI, the average fuel consumption in 2030 will increase by about 11.7%, and the national target value should be increased from 3.2 L/100 km in the NEDC to 3.6 L/100 km in the WLTP. According to China’s technology roadmap for energy–saving and new energy vehicles 2.0 and the Phase V regulation that has been newly issued, the national average fuel consumption target was adjusted to 4.6 L/100 km in 2025 and retains the target value of 3.2 L/100 km in 2030. From the perspective of the stringency, it means that the national target is relaxed by 0.3 L/100 km considering the switching difficulties from the NEDC to the WLTP. In Phase VI, the target is 3.2 L/100 km, which is 30.4% stricter than that of Phase V, and the annual compound tightened rate reaches 7.5%. So, the difficulty of complying with the Phase V fuel consumption regulation in China will be smaller than expected, but the Phase VI fuel consumption regulation for 2030 will be a great challenge for automakers.
Therefore, for automakers, on the one hand, preparing for the 2021 test cycle switching, and making full use of technologies that have better effect under the WLTP will help them to comply with the regulation with lower cost and better effect. On the other hand, facing the more stringent Phase VI fuel consumption regulation, automakers need to launch their product planning as soon as possible and expand the technology bandwidth to comply with the regulation. From the perspective of the government, the implementation of the new WLTP test procedure is a big step to improve the accuracy of the whole fuel consumption regulation system. However, according to the stringency calculation, the national fuel consumption target of Phase V is relaxed about by 0.3 L/100 km, while maintaining the 3.2 L/100 km target in Phase VI is equivalent to a tightening of 0.4 L/100 km. Furthermore, the target in Phase VI will be tightened further, and the test procedure will be switched to the China automotive test cycle (CATC). Therefore, the government needs to evaluate the compliance feasibility of national standards based on technology basis and technology potential and also compile the next stage fuel consumption evaluation methods and targets as early as possible.
Based on this study, several topics can be studied further. First, this study focuses on the impacts of the new WLTP on technology effectiveness and fuel consumption regulations. In the future, the test procedure of China’s fuel consumption regulations will further switch to the CATC [
49]. Compared to the WLTC, the CATC is also an instantaneous test cycle that is closer to the real driving condition, and it has the same test duration as the WLTC. However, the CATC localized the test cycle and reflected the real driving condition in China further, with a lower average speed, higher idle percentage, and higher acceleration and deceleration percentage. Therefore, technology effectiveness assessment based on the CATC will be important in the next phase. Second, the fuel consumption of BEVs and FCVs is regarded as 0 now in the context of the present CAFC regulations. However, with the increasing concern of carbon emission, there is no doubt that the energy consumption or carbon emissions of BEVs and FCVs will be considered in the regulation. Therefore, the impacts of test procedure switching on the energy consumption of BEVs and FCVs should also be taken into account.


