
Xylo-Oligosaccharides in Prevention of Hepatic Steatosis and Adipose Tissue Inflammation: Associating Taxonomic and Metabolomic Patterns in Fecal Microbiomes with Biclustering

 , , ,
, , , 
Abstract
:1. Introduction
2. Materials and Methods
2.1. Animals, Diets and Analysis of Hepatic Fat Content
2.2. Collection and Analysis of Fecal Samples
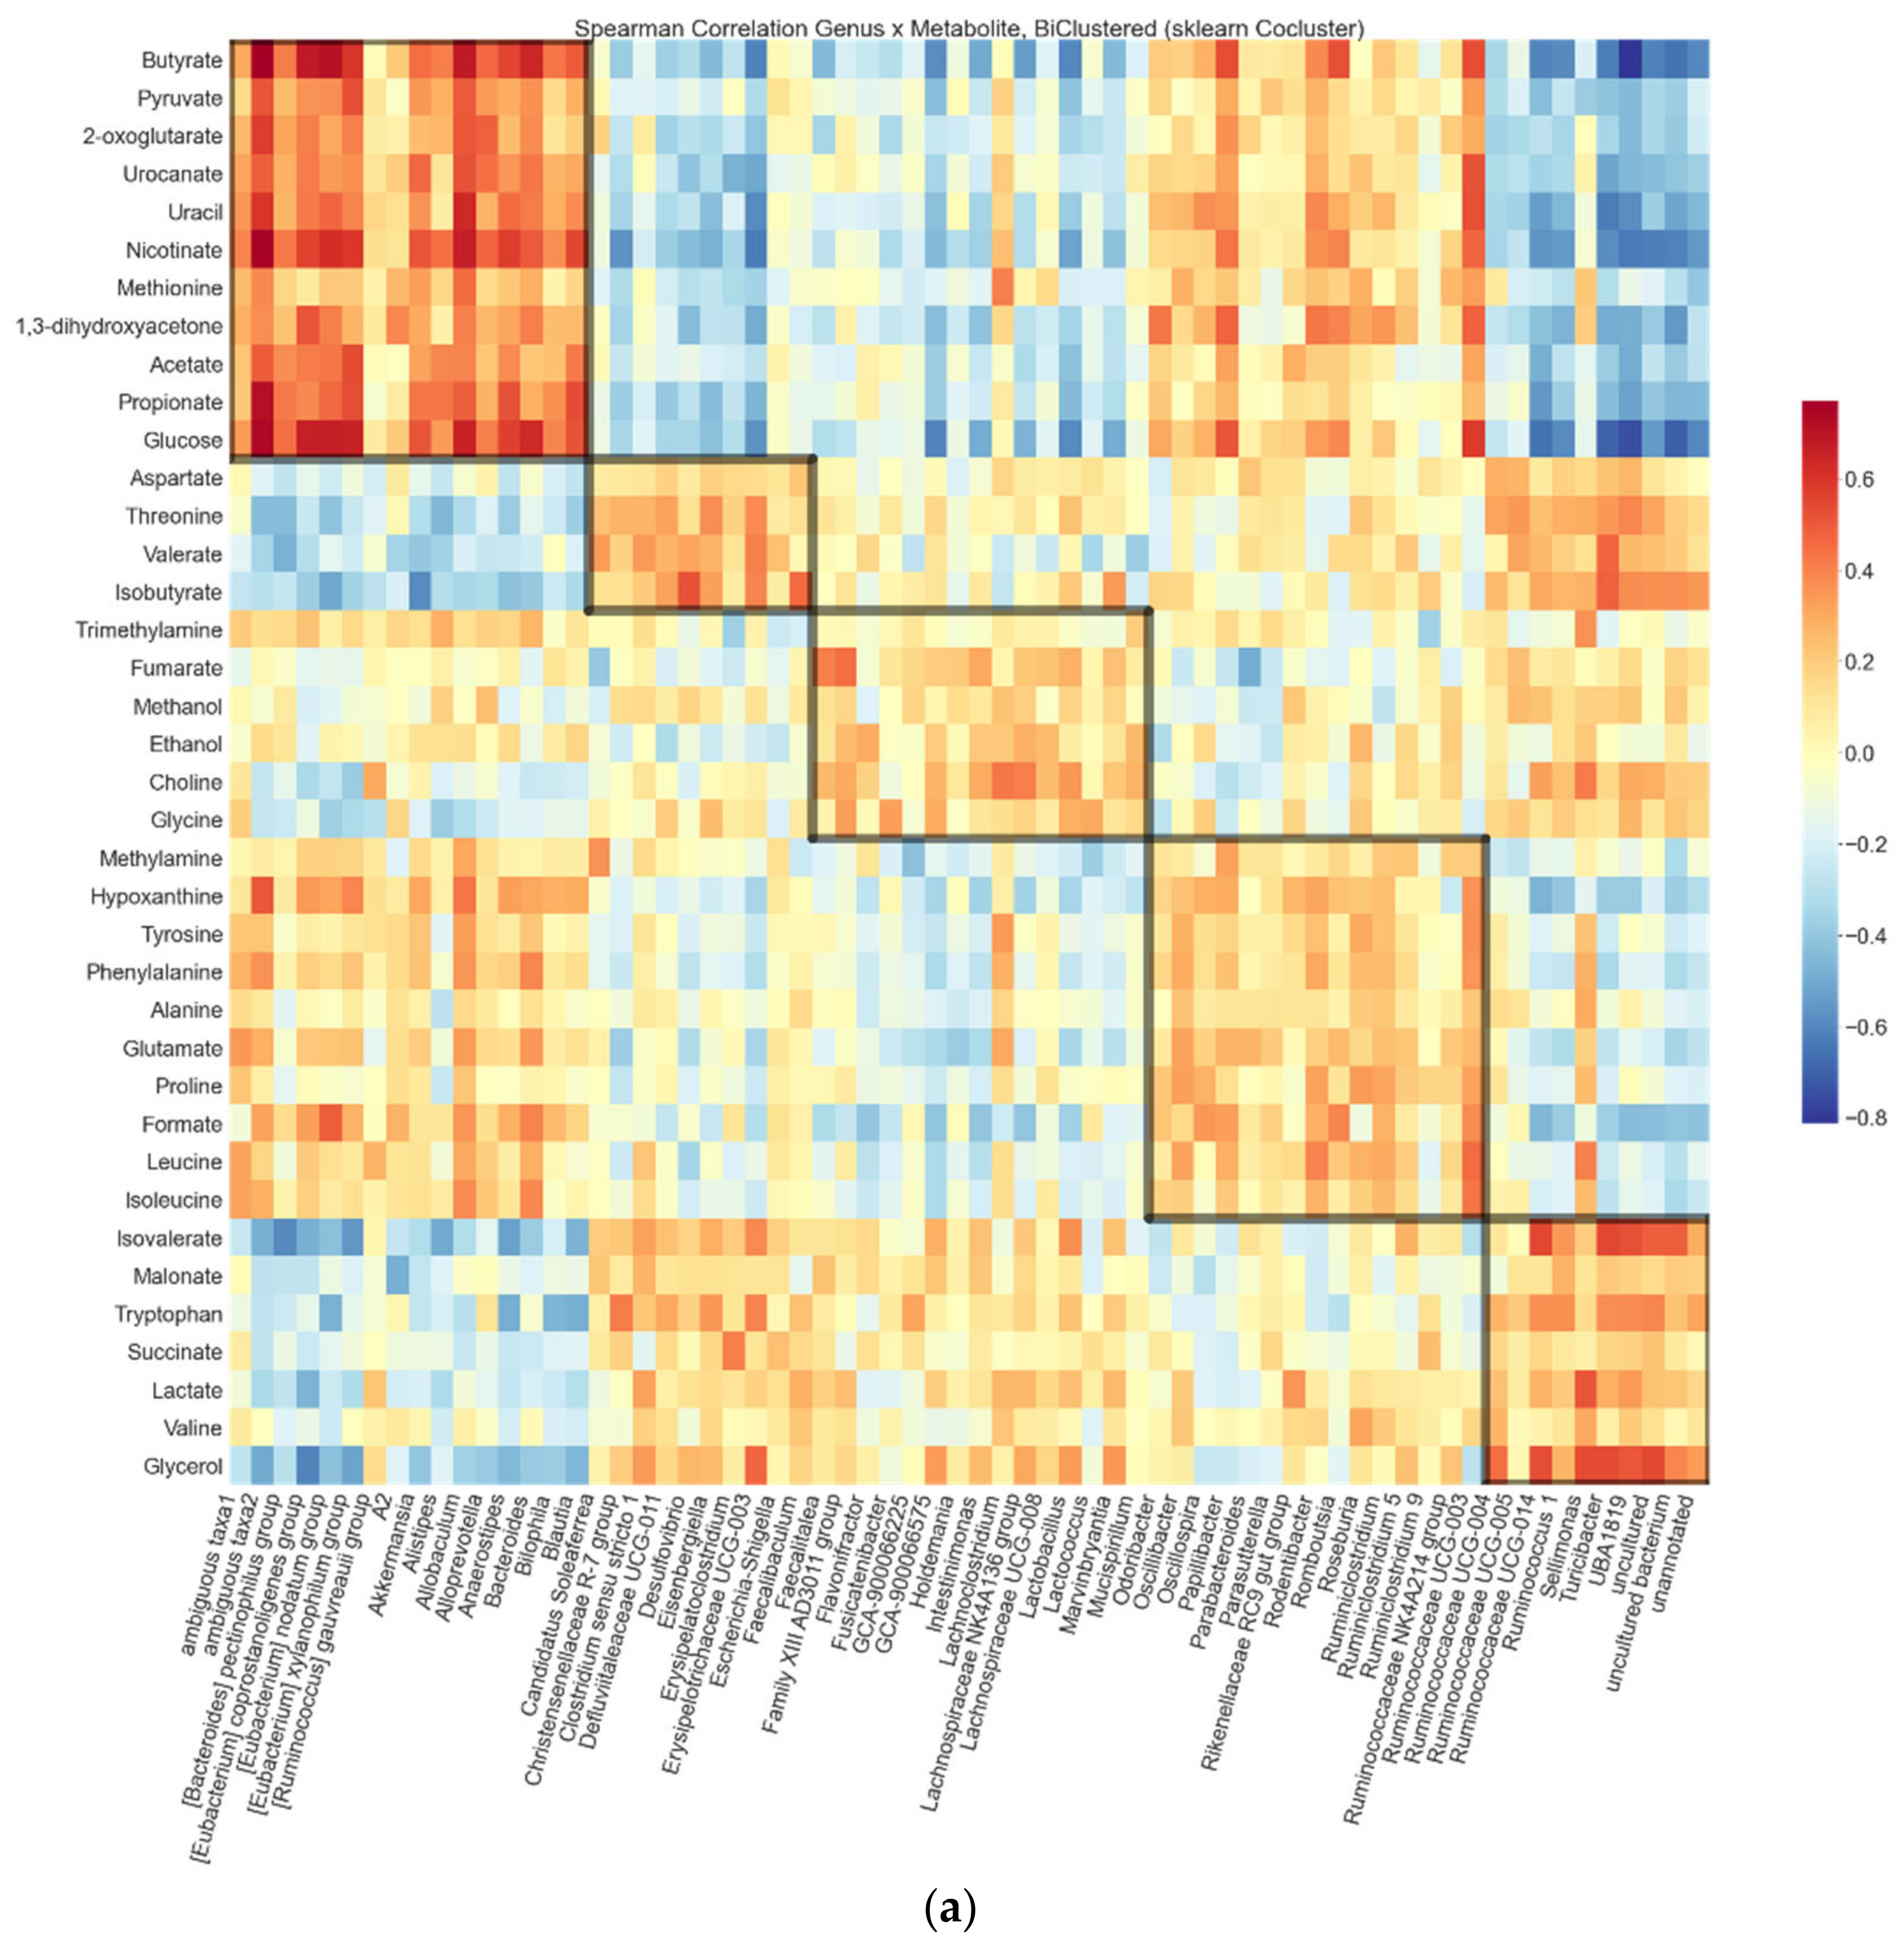
2.3. Biclustering
2.4. Preparation of Tissue Protein Homogenates and Measurement of Metabolic Enzyme Activities
2.5. Western Blot Analyses of the Phosphorylated Proteins
2.6. Quantitative Real-Time PCR Analyses
- rno-miR-21-5p MIMAT0000790: 5′-UAGCUUAUCAGACUGAUGUUGA-3′.
- rno-miR-122-5p MIMAT0000827: 5′-UGGAGUGUGACAAUGGUGUUUG-3′.
- rno-miR-192-5p MIMAT0000867: 5′-CUGACCUAUGAAUUGACAGCC-3′.
- rno-miR-221-3p MIMAT0000890: 5′-AGCUACAUUGUCUGCUGGGUUUC-3′.
2.7. Histopathological Scoring of the Epididymal Adipose Tissue
2.8. Statistical Analyses
3. Results
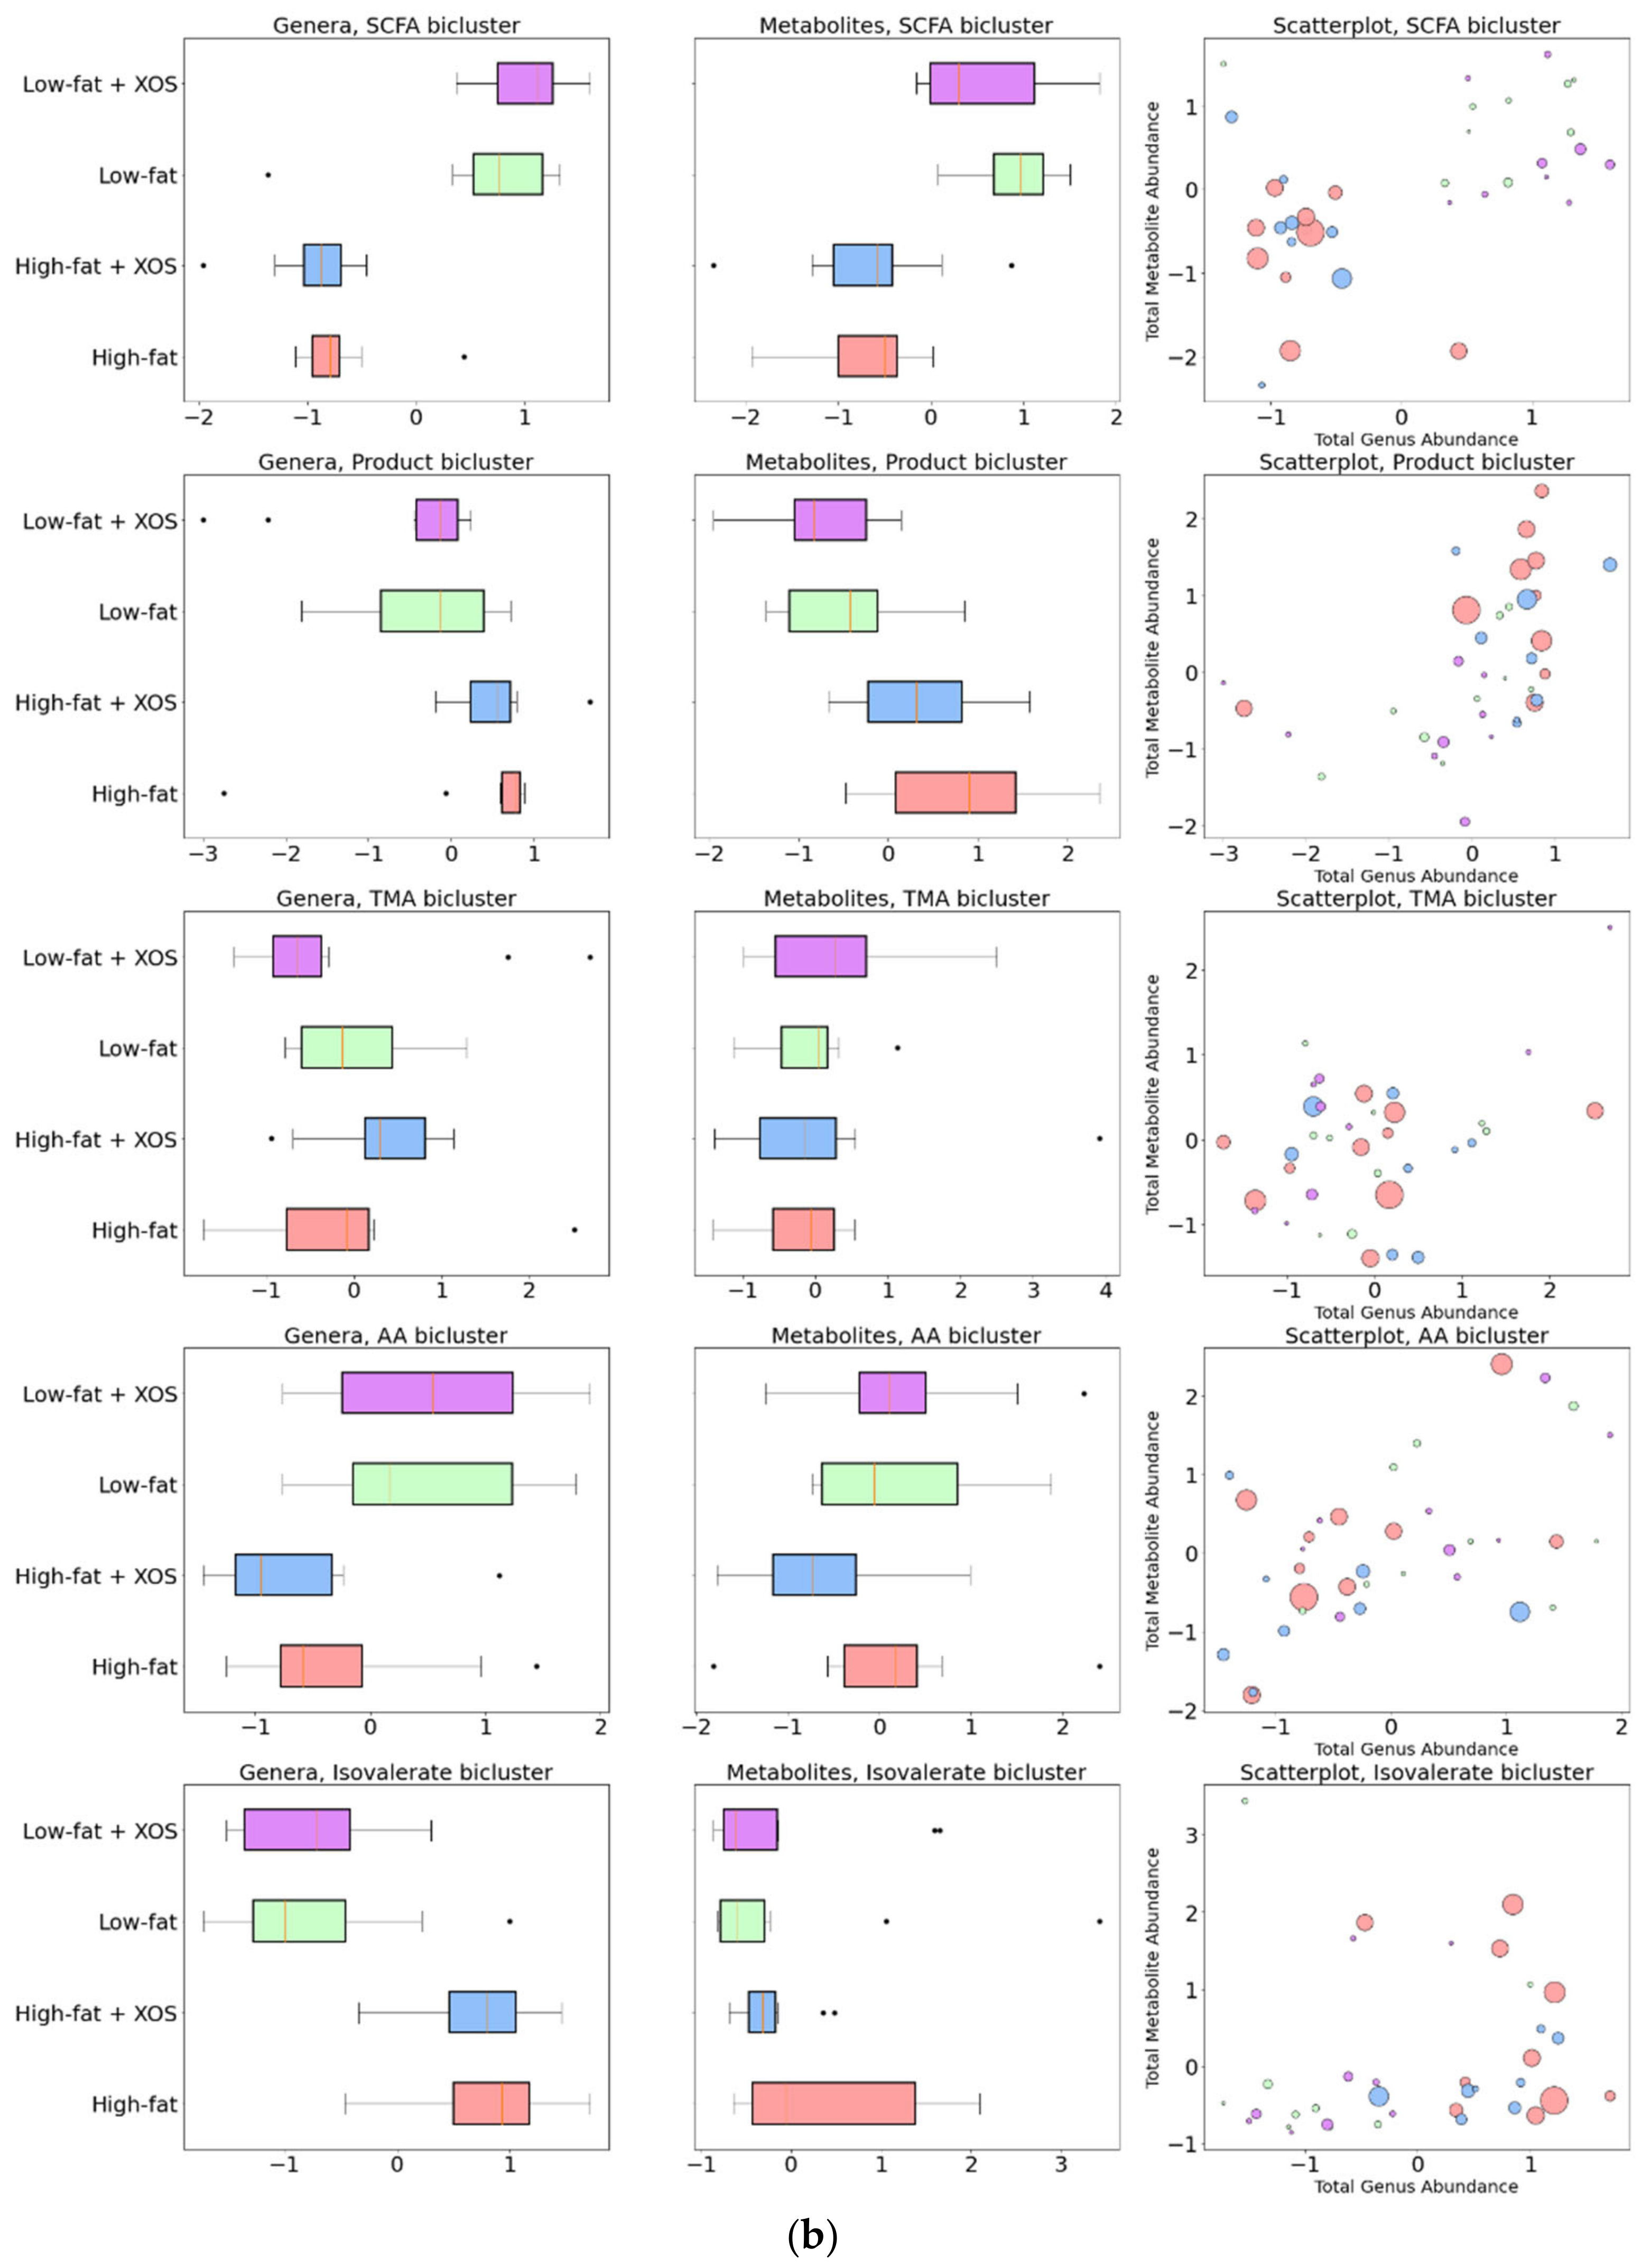
3.1. Biclustering
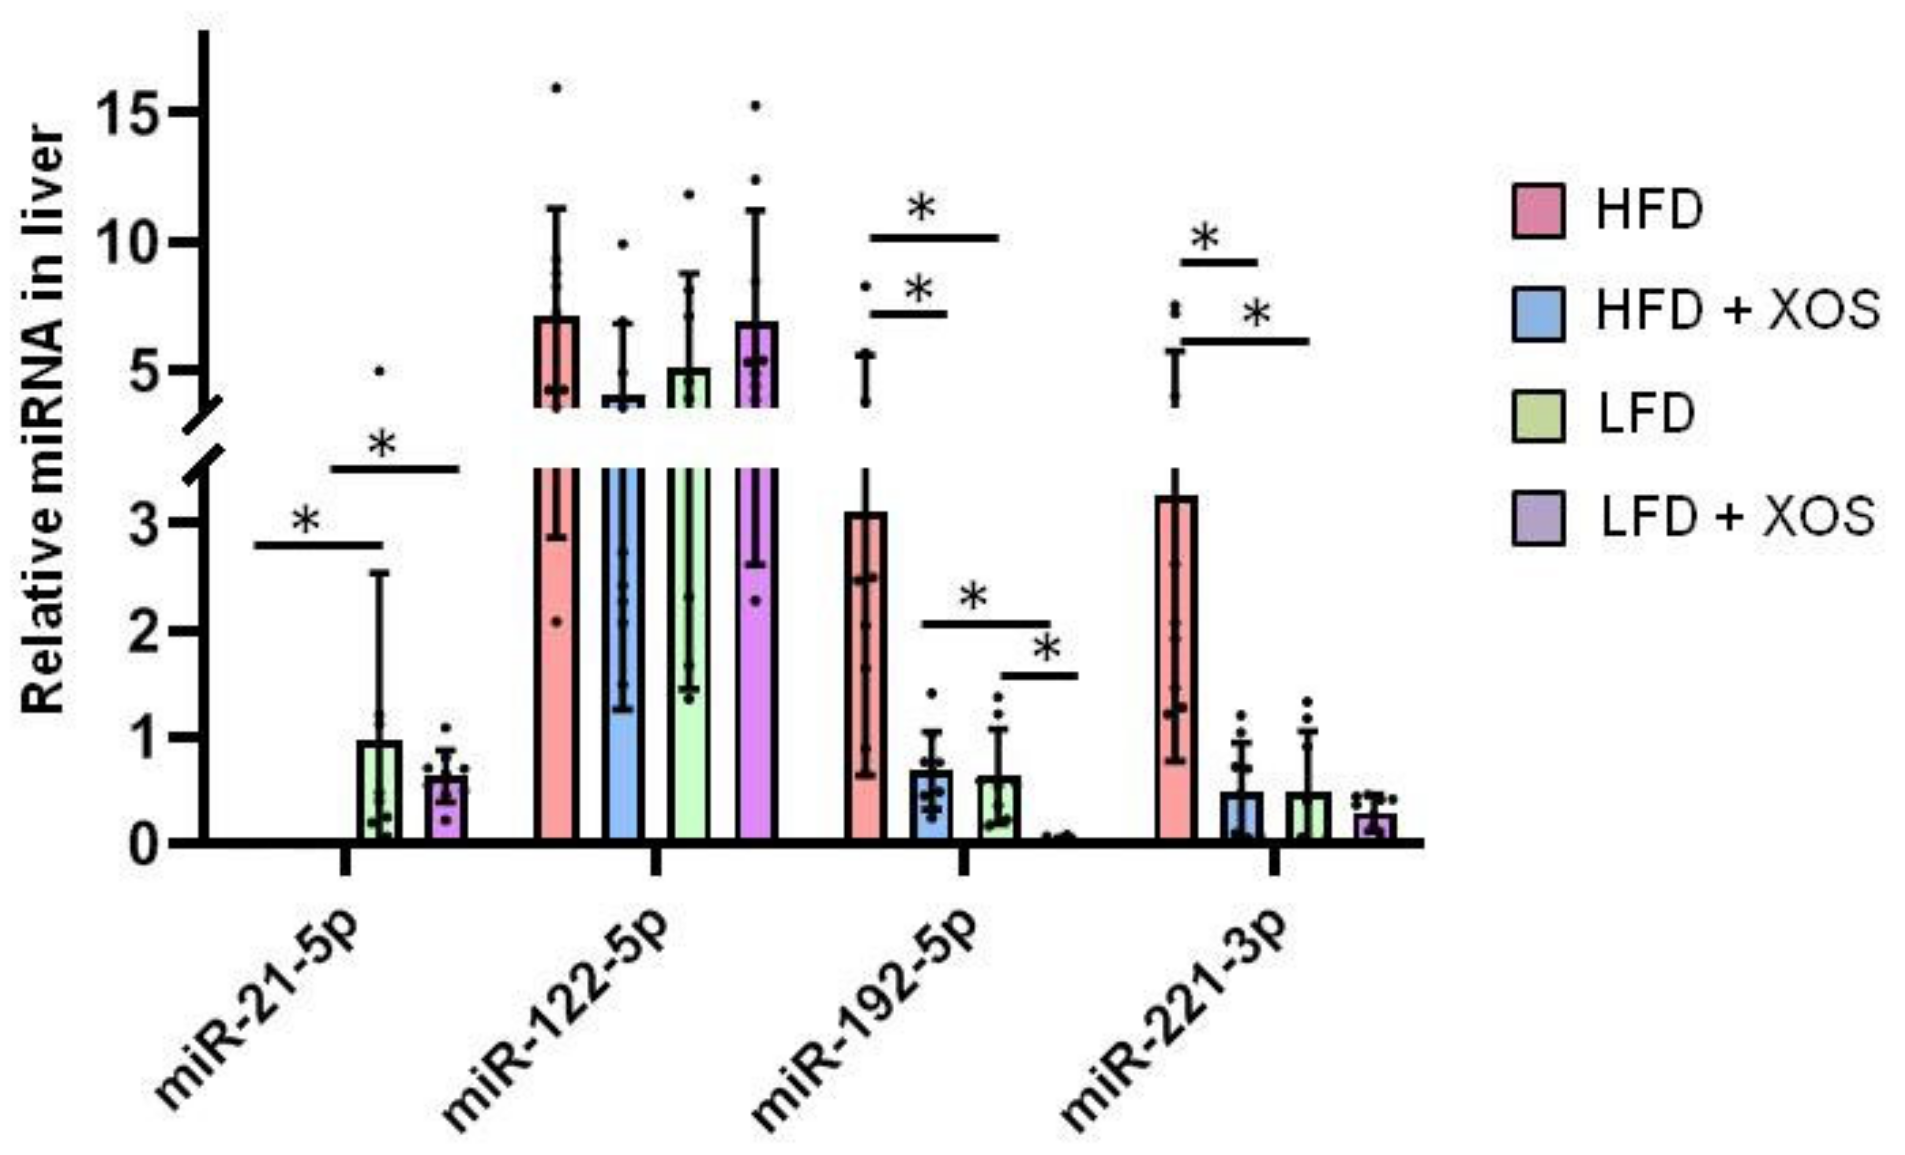
3.2. The Effects of the Diets on the Hepatic MicroRNA’s
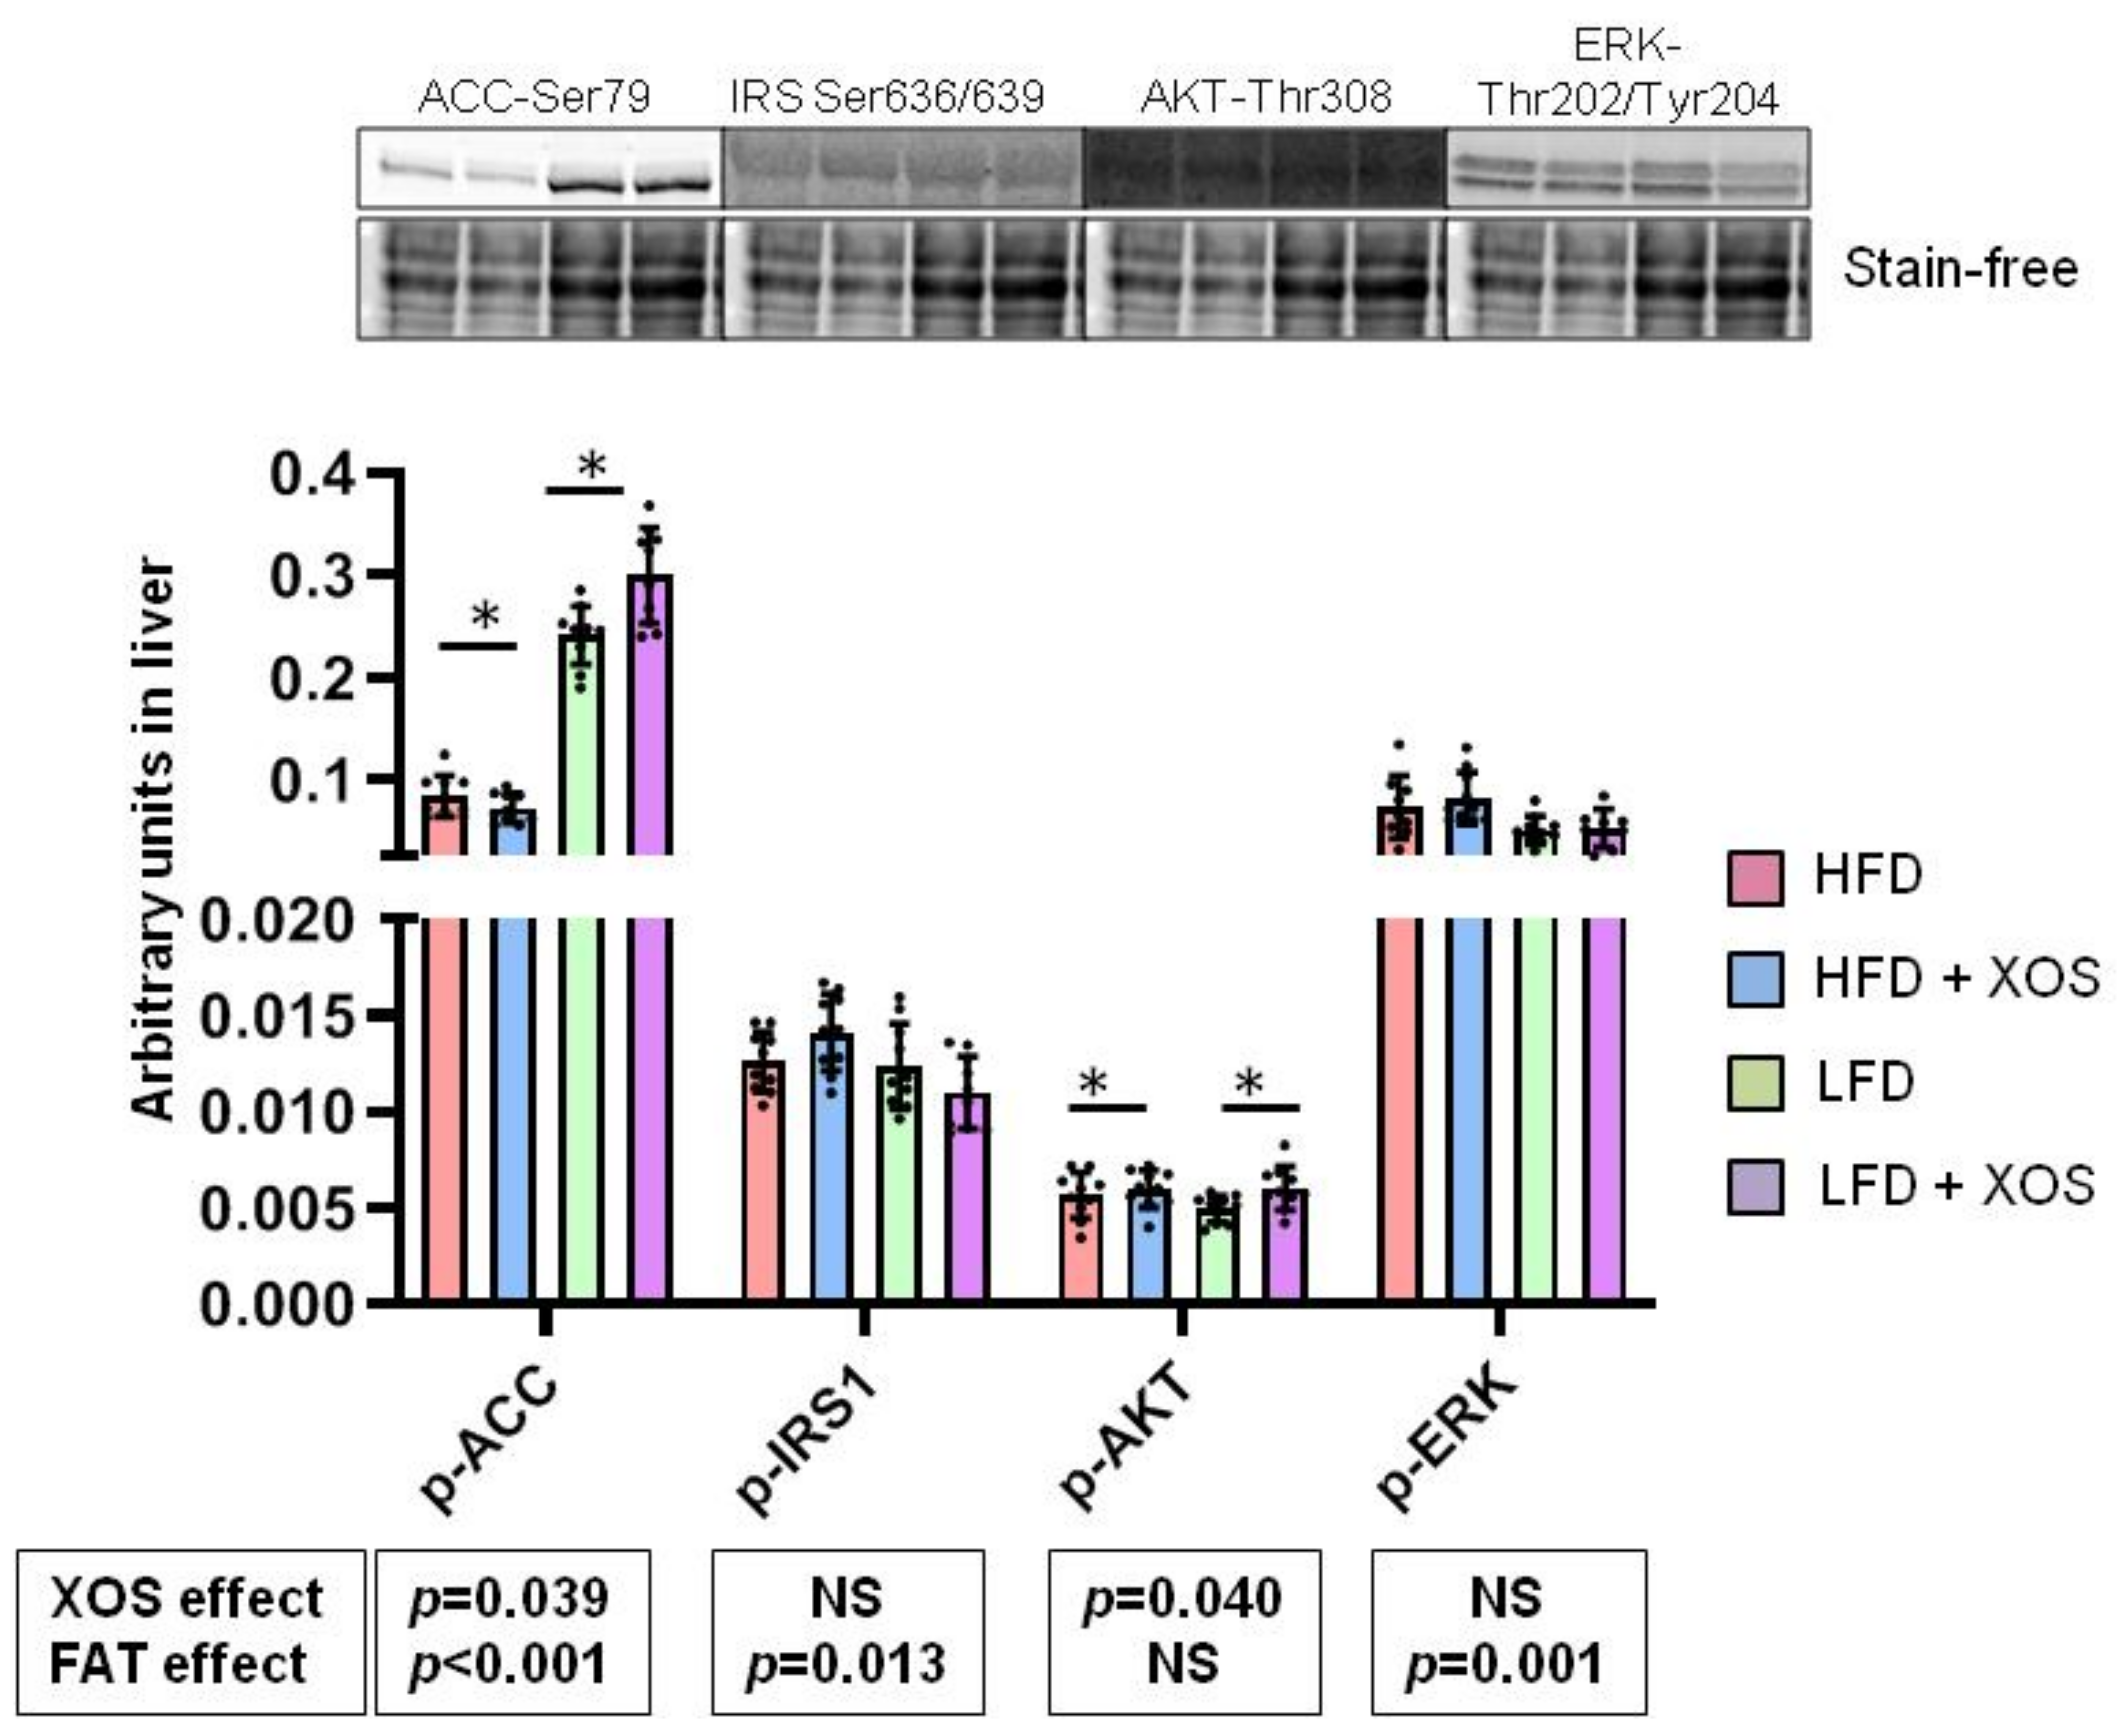
3.3. The Effects of the Diets on the Phosphorylation of Insulin Signaling and Fatty Acid Oxidation Related Proteins in Liver
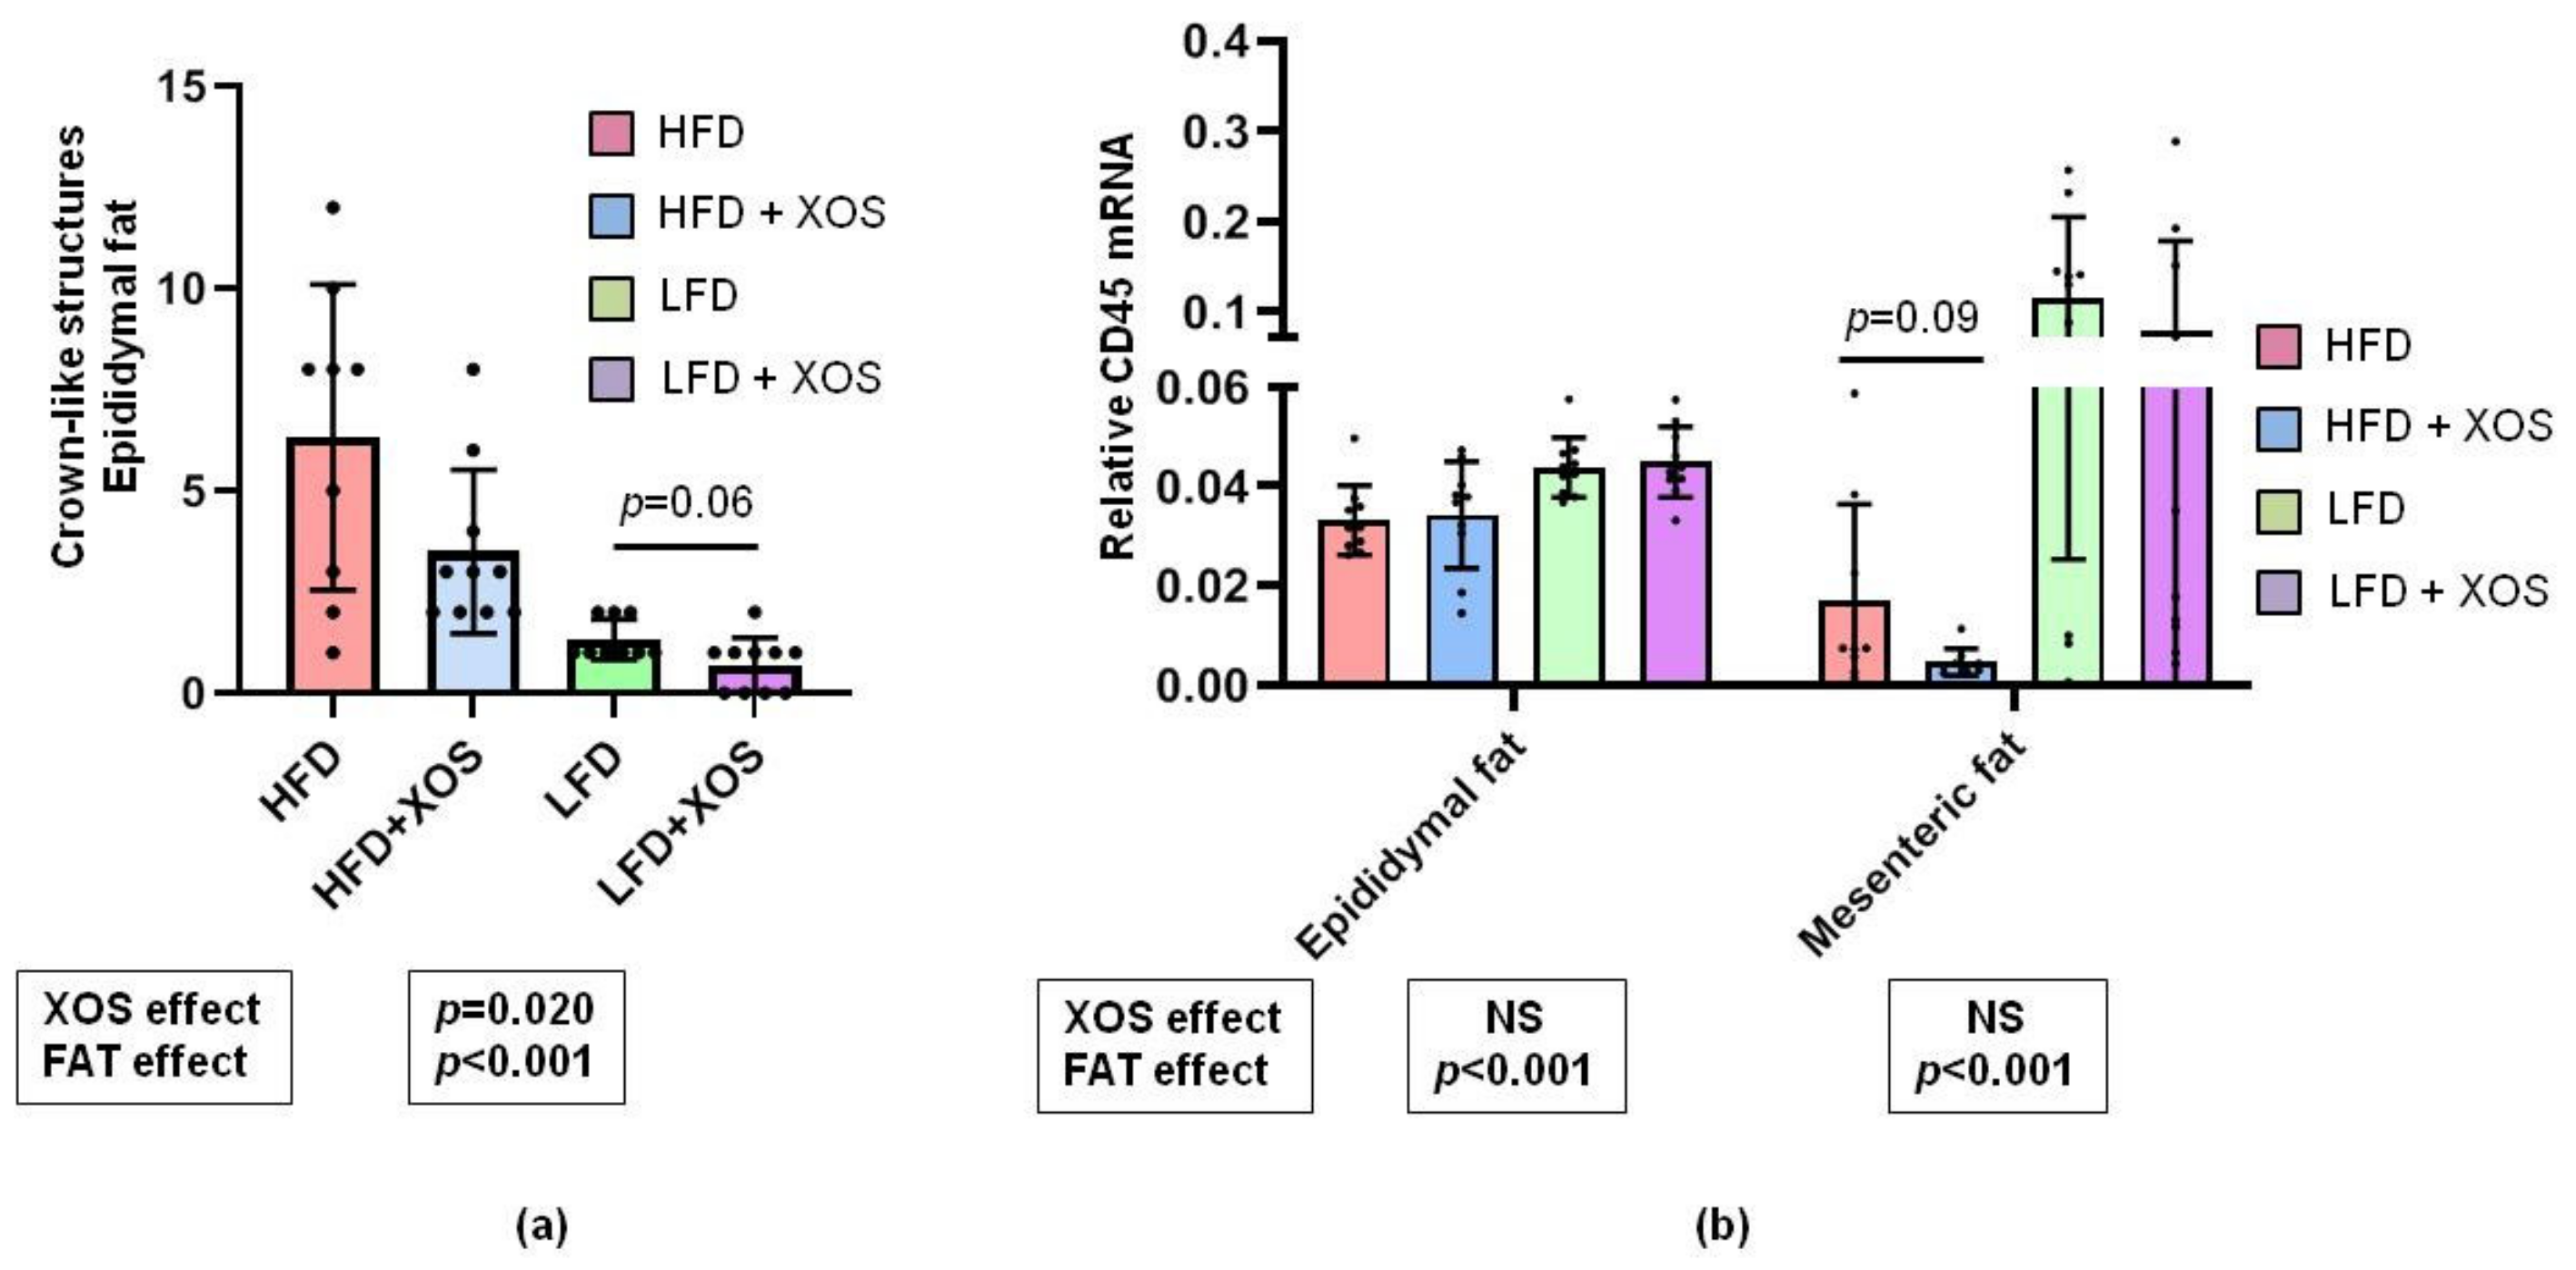
3.4. The Effects of the Diets on the Markers of Adipose Tissue Inflammation
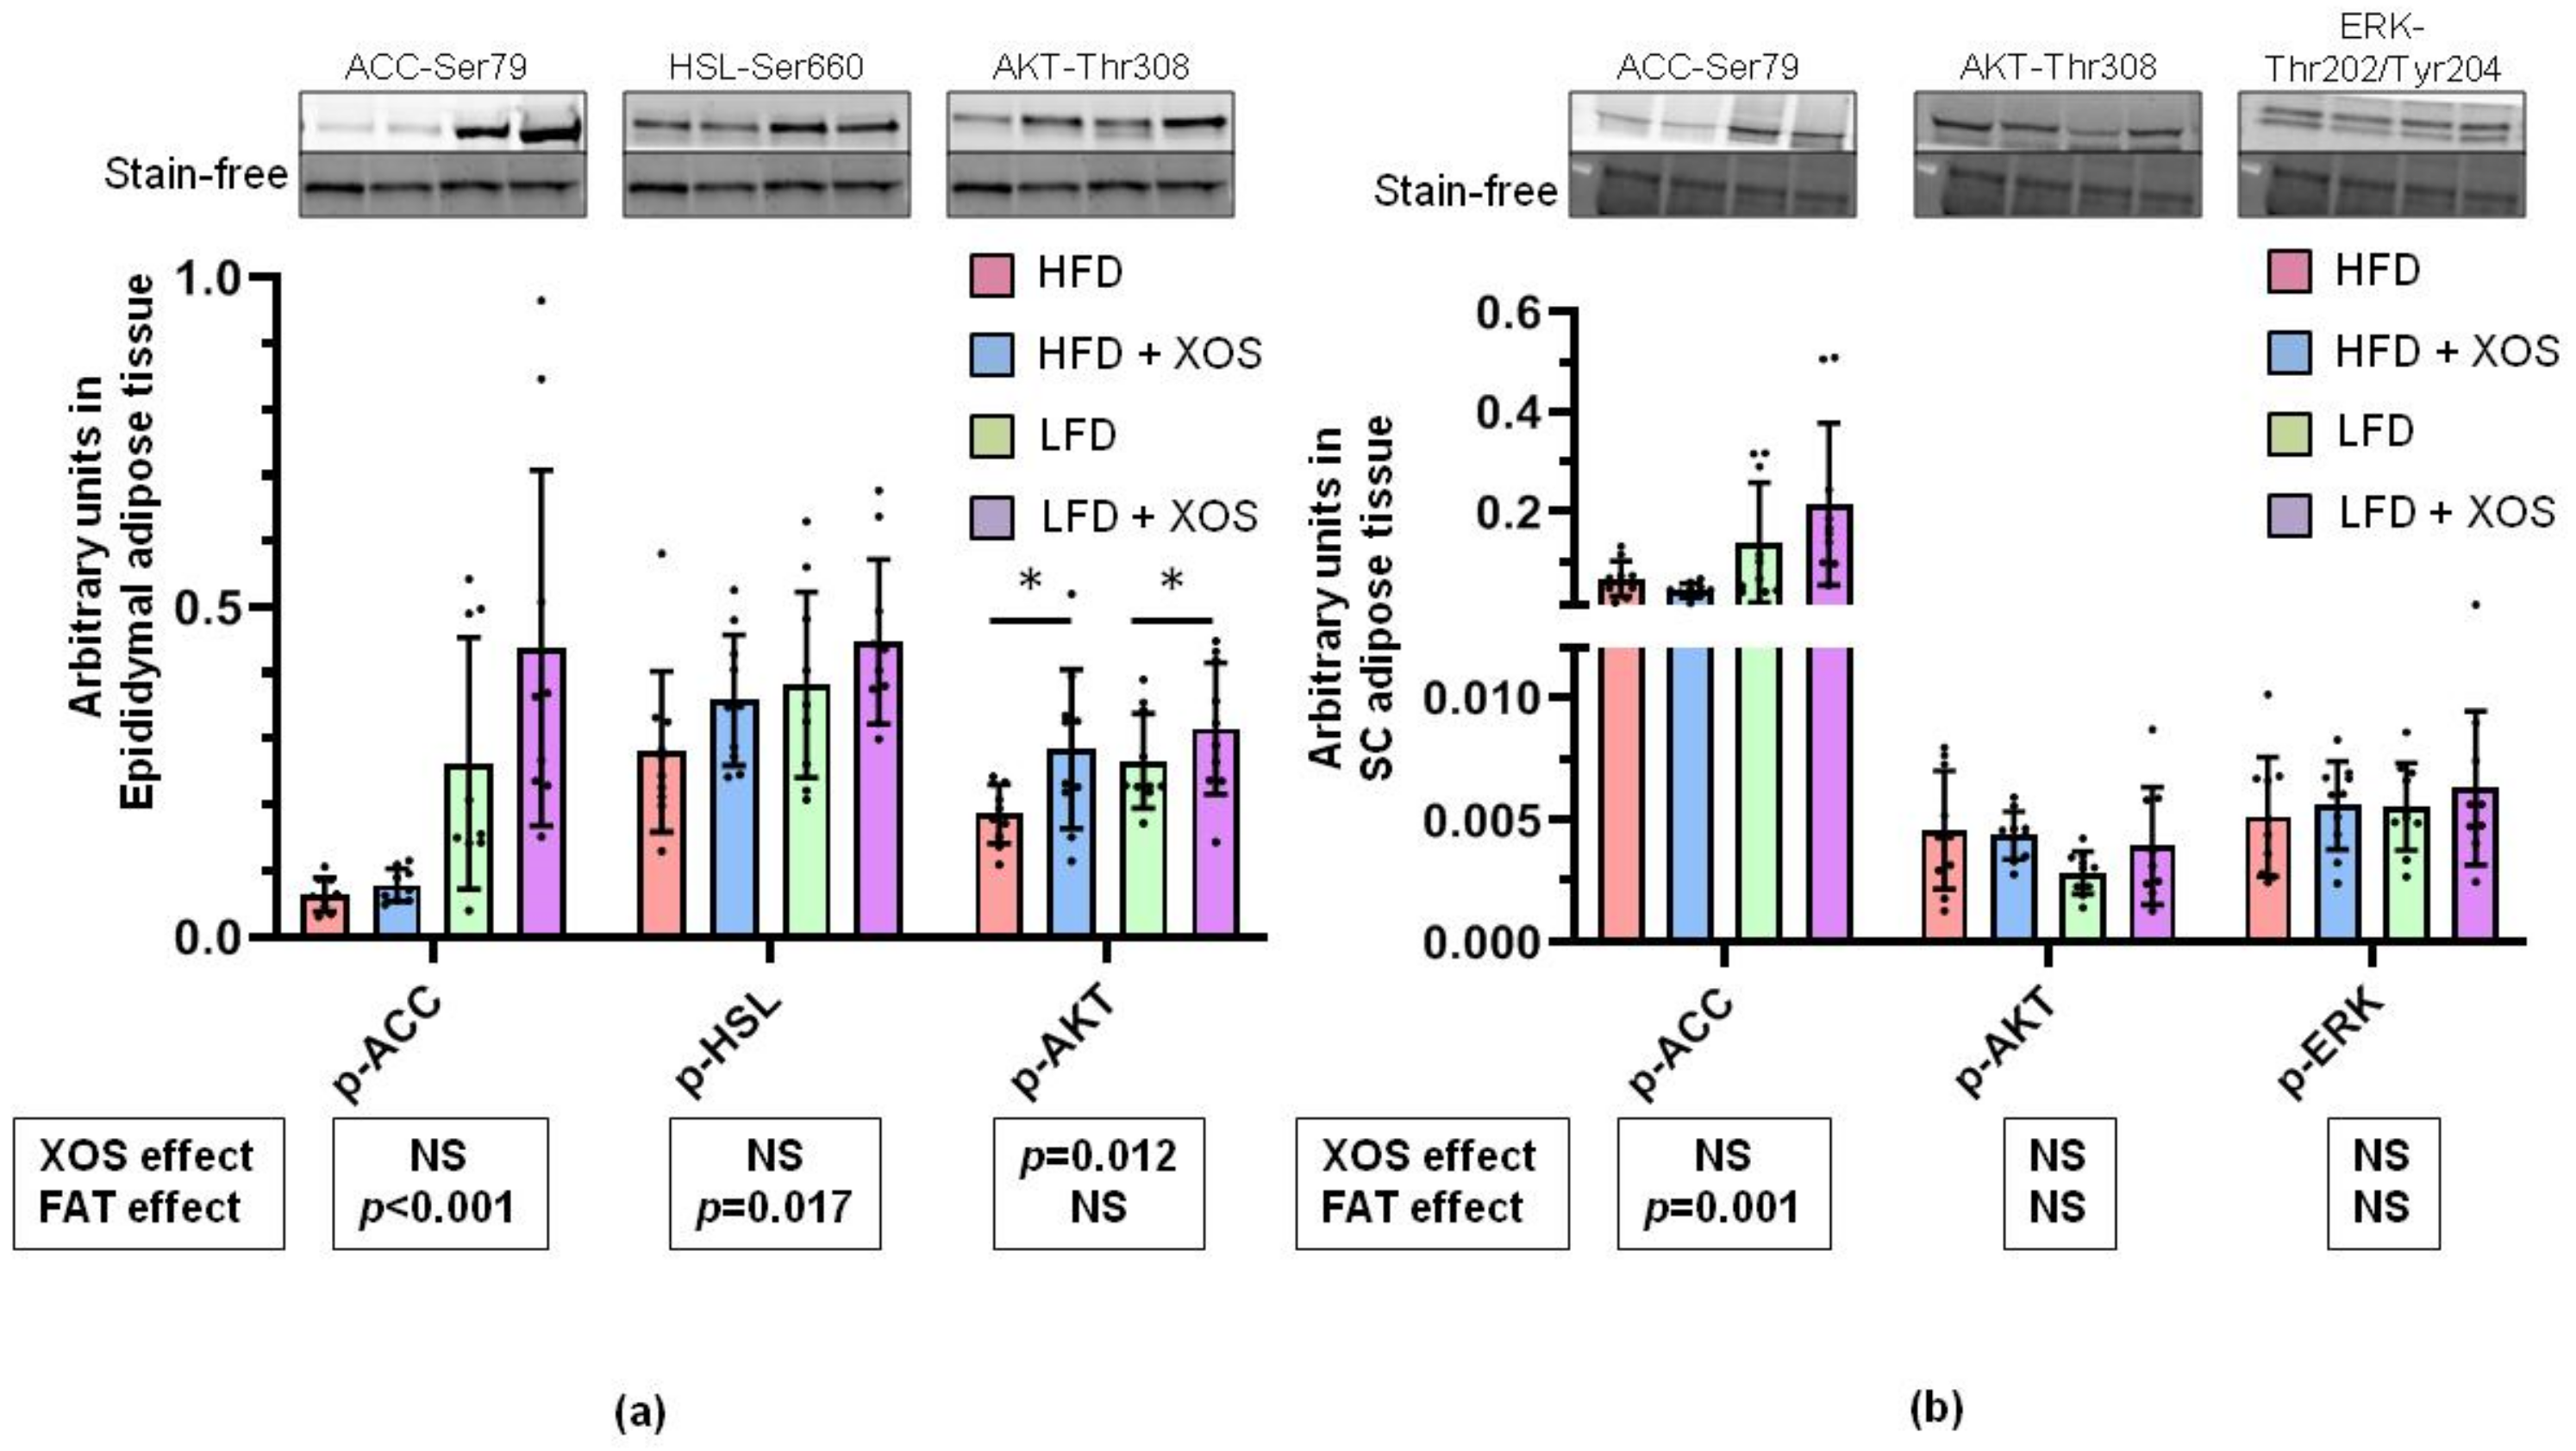
3.5. The Effects of the Diets on the Phosphorylation of Insulin Signaling, Fatty Acid Oxidation and Lipolysis Related Proteins in the Epididymal and Subcutaneous Adipose Tissue
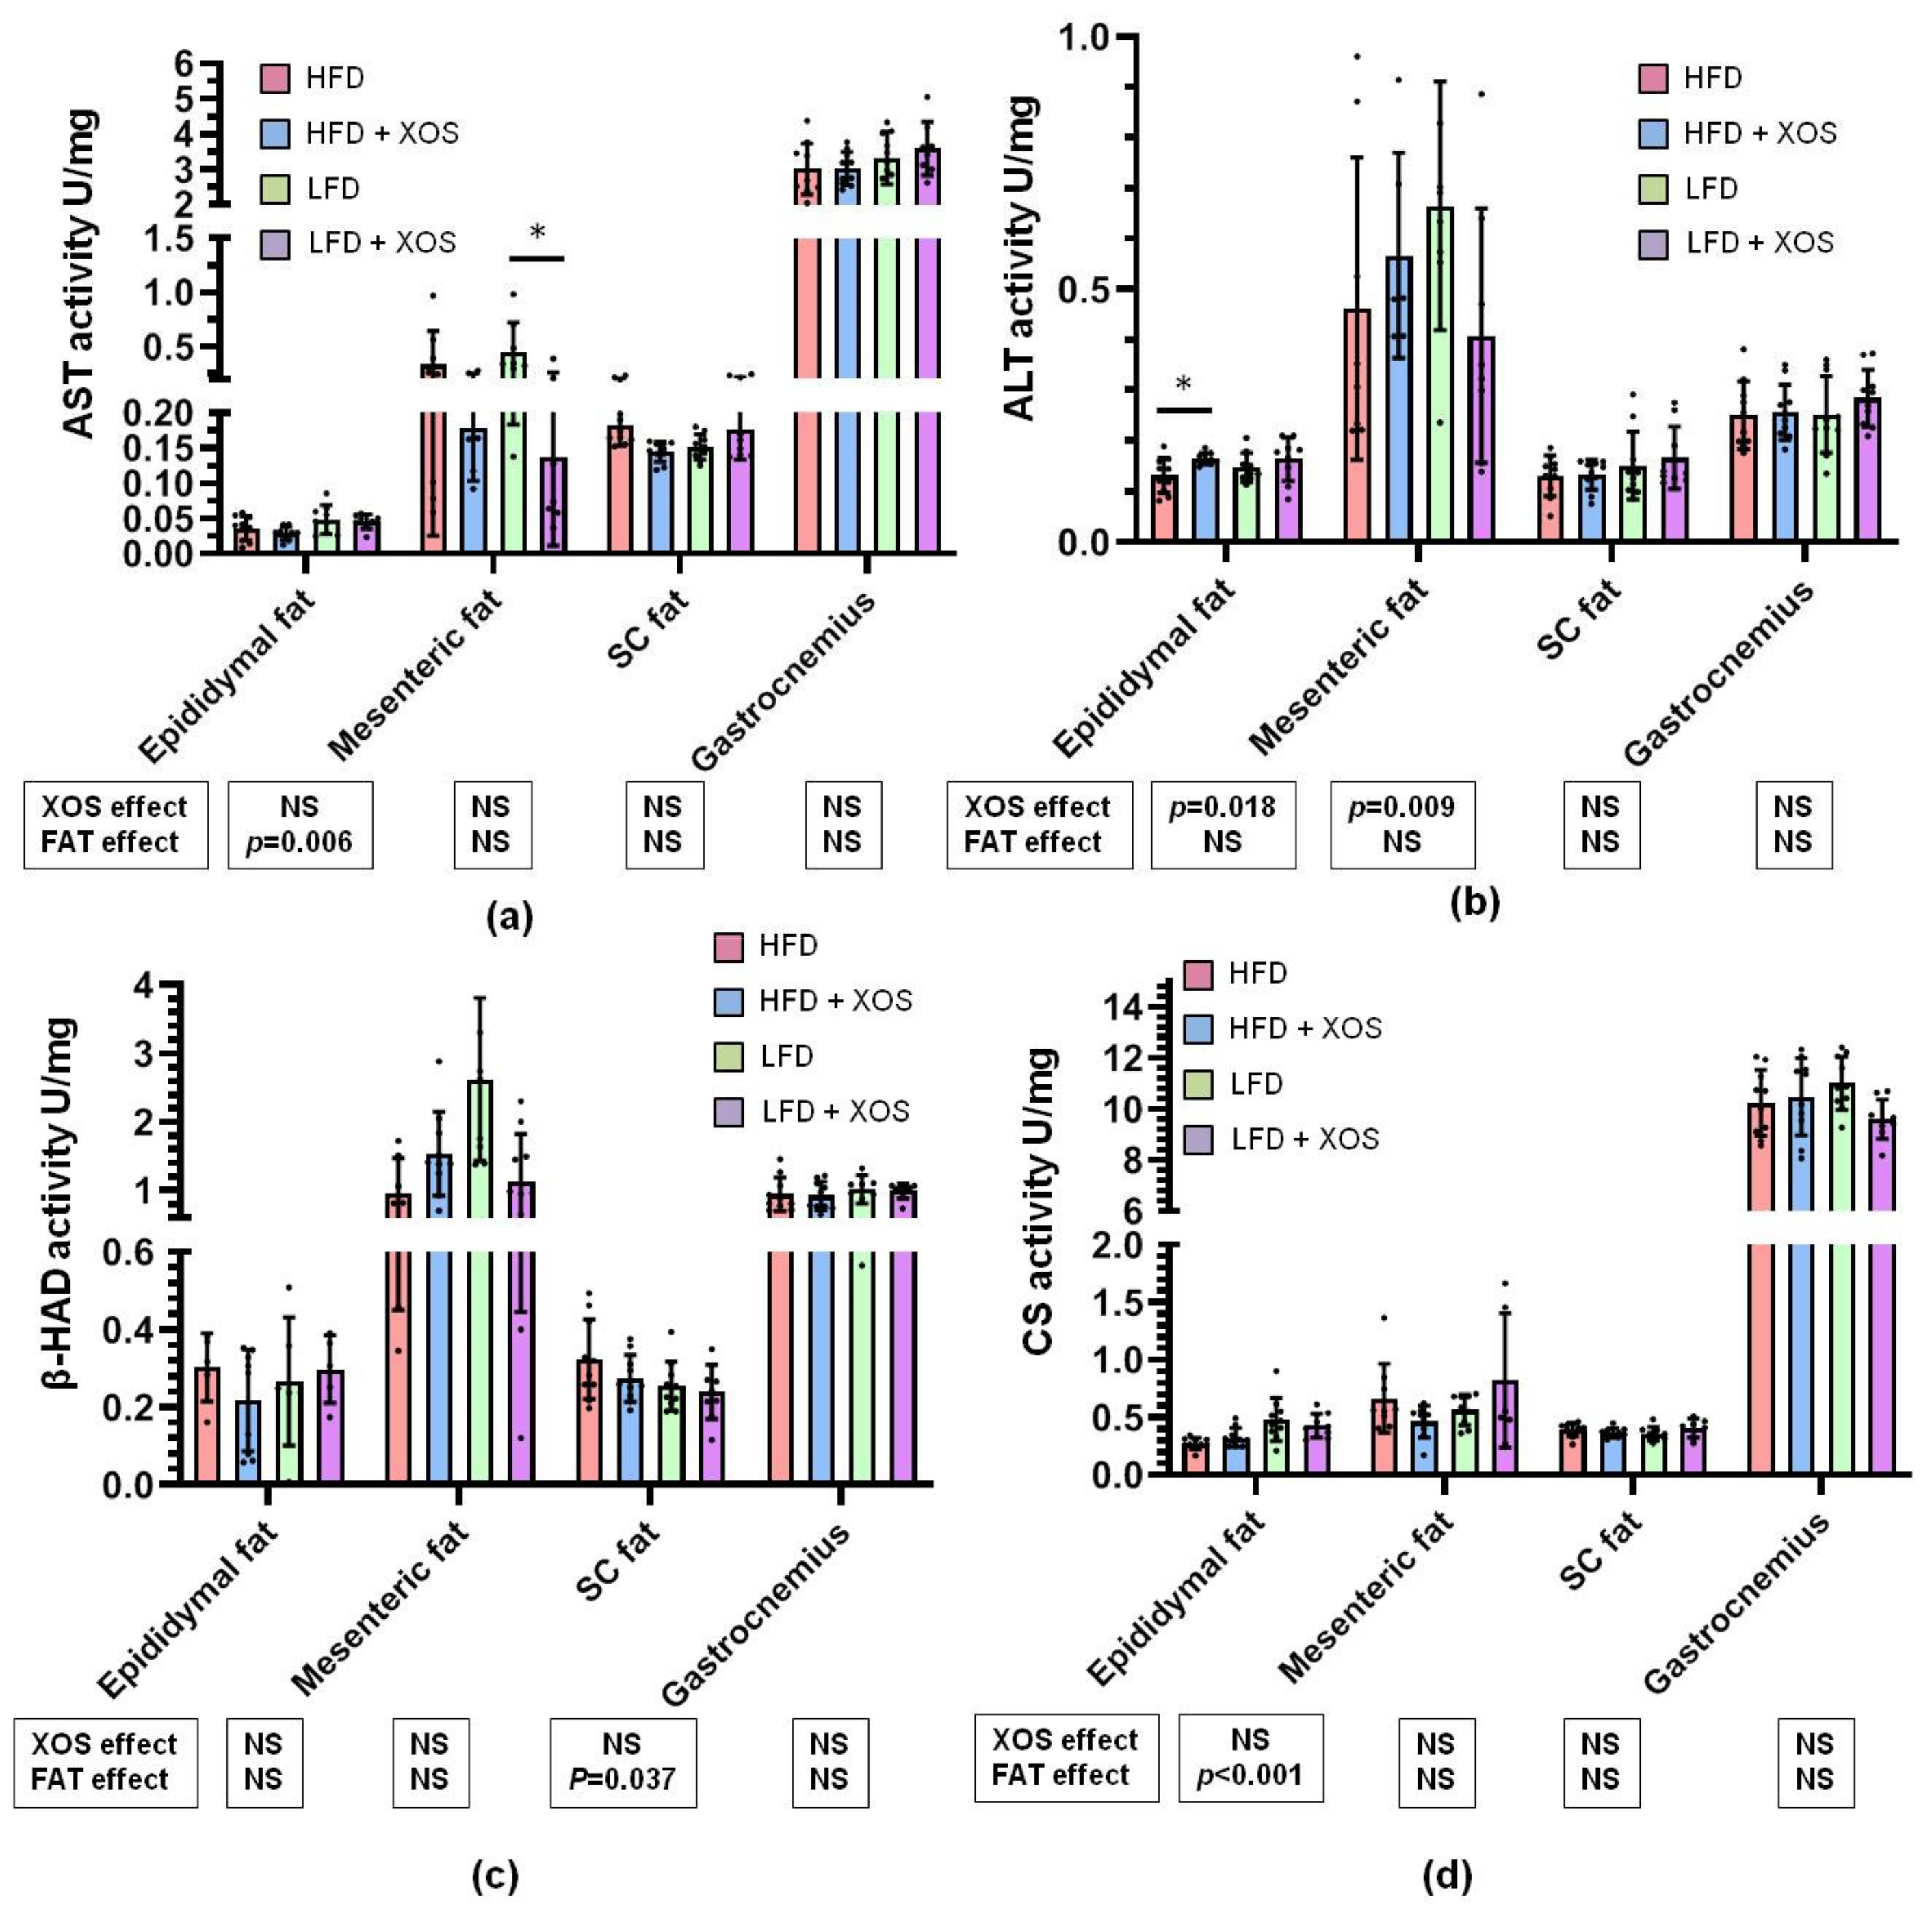
3.6. The Effects of the Diets on the Activities of Metabolic Enzymes
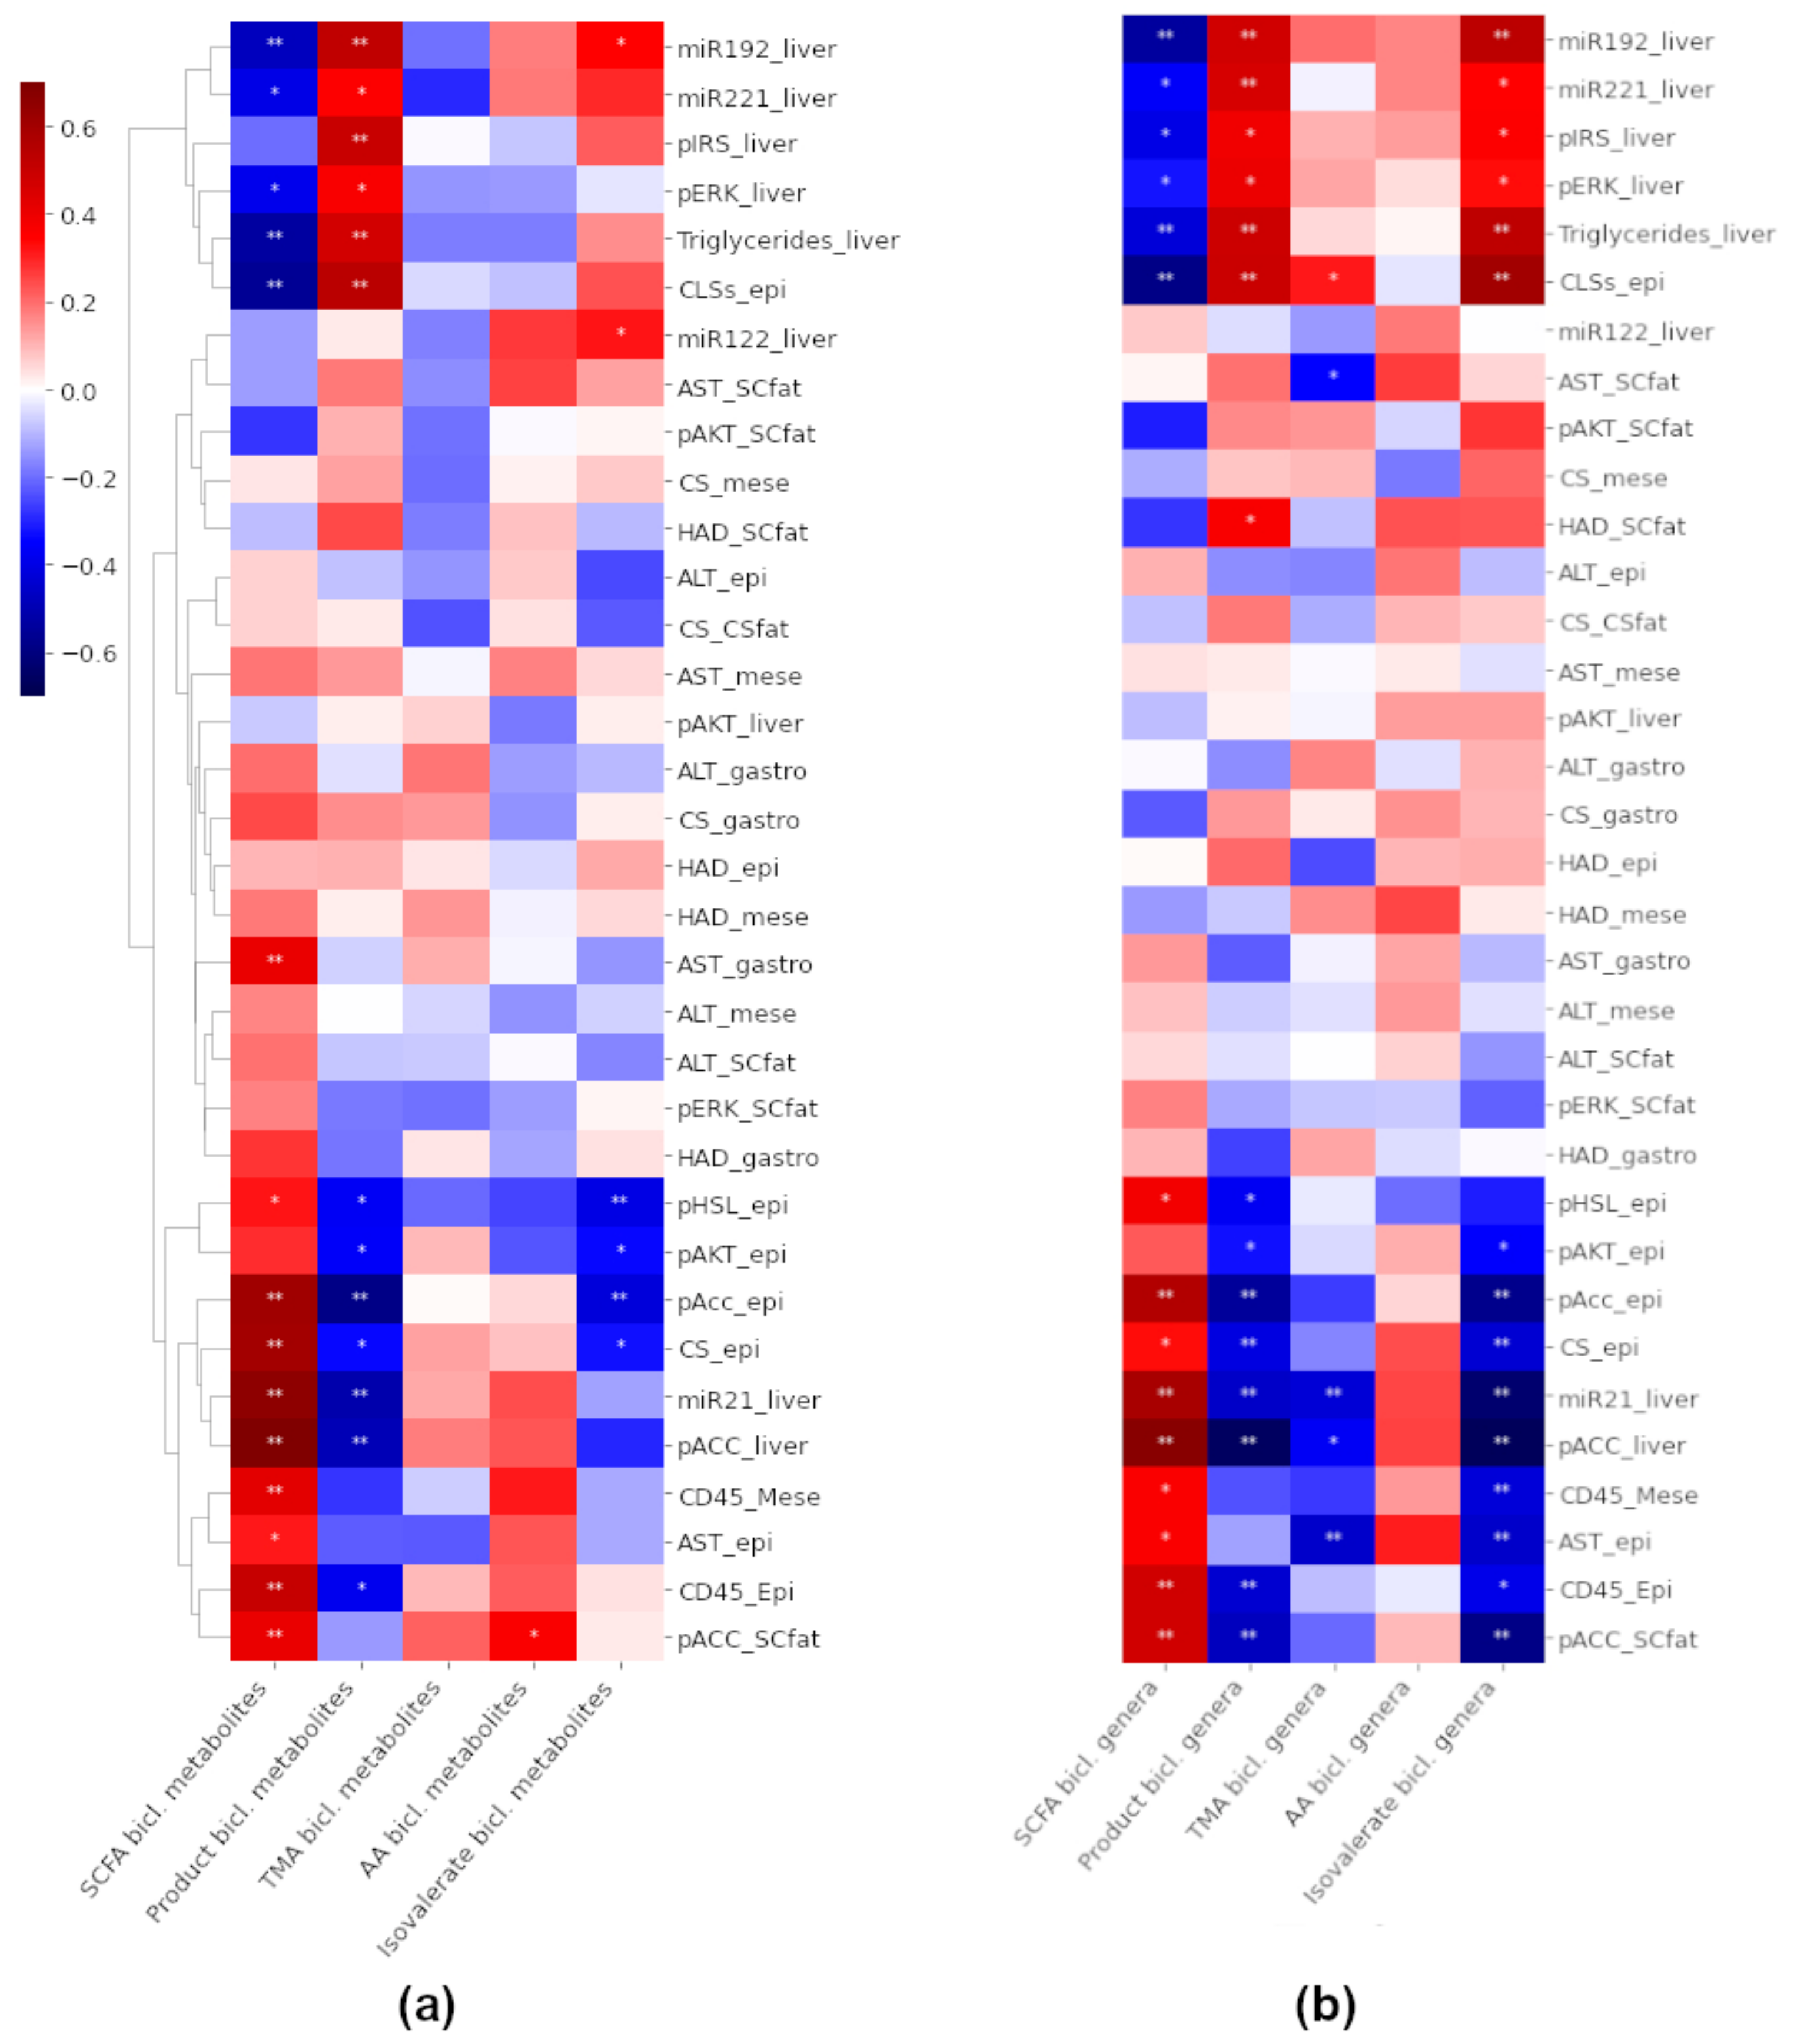
3.7. Associations between the Biclusters and Biomarkers
4. Discussion
5. Conclusions
Supplementary Materials
Author Contributions
Funding
Institutional Review Board Statement
Informed Consent Statement
Data Availability Statement
Acknowledgments
Conflicts of Interest
References
- McPherson, S.; Hardy, T.; Henderson, E.; Burt, A.D.; Day, C.P.; Anstee, Q.M. Evidence of NAFLD progression from steatosis to fibrosing-steatohepatitis using paired biopsies: Implications for prognosis and clinical management. J. Hepatol. 2015, 62, 1148–1155. [Google Scholar] [CrossRef] [PubMed]
- Henao-Mejia, J.; Elinav, E.; Thaiss, C.A.; Licona-Limon, P.; Flavell, R.A. Role of the intestinal microbiome in liver disease. J. Autoimmun. 2013, 46, 66–73. [Google Scholar] [CrossRef]
- Henao-Mejia, J.; Elinav, E.; Jin, C.; Hao, L.; Mehal, W.Z.; Strowig, T.; Thaiss, C.A.; Kau, A.L.; Eisenbarth, S.C.; Jurczak, M.J.; et al. Inflammasome-mediated dysbiosis regulates progression of NAFLD and obesity. Nature 2012, 482, 179–185. [Google Scholar] [CrossRef] [Green Version]
- Munukka, E.; Pekkala, S.; Wiklund, P.; Rasool, O.; Borra, R.; Kong, L.; Ojanen, X.; Cheng, S.M.; Roos, C.; Tuomela, S.; et al. Gut-adipose tissue axis in hepatic fat accumulation in humans. J. Hepatol. 2014, 61, 132–138. [Google Scholar] [CrossRef]
- Lensu, S.; Pariyani, R.; Mäkinen, E.; Yang, B.; Saleem, W.; Munukka, E.; Lehti, M.; Driuchina, A.; Lindén, J.; Tiirola, M.; et al. Prebiotic Xylo-Oligosaccharides Ameliorate High-Fat-Diet-Induced Hepatic Steatosis in Rats. Nutrients 2020, 12, 3225. [Google Scholar] [CrossRef]
- Munukka, E.; Rintala, A.; Toivonen, R.; Nylund, M.; Yang, B.; Takanen, A.; Hänninen, A.; Vuopio, J.; Huovinen, P.; Jalkanen, S.; et al. Faecalibacterium prausnitzii treatment improves hepatic health and reduces adipose tissue inflammation in high-fat fed mice. ISME J. 2017, 11, 1667–1679. [Google Scholar] [CrossRef] [Green Version]
- Finegold, S.M.; Li, Z.; Summanen, P.H.; Downes, J.; Thames, G.; Corbett, K.; Dowd, S.; Krak, M.; Heber, D. Xylooligosaccharide increases bifidobacteria but not lactobacilli in human gut microbiota. Food Funct. 2014, 5, 436–445. [Google Scholar] [CrossRef] [PubMed]
- Bril, F.; Barb, D.; Portillo-Sanchez, P.; Biernacki, D.; Lomonaco, R.; Suman, A.; Weber, M.H.; Budd, J.T.; Lupi, M.E.; Cusi, K. Metabolic and histological implications of intrahepatic triglyceride content in nonalcoholic fatty liver disease. Hepatology 2017, 65, 1132–1144. [Google Scholar] [CrossRef] [PubMed] [Green Version]
- Du Plessis, J.; Van Pelt, J.; Korf, H.; Mathieu, C.; Van Der Schueren, B.; Lannoo, M.; Oyen, T.; Topal, B.; Fetter, G.; Nayler, S.; et al. Association of Adipose Tissue Inflammation with Histologic Severity of Nonalcoholic Fatty Liver Disease. Gastroenterology 2015, 149, 635.e14–648.e14. [Google Scholar] [CrossRef] [Green Version]
- Kazankov, K.; Jørgensen, S.M.D.; Thomsen, K.L.; Møller, H.J.; Vilstrup, H.; George, J.; Schuppan, D.; Grønbæk, H. The role of macrophages in nonalcoholic fatty liver disease and nonalcoholic steatohepatitis. Nat. Rev. Gastroenterol. Hepatol. 2019, 16, 145–159. [Google Scholar] [CrossRef] [PubMed]
- Stanton, M.C.; Chen, S.C.; Jackson, J.V.; Rojas-Triana, A.; Kinsley, D.; Cui, L.; Fine, J.S.; Greenfeder, S.; Bober, L.A.; Jenh, C.H. Inflammatory Signals shift from adipose to liver during high fat feeding and influence the development of steatohepatitis in mice. J. Inflamm. 2011, 8, 8–22. [Google Scholar] [CrossRef] [PubMed] [Green Version]
- Bijnen, M.; Josefs, T.; Cuijpers, I.; Maalsen, C.J.; Van De Gaar, J.; Vroomen, M.; Wijnands, E.; Rensen, S.S.; Greve, J.W.M.; Hofker, M.H.; et al. Adipose tissue macrophages induce hepatic neutrophil recruitment and macrophage accumulation in mice. Gut 2018, 67, 1317–1327. [Google Scholar] [CrossRef] [PubMed]
- Eguchi, A.; Feldstein, A.E. Adipocyte Cell Death, Fatty Liver Disease and Associated Metabolic Disorders. Dig. Dis. 2014, 32, 579–585. [Google Scholar] [CrossRef] [PubMed] [Green Version]
- Wentworth, J.M.; Naselli, G.; Brown, W.A.; Doyle, L.; Phipson, B.; Smyth, G.K.; Wabitsch, M.; O’Brien, P.E.; Harrison, L.C. Pro-inflammatory CD11c+CD206+ adipose tissue macrophages are associated with insulin resistance in human obesity. Diabetes 2010, 59, 1648–1656. [Google Scholar] [CrossRef] [PubMed] [Green Version]
- Alkhouri, N.; Gornicka, A.; Berk, M.P.; Thapaliya, S.; Dixon, L.J.; Kashyap, S.; Schauer, P.R.; Feldstein, A.E. Adipocyte apoptosis, a link between obesity, insulin resistance, and hepatic steatosis. J. Biol. Chem. 2010, 285, 3428–3438. [Google Scholar] [CrossRef] [PubMed] [Green Version]
- Dai, X.; Hou, H.; Zhang, W.; Liu, T.; Li, Y.; Wang, S.; Wang, B.; Cao, H. Microbial Metabolites: Critical Regulators in NAFLD. Front. Microbiol. 2020, 11, 2373–2385. [Google Scholar] [CrossRef]
- Wang, B.; Jiang, X.; Cao, M.; Ge, J.; Bao, Q.; Tang, L.; Chen, Y.; Li, L. Altered fecal microbiota correlates with liver biochemistry in nonobese patients with non-alcoholic fatty liver disease. Sci. Rep. 2016, 6, 32002. [Google Scholar] [CrossRef]
- Puddu, A.; Sanguineti, R.; Montecucco, F.; Viviani, G.L. Evidence for the gut microbiota short-chain fatty acids as key pathophysiological molecules improving diabetes. Mediat. Inflamm. 2014, 2014, 162021. [Google Scholar] [CrossRef] [PubMed]
- Da Silva, H.E.; Teterina, A.; Comelli, E.M.; Taibi, A.; Arendt, B.M.; Fischer, S.E.; Lou, W.; Allard, J.P. Nonalcoholic fatty liver disease is associated with dysbiosis independent of body mass index and insulin resistance. Sci. Rep. 2018, 8, 1–12. [Google Scholar] [CrossRef] [Green Version]
- Raman, M.; Ahmed, I.; Gillevet, P.M.; Probert, C.S.; Ratcliffe, N.M.; Smith, S.; Greenwood, R.; Sikaroodi, M.; Lam, V.; Crotty, P.; et al. Fecal microbiome and volatile organic compound metabolome in obese humans with nonalcoholic fatty liver disease. Clin. Gastroenterol. Hepatol. 2013, 11, 868–875.e3. [Google Scholar] [CrossRef] [PubMed]
- Song, L.; Li, Y.; Qu, D.; Ouyang, P.; Ding, X.; Wu, P.; Guan, Q.; Yang, L. The regulatory effects of phytosterol esters (PSEs) on gut flora and faecal metabolites in rats with NAFLD. In Proceedings of the Food and Function; Royal Society of Chemistry: Cambridge, UK, 2020; Volume 11, pp. 977–991. [Google Scholar]
- Chashmniam, S.; Ghafourpour, M.; Farimani, A.R.; Gholami, A.; Ghoochani, B.F.N.M. Metabolomic biomarkers in the diagnosis of non-alcoholic fatty liver disease. Hepat. Mon. 2019, 19, e92244. [Google Scholar] [CrossRef] [Green Version]
- Liang, Y.; Zhang, Y.; Deng, Y.; Liang, S.; He, Y.; Chen, Y.; Liu, C.; Lin, C.; Han, L.; Tu, G.; et al. Chaihu-Shugan-San Decoction Modulates Intestinal Microbe Dysbiosis and Alleviates Chronic Metabolic Inflammation in NAFLD Rats via the NLRP3 Inflammasome Pathway. Evid. Based Complement. Altern. Med. 2018, 2018, 9390786. [Google Scholar] [CrossRef] [PubMed] [Green Version]
- Tricò, D.; Biancalana, E.; Solini, A. Protein and amino acids in nonalcoholic fatty liver disease. Curr. Opin. Clin. Nutr. Metab. Care 2021, 24, 96–101. [Google Scholar] [CrossRef] [PubMed]
- Zhang, Y.; Chen, L.; Hu, M.; Kim, J.J.; Lin, R.; Xu, J.; Fan, L.; Qi, Y.; Wang, L.; Liu, W.; et al. Dietary type 2 resistant starch improves systemic inflammation and intestinal permeability by modulating microbiota and metabolites in aged mice on high-fat diet. Aging 2020, 12, 9173–9187. [Google Scholar] [CrossRef]
- Gaggini, M.; Carli, F.; Rosso, C.; Buzzigoli, E.; Marietti, M.; Della Latta, V.; Ciociaro, D.; Abate, M.L.; Gambino, R.; Cassader, M.; et al. Altered amino acid concentrations in NAFLD: Impact of obesity and insulin resistance. Hepatology 2018, 67, 145–158. [Google Scholar] [CrossRef] [Green Version]
- Newgard, C.B.; An, J.; Bain, J.R.; Muehlbauer, M.J.; Stevens, R.D.; Lien, L.F.; Haqq, A.M.; Shah, S.H.; Arlotto, M.; Slentz, C.A.; et al. A Branched-Chain Amino Acid-Related Metabolic Signature that Differentiates Obese and Lean Humans and Contributes to Insulin Resistance. Cell Metab. 2009, 9, 311–326. [Google Scholar] [CrossRef] [Green Version]
- Kalhan, S.C.; Guo, L.; Edmison, J.; Dasarathy, S.; McCullough, A.J.; Hanson, R.W.; Milburn, M. Plasma metabolomic profile in nonalcoholic fatty liver disease. Metabolism 2011, 60, 404–413. [Google Scholar] [CrossRef] [Green Version]
- Qu, K.; Guo, F.; Liu, X.; Lin, Y.; Zou, Q. Application of machine learning in microbiology. Front. Microbiol. 2019, 10, 827. [Google Scholar] [CrossRef]
- Kyrpides, N.; Nayfach, S.; Badger, J.; Moreno-indias, I.; Pongor, S.; Promponas, V.; Przymus, P.; Moreno-indias, I.; Lahti, L.; Nedyalkova, M.; et al. Statistical and Machine Learning Techniques in Human Microbiome Studies: Contemporary Challenges and Solutions. Front. Microbiol. 2021, 12, 11. [Google Scholar] [CrossRef]
- Marcos-Zambrano, L.J.; Karaduzovic-Hadziabdic, K.; Loncar Turukalo, T.; Przymus, P.; Trajkovik, V.; Aasmets, O.; Berland, M.; Gruca, A.; Hasic, J.; Hron, K.; et al. Applications of Machine Learning in Human Microbiome Studies: A Review on Feature Selection, Biomarker Identification, Disease Prediction and Treatment. Front. Microbiol. 2021, 12, 313. [Google Scholar] [CrossRef]
- Liu, Y.; Meric, G.; Havulinna, A.S.; Teo, S.M.; Ruuskanen, M.; Sanders, J.; Zhu, Q.; Tripathi, A.; Verspoor, K.; Cheng, S.; et al. Early prediction of liver disease using conventional risk factors and gut microbiome-augmented gradient boosting. medRxiv 2020, 13. [Google Scholar] [CrossRef]
- Ruuskanen, M.O.; Åberg, F.; Männistö, V.; Havulinna, A.S.; Méric, G.; Liu, Y.; Loomba, R.; Vázquez-Baeza, Y.; Tripathi, A.; Valsta, L.M.; et al. Links between gut microbiome composition and fatty liver disease in a large population sample. Gut Microbes 2021, in press. [Google Scholar] [CrossRef]
- DiMaggio, P.A.; McAllister, S.R.; Floudas, C.A.; Feng, X.J.; Rabinowitz, J.D.; Rabitz, H.A. Biclustering via optimal re-ordering of data matrices in systems biology: Rigorous methods and comparative studies. BMC Bioinform. 2008, 9, 1–16. [Google Scholar] [CrossRef] [Green Version]
- Madeira, S.C.; Oliveira, A.L. Biclustering algorithms for biological data analysis: A survey. IEEE/ACM Trans. Comput. Biol. Bioinform. 2004, 1, 24–45. [Google Scholar] [CrossRef] [PubMed]
- Lahti, L.; Salonen, A.; Kekkonen, R.A.; Salojärvi, J.; Jalanka-Tuovinen, J.; Palva, A.; Orešič, M.; de Vos, W.M. Associations between the human intestinal microbiota, Lactobacillus rhamnosus GG and serum lipids indicated by integrated analysis of high-throughput profiling data. PeerJ 2013, 2013, e32. [Google Scholar] [CrossRef] [PubMed] [Green Version]
- Gu, Q.; Veselkov, K. Bi-clustering of metabolic data using matrix factorization tools. Methods 2018, 151, 12–20. [Google Scholar] [CrossRef] [PubMed]
- Zhou, F.; He, K.; Li, Q.; Chapkin, R.S.; Ni, Y. Bayesian biclustering for microbial metagenomic sequencing data via multinomial matrix factorization. arXiv 2020, arXiv:2005.08361. [Google Scholar]
- Ahonen, M.A.; Taskinen, J.H.; Latorre, J.; Ortega, F.J.; Pa, N.H.; Olkkonen, V. Microrna-221-3P alters human adipocyte lipid storage by regulating glucose and lipid metabolism. Atherosclerosis 2020, 315, e99. [Google Scholar] [CrossRef]
- Liu, X.L.; Cao, H.X.; Wang, B.C.; Xin, F.Z.; Zhang, R.N.; Zhou, D.; Yang, R.X.; Zhao, Z.H.; Pan, Q.; Fan, J.G. MiR-192-5p regulates lipid synthesis in non-Alcoholic fatty liver disease through SCD-1. World J. Gastroenterol. 2017, 23, 8140–8151. [Google Scholar] [CrossRef]
- Dhillon, I.S. Co-clustering documents and words using bipartite spectral graph partitioning. In Proceedings of the Seventh ACM SIGKDD International Conference on Knowledge Discovery and Data Mining, San Francisco, CA, USA, 26–29 August 2001; Association for Computing Machinery (ACM): New York, NY, USA, 2001; pp. 269–274. [Google Scholar]
- Griffiths-Jones, S.; Grocock, R.J.; van Dongen, S.; Bateman, A.; Enright, A.J. miRBase: MicroRNA sequences, targets and gene nomenclature. Nucleic Acids Res. 2006, 34, D140–D144. [Google Scholar] [CrossRef]
- Duygu, B.; Poels, E.M.; Juni, R.; Bitsch, N.; Ottaviani, L.; Olieslagers, S.; de Windt, L.J.; da Costa Martins, P.A. miR-199b-5p is a regulator of left ventricular remodeling following myocardial infarction. Non Coding RNA Res. 2017, 2, 18–26. [Google Scholar] [CrossRef] [PubMed]
- Chen, T.; Guestrin, C. XGBoost: A scalable tree boosting system. In Proceedings of the ACM SIGKDD International Conference on Knowledge Discovery and Data Mining, San Francisco, CA, USA, 13–17 August 2016; Association for Computing Machinery: New York, NY, USA, 2016; pp. 785–794. [Google Scholar]
- Statnikov, A.; Henaff, M.; Narendra, V.; Konganti, K.; Li, Z.; Yang, L.; Pei, Z.; Blaser, M.J.; Aliferis, C.F.; Alekseyenko, A.V. A comprehensive evaluation of multicategory classification methods for microbiomic data. Microbiome 2013, 1, 11. [Google Scholar] [CrossRef]
- Oliphant, K.; Allen-Vercoe, E. Macronutrient metabolism by the human gut microbiome: Major fermentation by-products and their impact on host health. Microbiome 2019, 7, 1–15. [Google Scholar] [CrossRef] [PubMed]
- Apajalahti, J.; Vienola, K.; Raatikainen, K.; Holder, V.; Moran, C.A. Conversion of Branched-Chain Amino Acids to Corresponding Isoacids—An in vitro Tool for Estimating Ruminal Protein Degradability. Front. Vet. Sci. 2019, 6, 311. [Google Scholar] [CrossRef]
- Zagato, E.; Pozzi, C.; Bertocchi, A.; Schioppa, T.; Saccheri, F.; Guglietta, S.; Fosso, B.; Melocchi, L.; Nizzoli, G.; Troisi, J.; et al. Endogenous murine microbiota member Faecalibaculum rodentium and its human homologue protect from intestinal tumour growth. Nat. Microbiol. 2020, 5, 511–524. [Google Scholar] [CrossRef] [PubMed]
- Schwiertz, A.; Hold, G.L.; Duncan, S.H.; Gruhl, B.; Collins, M.D.; Lawson, P.A.; Flint, H.J.; Blaut, M. Anaerostipes caccae gen. nov., sp. nov., a new saccharolytic, acetate-utilising, butyrate-producing bacterium from human faeces. Syst. Appl. Microbiol. 2002, 25, 46–51. [Google Scholar] [CrossRef] [Green Version]
- Wang, K.; Liao, M.; Zhou, N.; Bao, L.; Ma, K.; Zheng, Z.; Wang, Y.; Liu, C.; Wang, W.; Wang, J.; et al. Parabacteroides distasonis Alleviates Obesity and Metabolic Dysfunctions via Production of Succinate and Secondary Bile Acids. Cell Rep. 2019, 26, 222–235.e5. [Google Scholar] [CrossRef] [PubMed] [Green Version]
- Waters, J.L.; Ley, R.E. The human gut bacteria Christensenellaceae are widespread, heritable, and associated with health. BMC Biol. 2019, 17, 83. [Google Scholar] [CrossRef] [PubMed]
- Goodrich, J.K.; Waters, J.L.; Poole, A.C.; Sutter, J.L.; Koren, O.; Blekhman, R.; Beaumont, M.; Van Treuren, W.; Knight, R.; Bell, J.T.; et al. Human genetics shape the gut microbiome. Cell 2014, 159, 789–799. [Google Scholar] [CrossRef] [PubMed] [Green Version]
- Pfleiderer, A.; Lagier, J.C.; Armougom, F.; Robert, C.; Vialettes, B.; Raoult, D. Culturomics identified 11 new bacterial species from a single anorexia nervosa stool sample. Eur. J. Clin. Microbiol. Infect. Dis. 2013, 32, 1471–1481. [Google Scholar] [CrossRef]
- Li, H.; Liu, F.; Lu, J.; Shi, J.; Guan, J.; Yan, F.; Li, B.; Huo, G. Probiotic Mixture of Lactobacillus plantarum Strains Improves Lipid Metabolism and Gut Microbiota Structure in High Fat Diet-Fed Mice. Front. Microbiol. 2020, 11, 512. [Google Scholar] [CrossRef] [Green Version]
- Zhang, Z.; Wang, X.; Han, S.; Liu, C.; Liu, F. Effect of two seaweed polysaccharides on intestinal microbiota in mice evaluated by illumina PE250 sequencing. Int. J. Biol. Macromol. 2018, 112, 796–802. [Google Scholar] [CrossRef]
- Hill, G.B.; Ayers, O.M.; Kohan, A.P. Characteristics and sites of infection of Eubacterium nodatum, Eubacterium timidum, Eubacterium brachy, and other asaccharolytic eubacteria. J. Clin. Microbiol. 1987, 25, 1540–1545. [Google Scholar] [CrossRef] [PubMed] [Green Version]
- Winther, S.A.; Henriksen, P.; Vogt, J.K.; Hansen, T.H.; Ahonen, L.; Suvitaival, T.; Hein Zobel, E.; Frimodt-Møller, M.; Hansen, T.W.; Hansen, T.; et al. Gut microbiota profile and selected plasma metabolites in type 1 diabetes without and with stratification by albuminuria. Diabetologia 2020, 63, 2713–2724. [Google Scholar] [CrossRef]
- Natividad, J.M.; Lamas, B.; Pham, H.P.; Michel, M.L.; Rainteau, D.; Bridonneau, C.; Da Costa, G.; Van Hylckama Vlieg, J.; Sovran, B.; Chamignon, C.; et al. Bilophila wadsworthia aggravates high fat diet induced metabolic dysfunctions in mice. Nat. Commun. 2018, 9, 1–15. [Google Scholar] [CrossRef] [Green Version]
- Jameson, E.; Quareshy, M.; Chen, Y. Methodological considerations for the identification of choline and carnitine-degrading bacteria in the gut. Methods 2018, 149, 42–48. [Google Scholar] [CrossRef] [PubMed]
- Fennema, D.; Phillips, I.R.; Shephard, E.A. Trimethylamine and trimethylamine N-oxide, a Flavin-Containing Monooxygenase 3 (FMO3)-mediated host-microbiome metabolic axis implicated in health and disease. Drug Metab. Dispos. 2016, 44, 1839–1850. [Google Scholar] [CrossRef] [PubMed] [Green Version]
- Szabo, G.; Csak, T. Role of MicroRNAs in NAFLD/NASH. Dig. Dis. Sci. 2016, 61, 1314–1324. [Google Scholar] [CrossRef] [PubMed]
- Eren, K.; Deveci, M.; Kucuktunc, O.; Catalyurek, U.V. A comparative analysis of biclustering algorithms for gene expression data. Brief. Bioinform. 2013, 14, 279–292. [Google Scholar] [CrossRef] [PubMed]
- Rom, O.; Liu, Y.; Liu, Z.; Zhao, Y.; Wu, J.; Ghrayeb, A.; Villacorta, L.; Fan, Y.; Chang, L.; Wang, L.; et al. Glycine-based treatment ameliorates NAFLD by modulating fatty acid oxidation, glutathione synthesis, and the gut microbiome. Sci. Transl. Med. 2020, 12, eaaz2841. [Google Scholar] [CrossRef] [PubMed]
- Furuhashi, M.; Koyama, M.; Higashiura, Y.; Murase, T.; Nakamura, T.; Matsumoto, M.; Sakai, A.; Ohnishi, H.; Tanaka, M.; Saitoh, S.; et al. Differential regulation of hypoxanthine and xanthine by obesity in a general population. J. Diabetes Investig. 2020, 11, 878–887. [Google Scholar] [CrossRef] [PubMed] [Green Version]
- Lv, Y.; Gao, X.; Luo, Y.; Fan, W.; Shen, T.; Ding, C.; Yao, M.; Song, S.; Yan, L. Apigenin ameliorates HFD-induced NAFLD through regulation of the XO/NLRP3 pathways. J. Nutr. Biochem. 2019, 71, 110–121. [Google Scholar] [CrossRef] [PubMed]
- Cheng, S.; Wiklund, P.K.; Pekkala, S.; Autio, R.; Munukka, E.; Xu, L.; Saltevo, J.; Cheng, S.; Kujala, U.M.; Alen, M. Serum metabolic profiles in overweight and obese women with and without metabolic syndrome. Diabetol. Metab. Syndr. 2014, 6, 40. [Google Scholar] [CrossRef] [Green Version]
- Ahn, J.; Lee, H.; Jung, C.H.; Ha, T. Lycopene inhibits hepatic steatosis via microRNA-21-induced downregulation of fatty acid-binding protein 7 in mice fed a high-fat diet. Mol. Nutr. Food Res. 2012, 56, 1665–1674. [Google Scholar] [CrossRef]
- Luo, A.; Yan, H.; Liang, J.; Du, C.; Zhao, X.; Sun, L.; Chen, Y. MicroRNA-21 regulates hepatic glucose metabolism by targeting FOXO1. Gene 2017, 627, 194–201. [Google Scholar] [CrossRef]
- Loyer, X.; Paradis, V.; Hénique, C.; Vion, A.C.; Colnot, N.; Guerin, C.L.; Devue, C.; On, S.; Scetbun, J.; Romain, M.; et al. Liver microRNA-21 is overexpressed in non-alcoholic steatohepatitis and contributes to the disease in experimental models by inhibiting PPARα expression. Gut 2016, 65, 1882–1894. [Google Scholar] [CrossRef] [Green Version]
- Liu, J.; Xiao, Y.; Wu, X.; Jiang, L.; Yang, S.; Ding, Z.; Fang, Z.; Hua, H.; Kirby, M.S.; Shou, J. A circulating microRNA signature as noninvasive diagnostic and prognostic biomarkers for nonalcoholic steatohepatitis. BMC Genom. 2018, 19, 188. [Google Scholar] [CrossRef] [Green Version]
- Sun, C.; Huang, F.; Liu, X.; Xiao, X.; Yang, M.; Hu, G.; Liu, H.; Liao, L. miR-21 regulates triglyceride and cholesterol metabolism in non-alcoholic fatty liver disease by targeting HMGCR. Int. J. Mol. Med. 2015, 35, 847–853. [Google Scholar] [CrossRef] [Green Version]
- Hu, J.; Xu, Y.; Hao, J.; Wang, S.; Li, C.; Meng, S. MiR-122 in hepatic function and liver diseases. Protein Cell 2012, 3, 364–371. [Google Scholar] [CrossRef] [Green Version]
- Lin, Y.; Ding, D.; Huang, Q.; Liu, Q.; Lu, H.; Lu, Y.; Chi, Y.; Sun, X.; Ye, G.; Zhu, H.; et al. Downregulation of miR-192 causes hepatic steatosis and lipid accumulation by inducing SREBF1: Novel mechanism for bisphenol A-triggered non-alcoholic fatty liver disease. Biochim. Biophys. Acta Mol. Cell Biol. Lipids 2017, 1862, 869–882. [Google Scholar] [CrossRef]
- Liu, X.L.; Pan, Q.; Cao, H.X.; Xin, F.Z.; Zhao, Z.H.; Yang, R.X.; Zeng, J.; Zhou, H.; Fan, J.G. Lipotoxic Hepatocyte-Derived Exosomal MicroRNA 192-5p Activates Macrophages Through Rictor/Akt/Forkhead Box Transcription Factor O1 Signaling in Nonalcoholic Fatty Liver Disease. Hepatology 2020, 72, 454–469. [Google Scholar] [CrossRef]
- De Conti, A.; Ortega, J.F.; Tryndyak, V.; Dreval, K.; Moreno, F.S.; Rusyn, I.; Beland, F.A.; Pogribny, I.P. MicroRNA deregulation in nonalcoholic steatohepatitisassociated liver carcinogenesis. Oncotarget 2017, 8, 88517–88528. [Google Scholar] [CrossRef] [PubMed] [Green Version]
- Ogawa, T.; Enomoto, M.; Fujii, H.; Sekiya, Y.; Yoshizato, K.; Ikeda, K.; Kawada, N. MicroRNA-221/222 upregulation indicates the activation of stellate cells and the progression of liver fibrosis. Gut 2012, 61, 1600–1609. [Google Scholar] [CrossRef]
- Carlson, C.A.; Kim, K.H. Regulation of hepatic acetyl coenzyme A carboxylase by phosphorylation and dephosphorylation. J. Biol. Chem. 1973, 248, 378–380. [Google Scholar] [CrossRef]
- Carling, D.; Zammit, V.A.; Hardie, D.G. A common bicyclic protein kinase cascade inactivates the regulatory enzymes of fatty acid and cholesterol biosynthesis. FEBS Lett. 1987, 223, 217–222. [Google Scholar] [CrossRef] [Green Version]
- Munday, M.R.; Carling, D.; Hardie, D.G. Negative interactions between phosphorylation of acetyl-CoA carboxylase by the cyclic AMP-dependent and AMP-activated protein kinases. FEBS Lett. 1988, 235, 144–148. [Google Scholar] [CrossRef] [Green Version]
- Ha, J.; Daniel, S.; Broyles, S.S.; Kim, K.H. Critical phosphorylation sites for acetyl-CoA carboxylase activity. J. Biol. Chem. 1994, 269, 22162–22168. [Google Scholar] [CrossRef]
- McGarry, J.D.; Kuwajima, M.; Newgard, C.B.; Foster, D.W.; Katz, J. From Dietary Glucose to Liver Glycogen: The Full Circle Round. Annu. Rev. Nutr. 1987, 7, 51–73. [Google Scholar] [CrossRef]
- Ye, L.; Cao, Z.; Lai, X.; Shi, Y.; Zhou, N. Niacin Ameliorates Hepatic Steatosis by Inhibiting de Novo Lipogenesis Via a GPR109A-Mediated PKC-ERK1/2-AMPK Signaling Pathway in C57BL/6 Mice Fed a High-Fat Diet. J. Nutr. 2020, 150, 672–684. [Google Scholar] [CrossRef] [PubMed]
- He, J.; Zhang, P.; Shen, L.; Niu, L.; Tan, Y.; Chen, L.; Zhao, Y.; Bai, L.; Hao, X.; Li, X.; et al. Short-chain fatty acids and their association with signalling pathways in inflammation, glucose and lipid metabolism. Int. J. Mol. Sci. 2020, 21, 6356. [Google Scholar] [CrossRef]
- Lee, S.; Lynn, E.G.; Kim, J.; Quon, M.J. Protein Kinase C-ζ Phosphorylates Insulin Receptor Substrate-1, -3, and -4 But Not -2: Isoform Specific Determinants of Specificity in Insulin Signaling. Endocrinology 2008, 149, 2451–2458. [Google Scholar] [CrossRef] [Green Version]
- Zick, Y. Ser/Thr phosphorylation of IRS proteins: A molecular basis for insulin resistance. Sci. STKE 2005, 2005, pe4. [Google Scholar] [CrossRef]
- Khat-udomkiri, N.; Toejing, P.; Sirilun, S.; Chaiyasut, C.; Lailerd, N. Antihyperglycemic effect of rice husk derived xylooligosaccharides in high-fat diet and low-dose streptozotocin-induced type 2 diabetic rat model. Food Sci. Nutr. 2020, 8, 428–444. [Google Scholar] [CrossRef]
- Imaizumi, K.; Nakatsu, Y.; Sato, M.; Sedarnawati, Y.; Sugano, M. Effects of xylooligosaccharides on blood glucose, serum and liver lipids and-cecum short-chain fatty acids in diabetic rats. Agric. Biol. Chem. 1991, 55, 199–205. [Google Scholar] [CrossRef] [Green Version]
- Heimann, E.; Nyman, M.; Pålbrink, A.K.; Lindkvist-Petersson, K.; Degerman, E. Branched short-chain fatty acids modulate glucose and lipid metabolism in primary adipocytes. Adipocyte 2016, 5, 359–368. [Google Scholar] [CrossRef]
- Xu, H.; Barnes, G.T.; Yang, Q.; Tan, G.; Yang, D.; Chou, C.J.; Sole, J.; Nichols, A.; Ross, J.S.; Tartaglia, L.A.; et al. Chronic inflammation in fat plays a crucial role in the development of obesity-related insulin resistance. J. Clin. Investig. 2003, 112, 1821–1830. [Google Scholar] [CrossRef] [PubMed]
- De Taeye, B.M.; Novitskaya, T.; McGuinness, O.P.; Gleaves, L.; Medda, M.; Covington, J.W.; Vaughan, D.E. Macrophage TNF-α contributes to insulin resistance and hepatic steatosis in diet-induced obesity. Am. J. Physiol. Endocrinol. Metab. 2007, 293, E713–E725. [Google Scholar] [CrossRef] [PubMed]
- Kintscher, U.; Hartge, M.; Hess, K.; Foryst-Ludwig, A.; Clemenz, M.; Wabitsch, M.; Fischer-Posovszky, P.; Barth, T.F.E.; Dragun, D.; Skurk, T.; et al. T-lymphocyte infiltration in visceral adipose tissue: A primary event in adipose tissue inflammation and the development of obesity-mediated insulin resistance. Arterioscler. Thromb. Vasc. Biol. 2008, 28, 1304–1310. [Google Scholar] [CrossRef] [Green Version]
- Winer, D.A.; Winer, S.; Shen, L.; Wadia, P.P.; Yantha, J.; Paltser, G.; Tsui, H.; Wu, P.; Davidson, M.G.; Alonso, M.N.; et al. B cells promote insulin resistance through modulation of T cells and production of pathogenic IgG antibodies. Nat. Med. 2011, 17, 610–617. [Google Scholar] [CrossRef]
- Angulo, P. Obesity and Nonalcoholic Fatty Liver Disease. Nutr. Rev. 2007, 65, S57–S63. [Google Scholar] [CrossRef]
- Thomas, M.L. The Leukocyte Common Antigen Family. Annu. Rev. Immunol. 1989, 7, 339–369. [Google Scholar] [CrossRef]
- Hill, D.A.; Lim, H.W.; Kim, Y.H.; Ho, W.Y.; Foong, Y.H.; Nelson, V.L.; Nguyen, H.C.B.; Chegireddy, K.; Kim, J.; Habertheuer, A.; et al. Distinct macrophage populations direct inflammatory versus physiological changes in adipose tissue. Proc. Natl. Acad. Sci. USA 2018, 115, E5096–E5105. [Google Scholar] [CrossRef] [PubMed] [Green Version]
- Cinti, S.; Mitchell, G.; Barbatelli, G.; Murano, I.; Ceresi, E.; Faloia, E.; Wang, S.; Fortier, M.; Greenberg, A.S.; Obin, M.S. Adipocyte death defines macrophage localization and function in adipose tissue of obese mice and humans. J. Lipid Res. 2005, 46, 2347–2355. [Google Scholar] [CrossRef] [Green Version]
- Harmon, D.B.; Srikakulapu, P.; Kaplan, J.L.; Oldham, S.N.; McSkimming, C.; Garmey, J.C.; Perry, H.M.; Kirby, J.L.; Prohaska, T.A.; Gonen, A.; et al. Protective Role for B-1b B Cells and IgM in Obesity-Associated Inflammation, Glucose Intolerance, and Insulin Resistance. Arterioscler. Thromb. Vasc. Biol. 2016, 36, 682–691. [Google Scholar] [CrossRef] [PubMed] [Green Version]
- Zlotnikov-Klionsky, Y.; Nathansohn-Levi, B.; Shezen, E.; Rosen, C.; Kagan, S.; Bar-On, L.; Jung, S.; Shifrut, E.; Reich-Zeliger, S.; Friedman, N.; et al. Perforin-Positive Dendritic Cells Exhibit an Immuno-regulatory Role in Metabolic Syndrome and Autoimmunity. Immunity 2015, 43, 776–787. [Google Scholar] [CrossRef] [PubMed] [Green Version]


| Bicluster | Genera in Bicluster | Log2 Fold Change HFD/HFD + XOS | Log2 Fold Change HFD/LFD | Metabolites in Bicluster | Log2 Fold Change HFD/HFD + XOS | Log2 Fold Change HFD/LFD |
|---|---|---|---|---|---|---|
| SCFA Bicluster | [Ruminococcus] gauvreauii group | –0.14 | –2.43 * | 1,3-dihydroxyacetone | 0.17 | –0.61 |
| Anaerostipes | –1.41 | –4.04 ** | 2-oxoglutarate | 0.27 | –0.44 | |
| Christensenellaceae R-7 group | 0.42 | –0.2 | Acetate | –0.05 | –0.52 ** | |
| Clostridium sensu stricto 1 | –0.23 | –3.78 * | Butyrate | –0.07 | –1.51 ** | |
| Faecalibaculum | 1.48 | –5.69 ** | Glucose | 0.11 | –1.96 ** | |
| GCA-900066225 | –0.81 | –2.47 ** | Methionine | 0.38 | –0.06 | |
| Papillibacter | 0.86 | –3.87 ** | Nicotinate | 0.05 | –1.06 ** | |
| Parabacteroides | 0.29 | –0.48 * | Propionate | –0.01 | –0.62 ** | |
| Rodentibacter | –0.83 | –2 | Pyruvate | 0.63 | –0.98 * | |
| Romboutsia | 1.69 | –0.75 | Uracil | 0.59 | –0.51 * | |
| Ruminiclostridium 5 | 1.39 * | –2.31 ** | Urocanate | 0.48 | –0.63 | |
| Ruminococcaceae UCG-014 | 0.25 | –0.82 | ||||
| Turicibacter | 1.16 | –3.96 ** | ||||
| Product Bicluster | [Bacteroides] pectinophilus group | –3.51 | 0.8 | Aspartate | 0.06 | 0.17 |
| [Eubacterium] coprostanoligenes group | –0.42 | –0.12 | Isobutyrate | 0.08 | 0.57 | |
| [Eubacterium] xylanophilum group | 0.81 | 0.66 | Threonine | 0.09 | 0.47 * | |
| Akkermansia | –0.29 | 0.21 | Valerate | 0.25 | 0.47 * | |
| Alistipes | –0.01 | 1.13 * | ||||
| Defluviitaleaceae UCG-011 | 0.37 | 2.38 ** | ||||
| Family XIII AD3011 group | 1.13 ** | 1.33 * | ||||
| Odoribacter | –0.33 | 1.35 | ||||
| Ruminococcaceae UCG-005 | 0.77 | 1.93 | ||||
| TMA Bicluster | Allobaculum | 0.93 | 1.6 | Choline | 0.97 | 1.45 * |
| Alloprevotella | –0.5 | –0.05 | Ethanol | –0.2 | –0.08 | |
| Bacteroides | –0.1 | 0.38 | Fumarate | 0.01 | –0.39 | |
| Blautia | –0.25 | –0.69 | Glycine | –0.81 * | 0.48 | |
| Erysipelatoclostridium | –1.31 | –0.04 | Methanol | –1.09 | 0.24 | |
| Escherichia-Shigella | –1.82 ** | –0.93 | Trimethylamine | 0.15 | 0.11 | |
| Faecalitalea | –0.65 | 1.24 * | ||||
| Flavonifractor | 0.96 | 3.07 * | ||||
| Fusicatenibacter | 3.88 | 10.07 | ||||
| Holdemania | –0.32 | 0.9 | ||||
| Intestinimonas | –0.18 | –0.57 | ||||
| Lachnospiraceae UCG-008 | –0.82 | 1.46 | ||||
| Marvinbryantia | –1.65 ** | –0.95 | ||||
| Oscillospira | –0.83 | 8.89 | ||||
| Parasutterella | 0.63 | 0.98 | ||||
| AA Bicluster | Bilophila | 0.61 * | 3.41 ** | Alanine | 0.19 | 0.04 |
| Desulfovibrio | 0.75 | –0.25 | Formate | –0.8 | –0.75 ** | |
| Eisenbergiella | –0.03 | 0.05 | Glutamate | 0.08 | –0.03 | |
| Erysipelotrichaceae UCG-003 | –0.23 | –1.25 | Hypoxanthine | 1.8 ** | –0.46 * | |
| Lachnospiraceae NK4A136 group | 1.27 | 0.87 | Isoleucine | 0.34 * | –0.16 | |
| Mucispirillum | 1.51 | 1.03 | Leucine | 0.31 | 0.07 | |
| Oscillibacter | 0.7 * | –0.97 * | Methylamine | 0.73 ** | 0.5 | |
| Roseburia | –0.08 | –1.42 | Phenylalanine | 0.45 * | –0.04 | |
| Ruminiclostridium | 1.27 | –0.06 | Proline | 0.33 | 0 | |
| Ruminiclostridium 9 | 0.55 | 0.31 | Tyrosine | 0.55 ** | 0.02 | |
| Ruminococcaceae UCG-003 | 0.67 | 0.18 | ||||
| Ruminococcaceae UCG-004 | –2.8 | –2.33 | ||||
| Ruminococcus 1 | 0.13 | 0.35 | ||||
| Isovalerate Bicluster | [Eubacterium] nodatum group | 0.36 | 3.31 ** | Glycerol | 1.57 | 3.0 ** |
| Candidatus Soleaferrea | 0.58 | 2.21 ** | Isovalerate | 0.37 * | 1.02 ** | |
| GCA-900066575 | 0.41 | 1.0 * | Lactate | 0.63 | 0.9 | |
| Lachnoclostridium | –0.33 | 2.38 * | Malonate | –0.11 | 0.28 | |
| Lactobacillus | 0.28 | 0.51 | Succinate | –0.35 | –1.53 | |
| Lactococcus | 0.54 | 0.6 | Tryptophan | –0.11 | 0.45 | |
| Rikenellaceae RC9 gut group | 0.31 | 1.43 * | Valine | 0.39 * | 0.09 | |
| Ruminococcaceae NK4A214 group | –0.04 | 1.91 ** | ||||
| Sellimonas | 0.57 | 2.57 ** | ||||
| UBA1819 | –0.63 | 1.86 ** |
Publisher’s Note: MDPI stays neutral with regard to jurisdictional claims in published maps and institutional affiliations. |
© 2021 by the authors. Licensee MDPI, Basel, Switzerland. This article is an open access article distributed under the terms and conditions of the Creative Commons Attribution (CC BY) license (https://creativecommons.org/licenses/by/4.0/).
Share and Cite
Hintikka, J.; Lensu, S.; Mäkinen, E.; Karvinen, S.; Honkanen, M.; Lindén, J.; Garrels, T.; Pekkala, S.; Lahti, L. Xylo-Oligosaccharides in Prevention of Hepatic Steatosis and Adipose Tissue Inflammation: Associating Taxonomic and Metabolomic Patterns in Fecal Microbiomes with Biclustering. Int. J. Environ. Res. Public Health 2021, 18, 4049. https://0-doi-org.brum.beds.ac.uk/10.3390/ijerph18084049
Hintikka J, Lensu S, Mäkinen E, Karvinen S, Honkanen M, Lindén J, Garrels T, Pekkala S, Lahti L. Xylo-Oligosaccharides in Prevention of Hepatic Steatosis and Adipose Tissue Inflammation: Associating Taxonomic and Metabolomic Patterns in Fecal Microbiomes with Biclustering. International Journal of Environmental Research and Public Health. 2021; 18(8):4049. https://0-doi-org.brum.beds.ac.uk/10.3390/ijerph18084049
Chicago/Turabian StyleHintikka, Jukka, Sanna Lensu, Elina Mäkinen, Sira Karvinen, Marjaana Honkanen, Jere Lindén, Tim Garrels, Satu Pekkala, and Leo Lahti. 2021. "Xylo-Oligosaccharides in Prevention of Hepatic Steatosis and Adipose Tissue Inflammation: Associating Taxonomic and Metabolomic Patterns in Fecal Microbiomes with Biclustering" International Journal of Environmental Research and Public Health 18, no. 8: 4049. https://0-doi-org.brum.beds.ac.uk/10.3390/ijerph18084049