
Relationship of Test Positivity Rates with COVID-19 Epidemic Dynamics


Abstract
:1. Introduction
2. Materials and Methods
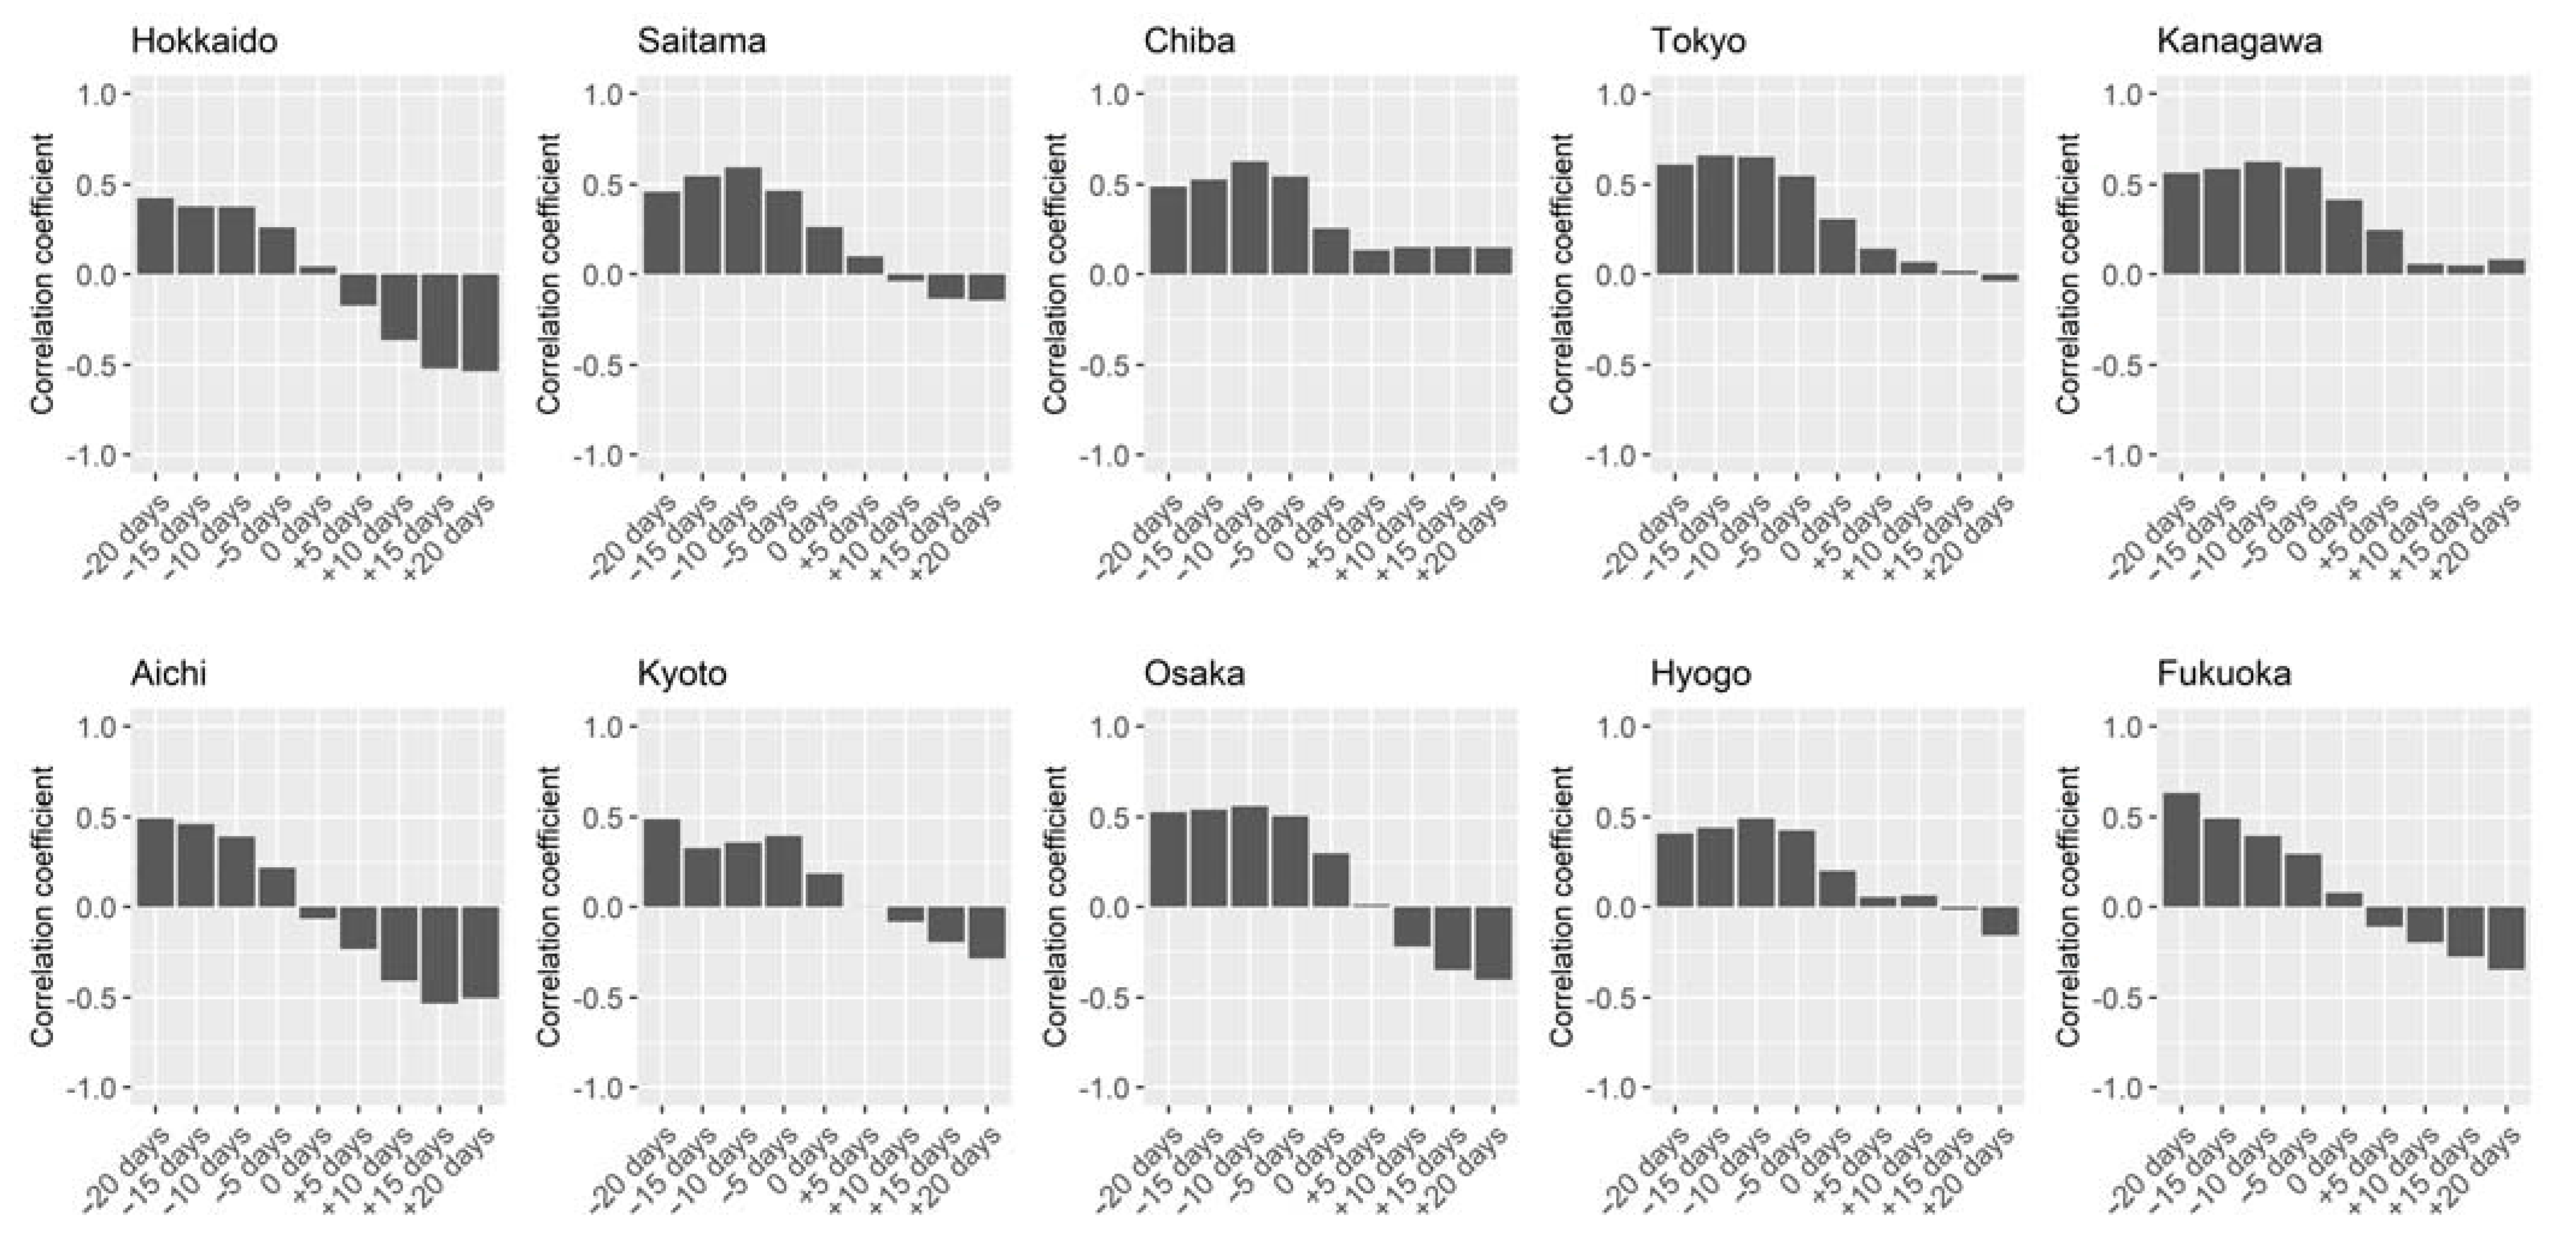
2.1. Osaka Data
2.2. Japan Data
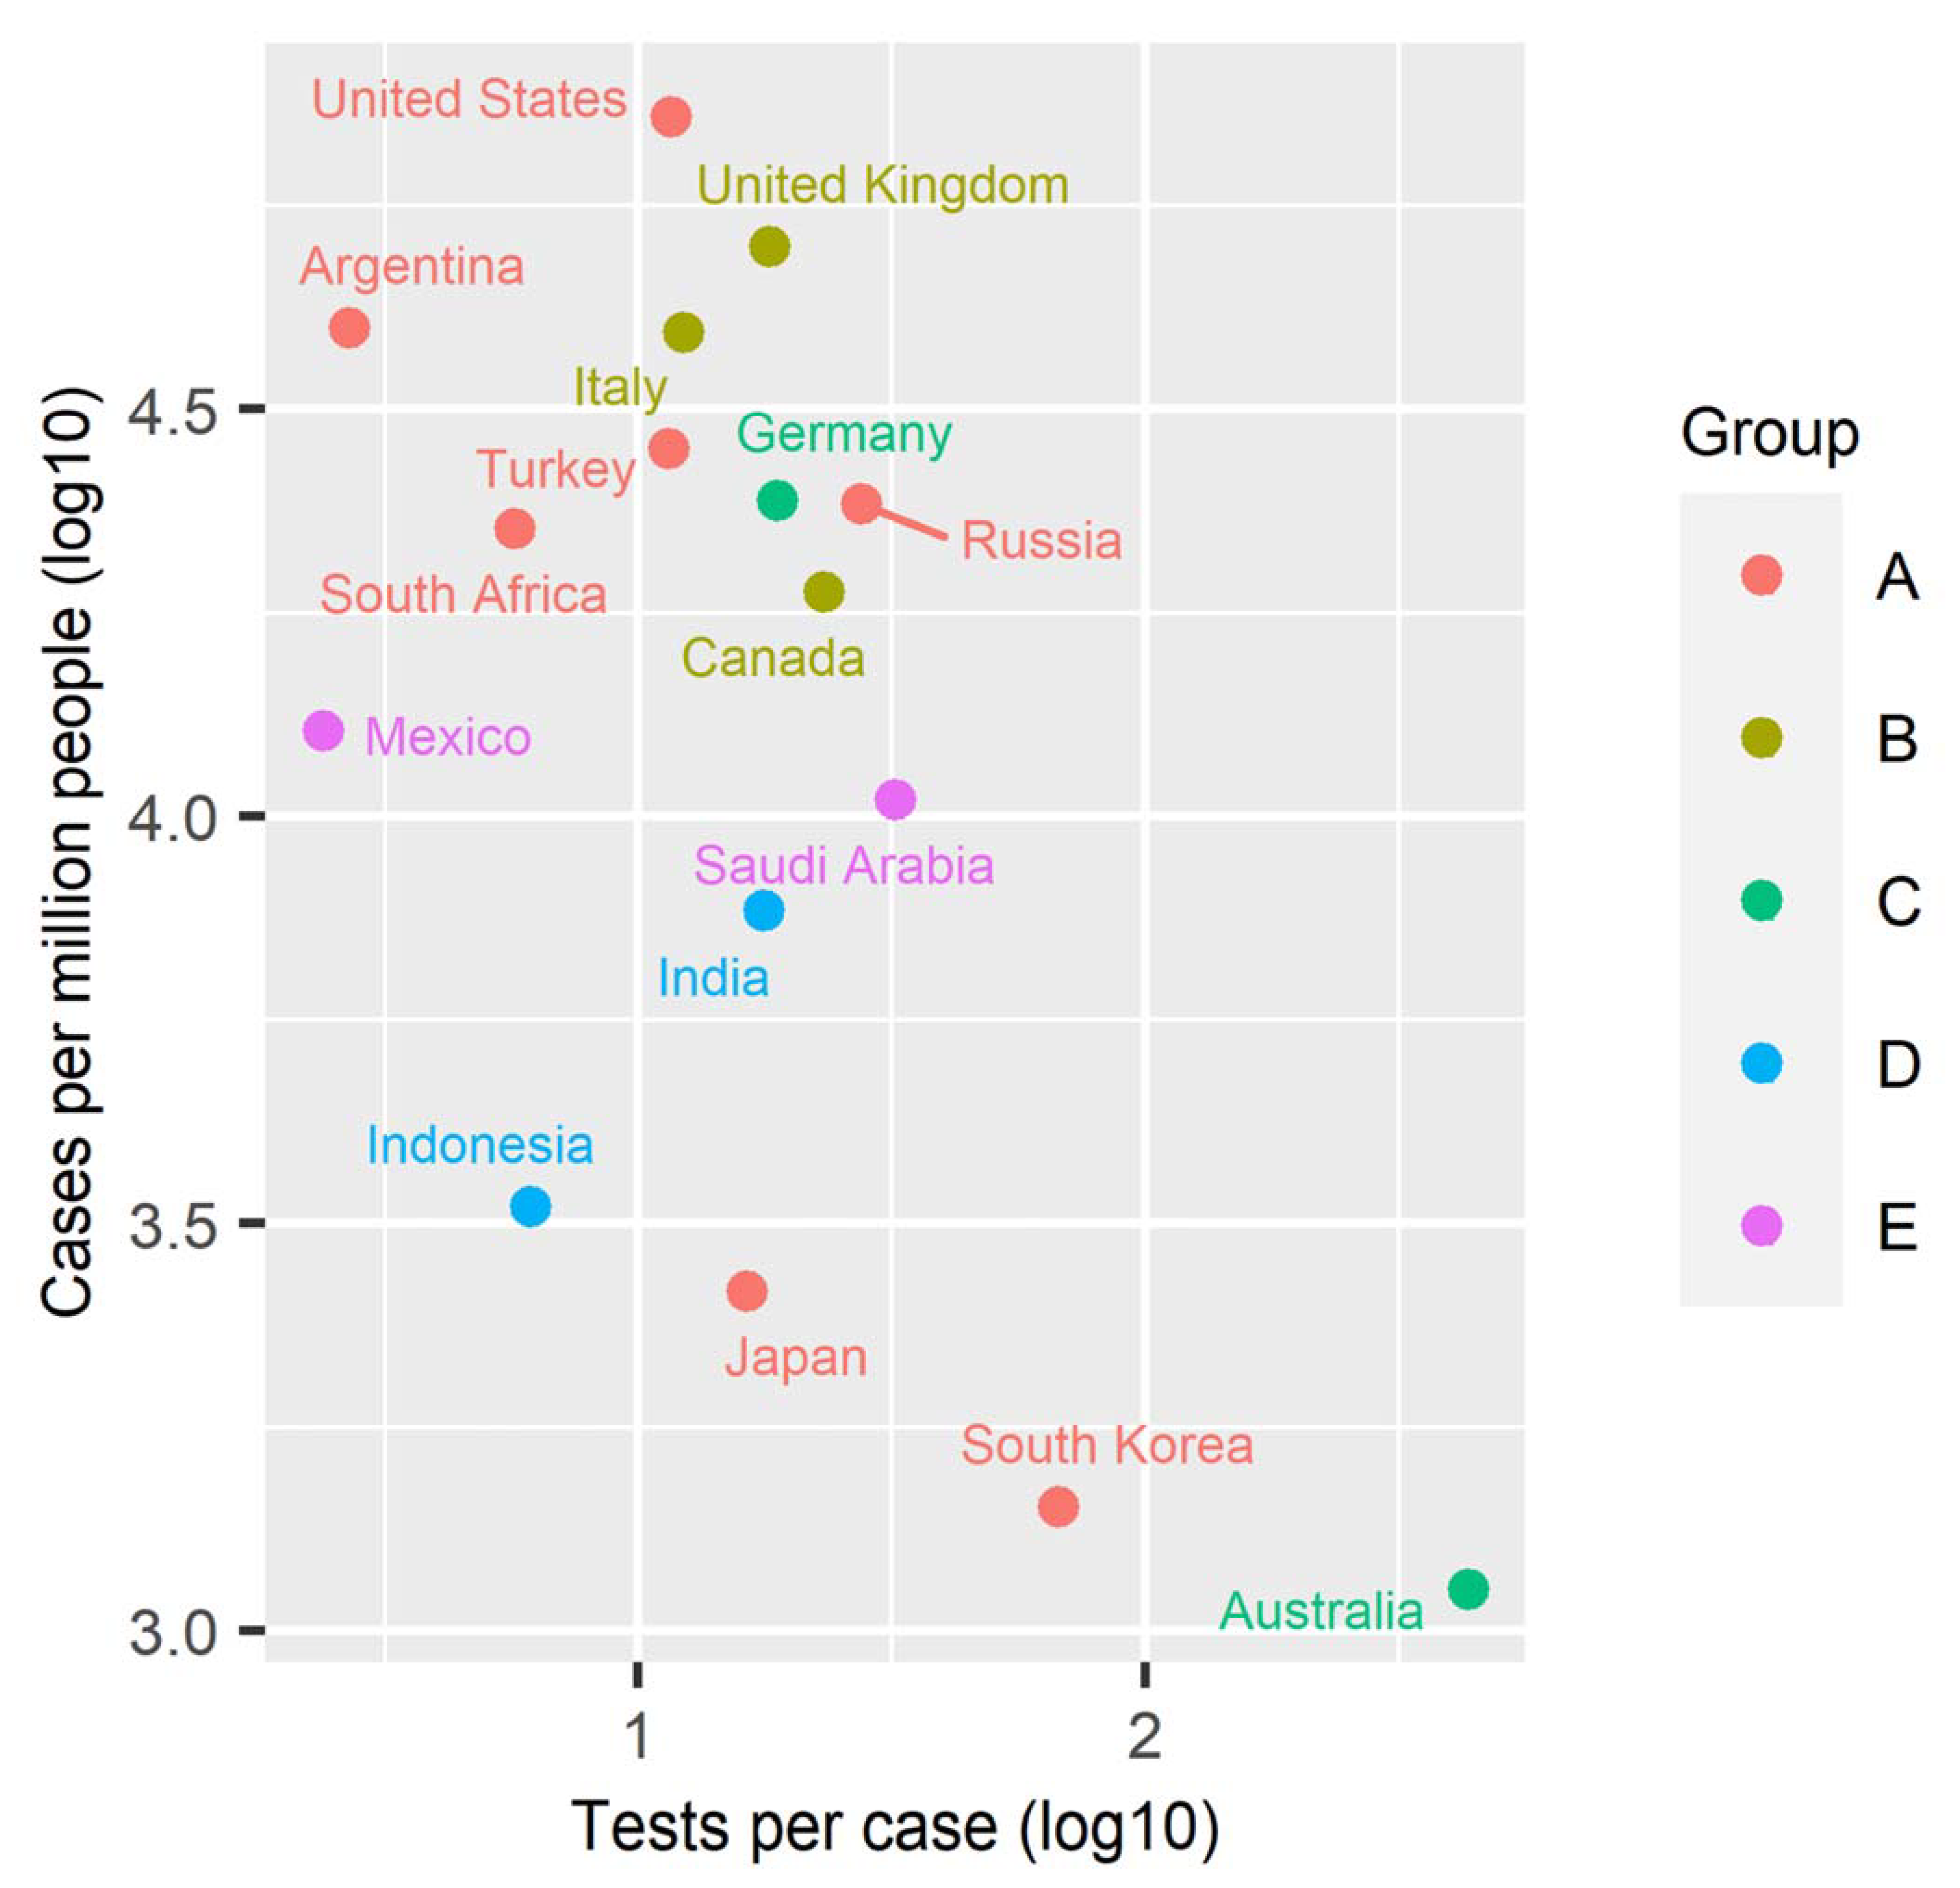
2.3. World Data
2.4. Statistical Analysis
3. Results and Discussion
4. Conclusions
Supplementary Materials
Author Contributions
Funding
Institutional Review Board Statement
Informed Consent Statement
Data Availability Statement
Acknowledgments
Conflicts of Interest
References
- Berlin, D.A.; Gulick, R.M.; Martinez, F.J. Severe Covid-19. N. Engl. J. Med. 2020, 383, 2451–2460. [Google Scholar] [CrossRef] [PubMed]
- COVID-19 vaccines: Acting on the evidence. Nat. Med. 2021, 27, 183. [CrossRef]
- MacIntyre, C.R. Case isolation, contact tracing, and physical distancing are pillars of COVID-19 pandemic control, not optional choices. Lancet Infect. Dis. 2020, 20, 1105–1106. [Google Scholar] [CrossRef]
- Brauner, J.M.; Mindermann, S.; Sharma, M.; Johnston, D.; Salvatier, J.; Gavenčiak, T.; Stephenson, A.B.; Leech, G.; Altman, G.; Mikulik, V.; et al. Inferring the effectiveness of government interventions against COVID-19. Science 2020, 371, eabd9338. [Google Scholar] [CrossRef]
- Flaxman, S.; Mishra, S.; Gandy, A.; Unwin, H.J.T.; Mellan, T.A.; Coupland, H.; Whittaker, C.; Zhu, H.; Berah, T.; Eaton, J.W.; et al. Estimating the effects of non-pharmaceutical interventions on COVID-19 in Europe. Nature 2020, 584, 257–261. [Google Scholar] [CrossRef]
- Adam, D. A guide to R-the pandemic’s misunderstood metric. Nature 2020, 583, 346–348. [Google Scholar] [CrossRef]
- Chang, S.; Pierson, E.; Koh, P.W.; Gerardin, J.; Redbird, B.; Grusky, D.; Leskovec, J. Mobility network models of COVID-19 explain inequities and inform reopening. Nature 2020, 589, 82–87. [Google Scholar] [CrossRef]
- Nagata, S.; Nakaya, T.; Adachi, Y.; Inamori, T.; Nakamura, K.; Arima, D.; Nishiura, H. Mobility Change and COVID-19 in Japan: Mobile Data Analysis of Locations of Infection. J. Epidemiol. 2021, JE20200625. Available online: https://www.jstage.jst.go.jp/article/jea/advpub/0/advpub_JE20200625/_article (accessed on 26 April 2021).
- Lalmuanawma, S.; Hussain, J.; Chhakchhuak, L. Applications of machine learning and artificial intelligence for Covid-19 (SARS-CoV-2) pandemic: A review. Chaos Solitons Fractals 2020, 139, 110059. [Google Scholar] [CrossRef]
- Hay, J.A.; Kennedy-Shaffer, L.; Kanjilal, S.; Lipsitch, M.; Mina, M.J. Estimating epidemiologic dynamics from single cross-sectional viral load distributions. medRxiv 2020. [Google Scholar] [CrossRef]
- Cao, S.; Gan, Y.; Wang, C.; Bachmann, M.; Wei, S.; Gong, J.; Huang, Y.; Wang, T.; Li, L.; Lu, K.; et al. Post-lockdown SARS-CoV-2 nucleic acid screening in nearly ten million residents of Wuhan, China. Nat. Commun. 2020, 11, 1–7. [Google Scholar] [CrossRef]
- Iacobucci, G. Covid-19: Mass population testing is rolled out in Liverpool. BMJ 2020, 371, m4268. [Google Scholar] [CrossRef]
- Oshitani, H. Cluster-based approach to Coronavirus Disease 2019 (COVID-19) response in Japan—February–April 2020. Jpn. J. Infect. Dis. 2020. Available online: https://www.jstage.jst.go.jp/article/yoken/73/6/73_JJID.2020.363/_article (accessed on 26 April 2021).
- Ondoa, P.; Kebede, Y.; Loembe, M.M.; Bhiman, J.N.; Tessema, S.K.; Sow, A.; Sall, A.A.; Nkengasong, J. COVID-19 testing in Africa: Lessons learnt. Lancet Microbe 2020, 1, e103–e104. [Google Scholar] [CrossRef]
- Grassly, N.C.; Pons-Salort, M.; Parker, E.P.K.; White, P.J.; Ferguson, N.M.; Ainslie, K.; Baguelin, M.; Bhatt, S.; Boonyasiri, A.; Brazeau, N.; et al. Comparison of molecular testing strategies for COVID-19 control: A mathematical modelling study. Lancet Infect. Dis. 2020, 20, 1381–1389. [Google Scholar] [CrossRef]
- Godlee, F. Covid-19: Testing testing. BMJ 2020, 369. Available online: https://0-doi-org.brum.beds.ac.uk/10.1136/bmj.m1918 (accessed on 26 April 2021).
- Raffle, A.E.; Pollock, A.M.; Harding-Edgar, L. Covid-19 mass testing programmes. BMJ 2020, 370. [Google Scholar] [CrossRef] [PubMed]
- The COVID-19 testing debacle. Nat. Biotechnol. 2020, 38, 653. [CrossRef]
- Ministry of Health Labour and Welfare (Japan) COVID-19 Opendata. Available online: https://www.mhlw.go.jp/stf/covid-19/open-data.html (accessed on 26 April 2021).
- Roser, M. Our World in Data. Available online: https://ourworldindata.org/ (accessed on 26 April 2021).
- Rai, B.; Shukla, A.; Dwivedi, L.K. Estimates of serial interval for COVID-19: A systematic review and meta-analysis. Clin. Epidemiol. Glob. Health 2021, 9, 157–161. [Google Scholar] [CrossRef] [PubMed]
- Cori, A.; Ferguson, N.M.; Fraser, C.; Cauchemez, S. A new framework and software to estimate time-varying reproduction numbers during epidemics. Am. J. Epidemiol. 2013, 178, 1505–1512. [Google Scholar] [CrossRef] [PubMed] [Green Version]
- Wickham, H. ggplot2: Elegant Graphics for Data Analysis; Springer: New York, NY, USA, 2016; ISBN 978-3-319-24277-4. [Google Scholar]
- Wickham, H.; François, R.; Henry, L.; Müller, K. dplyr: A Grammar of Data Manipulation. Available online: https://cran.r-project.org/package=dplyr (accessed on 26 April 2021).
- Lamontagne, F.; Agoritsas, T.; MacDonald, H.; Leo, Y.S.; DIaz, J.; Agarwal, A.; Appiah, J.A.; Arabi, Y.; Blumberg, L.; Calfee, C.S.; et al. A living WHO guideline on drugs for covid-19. BMJ 2020, 370. Available online: https://0-www-bmj-com.brum.beds.ac.uk/content/370/bmj.m3379.long (accessed on 26 April 2021).
- National Institute of Infectious Diseases Guide on Active Epidemiological Investigation for Public Health Nurses In Response to COVID-19 in Japan. Available online: https://storage.googleapis.com/responsecovid19-public/1/2020/07/Active-surveillance-guide-Japan-final.pdf (accessed on 26 April 2021).
- Tokumoto, A.; Akaba, H.; Oshitani, H.; Jindai, K.; Wada, K.; Imamura, T.; Saito, T.; Shobugawa, Y. COVID-19 Health System Response Monitor: Japan; WHO Institutional Repository for Information Sharing: Manila, Philippines, 2020. [Google Scholar]
- Wu, W.K.; Liou, J.M.; Hsu, C.C.; Lin, Y.H.; Wu, M.S. Pandemic preparedness in Taiwan. Nat. Biotechnol. 2020, 38, 932–933. [Google Scholar] [CrossRef]
- Geoghegan, J.L.; Moreland, N.J.; Le Gros, G.; Ussher, J.E. New Zealand’s science-led response to the SARS-CoV-2 pandemic. Nat. Immunol. 2021, 22, 262–263. [Google Scholar] [CrossRef] [PubMed]
- Salyer, S.J.; Maeda, J.; Sembuche, S.; Kebede, Y.; Tshangela, A.; Moussif, M.; Ihekweazu, C.; Mayet, N.; Abate, E.; Ouma, A.O.; et al. The first and second waves of the COVID-19 pandemic in Africa: A cross-sectional study. Lancet 2021, 397, 1265–1275. [Google Scholar] [CrossRef]
- Walker, P.G.T.; Whittaker, C.; Watson, O.J.; Baguelin, M.; Winskill, P.; Hamlet, A.; Djafaara, B.A.; Cucunubá, Z.; Mesa, D.O.; Green, W.; et al. The impact of COVID-19 and strategies for mitigation and suppression in low- And middle-income countries. Science 2020, 369, 413–422. [Google Scholar] [CrossRef] [PubMed]
- Mbow, M.; Lell, B.; Jochems, S.P.; Cisse, B.; Mboup, S.; Dewals, B.G.; Jaye, A.; Dieye, A.; Yazdanbakhsh, M. COVID-19 in Africa: Dampening the storm? Science 2020, 369, 624–626. [Google Scholar] [CrossRef]
- Ng, T.-C.; Cheng, H.-Y.; Chang, H.-H.; Liu, C.-C.; Yang, C.-C.; Jian, S.-W.; Liu, D.-P.; Cohen, T.; Lin, H.-H. Comparison of Estimated Effectiveness of Case-Based and Population-Based Interventions on COVID-19 Containment in Taiwan. JAMA Intern. Med. 2021. Available online: https://jamanetwork.com/journals/jamainternalmedicine/fullarticle/2778395 (accessed on 26 April 2021).
- Furuse, Y.; Sando, E.; Tsuchiya, N.; Miyahara, R.; Yasuda, I.; Ko, Y.K.; Saito, M.; Morimoto, K.; Imamura, T.; Shobugawa, Y.; et al. Clusters of coronavirus disease in communities, Japan, January-April 2020. Emerg. Infect. Dis. 2020, 26, 2176–2179. [Google Scholar] [CrossRef] [PubMed]
- Aleta, A.; Martín-Corral, D.; Pastore y Piontti, A.; Ajelli, M.; Litvinova, M.; Chinazzi, M.; Dean, N.E.; Halloran, M.E.; Longini, I.M.; Merler, S.; et al. Modelling the impact of testing, contact tracing and household quarantine on second waves of COVID-19. Nat. Hum. Behav. 2020, 4, 964–971. [Google Scholar] [CrossRef]
- Kissler, S.M.; Tedijanto, C.; Goldstein, E.; Grad, Y.H.; Lipsitch, M. Projecting the transmission dynamics of SARS-CoV-2 through the postpandemic period. Science 2020, 368, 860–868. [Google Scholar] [CrossRef] [PubMed]
- Wu, A.; Wang, L.; Zhou, H.-Y.; Ji, C.-Y.; Xia, S.Z.; Cao, Y.; Meng, J.; Ding, X.; Gold, S.; Jiang, T.; et al. One year of SARS-CoV-2 evolution. Cell Host Microbe 2021. Available online: https://0-doi-org.brum.beds.ac.uk/10.1016/j.chom.2021.02.017 (accessed on 26 April 2021).
- Moore, S.; Hill, E.M.; Tildesley, M.J.; Dyson, L.; Keeling, M.J. Vaccination and non-pharmaceutical interventions for COVID-19: A mathematical modelling study. Lancet Infect. Dis. 2021. Available online: https://0-doi-org.brum.beds.ac.uk/10.1016/S1473-3099(21)00143-2 (accessed on 26 April 2021).
- Stringhini, S.; Wisniak, A.; Piumatti, G.; Azman, A.S.; Lauer, S.A.; Baysson, H.; De Ridder, D.; Petrovic, D.; Schrempft, S.; Marcus, K.; et al. Seroprevalence of anti-SARS-CoV-2 IgG antibodies in Geneva, Switzerland (SEROCoV-POP): A population-based study. Lancet 2020, 396, 313–319. [Google Scholar] [CrossRef]
- Bajema, K.L.; Wiegand, R.E.; Cuffe, K.; Patel, S.V.; Iachan, R.; Lim, T.; Lee, A.; Moyse, D.; Havers, F.P.; Harding, L.; et al. Estimated SARS-CoV-2 Seroprevalence in the US as of September 2020. JAMA Intern. Med. 2020, 181, 450–460. [Google Scholar] [CrossRef]


Publisher’s Note: MDPI stays neutral with regard to jurisdictional claims in published maps and institutional affiliations. |
© 2021 by the authors. Licensee MDPI, Basel, Switzerland. This article is an open access article distributed under the terms and conditions of the Creative Commons Attribution (CC BY) license (https://creativecommons.org/licenses/by/4.0/).
Share and Cite
Furuse, Y.; Ko, Y.K.; Ninomiya, K.; Suzuki, M.; Oshitani, H. Relationship of Test Positivity Rates with COVID-19 Epidemic Dynamics. Int. J. Environ. Res. Public Health 2021, 18, 4655. https://0-doi-org.brum.beds.ac.uk/10.3390/ijerph18094655
Furuse Y, Ko YK, Ninomiya K, Suzuki M, Oshitani H. Relationship of Test Positivity Rates with COVID-19 Epidemic Dynamics. International Journal of Environmental Research and Public Health. 2021; 18(9):4655. https://0-doi-org.brum.beds.ac.uk/10.3390/ijerph18094655
Chicago/Turabian StyleFuruse, Yuki, Yura K. Ko, Kota Ninomiya, Motoi Suzuki, and Hitoshi Oshitani. 2021. "Relationship of Test Positivity Rates with COVID-19 Epidemic Dynamics" International Journal of Environmental Research and Public Health 18, no. 9: 4655. https://0-doi-org.brum.beds.ac.uk/10.3390/ijerph18094655