
Effects of the Head Start Program on Socioecological Obesogenic Factors in American Children


Abstract
:1. Introduction
2. Materials and Methods
2.1. Data Source
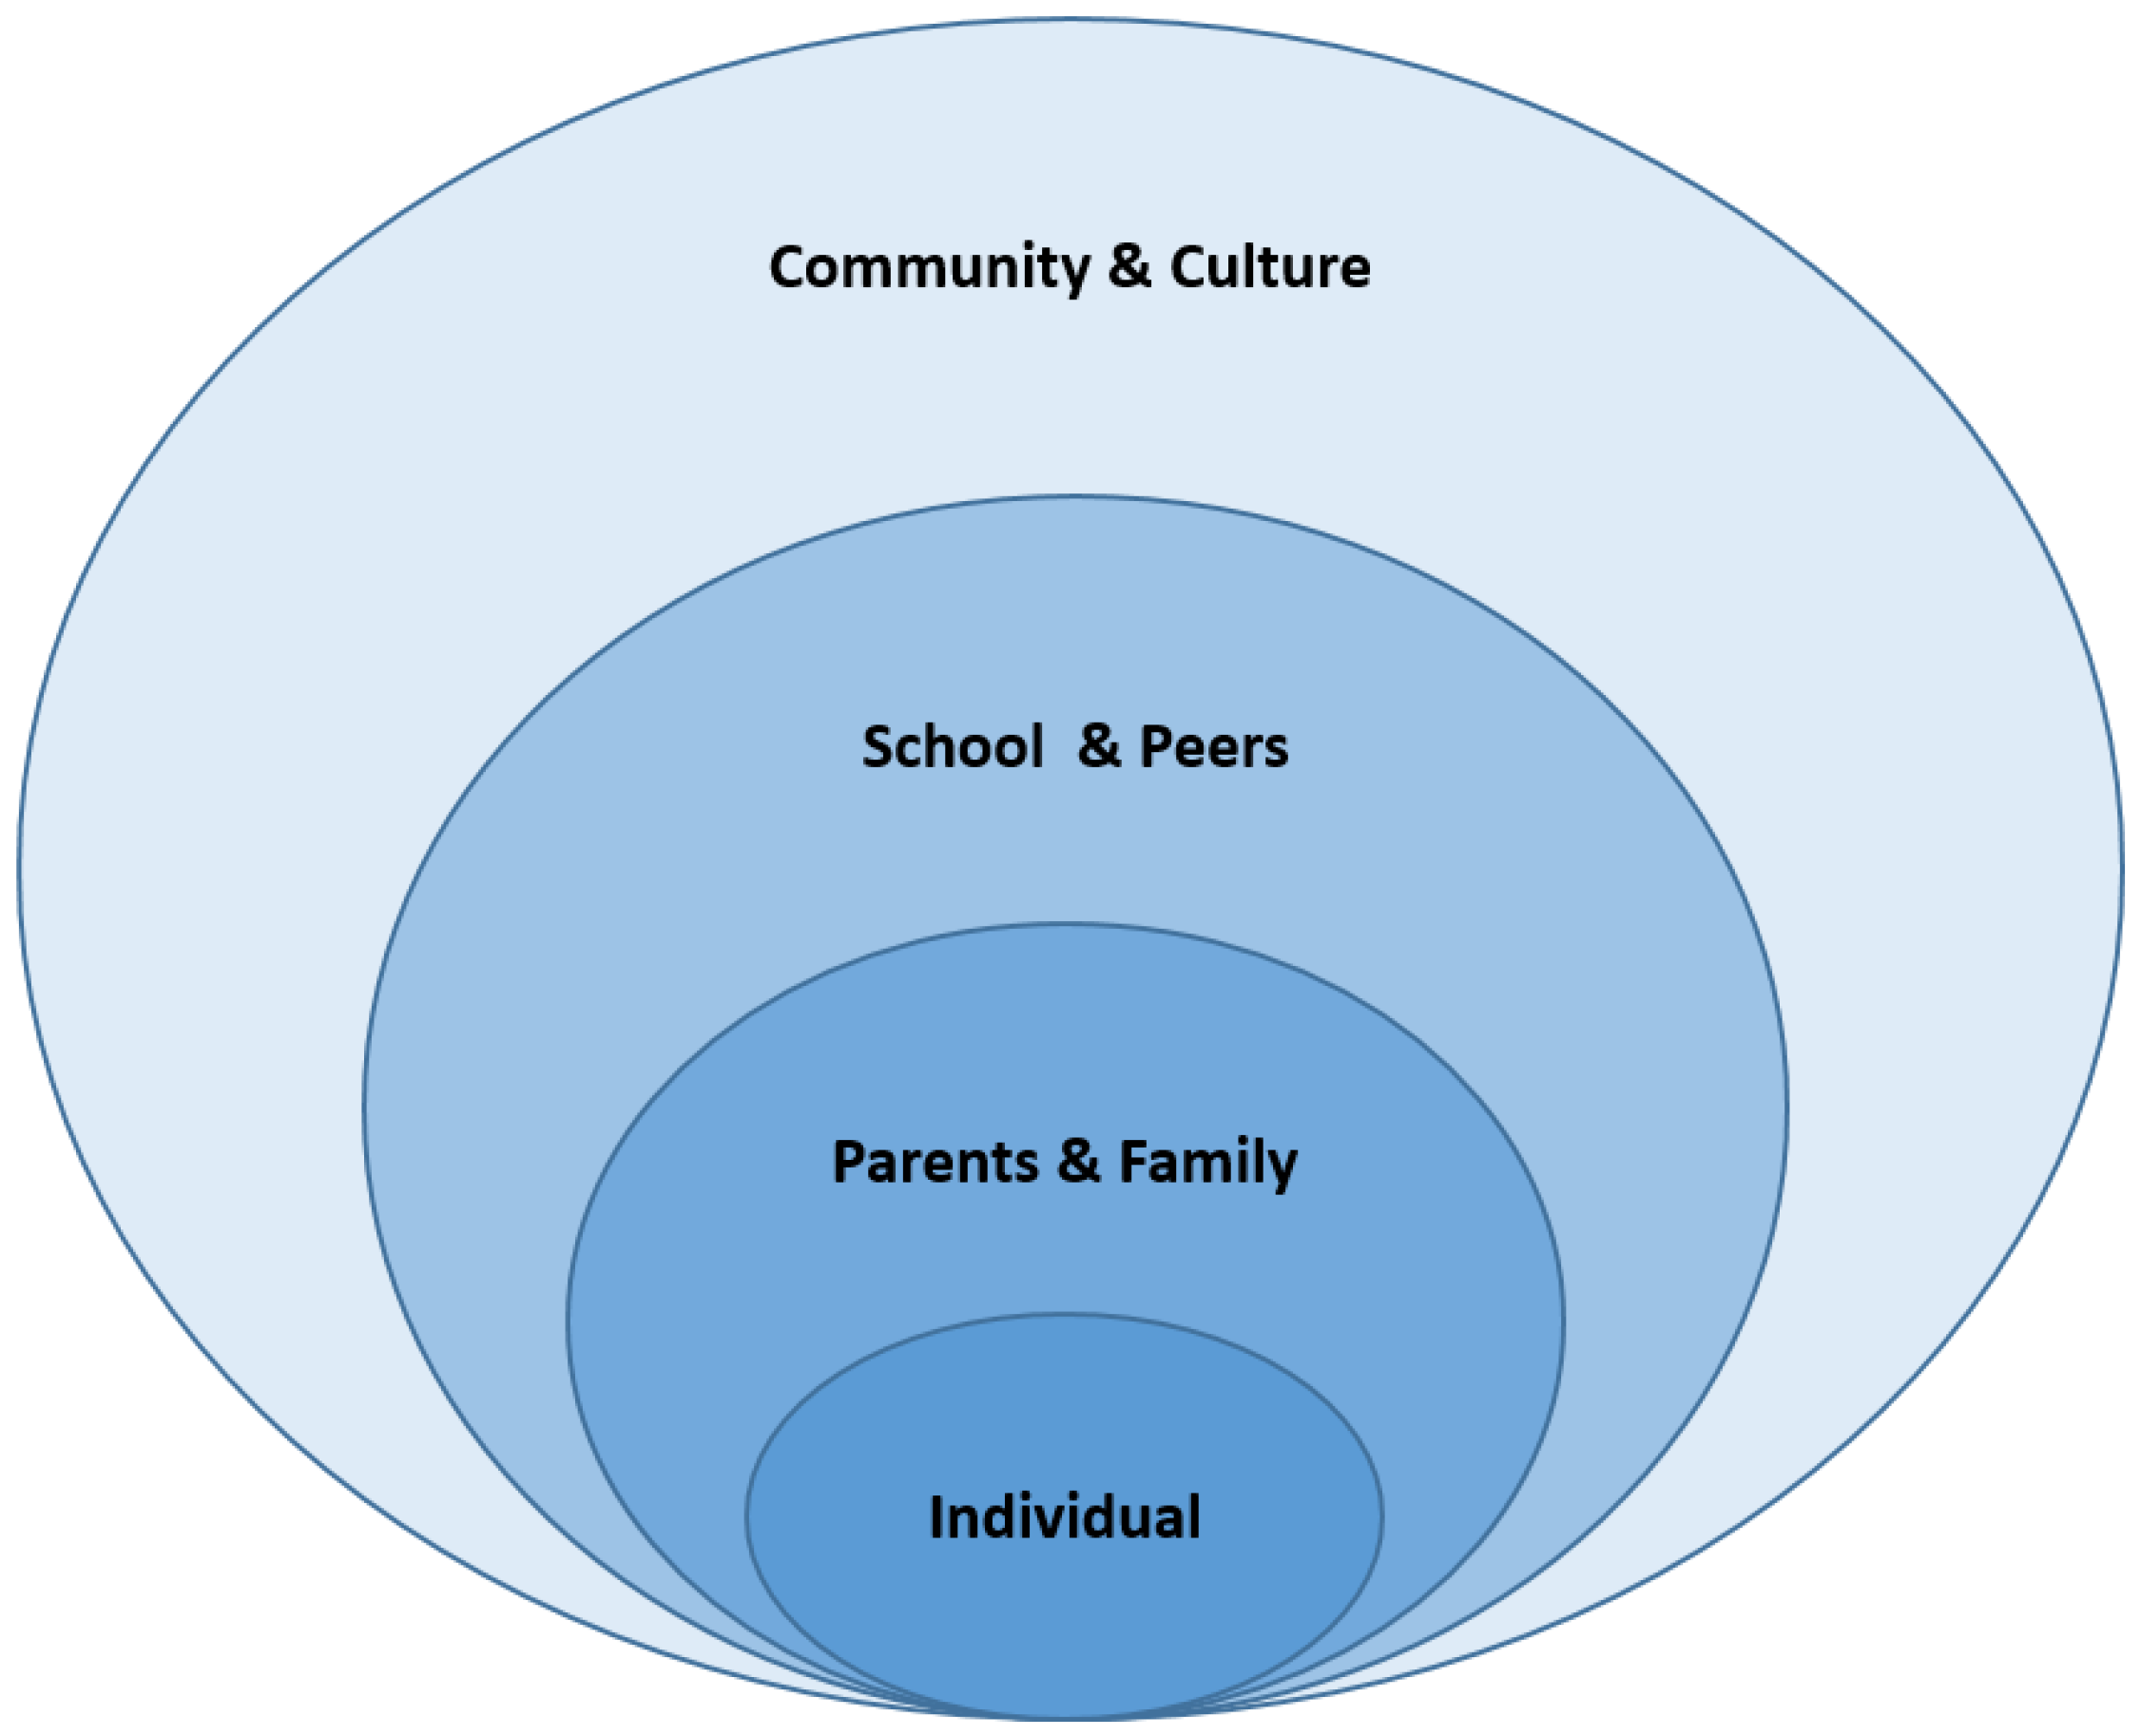
2.2. Conceptual Frameworks
2.3. Dependent Variable
2.4. Independent Variables
2.5. Satistical Analyses
3. Results
3.1. Imbalance Test of PSM for the Pair-Matching Procedure
3.2. Imbalance Test of PSM with a Comparison between Matched and Unmatched Covariates
4. Discussion
5. Conclusions
Author Contributions
Funding
Institutional Review Board Statement
Informed Consent Statement
Conflicts of Interest
References
- Boonpleng, W.; Park, C.G.; Gallo, A.M.; Corte, C.; McCreary, L.; Bergren, M.D. Ecological influences of early childhood obesity: A multilevel analysis. West J. Nurs. Res. 2013, 35, 742–759. [Google Scholar] [CrossRef]
- Ickes, M.J.; Sharma, M. A Systematic Review of Community-Based Childhood Obesity Prevention Programs. J. Obes. Weight Loss Ther. 2013, S3, e193–e200. [Google Scholar] [CrossRef]
- Williams, A.J.; Henley, W.E.; Williams, C.A.; Hurst, A.J.; Logan, S.; Wyatt, K.M. Systematic review and meta-analysis of the association between childhood overweight and obesity and primary school diet and physical activity policies. Int. J. Behav. Nutr. Phys. Act. 2013, 10, 101. [Google Scholar] [CrossRef] [PubMed] [Green Version]
- Chung, E.K.; Romney, M.C. Social Determinants of Childhood Obesity: Beyond Individual Choices. Curr. Pediatr. Rev. 2012, 8, 237–252. [Google Scholar] [CrossRef]
- Ogden, C.L.; Fryar, C.D.; Martin, C.B.; Freedman, D.S.; Carroll, M.D.; Gu, Q.; Hales, C.M. Trends in obesity prevalence by race and hispanic origin—1999–2000 to 2017–2018. JAMA 2020, 324, 1208–1210. [Google Scholar] [CrossRef] [PubMed]
- Ogden, C.L.; Carroll, M.D.; Lawman, H.G.; Fryar, C.D.; Kruszon-Moran, D.; Kit, B.K.; Flegal, K.M. Trends in Obesity Prevalence Among Children and Adolescents in the United States, 1988–1994 Through 2013–2014. JAMA 2016, 315, 2292. [Google Scholar] [CrossRef] [PubMed]
- Russell-Mayhew, S.; McVey, G.; Bardick, A.; Ireland, A. Mental health, wellness, and childhood overweight/obesity. J. Obes. 2012, 2012, 281801. [Google Scholar] [CrossRef] [Green Version]
- Reilly, J.J.; Kelly, J. Long-term impact of overweight and obesity in childhood and adolescence on morbidity and premature mortality in adulthood: Systematic review. Pediatr. Rev. 2011, 35, 891–898. [Google Scholar] [CrossRef] [PubMed] [Green Version]
- Freedman, D.S.; Mei, Z.; Srinivasan, S.R.; Berenson, G.S.; Dietz, W.H. Cardiovascular Risk Factors and Excess Adiposity Among Overweight Children and Adolescents: The Bogalusa Heart Study. J. Pediatr. 2007, 150, 12–17. [Google Scholar] [CrossRef]
- Ogden, C.L.; Carroll, M.D.; Kit, B.K.; Flegal, K.M. Prevalence of Obesity and Trends in Body Mass Index Among US Children and Adolescents, 1999–2010. JAMA 2012, 307, 483. [Google Scholar] [CrossRef] [Green Version]
- Gordon-Larsen, P.; Adair, L.S.; Popkin, B.M. Ethnic differences in physical activity and inactivity patterns and overweight status. Obes. Res. 2002, 10, 141–149. [Google Scholar] [CrossRef] [PubMed]
- McMurray, R.G.; Harrell, J.S.; Deng, S.; Bradley, C.B.; Cox, L.M.; Bangdiwala, S.I. The influence of physical activity, socioeconomic status, and ethnicity on the weight status of adolescents. Obes. Res. 2000, 8, 130–139. [Google Scholar] [CrossRef] [PubMed] [Green Version]
- Casazza, K.; Ciccazzo, M. Improving the dietary patterns of adolescents using a computer-based approach. J. Sch. Health 2006, 76, 43–46. [Google Scholar] [CrossRef]
- Andersen, R.E.; Crespo, C.J.; Bartlett, S.J.; Cheskin, L.J.; Pratt, M. Relationship of physical activity and television watching with body weight and level of fatness among children: Results from the Third National Health and Nutrition Examination Survey. JAMA 1998, 279, 938–942. [Google Scholar] [CrossRef] [PubMed] [Green Version]
- Davison, K.K.; Birch, L.L. Childhood overweight: A contextual model and recommendations for future research. Obes. Rev. 2001, 2, 159–171. [Google Scholar] [CrossRef]
- Gibson, L.Y.; Byrne, S.M.; Davis, E.A.; Blair, E.; Jacoby, P.; Zubrick, S.R. The role of family and maternal factors in childhood obesity. Med. J. Aust. 2007, 186, 591–595. [Google Scholar] [CrossRef] [PubMed]
- Zhao, J.; Settles, B.H. Environmental correlates of children’s physical activity and obesity. Am. J. Health Behav. 2014, 38, 124–133. [Google Scholar] [CrossRef] [PubMed]
- Clarke, J.; Fletcher, B.; Lancashire, E.; Pallan, M.; Adab, P. The views of stakeholders on the role of the primary school in preventing childhood obesity: A qualitative. Obes. Rev. 2013, 14, 975–988. [Google Scholar] [CrossRef] [PubMed]
- USDHH (U.S. Department of Health and Human Services). Final rule. In Head Start Performance Standards; 45 CFR Part 1304; US Government Printing Office: Washington, DC, USA, 1996; pp. 57186–57227. [Google Scholar]
- Ludwig, J.; Phillips, D.A. Long-term effects of head start on low-income children. Ann. N. Y. Acad. Sci. 2008, 1136, 257–268. [Google Scholar] [CrossRef] [PubMed]
- Frisvold, D. Head Start Participation and Childhood Obesity. Am. Econ. Assoc. 2006. [Google Scholar] [CrossRef] [Green Version]
- Gable, S.; Lutz, S. Household, parent, and child contributions to child obesity. Fam. Relat. 2000, 49, 293–300. [Google Scholar] [CrossRef]
- Hinckson, E.A.; Dickinson, A.; Water, T.; Sands, M.; Penman, L. Physical activity, dietary habits and overall health in overweight and obese children and youth with intellectual disability or autism. Res. Dev. Disabil. 2013, 34, 1170–1178. [Google Scholar] [CrossRef]
- Van Cleave, J.; Gortmaker, S.L.; Perrin, J.M. Dynamics of Obesity and Chronic Health Conditions Among Children and Youth. JAMA 2010, 303, 623–630. [Google Scholar] [CrossRef] [PubMed] [Green Version]
- Alberga, A.S.; Medd, E.R.; Adamo, K.B.; Goldfield, G.S.; Prud’Homme, D.; Kenny, G.P.; Sigal, R.J. Top 10 practical lessons learned from physical activity interventions in overweight and obese children and adolescents. Appl. Physiol. Nutr. Metab. 2013, 38, 249–258. [Google Scholar] [CrossRef] [PubMed]
- Lee, L.C.; Harrington, R.A.; Louie, B.B.; Newschaffer, C.J. Children with autism: Quality of life and parental concerns. J. Autism. Dev. Disord. 2008, 38, 1147–1160. [Google Scholar] [CrossRef] [PubMed]
- Bergman, A.B. Project Head Start: A Legacy of the War on Poverty. Arch. Pediatr. Adolesc. Med. 1980, 134, 1007. [Google Scholar] [CrossRef]
- Start, E.; Assistance, E. The 2009 Health & Human Services (HHS) Poverty Guidelines. Fed. Regist. 2009, 74, 4199–4201. [Google Scholar]
- Bronfenbrenner, U. Ecological Models of Human Development. Int. Encycl. Educ. 1994, 3, 1643–1647. [Google Scholar]
- Krebs, N.F.; Himes, J.H.; Jacobson, D.; Nicklas, T.A.; Guilday, P.; Styne, D. Assessment of Child and Adolescent Overweight and Obesity. Pediatrics 2007, 120 (Suppl. 4), 193–228. [Google Scholar] [CrossRef] [Green Version]
- CDC. Childhood Obesity Facts|Overweight & Obesity|CDC. Available online: https://www.cdc.gov/obesity/data/childhood.html%0Ahttp://www.cdc.gov/obesity/data/childhood.html (accessed on 24 October 2018).
- Kelly, A.; Barlow, S.; Rao, G.; Inge, T.; Hayman, L. Severe obesity in children and adolescents: Identification, associated health risks, and treatment approaches a scientific statement from the American Heart. Circulation 2013, 128, 1689–1712. [Google Scholar] [CrossRef]
- Chen, A.Y.; Escarce, J.J. Family Structure and Childhood Obesity: An Analysis Through 8th Grade. Matern. Child Health J. 2013, 7, 1–6. [Google Scholar] [CrossRef]
- Kaphingst, K.M.; French, S.; Story, M. The role of child care settings in obesity prevention. Future Child. 2006, 16, 143–168. [Google Scholar]
- Anderson, P.M. Parental employment, family routines and childhood obesity. Econ. Hum. Biol. 2012, 10, 340–351. [Google Scholar] [CrossRef] [PubMed]
- Anderson, P.M.; Butcher, K.F. Childhood obesity: Trends and potential causes. Future Child. 2006, 16, 19–45. [Google Scholar] [CrossRef] [PubMed]
- Lissau, I.; Sorensen, T.I. Parental neglect during childhood and increased risk of obesity in young adulthood. Lancet 1994, 343, 324–327. [Google Scholar] [CrossRef]
- Garn, S.; Cole, P.; Bailey, S. Effect of parental fatness levels on the fatness of biological and adoptive children. Ecol. Food Nutr. 1977, 6, 91–93. [Google Scholar] [CrossRef]
- Lake, J.K.; Power, C.; Cole, T.J. Child to adult body mass index in the 1958 British birth cohort: Associations with parental obesity. Arch. Dis. Child. 1997, 77, 376–381. [Google Scholar] [CrossRef] [Green Version]
- Elder, J.P.; Arredondo, E.M.; Campbell, N.; Baquero, B.; Duerksen, S.; Ayala, G.; Crespo, N.C.; Crespo, N.C.; Slymen, D.; McKenzie, T. Individual, family, and community environmental correlates of obesity in latino elementary school children. J. Sch. Health 2010, 80, 20–30. [Google Scholar] [CrossRef] [Green Version]
- Dehejia, R.H.; Wahba, S. Propensity score-matching methods for nonexperimental causal studies. Rev. Econ. Stat. 2002, 84, 151–161. [Google Scholar] [CrossRef] [Green Version]
- Katz, M.H. Multivariable Analysis: A Practical Guide for Clinicians and Public Health Researchers; Cambridge University Press: Cambridge, UK, 2011. [Google Scholar]
- Hughes, C.C.; Gooze, R.A.; Finkelstein, D.M.; Whitaker, R.C. Barriers to obesity prevention in Head Start. Health Aff. 2010, 29, 454–462. [Google Scholar] [CrossRef] [Green Version]
- Jurkowski, J.M.; Green Mills, L.L.; Lawson, H.A.; Bovenzi, M.C.; Quartimon, R.; Davison, K.K. Engaging Low-Income Parents in Childhood Obesity Prevention from Start to Finish: A Case Study. J. Community Health 2013, 38, 1–11. [Google Scholar] [CrossRef] [Green Version]
- Whitaker, R.C.; Gooze, R.A.; Hughes, C.C.; Finkelstein, D.M. A national survey of obesity prevention practices in head start. Arch. Pediatrics Adolescent Med. 2009, 163, 1144–1150. [Google Scholar] [CrossRef] [PubMed] [Green Version]
- Gable, S.; Lutz, S. Nutrition socialization experiences of children in the Head Start program. J. Am. Dietetic Assoc. 2001, 101, 572–577. [Google Scholar] [CrossRef]
- Frisvold, D.E.; Lumeng, J.C. Expanding Exposure: Can Increasing the Daily Duration of Head Start Reduce Childhood Obesity? J. Hum. Resour. 2011, 46, 373–402. [Google Scholar] [CrossRef]
- Hu, W.T.; Foley, T.A.; Wilcox, R.A.; Kozera, R.M.; Morgenstern, B.Z.; Juhn, Y.J. Childhood obesity among Head Start enrollees in Souteaster Minnesota: Prevalence and Risk Factors. Ethn. Dis. 2007, 17, 23–28. [Google Scholar]
- Lumeng, J.C.; Kaciroti, N.; Frisvold, D.E. Changes in Body Mass Index Z Score Over the Course of the Academic Year Among Children Attending Head Start. Acad. Pediatr. 2010, 10, 179–186. [Google Scholar] [CrossRef] [Green Version]
- Lumeng, J.C.; Kaciroti, N.; Sturza, J.; Krusky, A.M.; Miller, A.L.; Peterson, K.E.; Lipton, R.; Reischl, T.M. Changes in Body Mass Index Associated With Head Start Participation. Pediatrics 2015, 135, e449–e456. [Google Scholar] [CrossRef] [Green Version]
- Ludwig, J.; Phillips, D.A. The Benefits and Costs of Head Start. Public Policy 2007. [Google Scholar] [CrossRef]
- GreenMills, L.L.; Davison, K.K.; Gordon, K.E.; Li, K.; Jurkowski, J.M. Evaluation of a childhood obesity awareness campaign targeting head start families: Designed by parents for parents. J. Health Care Poor Underserved 2013, 24 (Suppl. 2), 25–33. [Google Scholar] [CrossRef]
- Fitzgibbon, M.L.; Stolley, M.R.; Dyer, A.R.; VanHorn, L.; KauferChristoffel, K. A community-based obesity prevention program for minority children: Rationale and study design for Hip-Hop to Health Jr. Prev. Med. 2002, 34, 289–297. [Google Scholar] [CrossRef]
- Davison, K.K.; Jurkowski, J.M.; Li, K.; Kranz, S.; Lawson, H.A. A childhood obesity intervention developed by families for families: Results from a pilot study. Int. J. Behav. Nutr. Phys. Act. 2013, 10, 3. [Google Scholar] [CrossRef] [PubMed] [Green Version]


| Data Collection | Date of Collection | Sample |
|---|---|---|
| Fall—kindergarten | Fall 1998 | Full sample |
| Spring—kindergarten | Spring 1999 | Full sample |
| Fall—first grade | Fall 1999 | 30% subsample 1 |
| Spring—first grade | Spring 2000 | Full sample plus freshening |
| Spring—third grade | Spring 2002 | Full sample |
| Spring—fifth grade | Spring 2004 | Full sample |
| Spring—eighth grade | Spring 2007 | Full sample |
| % (n), Mean (SD) | ||||||
|---|---|---|---|---|---|---|
| Variables | Overweight | Normal Weight | Overall | p-Value | ||
| Dependent variables | Overweight | Binary variable (1 = overweight, 0 = normal) | 33.20% (1252) | 66.80% (2501) | 100% (3753) | |
| Treatment | Head Start | Binary variable (1 = yes, 0 = no) | 17.80% (191) | 13.75% (257) | 15.11% (448) | 0.05 |
| Covariates | 1. Individual | |||||
| Age | 13.67 (0.54) | 13.70 (0.51) | 13.69 (0.52) | 0.40 | ||
| Female | 50.57% (623) | 48.86% (1269) | 49.42% (1892) | 0.51 | ||
| Race/Ethnicity | <0.01 | |||||
| Non-Hispanic white | 52.49% (739) | 63.79% (1701) | 60.04% (2440) | |||
| Non-Hispanic Black | 18.80% (155) | 12.23% (194) | 14.41% (349) | |||
| Hispanic | 22.53% (250) | 16.87% (341) | 18.75% (591) | |||
| Other | 6.18% (108) | 7.03% (264) | 6.75% (372) | |||
| Sports activity | 52.54% (698) | 63.28% (1567) | 59.71% (2265) | <0.01 | ||
| Hours spent in school-sponsored activities | 4.69 (4.70) | 4.95 (4.69) | 4.86 (4.70) | 0.06 | ||
| Sedentary lifestyles | 17.05 (12.66) | 16.07 (13.72) | 16.40 (13.37) | 0.67 | ||
| Perceived weight | 3.71 (0.75) | 2.82 (0.63) | 3.12 (0.79) | <0.01 | ||
| Intention to change weight | <0.01 | |||||
| Lose weight | 69.73% (868) | 20.26% (510) | 36.68% (1378) | |||
| Gain weight | 2.11% (26) | 16.29% (407) | 11.59% (433) | |||
| Stay the same weight | 12.77% (171) | 32.38% (760) | 25.87% (931) | |||
| Not trying to do anything about their weight | 12.95% (158) | 29.41% (784) | 23.96% (942) | |||
| 2. Parenting capacity | ||||||
| Parents’ education | <0.01 | |||||
| Lower than high school | 10.40% (122) | 5.98% (131) | 7.44% (253) | |||
| High school | 24.62% (291) | 17.34% (426) | 19.76% (717) | |||
| Greater than high school | 64.98% (839) | 76.69% (1944) | 72.80% (2783) | |||
| Parents’ employment | 5.94 (2.23) | 6.09 (2.14) | 6.04 (2.17) | 0.12 | ||
| Parents’ health | 3.60 (0.98) | 3.84 (0.96) | 3.76 (0.97) | <0.01 | ||
| Parents’ income | 8.27 (3.06) | 9.10 (3.07) | 8.83 (3.09) | <0.01 | ||
| Parent-child relationship | 4.92 (1.00) | 5.05 (1.01) | 5.00 (1.01) | <0.05 | ||
| Parental characteristics | 58.42% (762) | 59.81% (1665) | 59.35% (2427) | 0.59 | ||
| 3. Family Function | ||||||
| Family structure | 72.80% (933) | 76.23% (1978) | 75.09% (2911) | 0.13 | ||
| Family size with members less than 18 years old | 2.27 (1.10) | 2.31 (1.09) | 2.30 (1.09) | 0.29 | ||
| Family TV restriction | 84.16% (1055) | 85.99% (2108) | 85.38% (3163) | <0.05 | ||
| Food security | 0.77 (2.44) | 0.54 (1.88) | 0.62 (2.09) | <0.01 | ||
| SES quintile | 2.77 (1.35) | 3.27 (1.39) | 3.10 (1.39) | <0.01 | ||
| 4. School | ||||||
| School’s ratio of minorities (degrees) | 2.82 (1.53) | 2.64 (1.45) | 2.70 (1.48) | <0.01 | ||
| School reduced-price lunch program | 3.18 (.90) | 3.08 (.91) | 3.11 (.91) | <0.01 | ||
| School free lunch program | 35.71 (25.00) | 30.55 (24.18) | 32.27 (24.68) | <0.01 | ||
| 5. Environment | ||||||
| Urbanity | <0.01 | |||||
| Large city | 33.75% (387) | 29.33% (704) | 30.80% (1091) | |||
| Mid-size city | 36.78% (456) | 46.81% (1102) | 43.48% (1558) | |||
| Small town and rural | 29.48% (409) | 23.86% (695) | 25.72% (1104) | |||
| Variables | |||||||
|---|---|---|---|---|---|---|---|
| Dependent Variables | Overweight | Binary Variable (1 = Overweight, 0 = Normal) | Unmatched (n = 2993) Matched (n = 351) | Mean | t-Test | ||
| Treated | Control | t | p > |t| | ||||
| Covariates | 1. Individual | ||||||
| Age | U | 13.70 | 13.69 | 0.47 | 0.64 | ||
| M | 13.71 | 13.66 | 1.11 | 0.27 | |||
| Female | U | 0.53 | 0.51 | 0.90 | 0.37 | ||
| M | 0.54 | 0.53 | 0.30 | 0.076 | |||
| Race/Ethnicity | |||||||
| Non-Hispanic white | U | - | - | - | - | ||
| M | - | - | - | - | |||
| Non-Hispanic Black | U | 0.27 | 0.06 | 13.53 | <0.01 | ||
| M | 0.24 | 0.23 | 0.44 | 0.66 | |||
| Hispanic | U | 0.24 | 0.14 | 4.90 | <0.01 | ||
| M | 0.25 | 0.26 | −0.17 | 0.86 | |||
| Other | U | 0.12 | 0.08 | 2.39 | <0.05 | ||
| M | 0.12 | 0.11 | 0.36 | 0.72 | |||
| School-sponsored activities | U | 4.02 | 4.99 | −3.73 | <0.01 | ||
| M | 4.08 | 3.79 | 0.86 | 0.39 | |||
| Sports activity | U | 0.60 | 0.62 | −1.00 | 0.32 | ||
| M | 0.59 | 0.54 | 1.37 | 0.17 | |||
| Sedentary lifestyles | U | 20.27 | 15.88 | 6.48 | <0.01 | ||
| M | 19.70 | 20.11 | −0.34 | 0.73 | |||
| Perceived weight degrees | U | 3.17 | 3.11 | 1.42 | 0.16 | ||
| M | 3.19 | 3.11 | 0.21 | 0.23 | |||
| Intention to change weight | |||||||
| 1 = lose weight | U | - | - | - | - | ||
| M | - | - | - | - | |||
| 2 = gain weight | U | 0.14 | 0.11 | 1.50 | 0.13 | ||
| M | 0.13 | 0.14 | −0.44 | 0.66 | |||
| 3 = stay the same weight | U | 0.24 | 0.25 | −0.49 | 0.62 | ||
| M | 0.24 | 0.23 | 0.27 | 0.79 | |||
| 4 = not trying to do anything about | U | 0.21 | 0.26 | 2.27 | <0.05 | ||
| their weight | M | 0.21 | 0.26 | −1.51 | 0.13 | ||
| 2. Parenting capacity | |||||||
| Parents’ education | |||||||
| Lower than high school | U | - | - | - | - | ||
| M | - | - | - | - | |||
| High school | U | 0.36 | 0.17 | 8.89 | <0.01 | ||
| M | 0.35 | 0.34 | 0.16 | 0.87 | |||
| Greater than high school | U | 0.39 | 0.73 | −13.69 | <0.01 | ||
| M | 0.40 | 0.38 | 0.70 | 0.49 | |||
| Parents’ employment | U | 5.34 | 6.33 | −9.37 | <0.01 | ||
| M | 5.38 | 5.29 | 0.53 | 0.60 | |||
| Parents’ health | U | 3.38 | 3.82 | −8.39 | <0.01 | ||
| M | 3.38 | 3.40 | −0.22 | 0.83 | |||
| Parents’ income | U | 6.12 | 9.34 | −21.13 | <0.01 | ||
| M | 6.27 | 6.20 | 0.34 | 0.73 | |||
| Parent-child relationship | U | 4.73 | 5.13 | −7.83 | <0.01 | ||
| M | 4.74 | 4.62 | 1.61 | 0.11 | |||
| Parental characteristics | U | 0.41 | 0.69 | −10.62 | <0.01 | ||
| M | 0.42 | 0.44 | −0.30 | 0.76 | |||
| 3. Family Function | |||||||
| Family structure | U | 0.60 | 0.81 | −9.53 | <0.01 | ||
| M | 0.60 | 0.60 | 0.15 | 0.88 | |||
| Family size with members less than 18 | U | 2.50 | 2.25 | 4.38 | <0.01 | ||
| years old | M | 2.49 | 2.52 | −0.31 | 0.76 | ||
| Family TV restriction | U | 0.82 | 0.86 | −2.03 | <0.05 | ||
| M | 0.82 | 0.84 | −0.81 | 0.42 | |||
| Food security | U | 1.41 | 0.50 | 8.55 | <0.01 | ||
| M | 1.36 | 1.29 | 0.30 | 0.77 | |||
| SES | U | 2.00 | 3.31 | 18.09 | <0.01 | ||
| M | 2.05 | 2.01 | 0.41 | 0.69 | |||
| 4. School | |||||||
| School’s ratio of minorities | U | 3.26 | 2.56 | 9.13 | <0.01 | ||
| M | 3.21 | 3.10 | 0.87 | 0.39 | |||
| School reduced-price lunch program | U | 3.24 | 3.08 | 3.27 | <0.01 | ||
| M | 3.27 | 3.33 | −0.96 | 0.34 | |||
| School free lunch program | U | 45.65 | 29.09 | 14.10 | <0.01 | ||
| M | 45.48 | 44.45 | 0.54 | 0.59 | |||
| 5. Environment | |||||||
| Urbanity | |||||||
| Large city | U | - | - | - | - | ||
| M | - | - | - | - | |||
| Mid-size city | U | 0.25 | 0.44 | −7.25 | <0.01 | ||
| M | 0.26 | 0.24 | 0.61 | 0.54 | |||
| Small town and rural | U | 0.46 | 0.28 | 7.01 | <0.01 | ||
| M | 0.43 | 0.44 | −0.30 | 0.76 |
| Variables | ||||
|---|---|---|---|---|
| Dependent Variables | Overweight | Binary variable (1 = overweight, 0 = normal) | OR | CI |
| Treatment | Head Start | Binary variable | 1.28 | 0.73–2.27 |
| Covariates | 1. Individual | |||
| Age | 0.91 | 0.55–1.49 | ||
| Female | 0.86 | 0.50–1.48 | ||
| Race/Ethnicity | ||||
| Non-Hispanic white | - | - | ||
| Non-Hispanic Black | 5.23 ** | 2.04–13.37 | ||
| Hispanic | 1.32 | 0.51–3.42 | ||
| Other | 1.28 | 0.29–5.61 | ||
| School-sponsored activities | 1.07 * | 1.01–1.15 | ||
| Sports activities | 0.32 ** | 0.17–0.61 | ||
| Sedentary lifestyles | 1.00 | 0.99–1.01 | ||
| Perceived weight degrees | 6.86 ** | 4.22–11.16 | ||
| Intention to change weight | ||||
| 1 = lose weight | - | - | ||
| 2 = gain weight | 0.04 ** | 0.01–0.15 | ||
| 3 = stay the same weight | 0.08 ** | 0.04–0.16 | ||
| 4 = not trying to do anything about their weight | 0.15 ** | 0.08–0.30 | ||
| 2. Parenting capacity | ||||
| Parents’ education | ||||
| Lower than high school | - | - | ||
| High School | 1.76 | 0.87–3.54 | ||
| Greater than high school | 1.19 | 0.56–2.50 | ||
| Parent’s employment | 0.99 | 0.81–1.21 | ||
| Parents’ health | 1.07 | 0.79–1.45 | ||
| Parents’ income | 1.05 | 0.91–1.22 | ||
| Parent-child relationship | 1.02 | 0.78–1.34 | ||
| Parental characteristics | 0.87 | 0.39–1.92 | ||
| 3. Family Function | ||||
| Family structure | 1.46 | 0.52–4.08 | ||
| Family size with members less than 18 years old | 0.78 * | 0.63–0.97 | ||
| Family TV restriction | 0.40 * | 0.20–0.80 | ||
| Food security | 0.97 | 0.85–1.10 | ||
| SES | 0.87 | 0.59–1.29 | ||
| 4. School | ||||
| School’s ratio of minorities | 1.15 | 0.84–1.56 | ||
| School free lunch program | 1.01 | 1.01–1.02 | ||
| School reduced-price lunch program | 1.13 | 0.82–1.57 | ||
| 5. Environment | ||||
| Urbanity | ||||
| Large city | - | - | ||
| Mid-size city | 1.76 | 0.82–3.78 | ||
| Small town and rural | 1.54 | 0.71–3.33 | ||
| Total | n | 702 | ||
| Weighted n | 274,253 | |||
Publisher’s Note: MDPI stays neutral with regard to jurisdictional claims in published maps and institutional affiliations. |
© 2021 by the authors. Licensee MDPI, Basel, Switzerland. This article is an open access article distributed under the terms and conditions of the Creative Commons Attribution (CC BY) license (https://creativecommons.org/licenses/by/4.0/).
Share and Cite
Kim, T.; Kim, M.; Jang, C.-Y.; Gim, N.-G. Effects of the Head Start Program on Socioecological Obesogenic Factors in American Children. Int. J. Environ. Res. Public Health 2021, 18, 4779. https://0-doi-org.brum.beds.ac.uk/10.3390/ijerph18094779
Kim T, Kim M, Jang C-Y, Gim N-G. Effects of the Head Start Program on Socioecological Obesogenic Factors in American Children. International Journal of Environmental Research and Public Health. 2021; 18(9):4779. https://0-doi-org.brum.beds.ac.uk/10.3390/ijerph18094779
Chicago/Turabian StyleKim, Taeeung, Minju Kim, Chang-Yong Jang, and Nam-Gyeong Gim. 2021. "Effects of the Head Start Program on Socioecological Obesogenic Factors in American Children" International Journal of Environmental Research and Public Health 18, no. 9: 4779. https://0-doi-org.brum.beds.ac.uk/10.3390/ijerph18094779