
Neuroendocrine Response and State Anxiety Due to Psychosocial Stress Decrease after a Training with Subject’s Own (but Not Another) Virtual Body: An RCT Study

 ,
, 
 and
and
Abstract
:1. Introduction
2. Materials and Methods
2.1. Participants
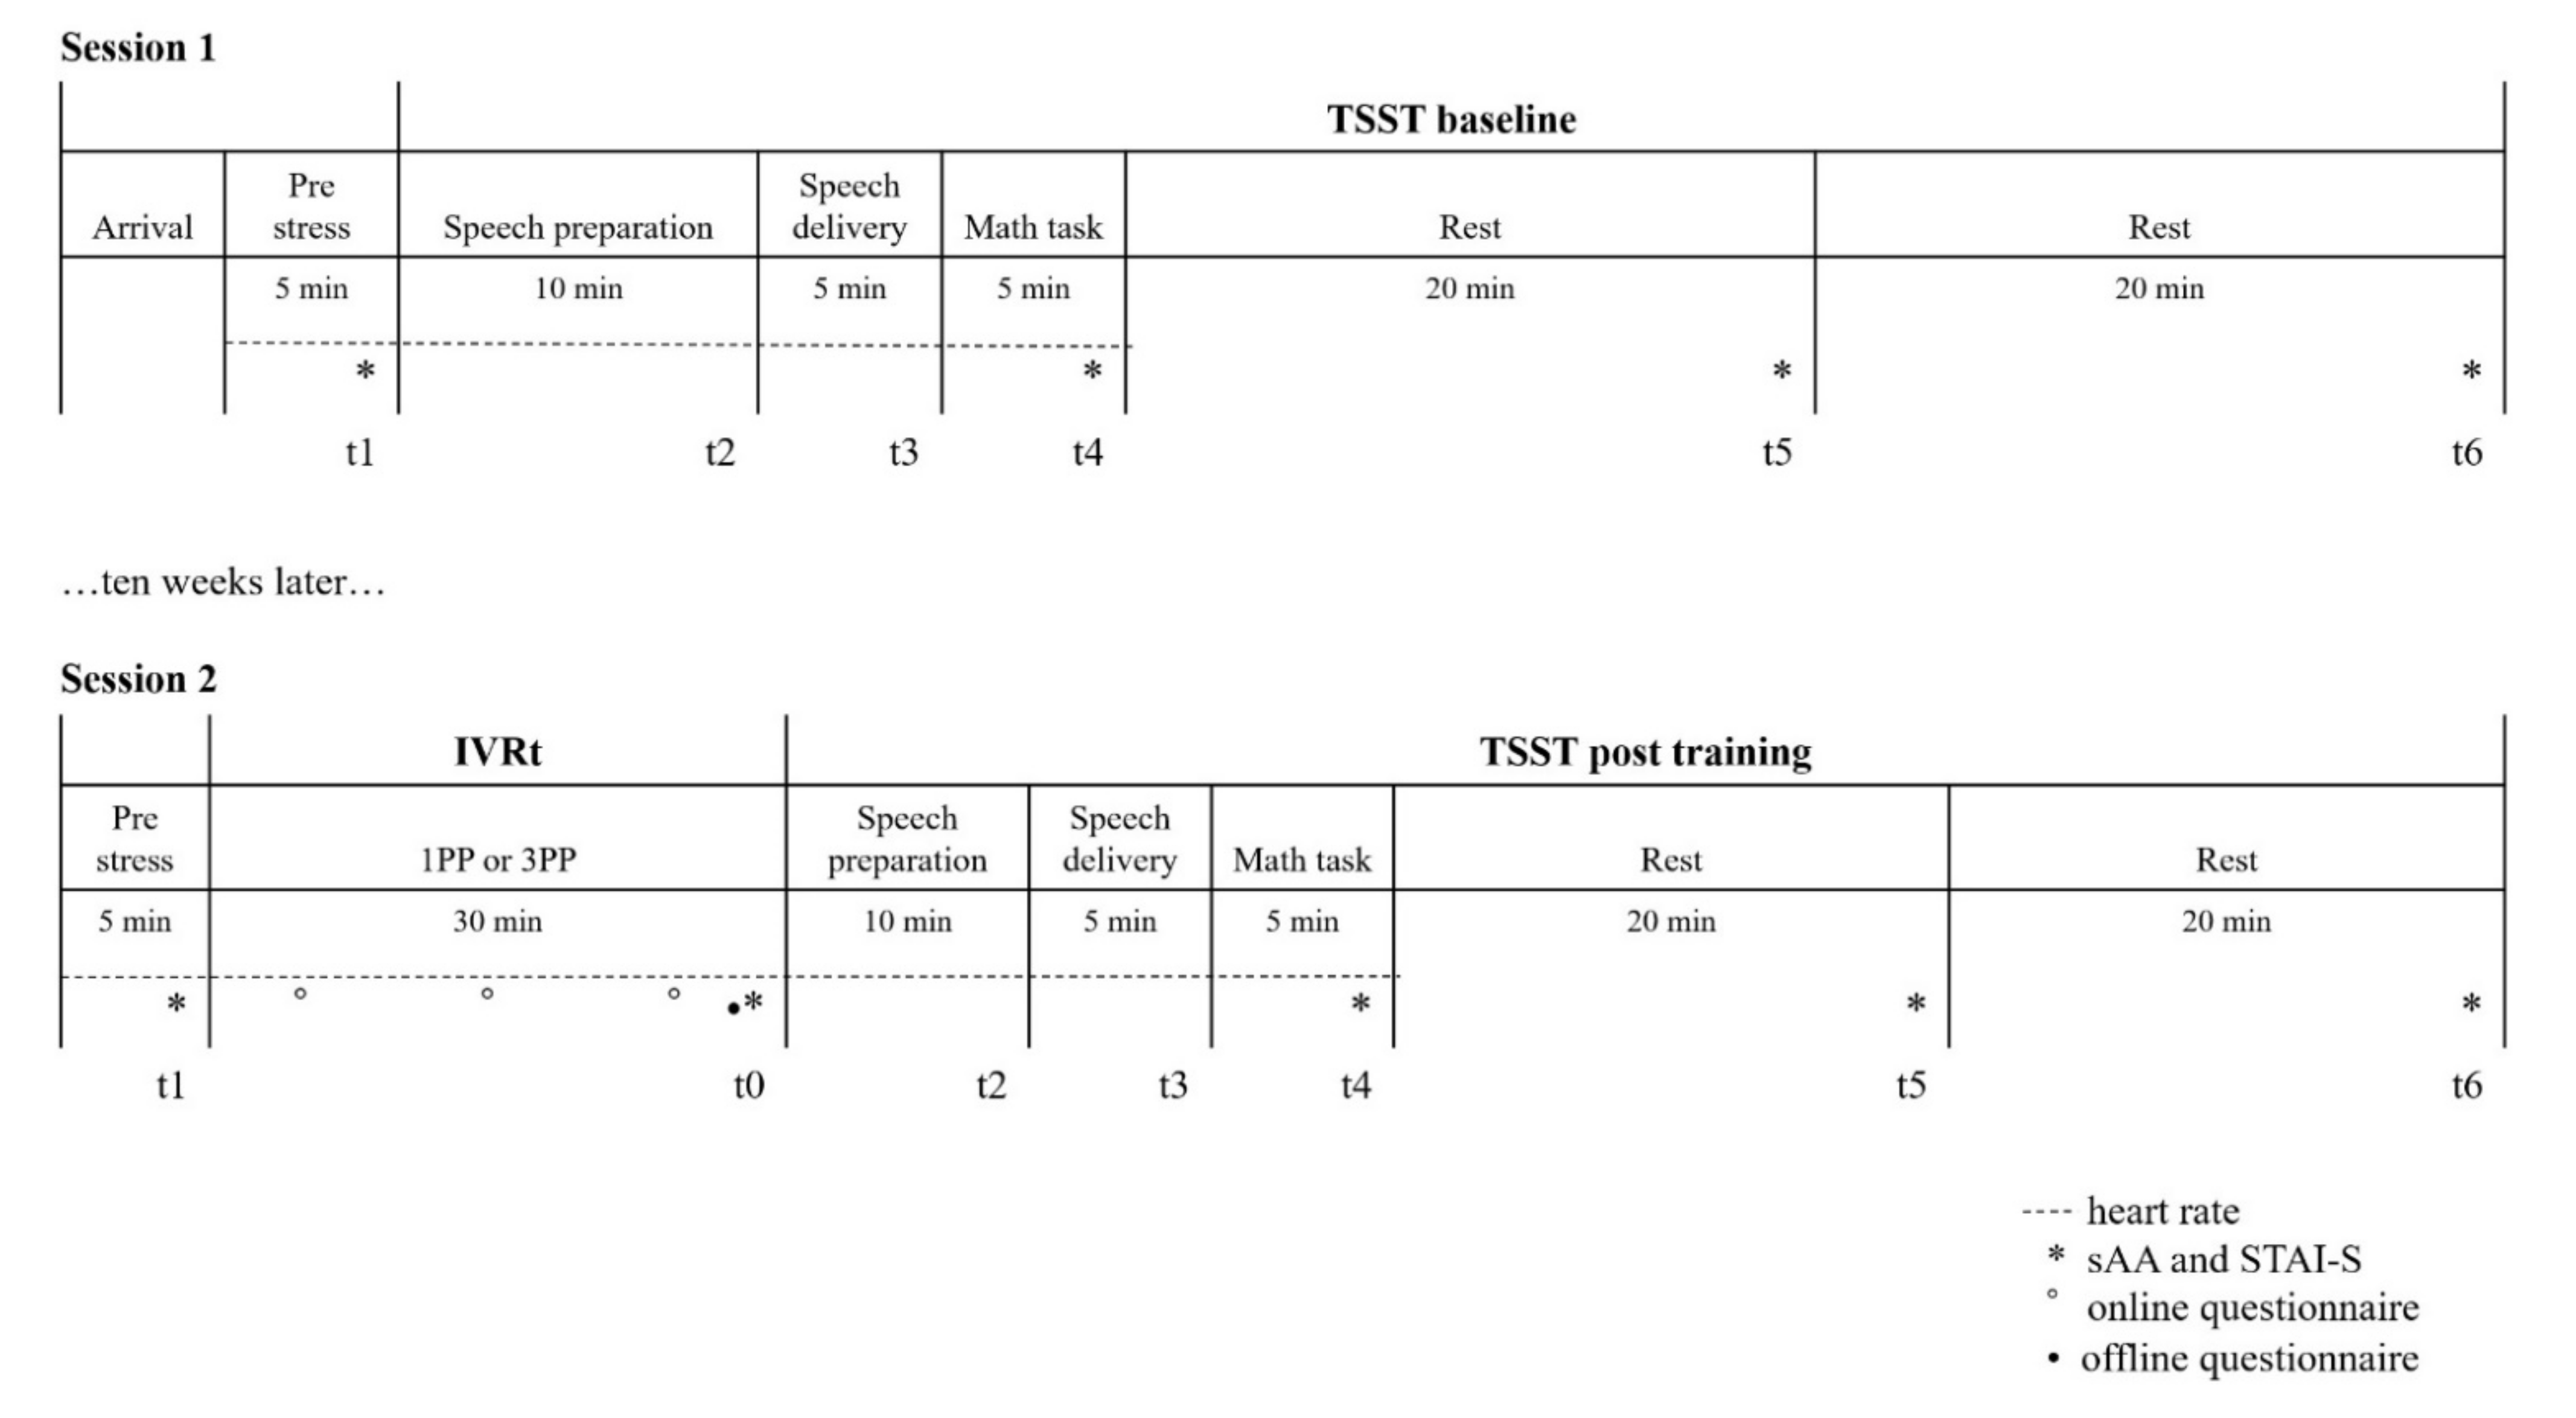
2.2. Procedure
2.2.1. Trier Social Stress Test (TSST)
Measurements during the TSST: sAA and STAI-S
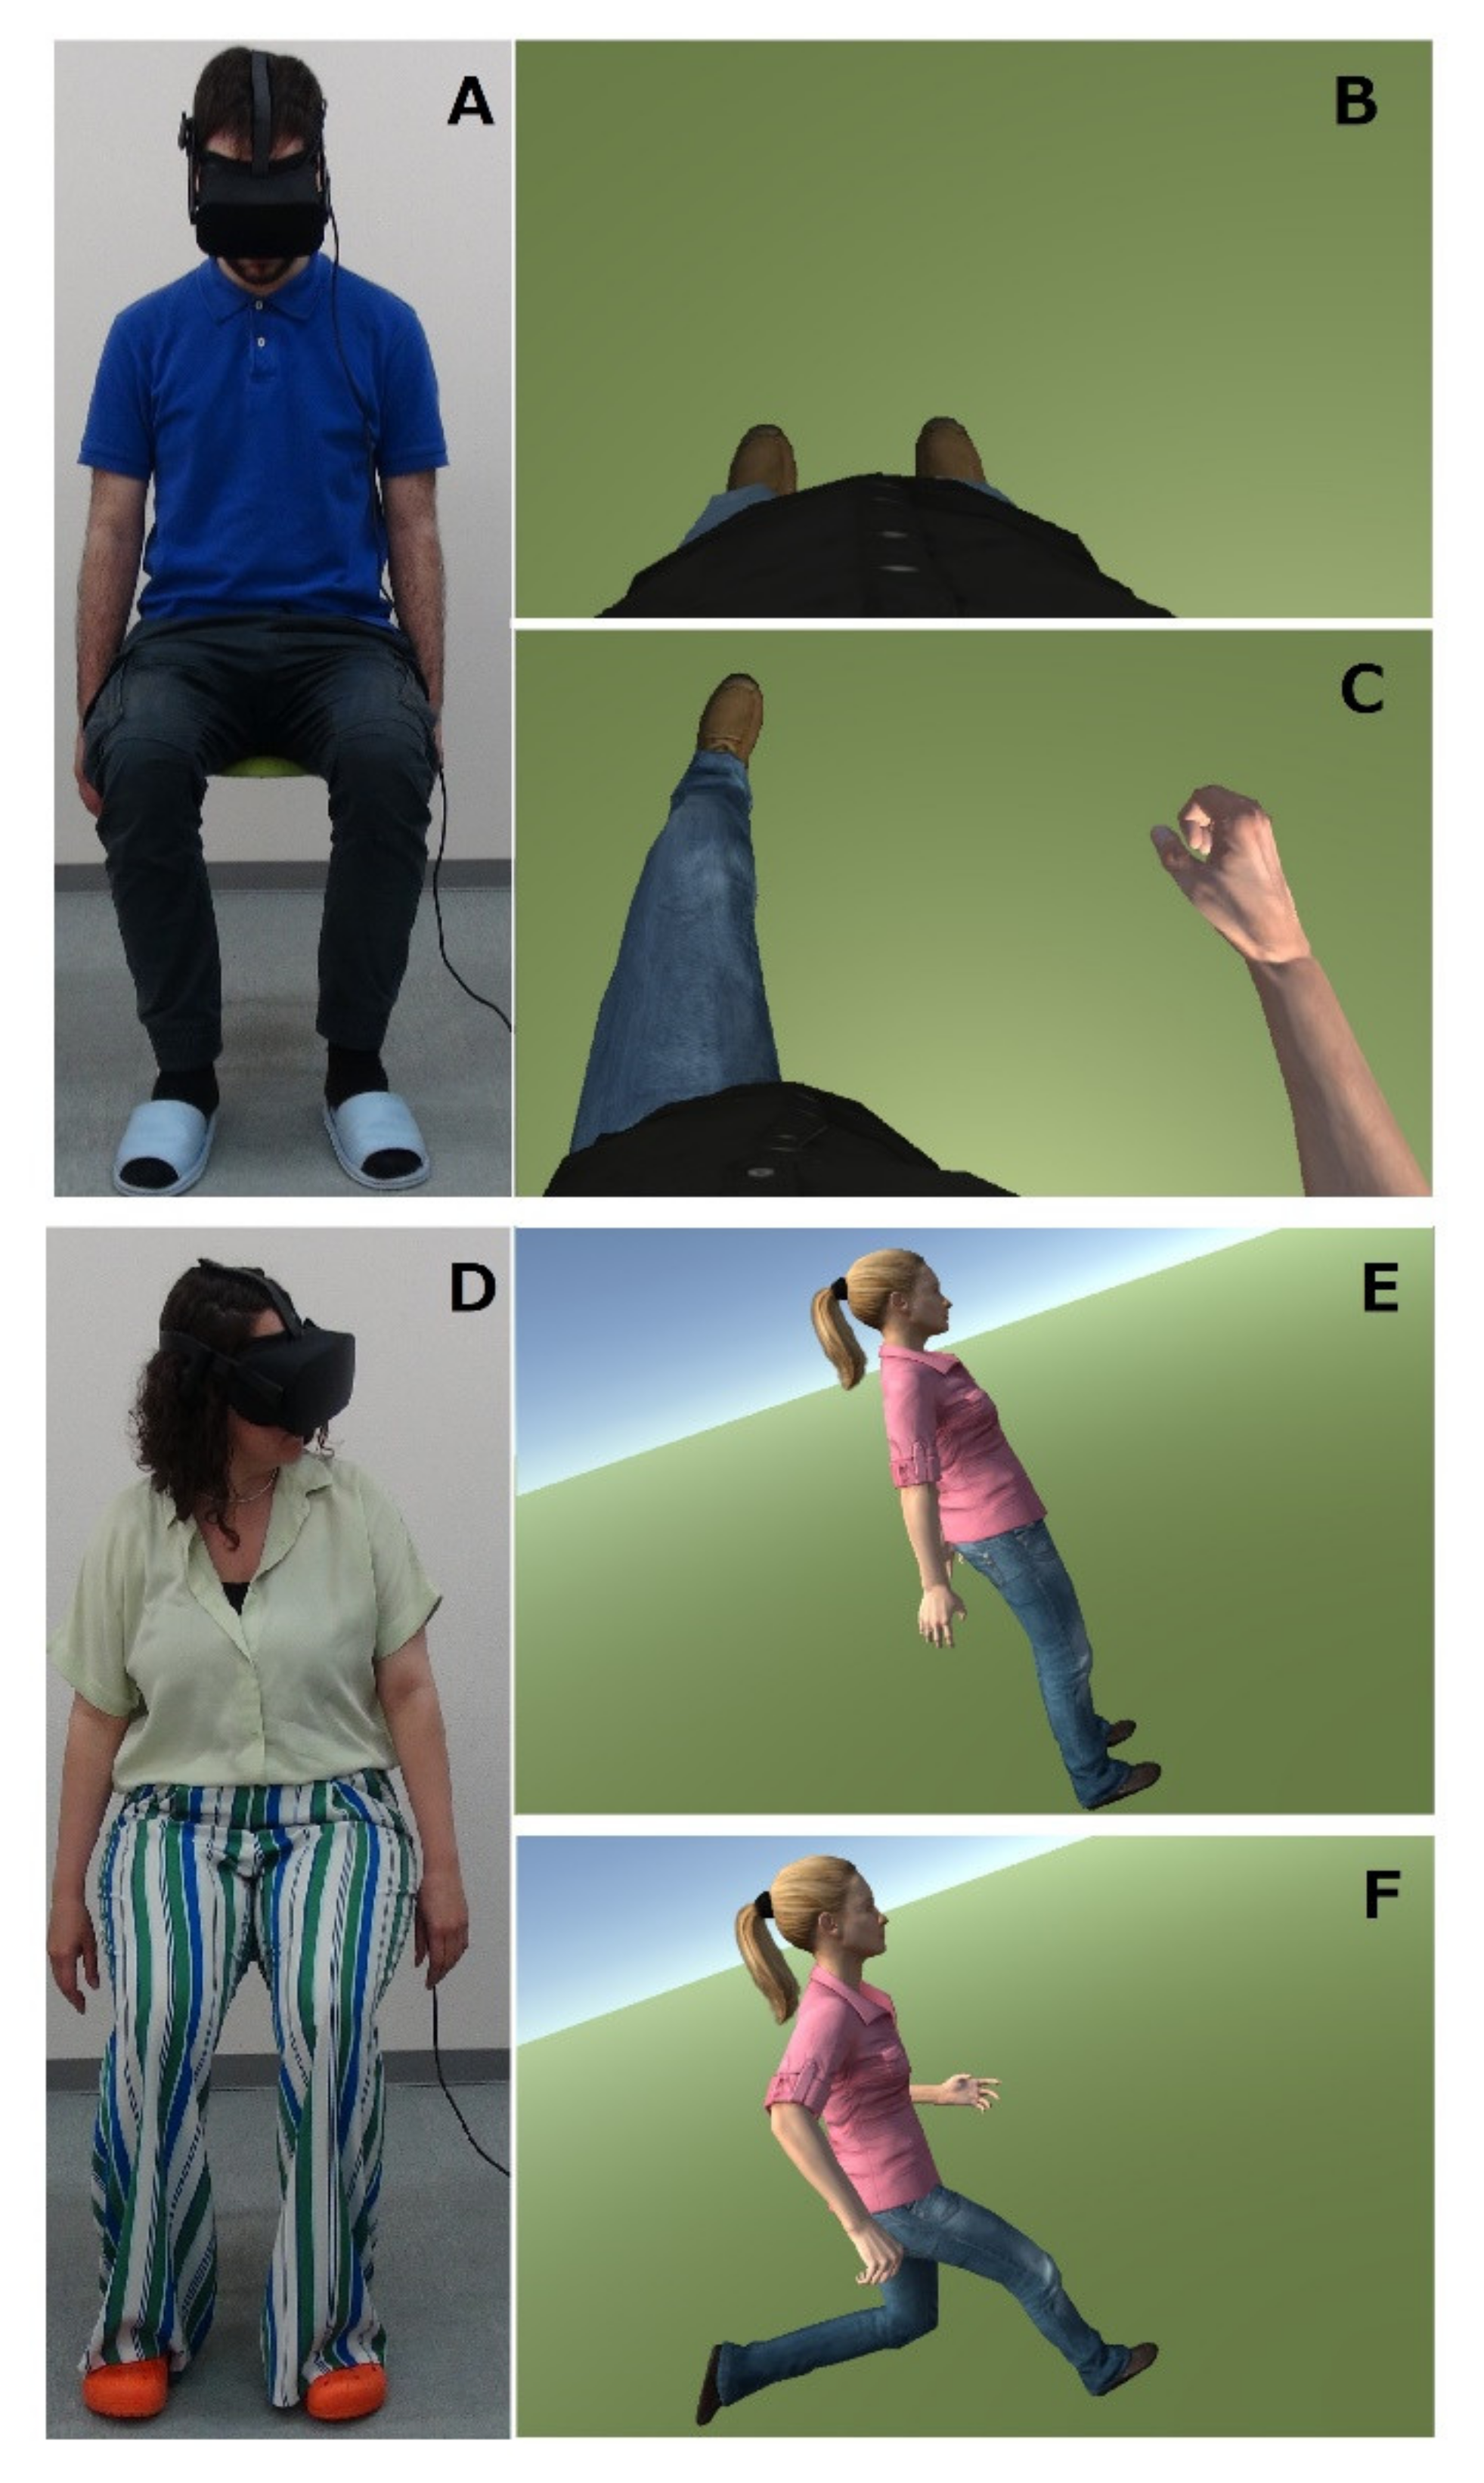
2.2.2. Immersive Virtual Reality Training (IVRt)
Measurements during the IVRt: HR and Online and Offline Questionnaires
2.3. Statistical Analysis
2.3.1. Online and Offline Questionnaires Regarding the IVRt
2.3.2. HR during the IVRt
2.3.3. sAA during the TSST
2.3.4. STAI-S during the TSST
2.3.5. HR during the TSST
2.3.6. Correlations
3. Results
3.1. Surveys
3.2. Measurements during the IVRt
3.2.1. Online Questionnaire
3.2.2. Offline Questionnaire
3.2.3. HR during the IVRt
3.2.4. Correlations between Measurements during the IVRt
3.3. Measurements during the TSST
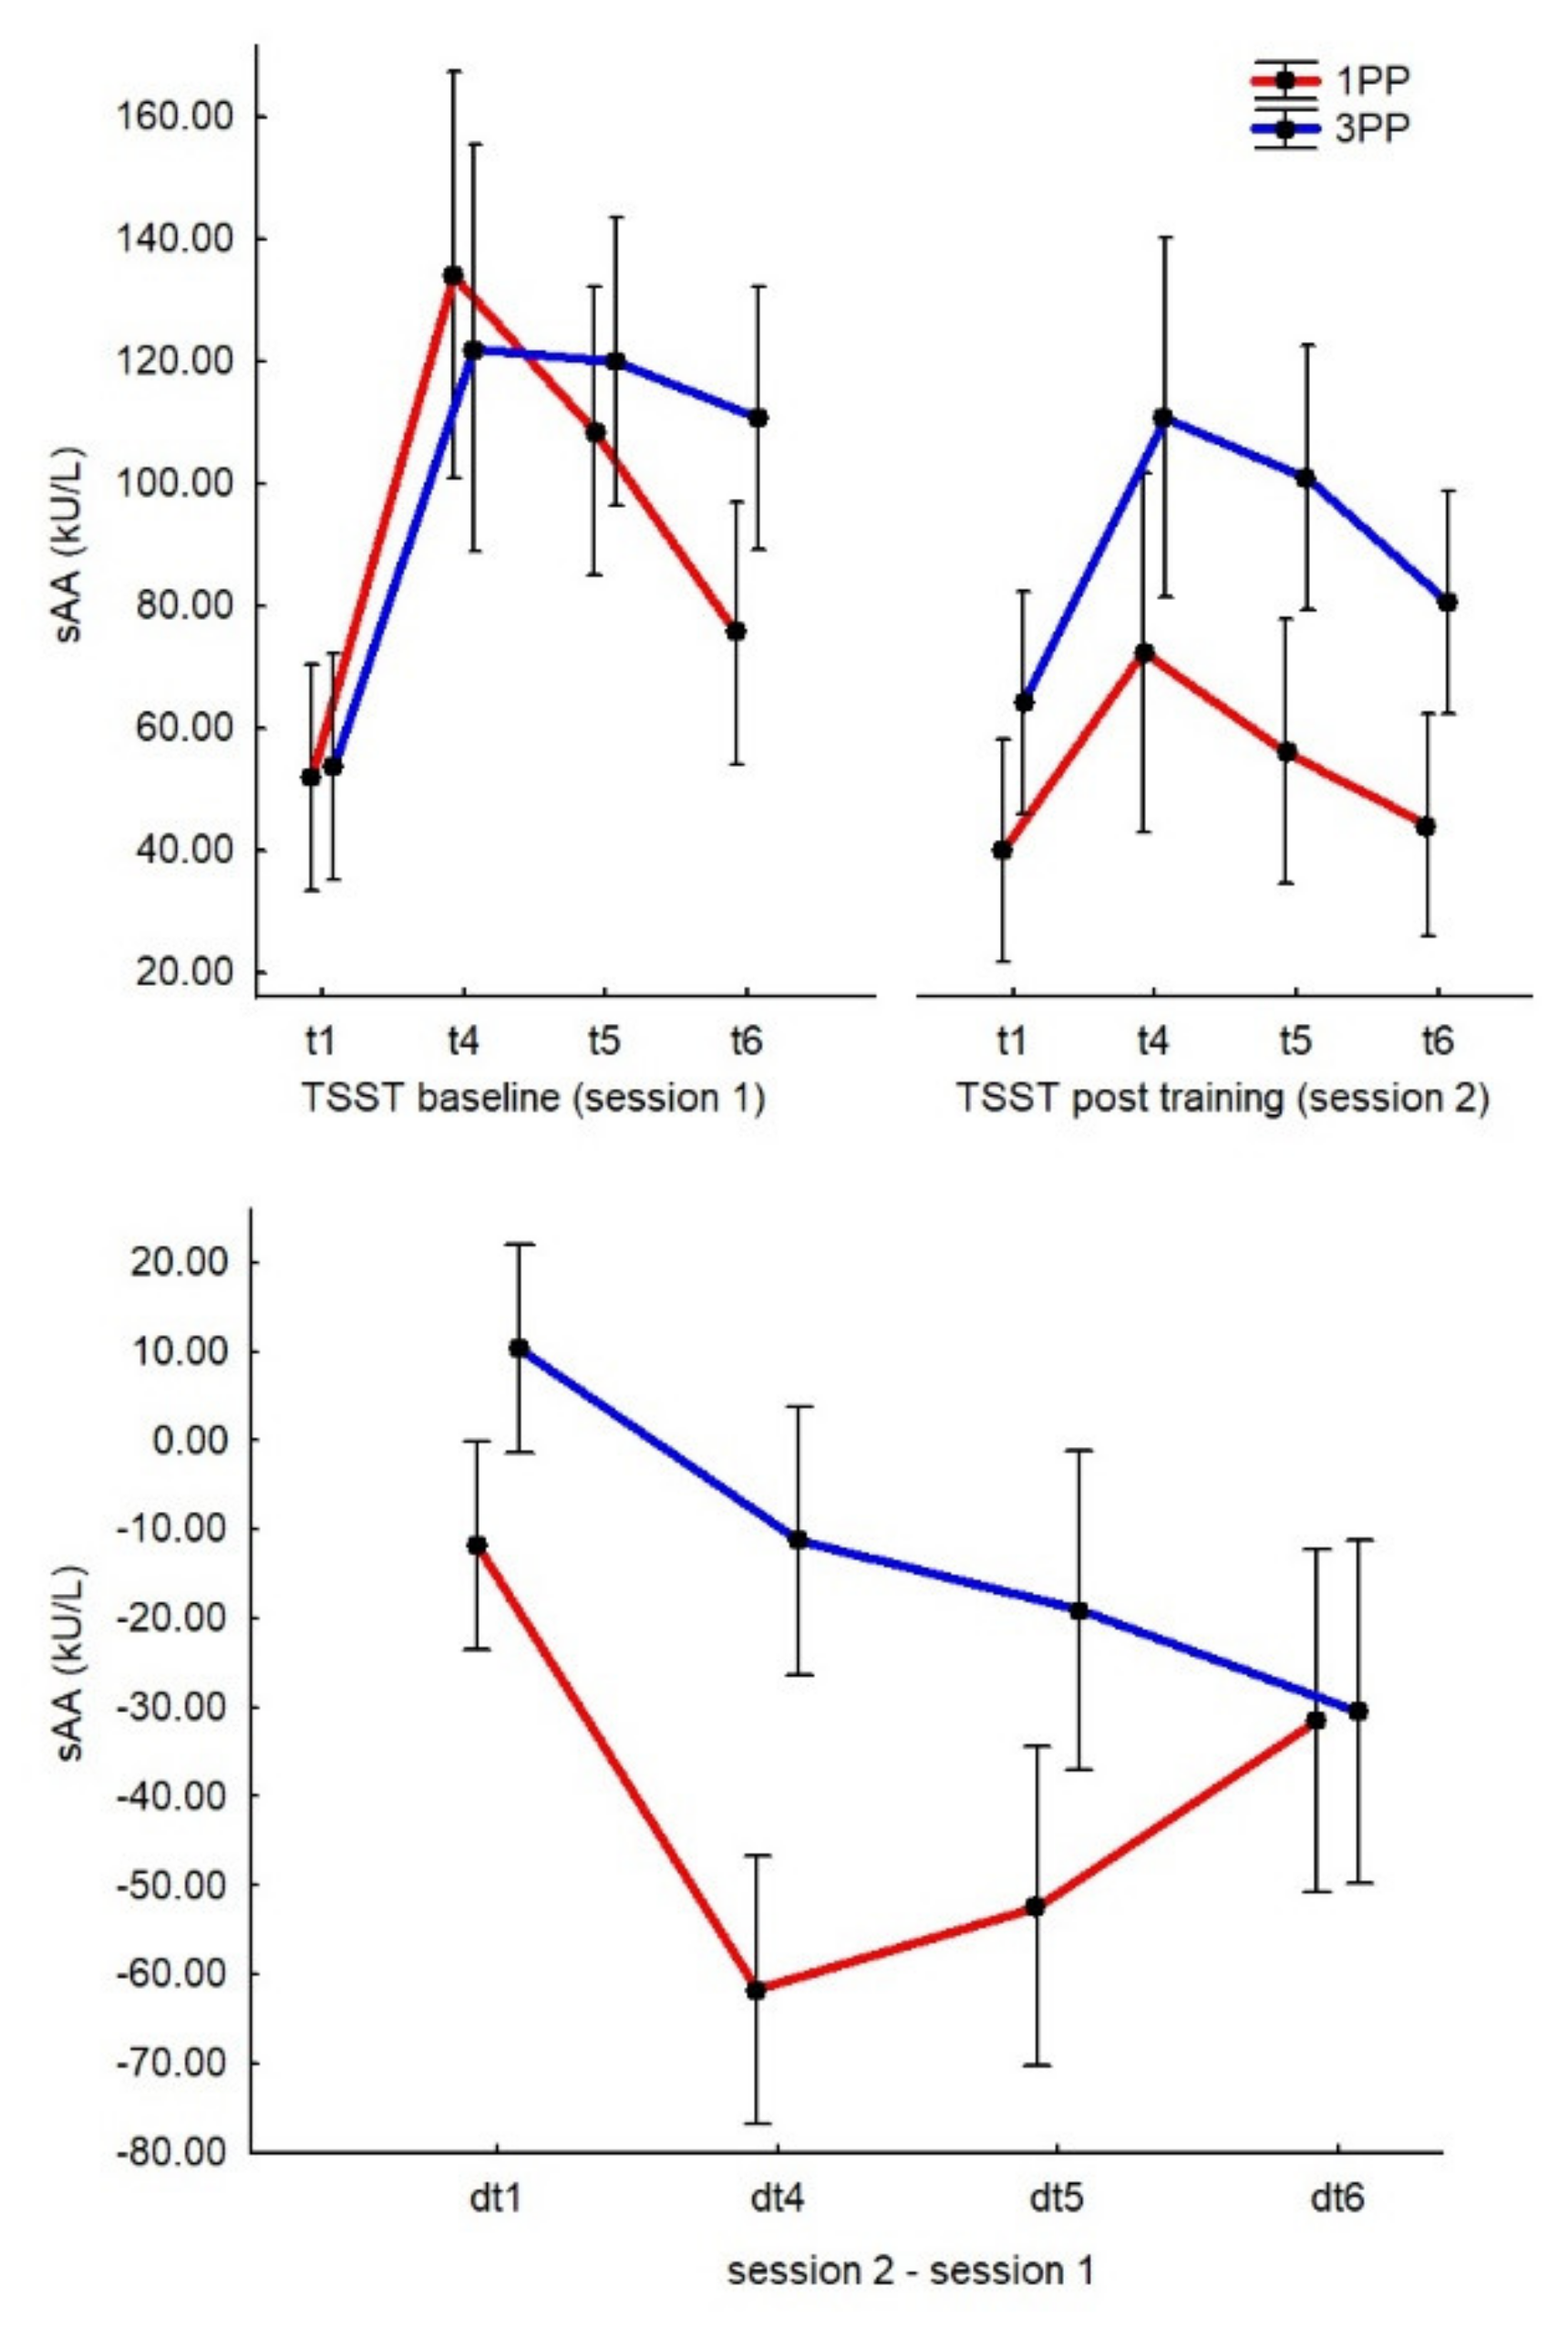
3.3.1. sAA
3.3.2. STAI-S
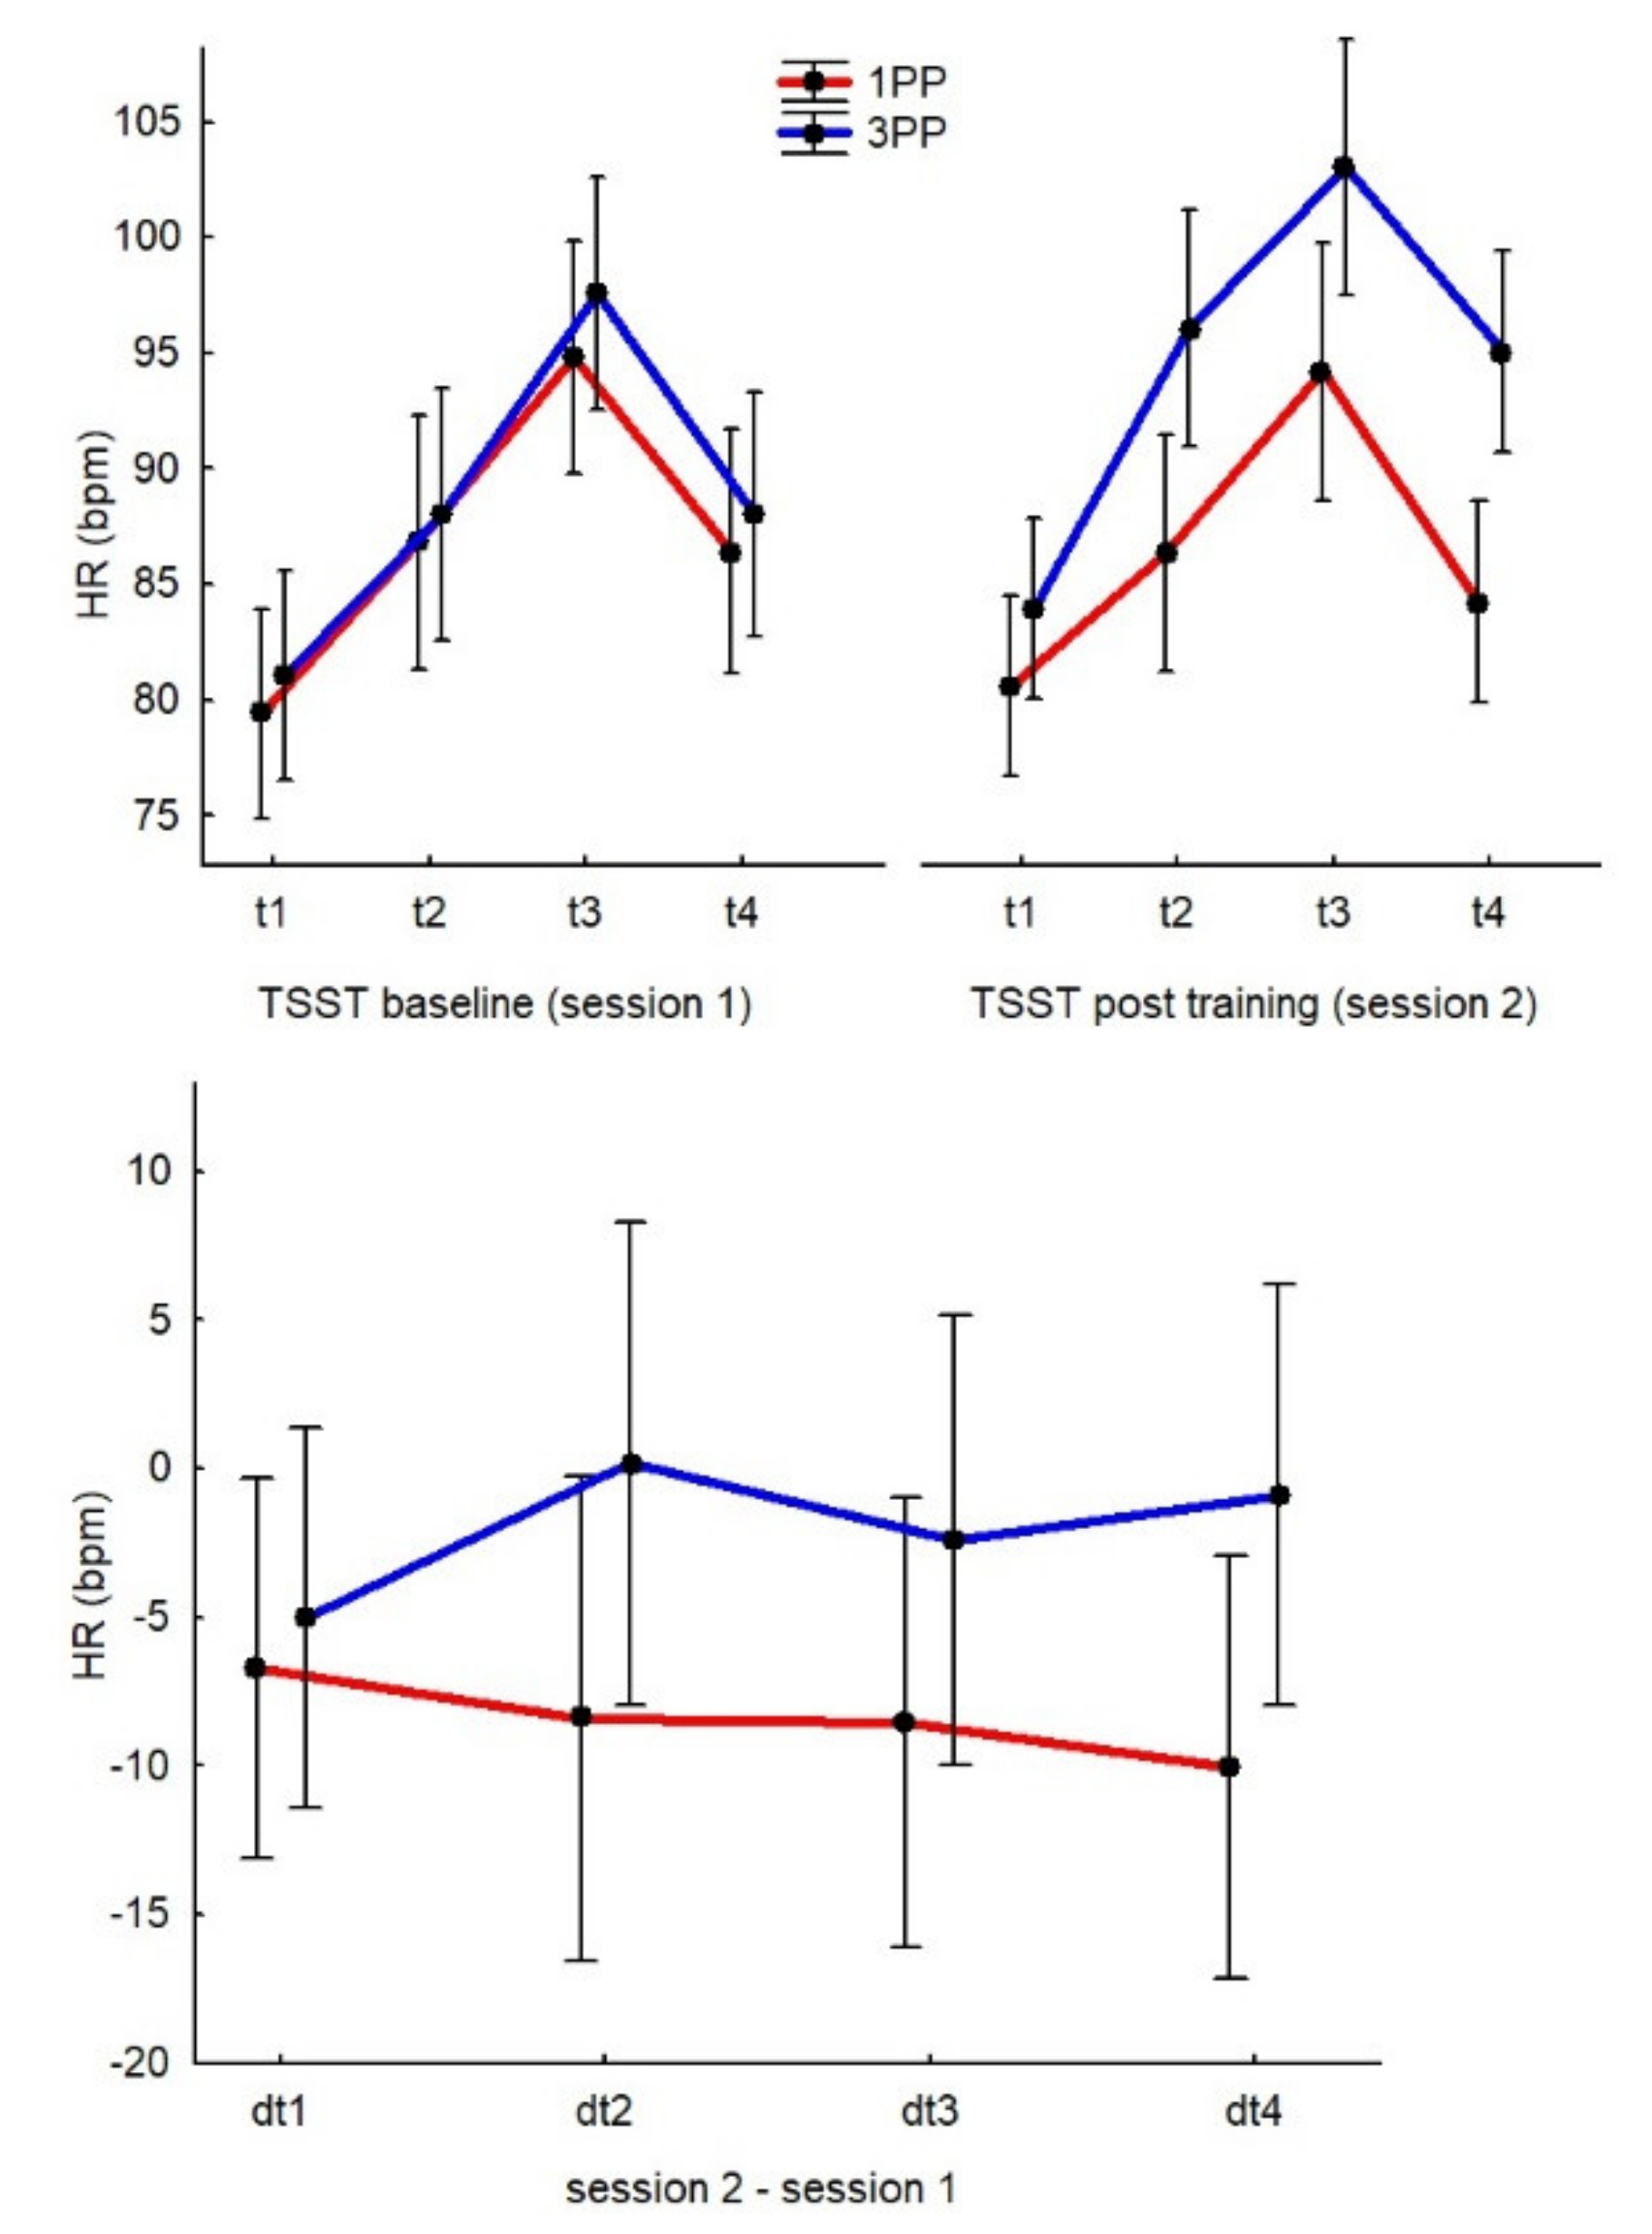
3.3.3. HR during TSST
3.3.4. Correlations between Measurements from the TSST and IVRt
4. Discussion
4.1. For Novelty, We Demonstrated That Training Performed by the Subject’s Own Virtual Body Could Induce Neuroendocrine Changes
4.2. Confirming Previous Results, Subjective Body Ownership and Agency Over a Moving Virtual Body Induced Physiological Changes
5. Conclusions
Supplementary Materials
Author Contributions
Funding
Institutional Review Board Statement
Informed Consent Statement
Data Availability Statement
Acknowledgments
Conflicts of Interest
References
- Kogler, L.; Müller, V.I.; Chang, A.; Eickhoff, S.B.; Fox, P.T.; Gur, R.C.; Derntl, B. Psychosocial versus physiological stress—Meta-analyses on deactivations and activations of the neural correlates of stress reactions. Neuroimage 2015, 119, 235–251. [Google Scholar] [CrossRef] [PubMed] [Green Version]
- Hillman, C.H.; Erickson, K.I.; Kramer, A.F. Be smart, exercise your heart: Exercise effects on brain and cognition. Nat. Rev. Neurosci. 2008, 9, 58–65. [Google Scholar] [CrossRef] [PubMed]
- Mücke, M.; Ludyga, S.; Colledge, F.; Gerber, M. Influence of regular physical activity and fitness on stress reactivity as measured with the trier social stress test protocol: A Systematic review. Sport. Med. 2018, 48, 2607–2622. [Google Scholar] [CrossRef] [PubMed]
- Sothmann, M.S.; Buckworth, J.; Claytor, R.P.; Cox, R.H.; White-Welkley, J.E.; Dishman, R.K. Exercise training and the cross-stressor adaptation hypothesis. Exerc. Sport Sci. Rev. 1996, 24, 267–288. [Google Scholar] [CrossRef] [PubMed]
- Engeland, C.G.; Bosch, J.A.; Rohleder, N. Salivary biomarkers in psychoneuroimmunology. Curr. Opin. Behav. Sci. 2019, 28, 58–65. [Google Scholar] [CrossRef]
- Forcier, K.; Stroud, L.R.; Papandonatos, G.D.; Hitsman, B.; Reiches, M.; Krishnamoorthy, J.; Niaura, R. Links between physical fitness and cardiovascular reactivity and recovery to psychological stressors: A meta-analysis. Health Psychol. 2006, 25, 723–739. [Google Scholar] [CrossRef]
- Booth, J.; Connelly, L.; Lawrence, M.; Chalmers, C.; Joice, S.; Becker, C.; Dougall, N. Evidence of perceived psychosocial stress as a risk factor for stroke in adults: A meta-analysis. BMC Neurol. 2015, 15, 233. [Google Scholar] [CrossRef] [Green Version]
- Burin, D.; Yamaya, N.; Ogitsu, R.; Kawashima, R. Virtual training leads to real acute physical, cognitive, and neural benefits on healthy adults: Study protocol for a randomized controlled trial. Trials 2019, 20, 559. [Google Scholar] [CrossRef] [Green Version]
- Maselli, A.; Slater, M. The building blocks of the full body ownership illusion. Front. Hum. Neurosci. 2013, 7, 83. [Google Scholar] [CrossRef] [Green Version]
- Burin, D.; Kilteni, K.; Rabuffetti, M.; Slater, M.; Pia, L. Body ownership increases the interference between observed and executed movements. PLoS ONE 2019, 14, e0209899. [Google Scholar] [CrossRef] [Green Version]
- Kokkinara, E.; Kilteni, K.; Blom, K.J.; Slater, M. First person perspective of seated participants over a walking virtual body leads to illusory agency over the walking. Sci. Rep. 2016, 6, 28879. [Google Scholar] [CrossRef] [Green Version]
- Burin, D.; Liu, Y.; Yamaya, N.; Kawashima, R. Virtual training leads to physical, cognitive and neural benefits in healthy adults. Neuroimage 2020, 222, 117297. [Google Scholar] [CrossRef]
- Burin, D.; Kawashima, R. Repeated exposure to illusory sense of body ownership and agency over a moving virtual body improves executive functioning and increases prefrontal cortex activity in the elderly. Front. Hum. Neurosci. 2021, 15, 219. [Google Scholar] [CrossRef]
- Tambone, R.; Giachero, A.; Calati, M.; Molo, M.T.; Burin, D.; Pyasik, M.; Cabria, F.; Pia, L. Using body ownership to modulate the motor system in stroke patients. Psychol. Sci. 2021, 32, 655–667. [Google Scholar] [CrossRef]
- Martini, M.; Perez-Marcos, D.; Sanchez-Vives, M.V. What colour is my arm? Changes in skin colour of an embodied virtual arm modulates pain threshold. Front. Hum. Neurosci. 2013, 7, 438. [Google Scholar] [CrossRef] [Green Version]
- Boyle, N.B.; Lawton, C.; Arkbåge, K.; West, S.G.; Thorell, L.; Hofman, D.; Weeks, A.; Myrissa, K.; Croden, F.; Dye, L. Stress responses to repeated exposure to a combined physical and social evaluative laboratory stressor in young healthy males. Psychoneuroendocrinology 2016, 63, 119–127. [Google Scholar] [CrossRef] [Green Version]
- Wood, C.J.; Clow, A.; Hucklebridge, F.; Law, R.; Smyth, N. Physical fitness and prior physical activity are both associated with less cortisol secretion during psychosocial stress. Anxiety Stress Coping 2018, 31, 135–145. [Google Scholar] [CrossRef]
- Wunsch, K.; Wurst, R.; von Dawans, B.; Strahler, J.; Kasten, N.; Fuchs, R. Habitual and acute exercise effects on salivary biomarkers in response to psychosocial stress. Psychoneuroendocrinology 2019, 106, 216–225. [Google Scholar] [CrossRef]
- Wyss, T.; Boesch, M.; Roos, L.; Tschopp, C.; Frei, K.M.; Annen, H.; La Marca, R. Aerobic fitness level affects cardiovascular and salivary alpha amylase responses to acute psychosocial stress. Sport. Med.-Open 2016, 2, 33. [Google Scholar] [CrossRef] [Green Version]
- Rainero, I.; Summers, M.J.; Monter, M.; Bazzani, M.; Giannouli, E.; Aumayr, G.; Burin, D.; Provero, P.; Vercelli, A.E. The my active and healthy aging ICT platform prevents quality of life decline in older adults: A randomised controlled study. Age Ageing 2021, 50, 1261–1267. [Google Scholar] [CrossRef]
- Boesch, M.; Sefidan, S.; Ehlert, U.; Annen, H.; Wyss, T.; Steptoe, A.; La Marca, R. Mood and autonomic responses to repeated exposure to the Trier Social Stress Test for Groups (TSST-G). Psychoneuroendocrinology 2014, 43, 41–51. [Google Scholar] [CrossRef] [PubMed] [Green Version]
- Petrowski, K.; Wintermann, G.B.; Siepmann, M. Cortisol response to repeated psychosocial stress. Appl. Psychophysiol. Biofeedback 2012, 37, 103–107. [Google Scholar] [CrossRef] [PubMed]
- Zigmond, A.S.; Snaith, R.P. The hospital anxiety and depression scale. Acta Psychiatr. Scand. 1983, 67, 361–370. [Google Scholar] [CrossRef] [PubMed] [Green Version]
- Cohen, S.; Williamson, G. Perceived stress in a probability sample of the United States. In The Social Psychology of Health; Sage Publications, Inc.: Thousand Oaks, CA, USA, 1988. [Google Scholar]
- Nakazato, K.; Mizuguchi, T. Development and validation of Japanese version of state-trait anxiety inventory: A study with female subjects. Jpn. J. Psychosom. Med. 1982, 22, 107–112. [Google Scholar]
- Birkett, M.A. The trier social stress test protocol for inducing psychological stress. J. Vis. Exp. 2011, 56, 3238. [Google Scholar] [CrossRef]
- Kirschbaum, C.; Pirke, K.M.; Hellhammer, D.H. The “trier social stress test”—A tool for investigating psychobiological stress responses in a laboratory setting. Neuropsychobiology 1993, 28, 76–81. [Google Scholar] [CrossRef]
- Engert, V.; Vogel, S.; Efanov, S.I.; Duchesne, A.; Corbo, V.; Ali, N.; Pruessner, J.C. Investigation into the cross-correlation of salivary cortisol and alpha-amylase responses to psychological stress. Psychoneuroendocrinology 2011, 36, 1294–1302. [Google Scholar] [CrossRef]
- Klaperski, S.; von Dawans, B.; Heinrichs, M.; Fuchs, R. Effects of a 12-week endurance training program on the physiological response to psychosocial stress in men: A randomized controlled trial. J. Behav. Med. 2014, 37, 1118–1133. [Google Scholar] [CrossRef]
- Wüst, S.; Federenko, I.S.; Van Rossum, E.F.C.; Koper, J.W.; Hellhammer, D.H. Habituation of cortisol responses to repeated psychosocial stress—Further characterization and impact of genetic factors. Psychoneuroendocrinology 2005, 30, 199–211. [Google Scholar] [CrossRef]
- Bachmann, P.; Finke, J.B.; Rebeck, D.; Zhang, X.; Larra, M.F.; Koch, K.P.; Turner, J.D.; Schächinger, H. Test-retest reproducibility of a combined physical and cognitive stressor. Biol. Psychol. 2019, 148, 107729. [Google Scholar] [CrossRef]
- Out, D.; Granger, D.A.; Sephton, S.E.; Segerstrom, S.C. Disentangling sources of individual differences in diurnal salivary α-amylase: Reliability, stability and sensitivity to context. Psychoneuroendocrinology 2013, 38, 367–375. [Google Scholar] [CrossRef] [Green Version]
- Duchesne, A.; Tessera, E.; Dedovic, K.; Engert, V.; Pruessner, J.C. Effects of panel sex composition on the physiological stress responses to psychosocial stress in healthy young men and women. Biol. Psychol. 2012, 89, 99–106. [Google Scholar] [CrossRef]
- Dickerson, S.S.; Kemeny, M.E. Acute stressors and cortisol responses: A theoretical integration and synthesis of laboratory research. Psychol. Bull. 2004, 130, 355–391. [Google Scholar] [CrossRef] [Green Version]
- Al’Absi, M.; Bongard, S.; Buchanan, T.; Pincomb, G.A.; Licinio, J.; Lovallo, W.R. Cardiovascular and neuroendocrine adjustment to public speaking and mental arithmetic stressors. Psychophysiology 1997, 34, 266–275. [Google Scholar] [CrossRef]
- Bosch, J.A.; Brand, H.; Ligtenberg, A.J.M.; Bermond, B.; Hoogstraten, J.; Amerongen van, A.N. Psychological stress as a determinant of protein levels and salivary- induced aggregation of Streptococcus gordonii in human whole saliva. Psychosom. Med. 1996, 58, 374–382. [Google Scholar] [CrossRef]
- Rohleder, N.; Nater, U.M.; Wolf, J.M.; Ehlert, U.; Kirschbaum, C. Psychosocial stress-induced activation of salivary alpha-amylase: An indicator of sympathetic activity? Ann. N. Y. Acad. Sci. 2004, 1032, 258–263. [Google Scholar] [CrossRef]
- Nagy, T.; van Lien, R.; Willemsen, G.; Proctor, G.; Efting, M.; Fülöp, M.; Bárdos, G.; Veerman, E.C.I.; Boschah, J.A. A fluid response: Alpha-amylase reactions to acute laboratory stress are related to sample timing and saliva flow rate. Biol. Psychol. 2015, 109, 111–119. [Google Scholar] [CrossRef]
- Thoma, M.V.; Kirschbaum, C.; Wolf, J.M.; Rohleder, N. Acute stress responses in salivary alpha-amylase predict increases of plasma norepinephrine. Biol. Psychol. 2012, 91, 342–348. [Google Scholar] [CrossRef]
- Kuras, Y.I.; McInnis, C.M.; Thoma, M.V.; Chen, X.; Hanlin, L.; Gianferante, D.; Rohleder, N. Increased alpha-amylase response to an acute psychosocial stress challenge in healthy adults with childhood adversity. Dev. Psychobiol. 2017, 59, 91–98. [Google Scholar] [CrossRef] [Green Version]
- Bosch, J.A. The use of saliva markers in psychobiology: Mechanisms and methods. Monogr. Oral Sci. 2014, 24, 99–108. [Google Scholar]
- Gonzalez-Franco, M.; Ofek, E.; Pan, Y.; Antley, A.; Steed, A.; Spanlang, B.; Maselli, A.; Banakou, D.; Pelechano, N.; Orts-Escolano, S. The Rocketbox Library and the Utility of Freely Available Rigged Avatars. Front. Virtual Real. 2020, 1, 20. [Google Scholar] [CrossRef]
- Cohen, J. Statistical Power Analysis for the Behavioral Sciences, 2nd ed.; Cox, B.J., Endler, N.S., Swinson, R., Eds.; Erlbaum: Hillsdale, NJ, USA, 1998; Volume 33, pp. 57–62. [Google Scholar]
- Burin, D.; Livelli, A.; Garbarini, F.; Fossataro, C.; Folegatti, A.; Gindri, P.; Pia, L. Are movements necessary for the sense of body ownership? Evidence from the rubber hand illusion in pure hemiplegic patients. PLoS ONE 2015, 10, e0117155. [Google Scholar] [CrossRef] [PubMed]
- Romano, D.; Pfeiffer, C.; Maravita, A.; Blanke, O. Illusory self-identification with an avatar reduces arousal responses to painful stimuli. Behav. Brain Res. 2014, 261, 275–281. [Google Scholar] [CrossRef] [PubMed]
- Banakou, D.; Groten, R.; Slater, M. Illusory ownership of a virtual child body causes overestimation of object sizes and implicit attitude changes. Proc. Natl. Acad. Sci. USA 2013, 110, 12846–12851. [Google Scholar] [CrossRef] [Green Version]
- Banakou, D.; Kishore, S.; Slater, M. Virtually being Einstein results in an improvement in cognitive task performance and a decrease in age bias. Front. Psychol. 2018, 9, 917. [Google Scholar] [CrossRef] [Green Version]
- Peck, T.C.; Seinfeld, S.; Aglioti, S.M.; Slater, M. Putting yourself in the skin of a black avatar reduces implicit racial bias. Conscious. Cogn. 2013, 22, 779–787. [Google Scholar] [CrossRef]
- Osimo, S.A.; Pizarro, R.; Spanlang, B.; Slater, M. Conversations between self and self as Sigmund Freud—A virtual body ownership paradigm for self counselling. Sci. Rep. 2015, 5, 13899. [Google Scholar] [CrossRef]
- Skoluda, N.; Strahler, J.; Schlotz, W.; Niederberger, L.; Marques, S.; Fischer, S.; Thoma, M.V.; Spoerri, C.; Ehlert, U.; Nater, U.M. Intra-individual psychological and physiological responses to acute laboratory stressors of different intensity. Psychoneuroendocrinology 2015, 51, 227–236. [Google Scholar] [CrossRef]
- Bandelow, B.; Michaelis, S. Epidemiology of anxiety disorders in the 21st century. Dialogues Clin. Neurosci. 2015, 17, 327–335. [Google Scholar] [CrossRef]
- Van Der Molen, H.F.; Nieuwenhuijsen, K.; Frings-Dresen, M.H.W.; De Groene, G. Work-related psychosocial risk factors for stress-related mental disorders: An updated systematic review and meta-analysis. BMJ Open 2020, 10, e034849. [Google Scholar] [CrossRef]
- Klumbies, E.; Braeuer, D.; Hoyer, J.; Kirschbaum, C. The reaction to social stress in social phobia: Discordance between physiological and subjective parameters. PLoS ONE 2014, 9, e105670. [Google Scholar] [CrossRef] [Green Version]
- Thibodeau, M.A.; Gómez-Pérez, L.; Asmundson, G.J.G. Objective and perceived arousal during performance of tasks with elements of social threat: The influence of anxiety sensitivity. J. Behav. Ther. Exp. Psychiatry 2012, 43, 967–974. [Google Scholar] [CrossRef]
- Botvinick, M.; Cohen, J. Rubber hands “feel” touch that eyes see. Nature 1998, 391, 756. [Google Scholar] [CrossRef]
- Tsakiris, M. My body in the brain: A neurocognitive model of body-ownership. Neuropsychologia 2010, 48, 703–712. [Google Scholar] [CrossRef]
- Burin, D.; Pyasik, M.; Ronga, I.; Cavallo, M.; Salatino, A.; Pia, L. “As long as that is my hand, that willed action is mine”: Timing of agency triggered by body ownership. Conscious. Cogn. 2018, 58, 186–192. [Google Scholar] [CrossRef]
- Maselli, A.; Kilteni, K.; López-Moliner, J.; Slater, M. The sense of body ownership relaxes temporal constraints for multisensory integration. Sci. Rep. 2016, 6, 30628. [Google Scholar] [CrossRef]
- Banakou, D.; Slater, M. Body ownership causes illusory self-attribution of speaking and influences subsequent real speaking. Proc. Natl. Acad. Sci. USA 2014, 111, 17678–17683. [Google Scholar] [CrossRef] [Green Version]
- Pyasik, M.; Burin, D.; Pia, L. On the relation between body ownership and sense of agency: A link at the level of sensory-related signals. Acta Psychol. 2018, 185, 219–228. [Google Scholar] [CrossRef]
- Synofzik, M.; Vosgerau, G.; Newen, A. Beyond the comparator model: A multifactorial two-step account of agency. Conscious. Cogn. 2008, 17, 219–239. [Google Scholar] [CrossRef]
- Burin, D.; Pyasik, M.; Salatino, A.; Pia, L. That’s my hand! Therefore, that’s my willed action: How body ownership acts upon conscious awareness of willed actions. Cognition 2017, 166, 164–173. [Google Scholar] [CrossRef]
- Chambon, V.; Sidarus, N.; Haggard, P. From action intentions to action effects: How does the sense of agency come about? Front. Hum. Neurosci. 2014, 8, 320. [Google Scholar] [CrossRef] [PubMed]
- Slater, M.; Spanlang, B.; Sanchez-Vives, M.V.; Blanke, O. First person experience of body transfer in virtual reality. PLoS ONE 2010, 5, e10564. [Google Scholar] [CrossRef] [PubMed] [Green Version]
- Tieri, G.; Tidoni, E.; Pavone, E.F.; Aglioti, S.M. Body visual discontinuity affects feeling of ownership and skin conductance responses. Sci. Rep. 2015, 5, 17139. [Google Scholar] [CrossRef] [PubMed] [Green Version]
- Danilenko, K.V.; Kobelev, E.; Zhanaeva, S.Y.; Aftanas, L.I. Winter-summer difference in post-awakening salivary α-amylase and sleepiness depending on sleep and melatonin. Physiol Behav. 2021, 240, 113549. [Google Scholar] [CrossRef]


| 1PP | 3PP | p Value | R2 | ||||
|---|---|---|---|---|---|---|---|
| Online Questionnaire | |||||||
| Static Phase | s1 | Body ownership | I feel as if I am looking at my own body | 3.91 ± 0.26 (5.92 ± 0.22) | 0.17 ± 0.13 (1.88 ± 0.16) | <0.01 * | 0.67 |
| s2 | Body ownership control | I feel as if the virtual body belongs to another person | 0.45 ± 0.24 (2.46 ± 0.26) | 4.40 ± 0.27 (6.11 ± 0.23) | <0.01 * | 0.66 | |
| Dynamic Phase | s1 | Body ownership | I feel as if I am looking at my own body | 3.53 ± 0.28 (5.53 ± 0.27) | 0.48 ± 0.17 (2.19 ± 0.23) | <0.01 * | 0.57 |
| s2 | Body ownership control | I feel as if the virtual body belongs to another person | 1.13 ± 0.26 (3.14 ± 0.28) | 3.37 ± 0.33 (5.08 ± 0.31) | <0.01 * | 0.34 | |
| s3 | Agency | The virtual body moves just as I want, as if I am controlling it | 2.63 ± 0.24 (4.64 ± 0.22) | 0.72 ± 0.20 (2.43 ± 0.25) | <0.01 * | 0.42 | |
| s4 | Agency control | I feel as if the virtual body is controlling my will | 0.36 ± 0.22 (2.37 ± 0.25) | 0.49 ± 0.21 (2.20 ± 0.26) | 0.45 | ||
| Offline Questionnaire | |||||||
| s5 | Located | During the experiment, I felt as if my body was located where I saw the virtual body to be | 1.88 ± 0.23 (4.69 ± 0.26) | 1.26 ± 0.27 (3.19 ± 0.28) | 0.04 * | 0.07 | |
| s6 | Ownership | During the experiment, I felt that the virtual body was my own body | 1.73 ± 0.28 (4.53 ± 0.31) | 0.69 ± 0.23 (2.61 ± 0.26) | 0.01* | 0.13 | |
| s7 | Standing | During the experiment, I felt that I was standing upright | 1.81 ± 0.25 (4.61 ± 0.26) | 0.62 ± 0.27 (2.53 ± 0.28) | <0.01 * | 0.18 | |
| s8 | My movements | During the experiment, I felt that the leg movements of the virtual body were my movements | 1.58 ± 0.23 (4.38 ± 0.24) | 0.46 ± 0.23 (2.38 ± 0.27) | <0.01 * | 0.20 | |
| s9 | Agency | During the experiment, I felt that the leg movements of the virtual body were caused by my movements | 1.35 ± 0.24 (4.15 ± 0.26) | 0.23 ± 0.24 (2.15 ± 0.28) | <0.01 * | 0.17 | |
| s10 | Ownership control | During the experiment, I felt that the virtual body belonged to someone else | 0.27 ± 0.31 (3.07 ± 0.24) | 3.23 ± 0.42 (5.15 ± 0.34) | <0.01 * | 0.35 | |
| s11 | Effort | I felt that I had to give extra physical effort when the virtual body was running | 0.81 ± 0.29 (3.61 ± 0.33) | 0.15 ± 0.12 (2.07 ± 0.18) | 0.07 | ||
| s12 | Vection | I felt that I was moving through space rather than the world moving past me | 2.31 ± 0.26 (5.11 ± 0.28) | 1.85 ± 0.36 (3.76 ± 0.36) | 0.29 | ||
| s13 | Walking | I felt that I was walking | 1.85 ± 0.23 (4.65 ± 0.27) | 1.62 ± 0.31 (3.53 ± 0.33) | 0.40 | ||
| s14 | Dragged | I felt that I was being dragged | −0.30 ± 0.16 (2.50 ± 0.22) | 0.46 ± 0.21 (2.38 ± 0.23) | <0.01 * | 0.12 | |
| s15 | Sliding | I felt that I was sliding | −0.41 ± 0.18 (2.38 ± 0.24) | 1.39 ± 0.40 (3.30 ± 0.41) | <0.01 * | 0.24 | |
| Session 1 | Session 2 | Session 2−Session 1 | ||||
|---|---|---|---|---|---|---|
| 1PP | t1 | 51.88 (9.53) | t1 | 40.00 (8.39) | dt1 | −11.88 (5.56) |
| t0 | 114.11 (17.44) | |||||
| t4 | 134.03 (13.28) | t4 | 72.34 (11.02) | dt4 | −61.69 (9.13) | |
| t5 | 108.57 (12.09) | t5 | 56.19 (10.32) | dt5 | −52.38 (7.62) | |
| t6 | 75.57 (10.11) | t6 | 44.03 (8.12) | dt6 | −31.53 (6.74) | |
| 3PP | t1 | 53.73 (8.94) | t1 | 64.11 (9.73) | dt1 | 10.38 (6.04) |
| t0 | 88.26 (16.40) | |||||
| t4 | 122.07 (19.33) | t4 | 110.84 (11.59) | dt4 | −11.23 (5.14) | |
| t5 | 119.92 (11.32) | t5 | 100.88 (11.21) | dt5 | −19.03 (10.06) | |
| t6 | 110.84 (11.26) | t6 | 80.42 (9.90) | dt6 | −30.42 (11.76) | |
| All | t1 | 52.80 (6.47) | t1 | 52.05 (6.58) | dt1 | −0.75 (4.35) |
| t0 | 101.19 (11.99) | |||||
| t4 | 128.05 (11.64) | t4 | 91.59 (10.62) | dt4 | −36.46 (6.33) | |
| t5 | 114.25 (8.24) | t5 | 78.53 (8.16) | dt5 | −35.71 (6.67) | |
| t6 | 93.21 (7.89) | t6 | 62.23 (6.83) | dt6 | −30.98 (6.71) | |
| Session 1 | Session 2 | Session 2 − Session 1 | dt4 | ||||
|---|---|---|---|---|---|---|---|
| 1PP | t1 | 34.88 (1.52) | t1 | 33.30 (1.50) | dt1 | −1.57 (1.45) | 0.02 * |
| t0 | 43.73 (1.72) | ||||||
| t4 | 45.61 (1.70) | t4 | 38.84 (1.19) | dt4 | −6.76 (2.04) | --- | |
| t5 | 35.00 (1.00) | t5 | 34.07 (1.19) | dt5 | −0.92 (1.23) | 0.01 * | |
| t6 | 31.53 (1.13) | t6 | 32.61 (1.23) | dt6 | 1.07 (1.27) | <0.01 * | |
| 3PP | t1 | 36.80 (1.28) | t1 | 39.07 (1.74) | dt1 | 2.26 (2.07) | <0.01 * |
| t0 | 44.76 (1.52) | ||||||
| t4 | 46.69 (1.69) | t4 | 44.65 (1.41) | dt4 | −2.03 (2.41) | --- | |
| t5 | 35.92 (1.23) | t5 | 34.53 (1.18) | dt5 | −1.38 (0.95) | 0.04 * | |
| t6 | 33.69 (1.15) | t6 | 32.23 (1.07) | dt6 | −1.46 (0.83) | 0.03 * | |
| All | t1 | 35.84 (0.99) | t1 | 36.19 (1.21) | dt1 | 0.34 (1.28) | |
| t0 | 41.75 (1.00) | ||||||
| t4 | 46.15 (1.19) | t4 | 41.75 (1.00) | dt4 | −4.40 (1.60) | ||
| t5 | 35.46 (0.78) | t5 | 34.30 (0.83) | dt5 | −1.15 (0.77) | ||
| t6 | 32.61 (0.81) | t6 | 32.42 (0.80) | dt6 | −0.19 (0.77) | ||
| Session 1 | Session 2 | Session 2 − Session 1 | ||||
|---|---|---|---|---|---|---|
| 1PP | t1 | 79.42 (2.36) | t1 | 72.72 (2.54) | dt1 | −6.69 (3.62) |
| t2 | 86.82 (2.66) | t2 | 78.43 (2.80) | dt2 | −8.39 (4.14) | |
| t3 | 94.83 (2.34) | t3 | 86.31 (3.34) | dt3 | −8.52 (4.03) | |
| t4 | 86.43 (2.33) | t4 | 76.38 (2.34) | dt4 | −10.04 (3.39) | |
| 3PP | t1 | 81.10 (2.13) | t1 | 76.07 (1.53) | dt1 | −5.03 (2.66) |
| t2 | 88.01 (2.77) | t2 | 88.17 (1.97) | dt2 | 0.16 (3.95) | |
| t3 | 97.54 (2.65) | t3 | 95.15 (2.03) | dt3 | −2.38 (3.47) | |
| t4 | 88.05 (2.88) | t4 | 87.16 (1.97) | dt4 | −0.89 (3.65) | |
Publisher’s Note: MDPI stays neutral with regard to jurisdictional claims in published maps and institutional affiliations. |
© 2022 by the authors. Licensee MDPI, Basel, Switzerland. This article is an open access article distributed under the terms and conditions of the Creative Commons Attribution (CC BY) license (https://creativecommons.org/licenses/by/4.0/).
Share and Cite
Burin, D.; Cavanna, G.; Rabellino, D.; Kotozaki, Y.; Kawashima, R. Neuroendocrine Response and State Anxiety Due to Psychosocial Stress Decrease after a Training with Subject’s Own (but Not Another) Virtual Body: An RCT Study. Int. J. Environ. Res. Public Health 2022, 19, 6340. https://0-doi-org.brum.beds.ac.uk/10.3390/ijerph19106340
Burin D, Cavanna G, Rabellino D, Kotozaki Y, Kawashima R. Neuroendocrine Response and State Anxiety Due to Psychosocial Stress Decrease after a Training with Subject’s Own (but Not Another) Virtual Body: An RCT Study. International Journal of Environmental Research and Public Health. 2022; 19(10):6340. https://0-doi-org.brum.beds.ac.uk/10.3390/ijerph19106340
Chicago/Turabian StyleBurin, Dalila, Gabriele Cavanna, Daniela Rabellino, Yuka Kotozaki, and Ryuta Kawashima. 2022. "Neuroendocrine Response and State Anxiety Due to Psychosocial Stress Decrease after a Training with Subject’s Own (but Not Another) Virtual Body: An RCT Study" International Journal of Environmental Research and Public Health 19, no. 10: 6340. https://0-doi-org.brum.beds.ac.uk/10.3390/ijerph19106340