
A Kinetic Model for Anaerobic Digestion and Biogas Production of Plant Biomass under High Salinity

 , and
, and
Abstract
:
1. Introduction
2. Materials and Methods
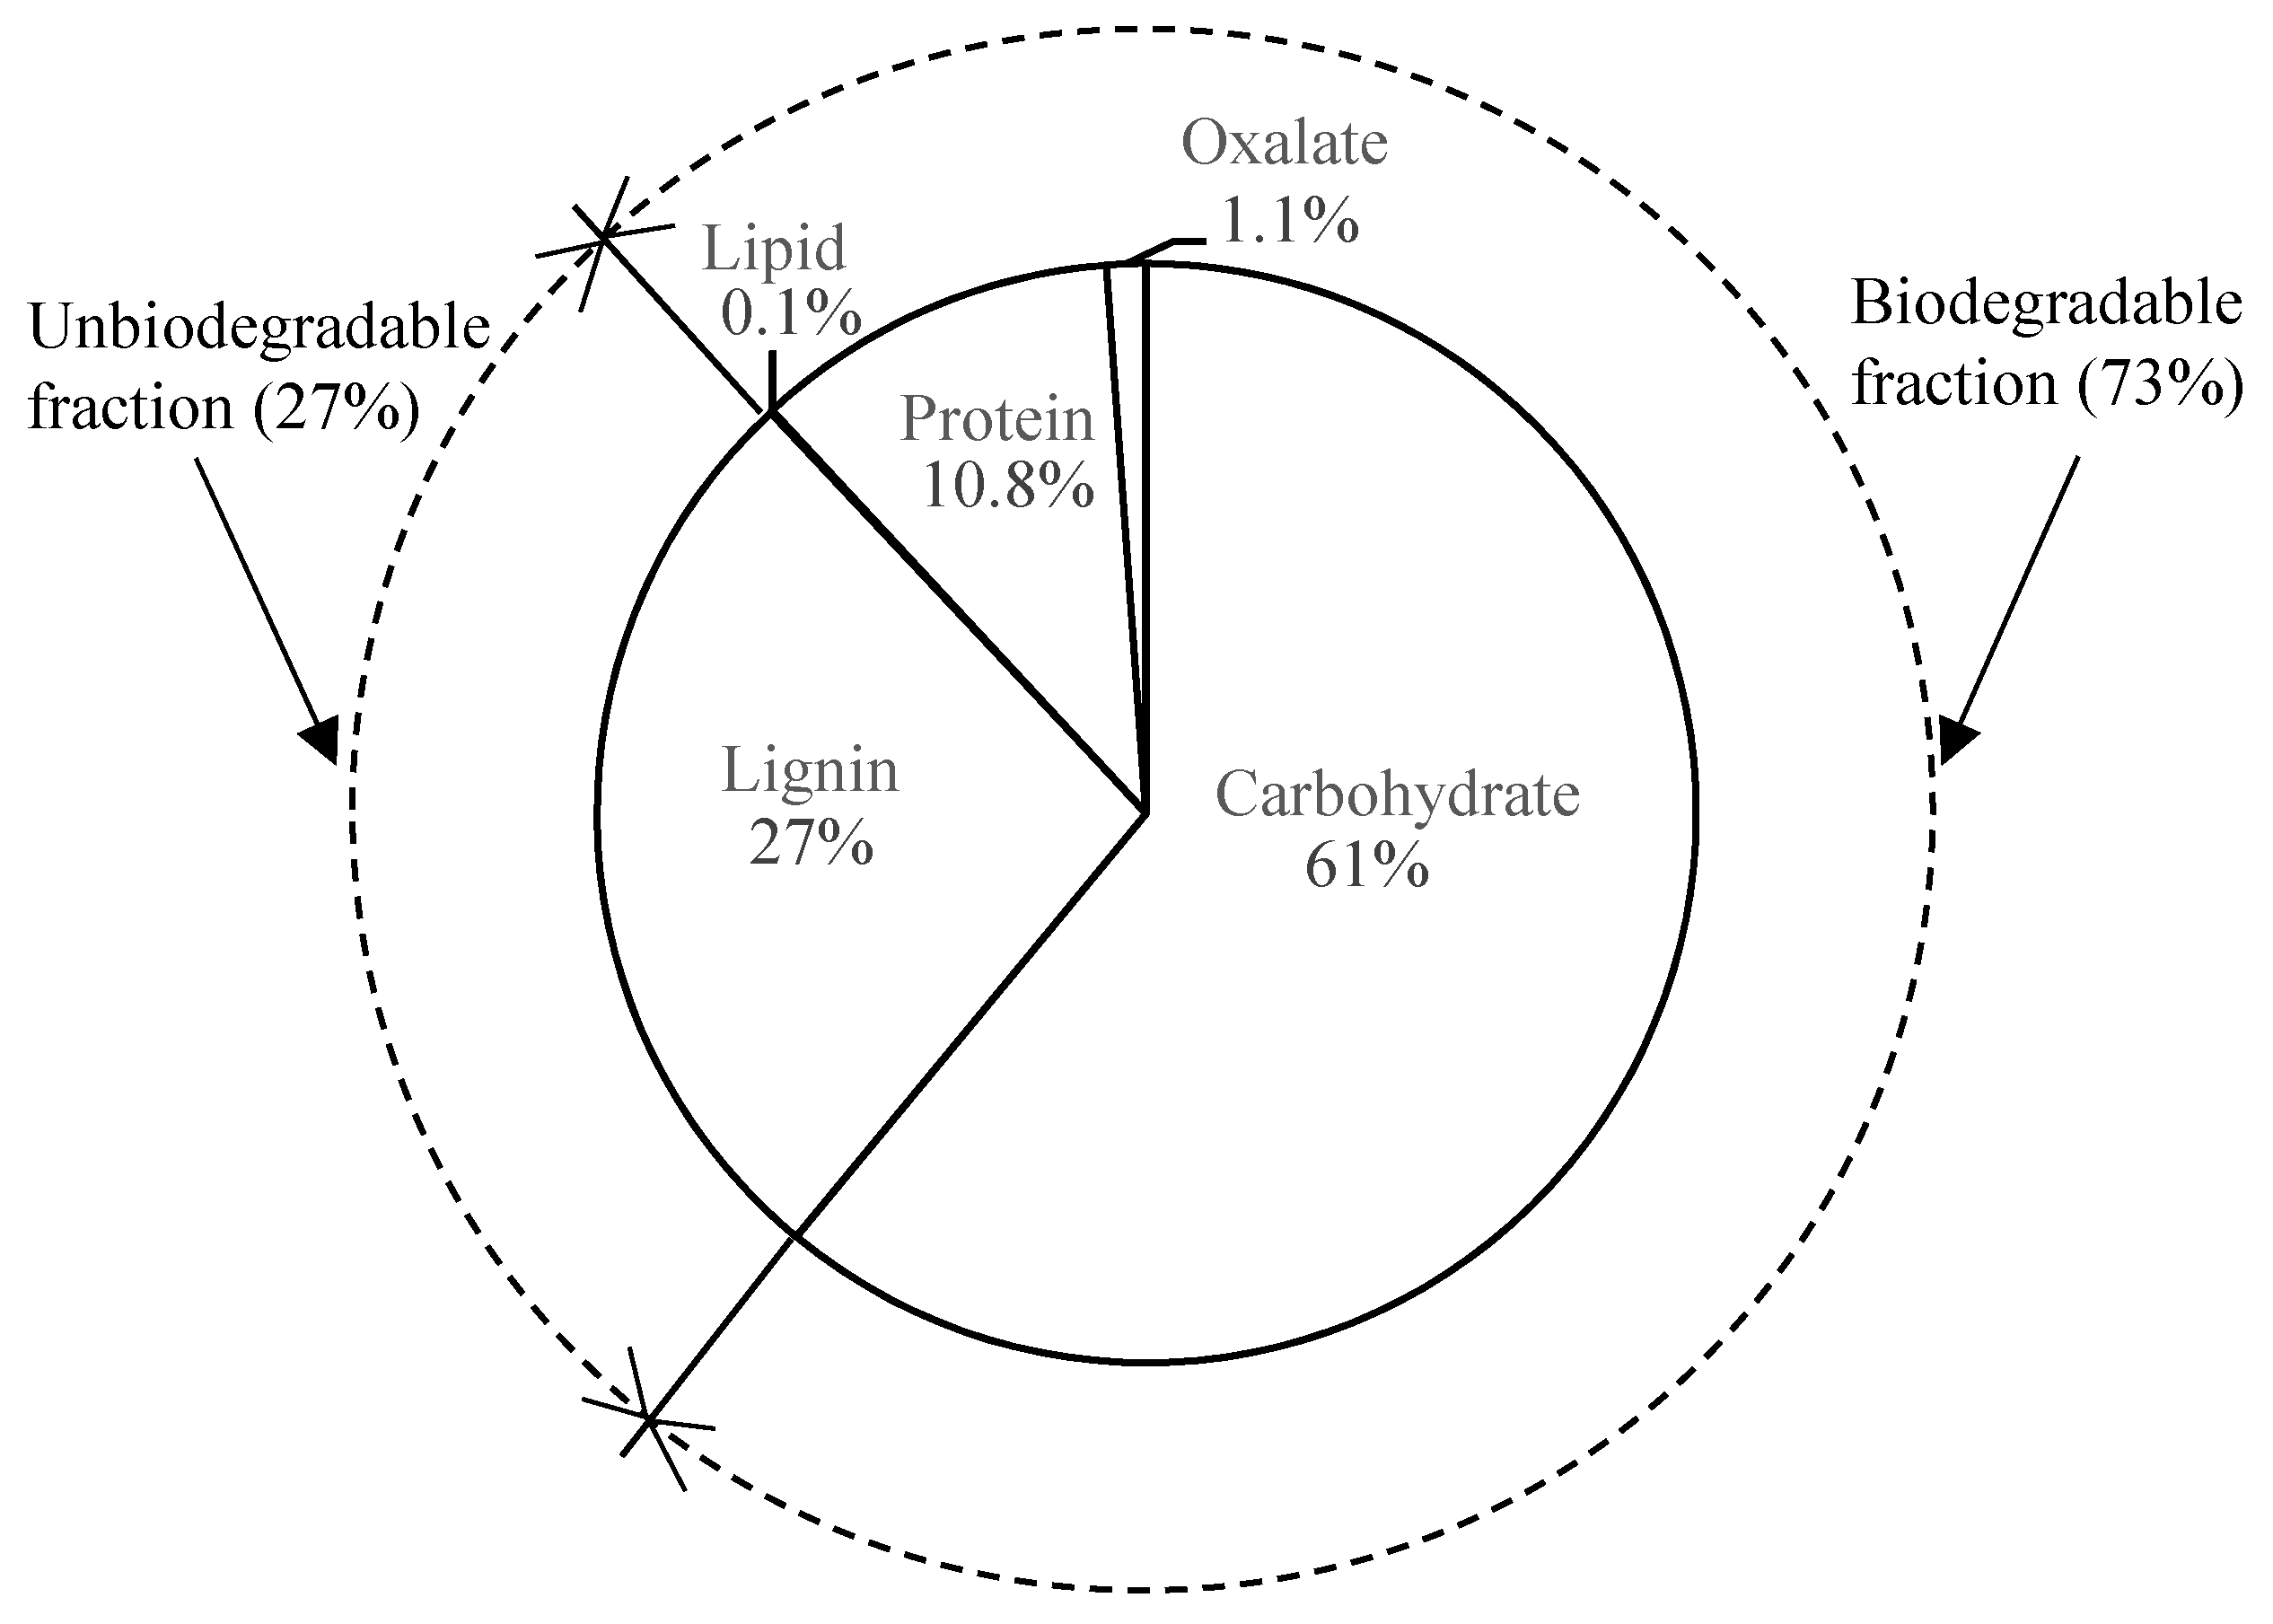
2.1. Dry Fodder Grass Biomass Components
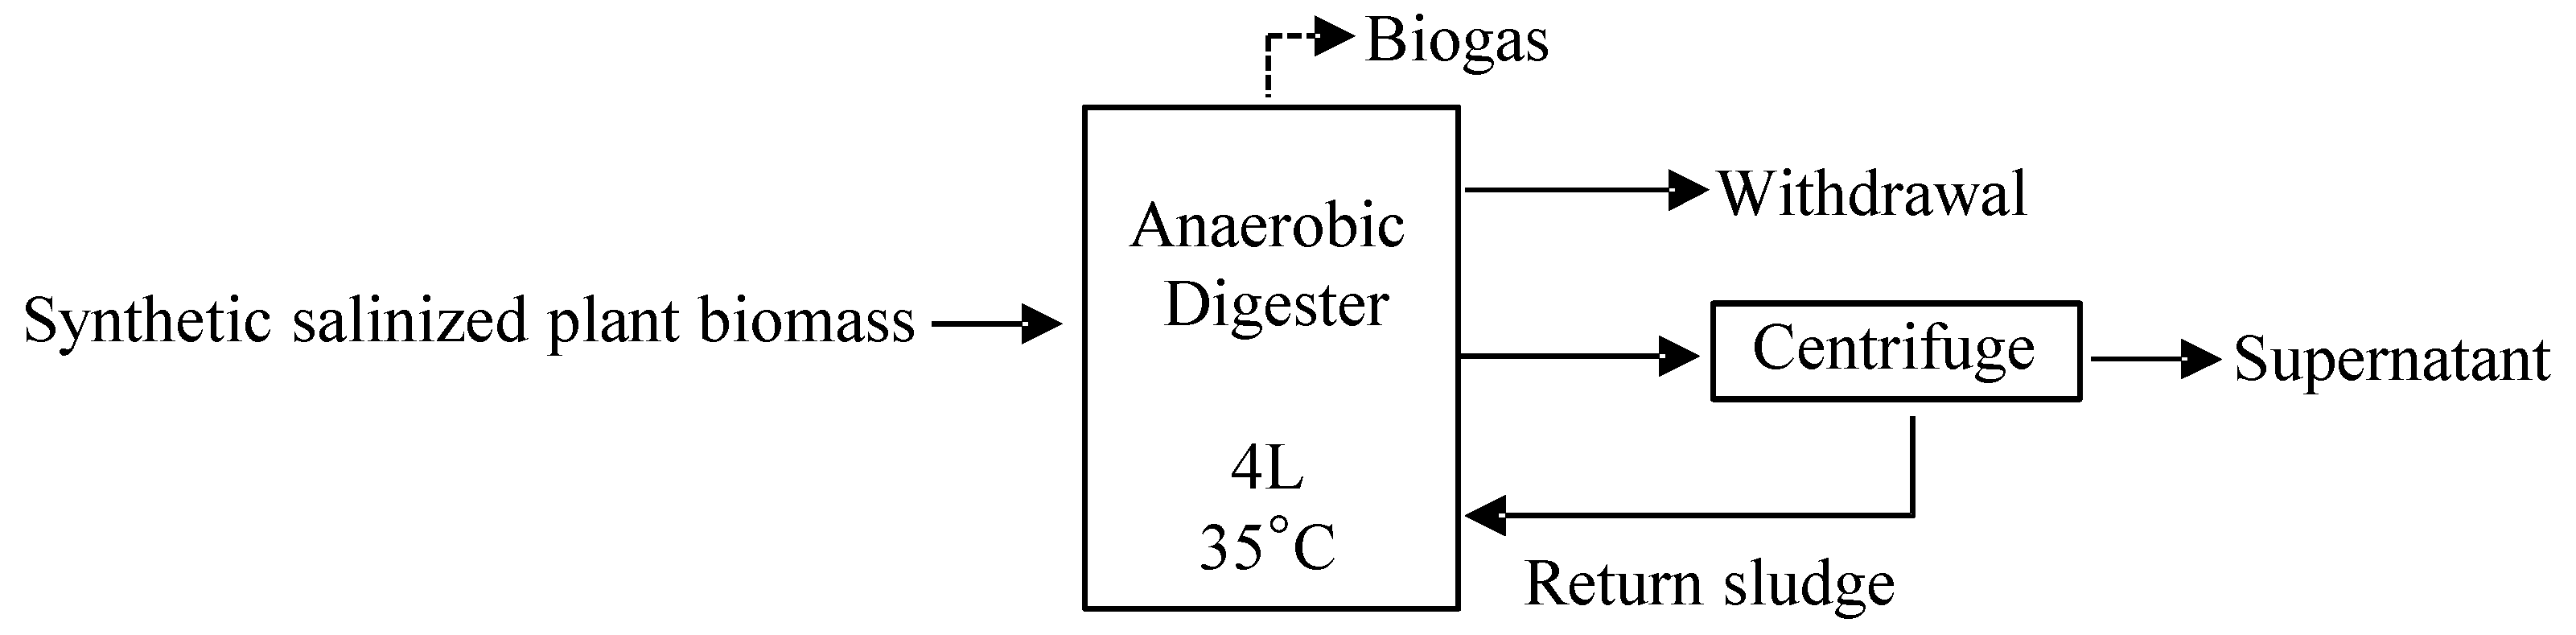
2.2. Continuous Experiment
2.3. Analytical Procedures
2.3.1. Anion Concentrations
2.3.2. Soluble Organic Concentrations
2.3.3. Continuous Operation (Regular Measurement and Calculation)
2.4. Dynamic Simulation
3. Results and Discussion
3.1. Continuous Experiment
3.1.1. Effect of High Salinity in the NaCl System
3.1.2. Competition of SBR in the Na2SO4–NaHCO3 System
3.2. Kinetic Parameter Estimation and Model Calibration
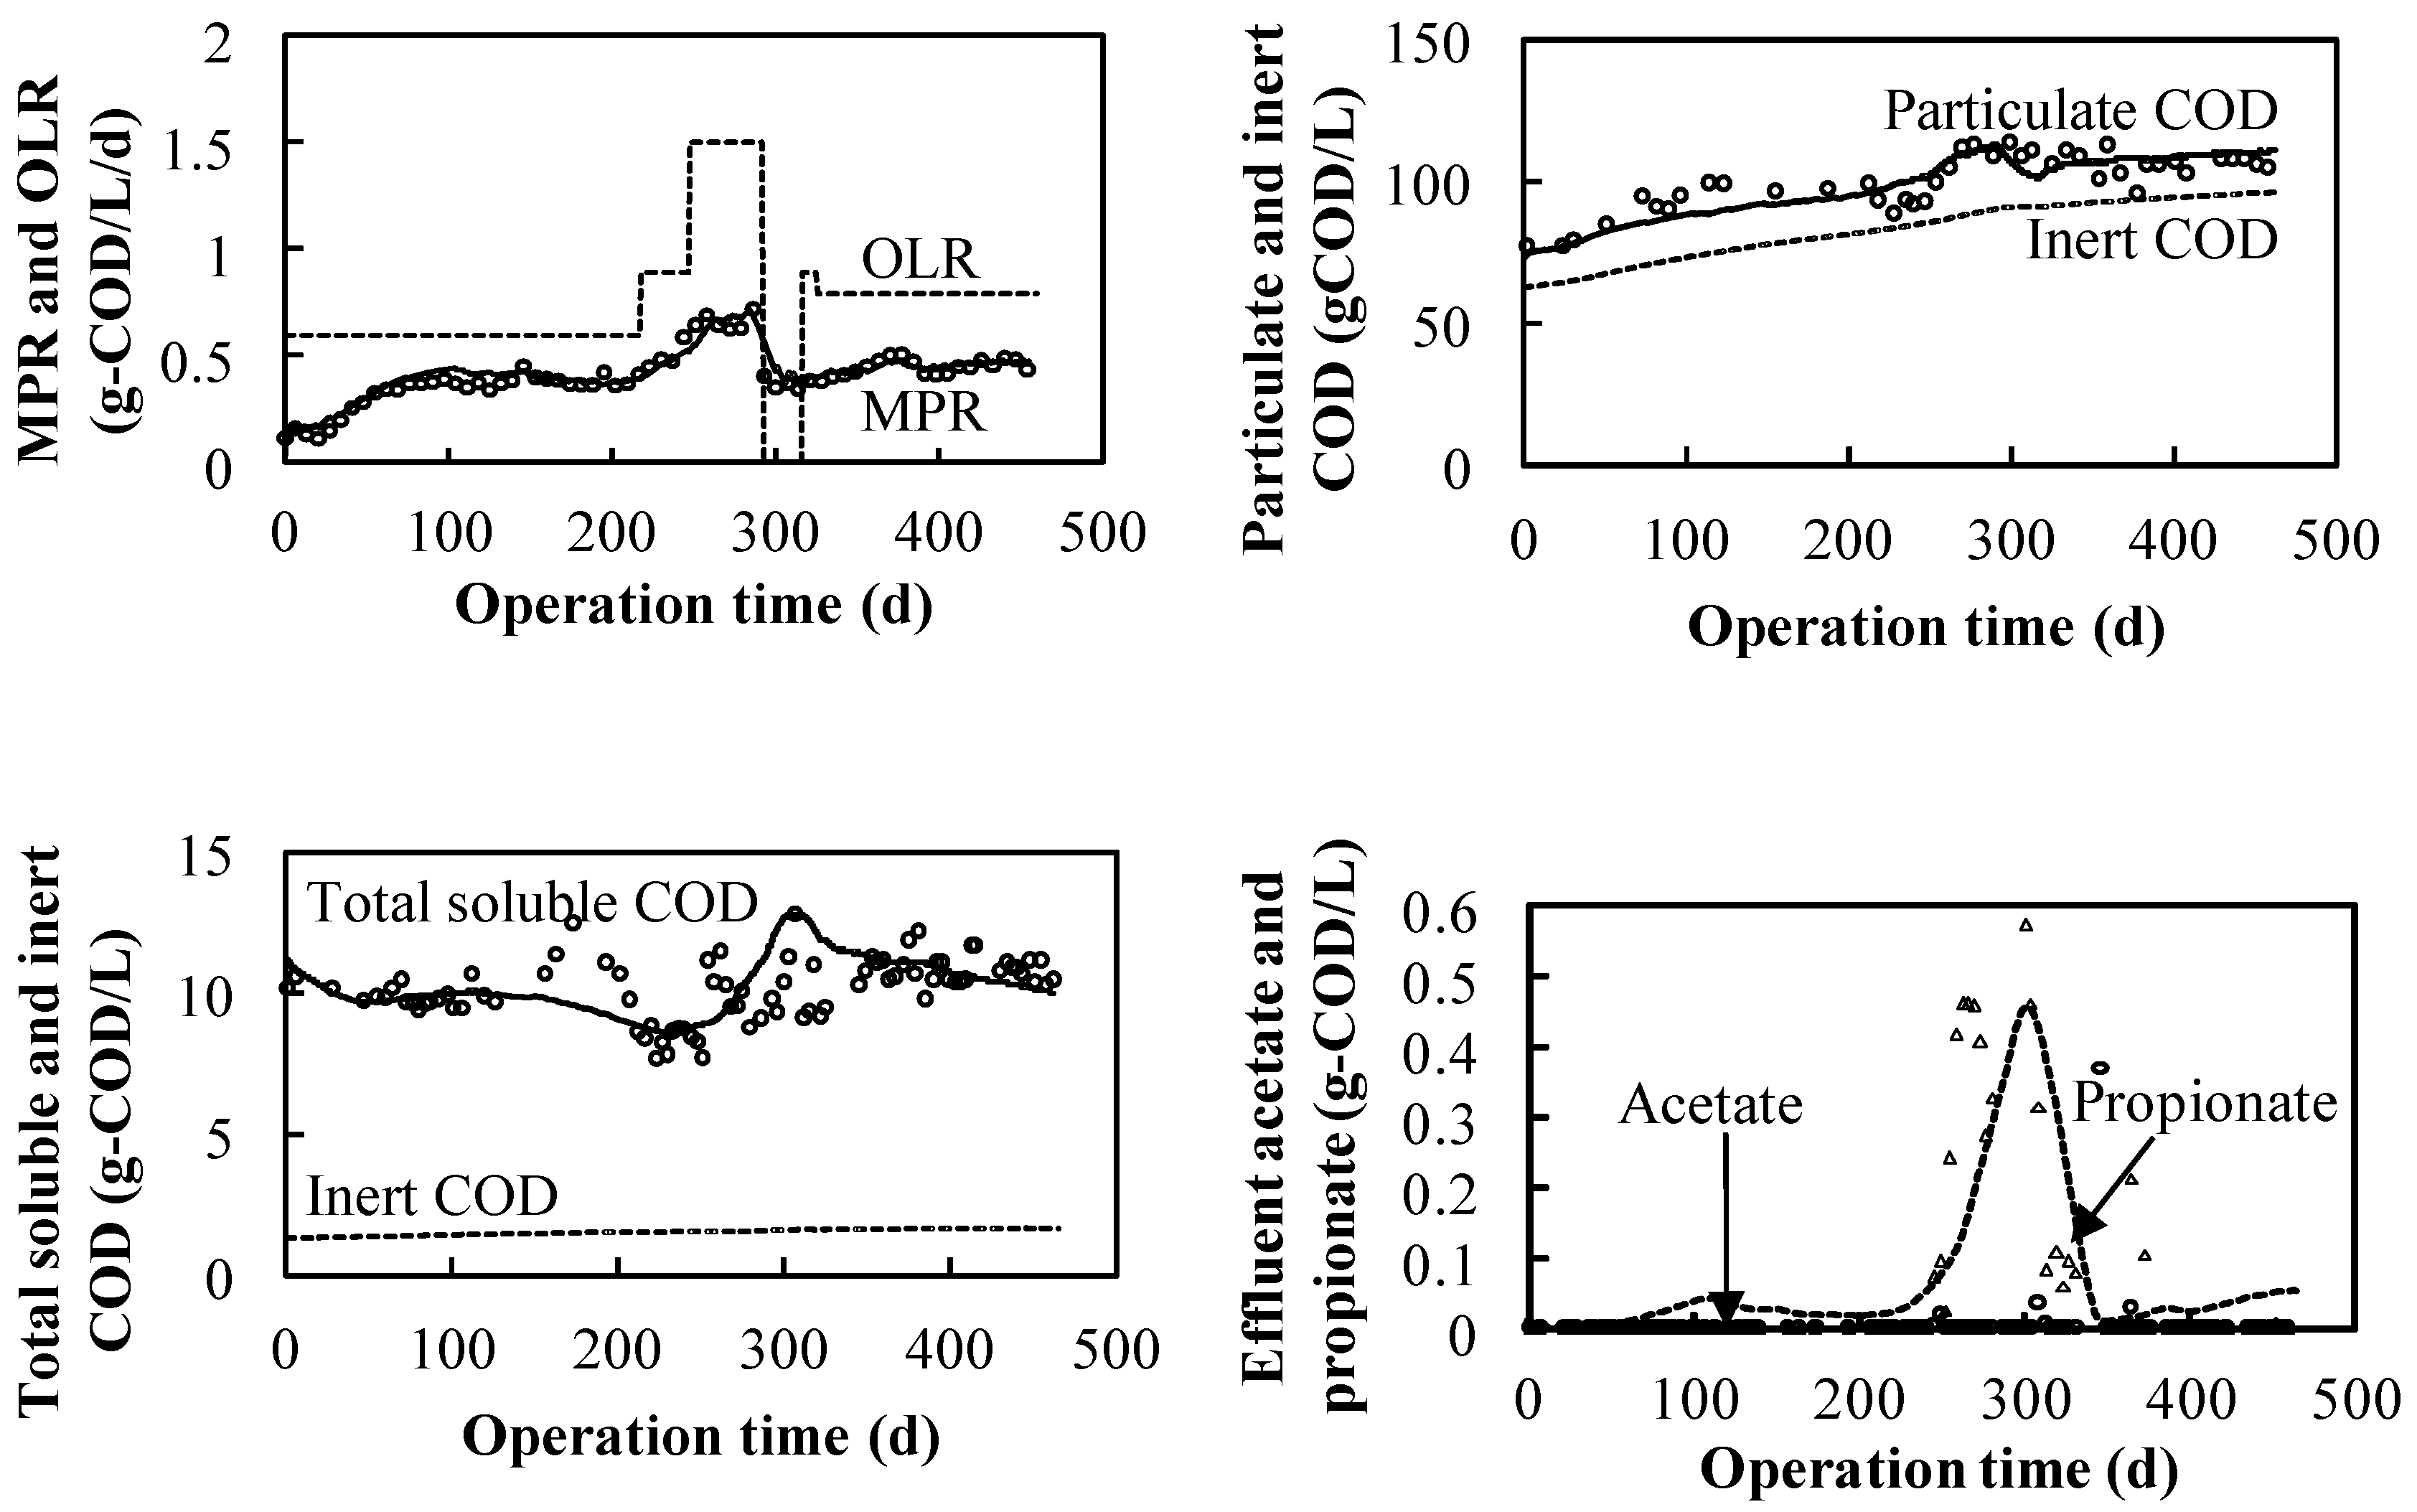
- Methane production could be conducted under high salinity within a proper OLR;
- VFA accumulation (especially propionate) occurs over a certain OLR;
- The kinetics values under the salinity condition were smaller than the default values owing to the high sensitivity of the biomass characteristics, which are different from the ordinary ones.
3.3. Simulation Results and Model Verification
4. Conclusions
- The plant biomass under the 35.8 g-Na+·L−1 condition could be degraded in the anaerobic digestion reactor;
- The hydrolysis rate and maximum uptake rate in each step of NaCl and Na2SO4–NaHCO3 system anaerobic digestion were smaller than the default values owing to the species difference; the propionate uptake was a limited step for degradation in the NaCl system;
- A threshold propionate inhibition function with a power factor was developed on the propionate, acetate, and hydrogen degrader operating in the growth stage;
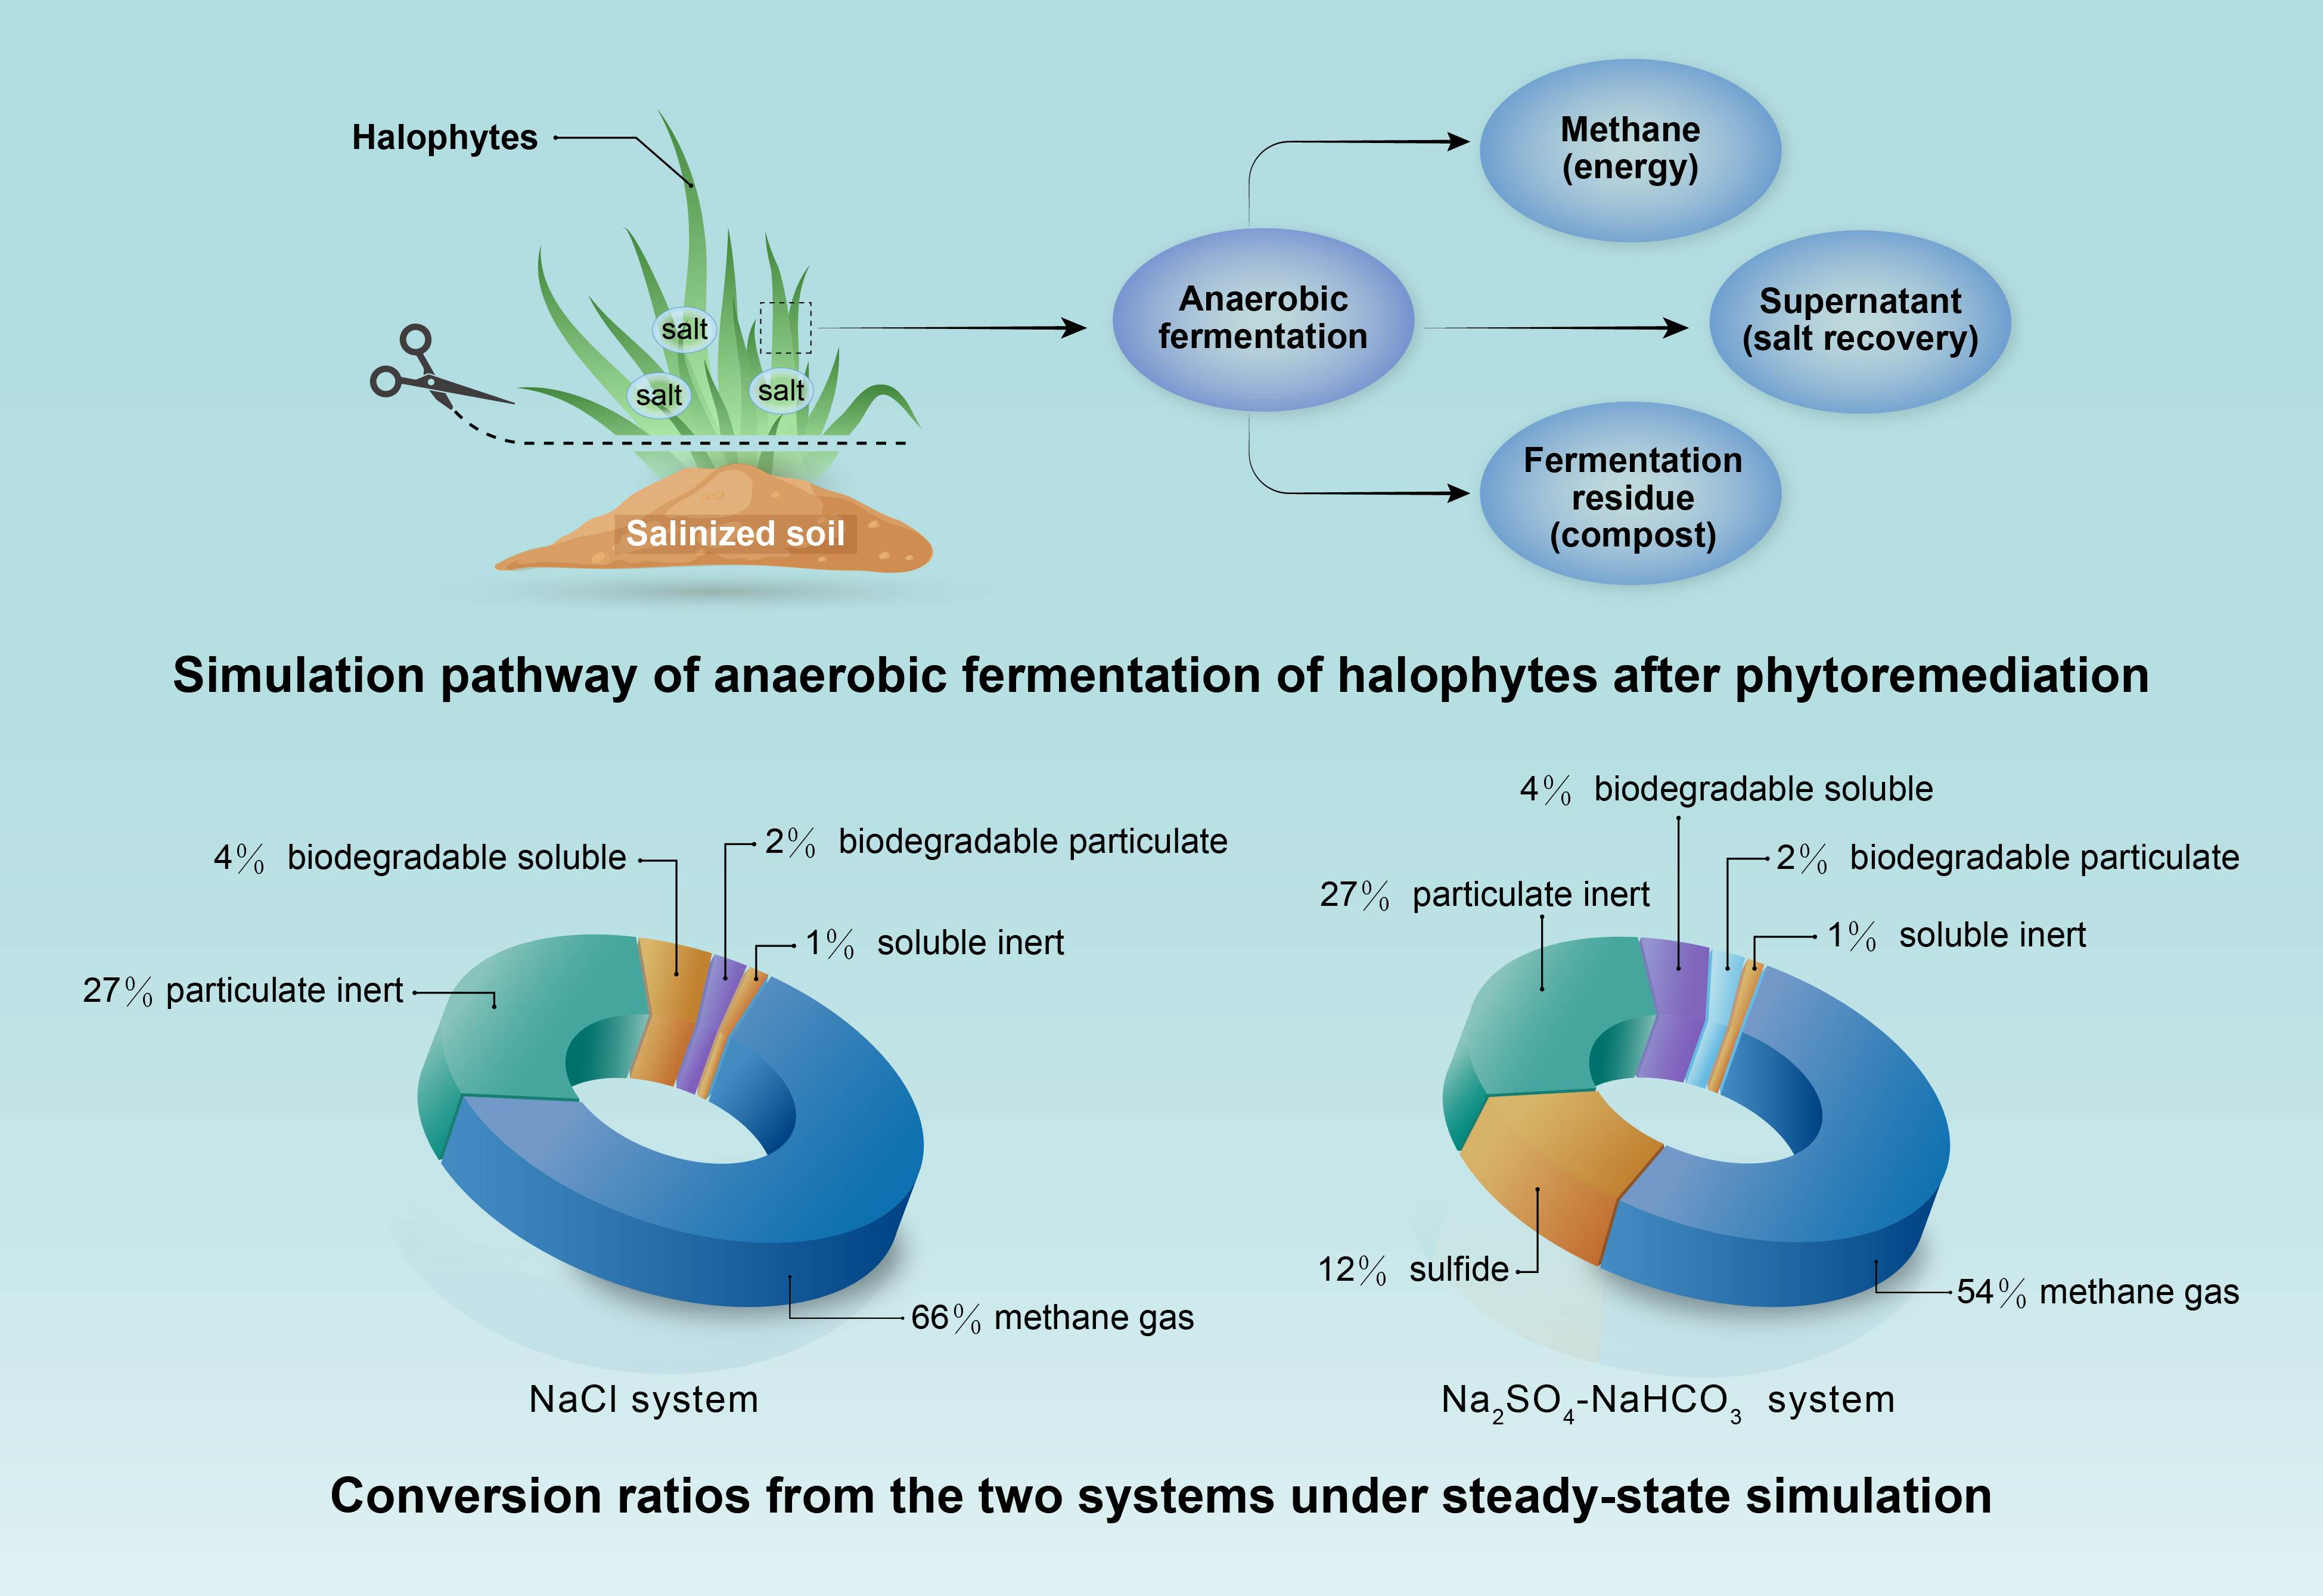
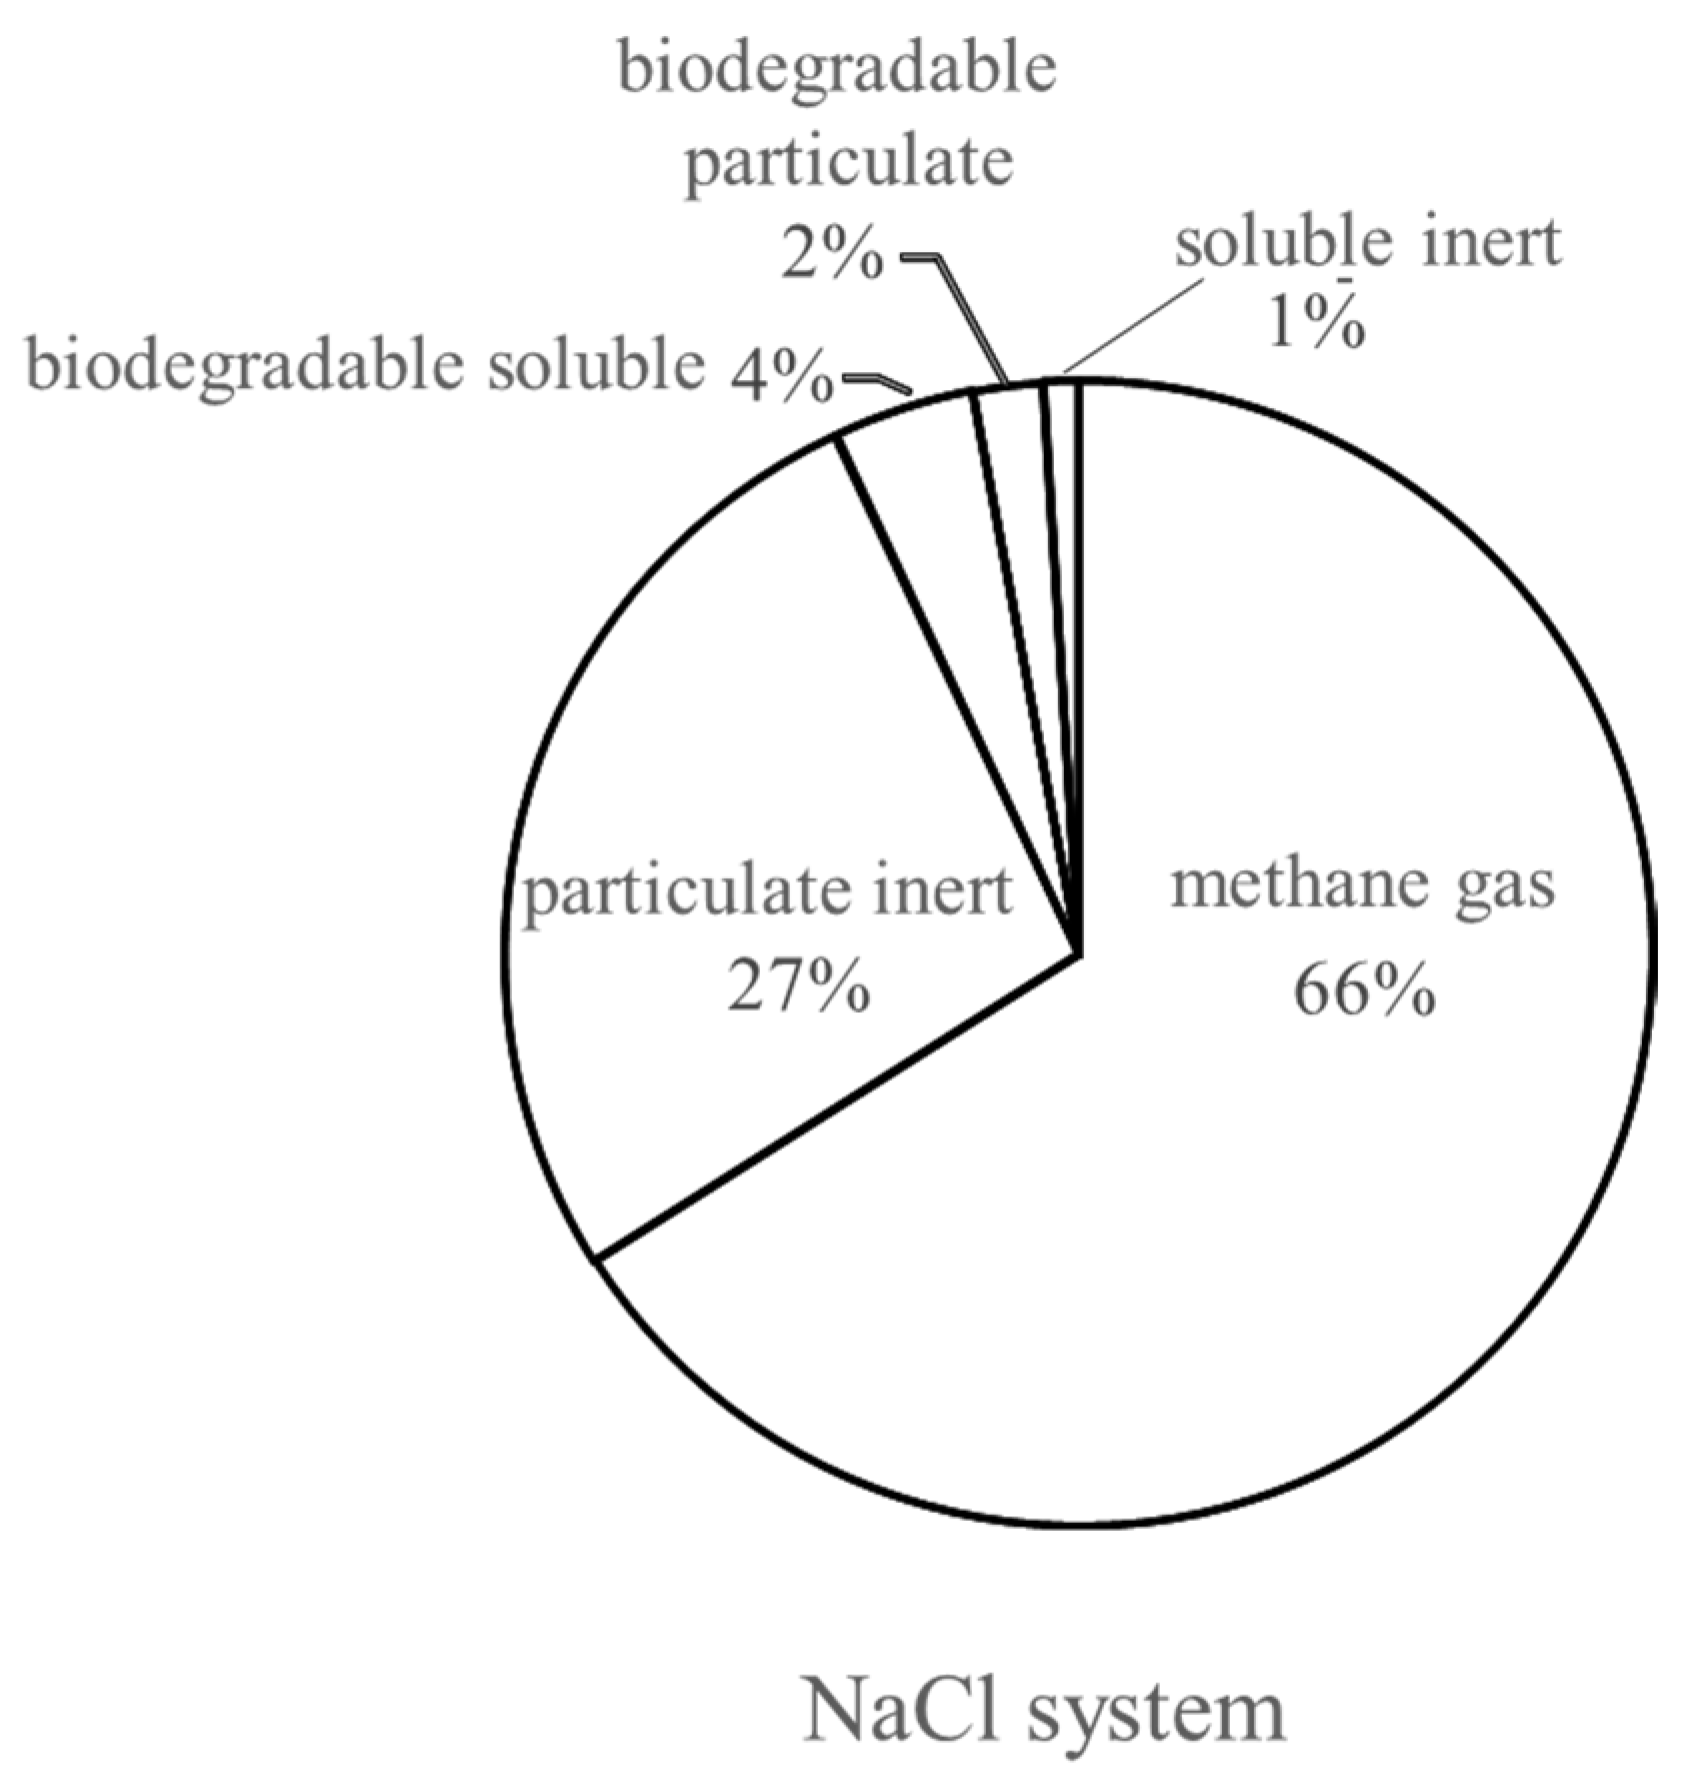
- In the NaCl system, 66% of the fed COD was degraded; this provides a biological post-treatment method for synthetic halophytes from phytoremediation;
- For the anaerobic digestion process in the Na2SO4–NaHCO3 system, 54% of the fed COD was converted into methane and another 12% was observed to be sulfide due to SRB.
Author Contributions
Funding
Institutional Review Board Statement
Informed Consent Statement
Data Availability Statement
Conflicts of Interest
Nomenclature
| Symbol | Definition | Units |
| bbiomass | Decay coefficient for biomass | d−1 |
| F | First-order type | |
| I | Inhibition function | |
| kprocess | First-order parameter | d−1 |
| km | Monod maximum specific uptake rate | kgCOD_S·kgCOD·_XB−1·d−1 |
| KI | Inhibition constant | kgCOD·m−3 |
| KS | Monod half-saturation coefficient | kgCOD·m−3 |
| M | Monod-type | |
| S | Concentration of substrate | kgCOD·m−3 |
| Si | Soluble component i | kgCOD·m−3 |
| SIi | Inhibitory component i | kgCOD·m−3 |
| t | Time | d (day) |
| T | Temperature | °C |
| DOC | Dissolved organic carbon | mgC·L−1 |
| TOC | Soluble total organic carbon | mgC·L−1 |
| XB | Concentration of biomass | kgCOD·m−3 |
| Xi | Concentration of particulate component i | kgCOD·m−3 |
| Ysubstrate | Yield of biomass on substrate | kgCOD_X·kgCOD_S−1 |
| fproduct, substrate | Yield (catabolism only) of product on substrate | kgCOD·kgCOD−1 |
| ρj | Kinetic rate for process j | kgCOD·m−3·d−1 |
References
- Keyser, D.; Khabibullayev, A.; Moustafaev, V. Research for rehabilitating the Aral Sea region. Nat. Res. 1999, 35, 26–37. [Google Scholar]
- Usmanova, R.M. Aral Sea and sustainable development. Water Sci. Technol. 2003, 47, 41–47. [Google Scholar] [CrossRef] [PubMed]
- Kitamura, Y.; Yano, T.; Honna, T.; Yamamoto, S.; Inosako, K. Causes of farmland salinization and remedial measures in the Aral Sea basin—Research on water management to prevent secondary salinization in rice-based cropping system in arid land. Agr. Water Manag. 2006, 85, 1–14. [Google Scholar] [CrossRef]
- Singh, A. Soil salinization and waterlogging: A threat to environment and agricultural sustainability. Ecol. Indic. 2015, 57, 128–130. [Google Scholar] [CrossRef]
- Akinshina, N.; Toderich, K.; Azizov, A.; Saito, L.; Ismail, S. Halophyte Biomass: A Promising Source of Renewable Energy. J. Arid Land. 2014, 24, 231–235. Available online: https://www.researchgate.net/publication/272350894 (accessed on 8 May 2022).
- Glenn, E.P.; Brown, J.J.; Blumwald, E. Salt tolerance and crop potential of halophytes. Crit. Rev. Plant. Sci. 1999, 18, 227–255. Available online: https://www.researchgate.net/publication/254217988 (accessed on 8 May 2022). [CrossRef]
- Lu, D.; Zhang, M.; Wang, S.; Cai, J.; Zhou, X.; Zhu, C. Nutritional characterization and changes in quality of Salicornia bigelovii Torr. during storage. LWT-Food Sci. Technol. 2010, 43, 519–524. [Google Scholar] [CrossRef]
- Khan, M.A.; Ungar, I.A.; Showalter, A.M. The effect of salinity on the growth, water status, and ion content of a leaf succulent perennial halophyte, Suaeda fruticosa (L.) Forssk. J. Arid Environ. 2000, 45, 73–84. [Google Scholar] [CrossRef] [Green Version]
- Koyro, H.-W.; Hussain, T.; Huchzermeyer, B.; Khan, M.A. Photosynthetic and growth responses of a perennial halophytic grass Panicum turgidum to increasing NaCl concentrations. Environ. Exp. Bot. 2013, 91, 22–29. [Google Scholar] [CrossRef]
- Akinshina, N. Anaerobic degradation of halophyte biomass for biogas production. J. Arid Land Stu. 2012, 22, 227–230. Available online: https://www.researchgate.net/profile/Natalya-Akinshina/publication/256842490 (accessed on 8 May 2022).
- Akinshina, N.; Azizov, A.; Karasyova, T.; Klose, E. On the issue of halophytes as energy plants in saline environment. Biomass Bioenerg. 2016, 91, 306–311. [Google Scholar] [CrossRef]
- Cecchi, F.; Cavinato, C. Smart Approaches to Food Waste Final Disposal. Int. J. Environ. Res. Public Health 2019, 16, 2860. [Google Scholar] [CrossRef] [PubMed] [Green Version]
- Koch, K.; Lübken, M.; Gehring, T.; Wichern, M.; Horn, H. Biogas from grass silage–measurements and modeling with ADM1. Bioresour. Technol. 2010, 101, 8158–8165. [Google Scholar] [CrossRef] [PubMed]
- Triolo, J.M.; Sommer, S.G.; Møller, H.B.; Weisbjerg, M.R.; Jiang, X.Y. A new algorithm to characterize biodegradability of biomass during anaerobic digestion: Influence of lignin concentration on methane production potential. Bioresour. Technol. 2011, 102, 9395–9402. [Google Scholar] [CrossRef]
- Kang, J.; Kim, K.; Oh, G.; Rhee, S. Analysis on biochemical methane potential of agricultural byproducts with different types of silage storage. J. Mater. Cycles Waste Manag. 2013, 16, 468–474. [Google Scholar] [CrossRef]
- Chukwuma, O.B.; Rafatullah, M.; Tajarudin, H.A.; Ismail, N. A Review on Bacterial Contribution to Lignocellulose Breakdown into Useful Bio-Products. Int. J. Environ. Res. Public Health 2021, 18, 6001. [Google Scholar] [CrossRef]
- Ward, A.; Lewis, D. Pre-treatment options for halophytic microalgae and associated methane production. Bioresour. Technol. 2015, 177, 410–413. [Google Scholar] [CrossRef]
- Batstone, D.J.; Keller, J.; Angelidaki, I.; Kalyuzhnyi, S.V.; Pavlostathis, S.G.; Rozzi, A.W.; Sanders, T.M.; Siegrist, H.; Vavilin, V.A. The IWA anaerobic digestion model no 1 (ADM1). Water Sci. Technol. 2002, 45, 65–73. [Google Scholar] [CrossRef]
- Batstone, D.J. Mathematical modelling of anaerobic reactors treating domestic wastewater: Rational criteria for model use. Rev. Environ. Sci. Bio/Technol. 2006, 5, 57–71. [Google Scholar] [CrossRef]
- Knobel, A.N.; Lewis, A.E. A mathematical model of a high sulphate wastewater anaerobic treatment system. Water Res. 2002, 36, 257–265. [Google Scholar] [CrossRef] [Green Version]
- Kalyuzhnyi, S.V.; Fedorovich, V.V. Mathematical modelling of competition between sulphate reduction and methanogenesis in anaerobic reactors. Bioresour. Technol. 1998, 65, 227–242. [Google Scholar] [CrossRef]
- Poinapen, J.; Ekama, G.A. Biological sulphate reduction with primary sewage sludge in an upflow anaerobic sludge bed reactor-Part 6: Development of a kinetic model for BSR. Water Sa 2010, 36, 203–214. Available online: https://www.researchgate.net/publication/262548567 (accessed on 8 May 2022).
- Fernandez-Palacios, E.; Zhou, X.; Mora, M.; Gabriel, D. Microbial Diversity Dynamics in a Methanogenic-Sulfidogenic UASB Reactor. Int. J. Environ. Res. Public Health 2021, 18, 1305. [Google Scholar] [CrossRef]
- Oremland, R.S.; Polcin, S. Methanogenesis and sulfate reduction: Competitive and noncompetitive substrates in estuarine sediments. Appl. Environ. Microbiol. 1982, 44, 1270–1276. Available online: https://0-www-ncbi-nlm-nih-gov.brum.beds.ac.uk/pmc/articles/PMC242184/pdf/aem00181-0032.pdf (accessed on 8 May 2022). [CrossRef] [PubMed] [Green Version]
- Widdel, F. Microbiology and ecology of sulfate-and sulfur-reducing bacteria. Biol. Anaerob. Microorg. 1988, 469–585. [Google Scholar]
- Smith, D.W. Ecological Actions of Sulfate-Reducing Bacteria. In The Sulfate-Reducing Bacteria: Contemporary Perspectives (EB/OL); Odom, J.M., Singleton, R., Eds.; Springer: New York, NY, USA, 1993; pp. 161–188. Available online: https://0-link-springer-com.brum.beds.ac.uk/chapter/10.1007/978-1-4613-9263-7_7 (accessed on 8 May 2022).
- Winfrey, M.R.; Ward, D.M. Substrates for sulfate reduction and methane production in intertidal sediments. Appl. Environ. Microbiol. 1983, 45, 193–199. [Google Scholar] [CrossRef] [Green Version]
- Dubois, M.; Gilles, K.A.; Hamilton, J.K.; Rebers, P.A.; Smith, F. Colorimetric method for determination of sugars and related substances. Anal. Chem. 1956, 28, 350–356. [Google Scholar] [CrossRef]
- APHA; AWWA; WEF. Standard Methods for the Examination of Water and Wastewater, 22nd ed.; American Public Health Association: Washington, DC, USA, 2012; pp. 1–1496. [Google Scholar]
- Lowry, O.H.; Rosebrough, N.J.; Farr, A.L.; Randall, R.J. Protein measurement with the Folin phenol reagent. J. Biol. Chem. 1951, 193, 265–275. [Google Scholar] [CrossRef]
- King, H.H.; Avni, E.; Coughlin, R.W.; Solomon, P.R. Modeling tar composition in lignin pyrolysis. In Proceedings of the 186. National Meeting of the American Chemical Society, Washington, DC, USA, 28 August 1983. [Google Scholar]
- Chen, H.; Wu, J.; Liu, B.; Li, Y.Y.; Yasui, H. Competitive dynamics of anaerobes during long-term biological sulfate reduction process in a UASB reactor. Bioresour. Technol. 2019, 280, 173–182. [Google Scholar] [CrossRef]
- Soto, M.; Méndez, R.; Lema, J.M. Sodium inhibition and sulphate reduction in the anaerobic treatment of mussel processing wastewaters. J. Chem. Technol. Biot. 1993, 58, 1–7. [Google Scholar] [CrossRef]
- Feijoo, G.; Vidal, G.; Moreira, M.T.; Méndez, R.; Lema, J.M. Degradation of high molecular weight compounds of kraft pulp mill effluents by a combined treatment with fungi and bacteria. Biotechnol. Lett. 1995, 17, 1261–1266. [Google Scholar] [CrossRef]
- Wichern, M.; Gehring, T.; Fischer, K.; Andrade, D.; Lübken, M.; Koch, K.; Gronauer, A.; Horn, H. Monofermentation of grass silage under mesophilic conditions: Measurements and mathematical modeling with ADM 1. Bioresour. Technol. 2009, 100, 1675–1681. [Google Scholar] [CrossRef]
- Biernacki, P.; Steinigeweg, S.; Borchert, A.; Uhlenhut, F. Application of Anaerobic Digestion Model No. 1 for describing anaerobic digestion of grass, maize, green weed silage, and industrial glycerine. Bioresour. Technol. 2013, 127, 188–194. [Google Scholar] [CrossRef]
- Tytła, M. The Effects of Ultrasonic Disintegration as a Function of Waste Activated Sludge Characteristics and Technical Conditions of Conducting the Process-Comprehensive Analysis. Int. J. Environ. Res. Public Health 2018, 15, 2311. [Google Scholar] [CrossRef] [PubMed] [Green Version]
- Mobarak-Qamsari, E.; Kermanshahi, R.K.; Nosrati, M.; Amani, T. Enzymatic Pre-Hydrolysis of high fat Content Dairy Wastewater as a Pretreatment for Anaerobic Digestion. Int. J. Environ. Res. 2012, 6, 475–480. Available online: https://journal.ut.ac.ir/article_516_cd06d04019b269bbb8a094e5867e2930.pdf (accessed on 8 May 2022).
- Lübken, M.; Wichern, M.; Schlattmann, M.; Gronauer, A.; Horn, H. Modelling the energy balance of an anaerobic digester fed with cattle manure and renewable energy crops. Water Res. 2007, 4, 4085–4096. [Google Scholar] [CrossRef]
- Thamsiriroj, T.; Murphy, J.D. Modelling mono-digestion of grass silage in a 2-stage CSTR anaerobic digester using ADM1. Bioresour. Technol. 2011, 102, 948–959. [Google Scholar] [CrossRef]
- Zhang, C.; Wang, F.; Pei, M.; Qiu, L.; Yao, Y. Performance of Anaerobic Digestion of Chicken Manure Under Gradually Elevated Organic Loading Rates. Int. J. Environ. Res. Public Health 2019, 16, 2239. [Google Scholar] [CrossRef] [Green Version]


| NaCl System | Na2SO4–Na2CO3 System | Na2SO4–Na2CO3 System (After Reaction) | Unit | |
|---|---|---|---|---|
| Na+ | 35.83 | 27.6 | 27.6 | g-Na·L−1 |
| NaCl | 70 | - | 56 | mg·g−1 |
| Na2SO4 | - | 34.84 | - | mg·g−1 |
| NaHCO3 | - | 31.52 | - | mg·g−1 |
| FeCl2⋅4H2O | - | 54.18 | 5.96 | mg·g−1 |
| H2O | 765.73 | 721.45 | 761.19 | mg·g−1 |
| Osmotic pressure | 80.72 | - | 62.66 | atm |
| Grass | 158 | 158 | 158 | g-COD·L−1 |
| r | Component (i)→ | 1 | 2 | 3 | 4 | 5 | 6 | 7 | 8 | 9 | 10 | 11 | 12 | 13 | Rate (ρj) Type | |
|---|---|---|---|---|---|---|---|---|---|---|---|---|---|---|---|---|
| Process (j) ↓ | Unit | Ssu | Saa | Sfa | Sva | Sbu | Spro | Sac | Sox | Sh2 | Sch4 | Sh2s | SSO4 | SI | ||
| 1 | Disintegration | mgCOD·L−1·d−1 | fSI,xc | F | ||||||||||||
| 2 | Hydrolysis of carbohydrates | mgCOD·L−1·d−1 | 1 | F | ||||||||||||
| 3 | Hydrolysis of proteins | mgCOD·L−1·d−1 | 1 | F | ||||||||||||
| 4 | Hydrolysis of lipids | mgCOD·L−1·d−1 | 1 − ffa,li | ffa,li | F | |||||||||||
| 5 | Uptake of oxalate | mgCOD·L−1·d−1 | −1 | 1 | M | |||||||||||
| 6 | Uptake of monosaccharide | mgCOD·L−1·d−1 | −1 | (1 − Ysu) × fbu,su1 | (1 − Ysu) × fpro,su1 | (1 − Ysu) × fac,su1 | (1 − Ysu) × fh2,su1 | M | ||||||||
| 7 | Uptake of amino acids | mgCOD·L−1·d−1 | −1 | (1 − Yaa) × fva,aa1 | (1 − Yaa) × fbu,aa1 | (1 − Yaa) × fpro,aa1 | (1 − Yaa) × fac,aa1 | (1 − Yaa) × fh2,aa1 | M | |||||||
| 8 | Uptake of LCFA | mgCOD·L−1·d−1 | −1 | (1 − Yfa) × 0.7 | (1 − Yfa) × 0.3 | M | ||||||||||
| 9 | Uptake of valerate | mgCOD·L−1·d−1 | −1 | (1 − Yc4) × 0.54 | (1 − Yc4) × 0.31 | (1 − Yc4) × 0.15 | M | |||||||||
| 10 | Uptake of butyrate | mgCOD·L−1·d−1 | −1 | (1 − Yc4) × 0.8 | (1 − Yc4) × 0.2 | M | ||||||||||
| 11 | Uptake of propionate | mgCOD·L−1·d−1 | −1 | (1 − Ypro) × 0.57 | (1 − Ypro) × 0.43 | M∙I | ||||||||||
| 12 | Uptake of acetate | mgCOD·L−1·d−1 | −1 | 1 − Yac | M∙I | |||||||||||
| 13 | Uptake of hydrogen | mgCOD·L−1·d−1 | −1 | 1 − Yh2 | M∙I | |||||||||||
| 14 | Uptake of monosaccharide by SRB | mgCOD·L−1·d−1 | −1 | (1 − YmSBR) × fbu,su2 | (1 − YmSBR) × fpro,su2 | (1 − YmSBR) × fac,su2 | (1 − YmSRB) × fh2s,su/64 | −(1 − YmSRB) × fh2s,su/64 | M | |||||||
| 15 | Uptake of amino acid by SRB | mgCOD·L−1·d−1 | −1 | (1 − YaaSRB) × fva,aa2 | (1 − YaaSRB) × fbu,aa2 | (1 − YaaSRB) × fpro,aa2 | (1 − YaaSRB) × fac,aa2 | (1 − YaaSRB) × fh2s,aa/64 | −(1 − YaaSRB) × fh2s,aa/64 | M | ||||||
| 16 | Uptake of LCFA by SRB | mgCOD·L−1·d−1 | −1 | (1 − YLSRB) × fac,L | (1 − YLSRB) × (1 − fac,L)/64 | −(1 − YLSRB) × (1 − fac,L)/64 | M | |||||||||
| 17 | Uptake of valerate by SRB | mgCOD·L−1·d−1 | −1 | (1 − YvSRB) × 0.84 | (1 − YvSRB) × 0.16/64 | −(1 − YvSRB) × 0.16/64 | M | |||||||||
| 18 | Uptake of butyrate by SRB | mgCOD·L−1·d−1 | −1 | (1 − YbSRB) × 0.8 | (1 − YbSRB) × 0.2/64 | −(1 − YbSRB) × 0.2/64 | M | |||||||||
| 19 | Uptake of propionate by SRB | mgCOD·L−1·d−1 | −1 | (1 − YpSRB) × 0.57 | (1 − YpSRB) × 0.43/64 | −(1 − YpSRB) × 0.43/64 | M | |||||||||
| 20 | Uptake of acetate by SRB | mgCOD·L−1·d−1 | −1 | (1 − YaSRB)/64 | −(1 − YaSRB)/64 | M | ||||||||||
| 21 | Uptake of hydrogen by SRB | mgCOD·L−1·d−1 | −1 | (1 − YhSRB)/64 | −(1 − YhSRB)/64 | M | ||||||||||
| 22 | Decay of Xox | mgCOD·L−1·d−1 | F | |||||||||||||
| 23 | Decay of Xsu | mgCOD·L−1·d−1 | F | |||||||||||||
| 24 | Decay of Xaa | mgCOD·L−1·d−1 | F | |||||||||||||
| 25 | Decay of Xfa | mgCOD·L−1·d−1 | F | |||||||||||||
| 26 | Decay of Xc4 | mgCOD·L−1·d−1 | F | |||||||||||||
| 27 | Decay of Xpro | mgCOD·L−1·d−1 | F | |||||||||||||
| 28 | Decay of Xac | mgCOD·L−1·d−1 | F | |||||||||||||
| 29 | Decay of Xh2 | mgCOD·L−1·d−1 | F | |||||||||||||
| 30 | Decay of XmSRB | mgCOD·L−1·d−1 | F | |||||||||||||
| 31 | Decay of XaaSRB | mgCOD·L−1·d−1 | F | |||||||||||||
| 32 | Decay of XLSRB | mgCOD·L−1·d−1 | F | |||||||||||||
| 33 | Decay of XvSRB | mgCOD·L−1·d−1 | F | |||||||||||||
| 34 | Decay of XbSRB | mgCOD·L−1·d−1 | F | |||||||||||||
| 35 | Decay of XpSRB | mgCOD·L−1·d−1 | F | |||||||||||||
| 36 | Decay of XaSRB | mgCOD·L−1·d−1 | F | |||||||||||||
| 37 | Decay of XhSRB | mgCOD·L−1·d−1 | F | |||||||||||||
| Biomass Yield (gCOD·gCOD−1) Ysu = 0.18 Yaa = 0.18 Yfa = 0.06 Yc4 = 0.04 Ypro = 0.04 Yac = 0.05 Yh2 = 0.04 | Monosaccharides (kgCOD·m−3) | Amino acids (kgCOD·m−3) | Long-chain fatty acids (kgCOD·m−3) | Total valerate (kgCOD·m−3) | Total butyrate (kgCOD·m−3) | Total propionate (kgCOD·m−3) | Total acetate (kgCOD·m−3) | Oxalate (kgCOD·m−3) | Hydrogen gas (kgCOD·m−3) | Methane gas (kgCOD·m−3) | Hydrogen sulfide (kmol·m−3) | Total sulfates (kmol·m−3) | Soluble inerts (kgCOD·m−3) | |||
| r | Component (i)→ | 14 | 15 | 16 | 17 | 18 | 19 | 20 | 21 | 22 | 23 | 24 | 25 | 26 | 27 | 28 | 29 | 30 | 31 | 32 | 33 | 34 | Rate (ρj) Type | |
|---|---|---|---|---|---|---|---|---|---|---|---|---|---|---|---|---|---|---|---|---|---|---|---|---|
| Process (j)↓ | Unit | XC | Xch | Xpr | Xli | XI | Xox | Xsu | Xaa | Xfa | Xc4 | Xpro | Xac | Xh2 | XmSRB | XaaSRB | XLSRB | XvSRB | XbSRB | XpSRB | XaSRB | XhSRB | ||
| 1 | Disintegration | mgCOD·L−1·d−1 | −1 | fch,xc | fpr,xc | fli,xc | fXI,xc | F | ||||||||||||||||
| 2 | Hydrolysis of carbohydrates | mgCOD·L−1·d−1 | −1 | F | ||||||||||||||||||||
| 3 | Hydrolysis of proteins | mgCOD·L−1·d−1 | −1 | F | ||||||||||||||||||||
| 4 | Hydrolysis of lipids | mgCOD·L−1·d−1 | −1 | F | ||||||||||||||||||||
| 5 | Uptake of oxalate | mgCOD·L−1·d−1 | Yox | M | ||||||||||||||||||||
| 6 | Uptake of monosaccharide | mgCOD·L−1·d−1 | Ysu | M | ||||||||||||||||||||
| 7 | Uptake of amino acids | mgCOD·L−1·d−1 | Yaa | M | ||||||||||||||||||||
| 8 | Uptake of LCFA | mgCOD·L−1·d−1 | Yfa | M | ||||||||||||||||||||
| 9 | Uptake of valerate | mgCOD·L−1·d−1 | Yc4 | M | ||||||||||||||||||||
| 10 | Uptake of butyrate | mgCOD·L−1·d−1 | Yc4 | M | ||||||||||||||||||||
| 11 | Uptake of propionate | mgCOD·L−1·d−1 | Ypro | M | ||||||||||||||||||||
| 12 | Uptake of acetate | mgCOD·L−1·d−1 | Yac | M∙I | ||||||||||||||||||||
| 13 | Uptake of hydrogen | mgCOD·L−1·d−1 | Yh2 | M∙I | ||||||||||||||||||||
| 14 | Uptake of monosaccharide by SRB | mgCOD·L−1·d−1 | YmSRB | M∙I | ||||||||||||||||||||
| 15 | Uptake of amino acid by SRB | mgCOD·L−1·d−1 | YaaSRB | M | ||||||||||||||||||||
| 16 | Uptake of LCFA by SRB | mgCOD·L−1·d−1 | YLSRB | M | ||||||||||||||||||||
| 17 | Uptake of valerate by SRB | mgCOD·L−1·d−1 | YvSRB | M | ||||||||||||||||||||
| 18 | Uptake of butyrate by SRB | mgCOD·L−1·d−1 | YbSRB | M | ||||||||||||||||||||
| 19 | Uptake of propionate by SRB | mgCOD·L−1·d−1 | YpSRB | M | ||||||||||||||||||||
| 20 | Uptake of acetate by SRB | mgCOD·L−1·d−1 | YaSRB | M | ||||||||||||||||||||
| 21 | Uptake of hydrogen by SRB | mgCOD·L−1·d−1 | YhSRB | M | ||||||||||||||||||||
| 22 | Decay of Xox | mgCOD·L−1·d−1 | −1 | F | ||||||||||||||||||||
| 23 | Decay of Xsu | mgCOD·L−1·d−1 | 1 | −1 | F | |||||||||||||||||||
| 24 | Decay of Xaa | mgCOD·L−1·d−1 | 1 | −1 | F | |||||||||||||||||||
| 25 | Decay of Xfa | mgCOD·L−1·d−1 | 1 | −1 | F | |||||||||||||||||||
| 26 | Decay of Xc4 | mgCOD·L−1·d−1 | 1 | −1 | F | |||||||||||||||||||
| 27 | Decay of Xpro | mgCOD·L−1·d−1 | 1 | −1 | F | |||||||||||||||||||
| 28 | Decay of Xac | mgCOD·L−1·d−1 | 1 | −1 | F | |||||||||||||||||||
| 29 | Decay of Xh2 | mgCOD·L−1·d−1 | 1 | −1 | F | |||||||||||||||||||
| 30 | Decay of XmSRB | mgCOD·L−1·d−1 | 1 | −1 | F | |||||||||||||||||||
| 31 | Decay of XaaSRB | mgCOD·L−1·d−1 | 1 | −1 | F | |||||||||||||||||||
| 32 | Decay of XLSRB | mgCOD·L−1·d−1 | 1 | −1 | F | |||||||||||||||||||
| 33 | Decay of XvSRB | mgCOD·L−1·d−1 | 1 | −1 | F | |||||||||||||||||||
| 34 | Decay of XbSRB | mgCOD·L−1·d−1 | 1 | −1 | F | |||||||||||||||||||
| 35 | Decay of XpSRB | mgCOD·L−1·d−1 | 1 | −1 | F | |||||||||||||||||||
| 36 | Decay of XaSRB | mgCOD·L−1·d−1 | 1 | −1 | F | |||||||||||||||||||
| 37 | Decay of XhSRB | mgCOD·L−1·d−1 | 1 | −1 | F | |||||||||||||||||||
| fch,xc = 0.61 fh2,su = 0.33 fpr,xc = 0.11 fva,aa = 0.26 fli,xc = 0.01 fbu,aa = 0.27 fXI,xc = 0.27 fpro,aa = 0.07 fL,xc = 0.001 fac,aa = 0.33 fbu,su = 0 fh2,aa = 0.07 fpro,su =0 fac,L = 0.7 fpro,ac = 0.67 f values are same in SRB | Composites (kgCOD·m−3) | Carbohydrates (kgCOD·m−3) | Proteins (kgCOD·m−3) | Lipids (kgCOD·m−3) | Inert (kgCOD·m−3) | Oxalate degraders (kgCOD·m−3) | Sugar degraders (kgCOD·m−3) | Amino acid (kgCOD·m−3) | LCFA degraders (kgCOD·m−3) | Valerate and butyrate degraders (kgCOD·m−3) | Propionate degraders (kgCOD·m−3) | Acetate degraders (kgCOD·m−3) | Hydrogen degraders (kgCOD·m−3) | SRB from monosaccharide (kgCOD·m−3) | SRB from amino acid (kgCOD·m−3) | SRB from LCFA (kgCOD·m−3) | SRB from valerate (kgCOD·m−3) | SRB from butyric (kgCOD·m−3) | SRB from propionate (kgCOD·m−3) | SRB from acetate (kgCOD·m−3) | SRB from hydrogen (kgCOD·m−3) | |||
| Item | Symbol | Default Value | NaCl System | Na2SO4–NaHCO3 System | Unit |
|---|---|---|---|---|---|
| Disintegration | |||||
| Disintegration rate | kdis | 0.5 | 1.2 | 1.2 | d−1 |
| Hydrolysis | |||||
| Carbohydrate hydrolysis rate | khyd,ch | 10 | 10 | 10 | d−1 |
| Protein hydrolysis rate | khyd,pr | 10 | 10 | 10 | d−1 |
| Lipids hydrolysis rate | khyd,li | 10 | 10 | 10 | d−1 |
| Acidogenesis | |||||
| Maximum uptake rate by oxalate degrader | km,ox | ||||
| Half saturation coefficient of oxalate degrader | KS,ox | ||||
| Specific decay rate of oxalate degrader | box | ||||
| Maximum uptake rate by sugar degrader | km,su | 30 | 4 | 4 | d−1 |
| Half saturation coefficient of sugars degrader | KS,su | 500 | 10 | 10 | gCOD·m−3 |
| Specific decay rate of sugars degrader | bsu | - | 0.06 | 0.06 | d−1 |
| Maximum uptake rate by amino-acids degrader | km,aa | 50 | 4 | 4 | d−1 |
| Half saturation coefficient of amino-acids degrader | KS,aa | 300 | 10 | 10 | gCOD·m−3 |
| Specific decay rate of amino-acids degrader | baa | - | 0.06 | 0.06 | d−1 |
| Maximum uptake rate by LCFAs degrader | km,fa | 6 | 1 | 1 | d−1 |
| Half-saturation coefficient of LCFAs degrader | KS,fa | 400 | 40 | 40 | gCOD·m−3 |
| Specific decay rate of LCFAs degrader | bfa | - | 0.06 | 0.06 | d−1 |
| Acetogenesis | |||||
| Maximum uptake rate by valerate degrader | km,va | 20 | 2 | 2 | d−1 |
| Half-saturation coefficient of valerate degrader | KS,va | 200 | 10 | 10 | gCOD·m−3 |
| Specific decay rate of valerate and butyrate degrader | bc4 | - | 0.06 | 0.06 | d−1 |
| Maximum uptake rate by butyrate degrader | km,bu | 20 | 2 | 2 | d−1 |
| Half-saturation coefficient of butyrate degrader | KS,bu | 200 | 10 | 10 | gCOD·m−3 |
| Maximum uptake rate by propionate degrader | km,pro | 13 | 0.039 | 2 | d−1 |
| Half-saturation coefficient of propionate degrader | KS,pro | 100 | 5 | 5 | gCOD·m−3 |
| Propionate inhibition coefficient on propionate degrader | KI,p,p | - | 800 | 800 | gCOD·m−3 |
| Specific decay rate of propionate degrader | bpro | - | 0.06 | 0.06 | d−1 |
| Propionate inhibition power coefficient | n | - | 5 | 5 | - |
| Methanogenesis | |||||
| Maximum uptake rate by acetate degrader | km,ac | 8 | 4 | 4 | d−1 |
| Half-saturation coefficient of acetate degrader | KS,ac | 150 | 15 | 15 | gCOD·m−3 |
| Propionate inhibition coefficient on acetate degrader | KI,p,a | - | 500 | 500 | gCOD·m−3 |
| Maximum uptake rate by hydrogen degrader | km,h2 | 35 | 1.5 | 1.5 | d−1 |
| Half saturation coefficient of hydrogen degrader | KS,h2 | 7 × 10⁻⁶ | 7 × 10⁻⁶ | 7 × 10⁻⁶ | gCOD·m−3 |
| Propionate inhibition coefficient on hydrogen degrader | KI,p,h | - | 500 | 500 | gCOD·m−3 |
| Sulfate reduction | |||||
| SRB maximum specific growth rate of sugar degrader | km,SRB | - | - | 2 | d−1 |
| SRB half-saturation coefficient of sugars degrader | KS,m,SRB | - | 0.1 | gCOD·m−3 | |
| SRB specific decay rate of sugars degrader | bmSRB | - | - | 0.06 | d−1 |
| SRB maximum specific growth rate of amino acids degrader | kaa,SRB | - | 2 | d−1 | |
| SRB half-saturation coefficient of amino acids degrader | KS,aa,SRB | - | - | 0.1 | gCOD·m−3 |
| SRB specific decay rate of amino acids degrader | baaSRB | - | - | 0.06 | d−1 |
| SRB maximum specific growth rate of LCFAs degrader | kL,SRB | - | - | 1 | d−1 |
| SRB half-saturation coefficient of LCFAs degrader | KS,L,SRB | - | - | 0.1 | gCOD·m−3 |
| SRB specific decay rate of LCFAs degrader | bfaSRB | - | - | 0.06 | d−1 |
| SRB maximum specific growth rate of valerate degrader | kv,bu,SRB | - | - | 2 | d−1 |
| SRB half-saturation coefficient of valerate degrader | KS,v,SRB | - | - | 0.1 | gCOD·m−3 |
| SRB specific decay rate of valerate degrader | bvSRB | - | - | 0.06 | d−1 |
| SRB maximum specific growth rate of butyrate degrader | km,bu,SRB | - | - | 2 | d−1 |
| SRB half-saturation coefficient of butyrate degrader | KS,bu,SRB | - | - | 0.1 | gCOD·m−3 |
| SRB specific decay rate of butyrate degrader | bvSRB | - | - | 0.06 | d−1 |
| SRB maximum specific growth rate of propionate degrader | km,pro,SRB | - | - | 2 | d−1 |
| SRB half-saturation coefficient of propionate degrader | KS,pro,SRB | - | - | 0.1 | gCOD·m−3 |
| SRB specific decay rate of propionate degrader | bpSRB | - | - | 0.06 | d−1 |
| SRB maximum specific growth rate of acetate degrader | km,ac,SRB | - | - | 2 | d−1 |
| SRB half-saturation coefficient of acetate degrader | KS,ac,SRB | - | - | 0.1 | gCOD·m−3 |
| SRB specific decay rate of acetate degrader | baSRB | - | - | 0.06 | d−1 |
| SRB maximum specific growth rate of hydrogen degrader | km,h2,SRB | - | - | 8 | d−1 |
| SRB half-saturation coefficient of hydrogen degrader | KS,h2,SRB | - | - | 0.1 | gCOD·m−3 |
| SRB specific decay rate of hydrogen degrader | bhSRB | - | - | 0.06 | d−1 |
Publisher’s Note: MDPI stays neutral with regard to jurisdictional claims in published maps and institutional affiliations. |
© 2022 by the authors. Licensee MDPI, Basel, Switzerland. This article is an open access article distributed under the terms and conditions of the Creative Commons Attribution (CC BY) license (https://creativecommons.org/licenses/by/4.0/).
Share and Cite
Wang, J.; Liu, B.; Sun, M.; Chen, F.; Terashima, M.; Yasui, H. A Kinetic Model for Anaerobic Digestion and Biogas Production of Plant Biomass under High Salinity. Int. J. Environ. Res. Public Health 2022, 19, 6943. https://0-doi-org.brum.beds.ac.uk/10.3390/ijerph19116943
Wang J, Liu B, Sun M, Chen F, Terashima M, Yasui H. A Kinetic Model for Anaerobic Digestion and Biogas Production of Plant Biomass under High Salinity. International Journal of Environmental Research and Public Health. 2022; 19(11):6943. https://0-doi-org.brum.beds.ac.uk/10.3390/ijerph19116943
Chicago/Turabian StyleWang, Jing, Bing Liu, Meng Sun, Feiyong Chen, Mitsuharu Terashima, and Hidenari Yasui. 2022. "A Kinetic Model for Anaerobic Digestion and Biogas Production of Plant Biomass under High Salinity" International Journal of Environmental Research and Public Health 19, no. 11: 6943. https://0-doi-org.brum.beds.ac.uk/10.3390/ijerph19116943