Article

GIS Applications in Land Management: The Loss of High Quality Land to Development in Central Mississippi from 1987-2002

by
Yaw A. Twumasi
1 and
Edmund C. Merem
2,*
1
Center for Hydrology, Soil Climatology, and Remote Sensing, Department of Plant and Soil Science. P.O. Box 1208, Alabama A&M University, Normal, AL 35762 USA
2
Department of Urban and Regional Planning, Jackson State University, Jackson, MS 39211 USA
*
Author to whom correspondence should be addressed.
Int. J. Environ. Res. Public Health 2005, 2(2), 234-244; https://0-doi-org.brum.beds.ac.uk/10.3390/ijerph2005020006
Submission received: 10 January 2005 / Accepted: 10 April 2005 / Published: 14 August 2005

Abstract

:
The socio-economic trends and history of Central Mississippi reveal a major rural influence based upon a dependence on agricultural activities as part of the economic engine driving the state’s economy. Yet, in the last several years, the amount of agricultural land in the counties continues to decline. Similar changes in other variables associated with agricultural land use and the continuity of farming in the state have also been changing. Indeed, under the pressure of urban growth, some farmers are forced to use less productive soils or have abandoned the agricultural business. Considering the gravity of the problem and the implications for sustainable development, public concern has increased in the state of Mississippi that urbanization and other factors may be eroding potential farmland. Given the effects of the current trends on the future capacity to produce food items, there are concerns that the growing incidence of farmland loss may also erode the basis for sustainable use of agricultural land, biodiversity and protection of the state’s ecological treasures. Notwithstanding the gravity of these trends, no major effort in the literature has aimed at documenting the incidence of agricultural land loss and the linkages to urbanization in the region of Central Mississippi. What changes have taken place in the size of agricultural land within the counties and what factors are responsible for it? This paper examines the issue of farmland loss in Central Mississippi with a focus at the county level between 1987 and 2002 from a temporal-spatial perspective. In terms of methodology, the paper uses a mixed scale approach based upon the existing literature. Data were drawn from the United States Census databases of Population and Agriculture. This information is analyzed with basic descriptive statistics and GIS with particular attention to the spatial trends at the county level. Results indicate that the counties under consideration have experienced considerable change in the amount of agricultural land and other variables associated with the use of farmland, due to urbanization. With the types of changes occurring, instituting effective policies anchored in sustainability, community participation, and growth management will go a long way in addressing the situation. Other strategies for farmland protection based upon land information inventory and mapping in the region, are also recommended. The paper stands as an update of the existing literature and offers a valuable tool for decision makers within the domain of natural resources management.

Introduction

Agriculture has played a significant role in Mississippi’s history. During the early periods of its settlement, the inhabitants relied upon the abundant natural resources for food and shelter. Even in the modern era, agriculture remains the number one industry, with enormous employment opportunities for the citizenry in 82 counties of the state. In 1999, it was estimated that one in five employees in the state held a job related to agriculture [1]. The sector employs 30 percent of the state’s workforce either directly or indirectly and generates over $5.6 billion in revenues annually. The state’s farmland stretches through an area covering 11 million acres [24].
Accordingly, the socio-economic trends and history of Central Mississippi reveal a major rural influence due to a dependence on agricultural activities as part of the economic engine driving the state’s economy [5]. Yet, the amount of agricultural land in the counties continues to decline. Similar changes in a host of other variables associated with agricultural land use and the continuity of farming in the state have occurred. In 1959, Mississippi contained 18,600,000 acres of farmland [6]. That number had declined to 10,600,000 by 2000. Similarly, the total number of farms in Mississippi has decreased by 11,000 since 1982. In 1982, 11 counties in the state had at least 751 farms each; by 1997, only two counties showed that many. Also in 1982, eight counties contained 275,000 acres or more, by 1997 only five counties did. The gravity of such losses in 80 of the 82 counties led to a total decrease of over 2 million acres from 1982 to 1997 [7].
Central Mississippi and other regions in the state have also experienced rapid population growth and have expanded into rural areas to accommodate this growth. This urbanization of rural areas triggers changes that often alter the environmental amenities that urban dwellers were seeking when they migrated into the countryside. The scenic appeal and quality of natural resources in rural areas have been important factors in bringing population growth to the countryside. As urban growth expands into rural areas, the land base changes. One critical impact on the natural resource base is the conversion of agricultural land to urban uses. This change often engenders the reduction of aesthetic and ecological values of natural areas [8]. The growing incidence of agricultural land loss partly attributable to urbanization also poses an enormous threat to preservation of agricultural land in the state [9]. From 1992 to 1977, urbanized acreage rose by 196,900 acres. Much of this lost acreage came from pasture (37,500 acres) and soybean production (13,100 acres). Cropland under irrigation in 1992 and developed by 1997 totaled 4,500 acres, most of which produced cotton (2000 acres). Given the effects of these trends on the future capacity to produce food items, there are concerns that farmland loss may also erode the basis for sustainable use of agricultural land, biodiversity and the protection of the state’s ecological treasures [10].
Notwithstanding the situation in Mississippi, the phenomenon of sprawling urban development stands as one of the key factors driving land use and land cover changes in the United States. The US Department of Agriculture’s Natural Resources Conservation Service estimates that over 12 million acres of land were converted to developed land in the United States during the period between 1982 and 1997. During that period, farmland accounted for over 50 percent of newly developed land, while another third came from forestland [11]. This intensification in urban land development at the expense of open space and natural lands has sparked a growing debate over the problems and benefits of urban development and sprawl.
Given that the literature on urban development is so broadly dispersed, it is quite difficult to limit the definition and conceptual analysis to a single domain. As a result, several definitions for sprawl have been coined that describe sprawl as a specific form of urban development with low-density, dispersed, auto-dependent, and environmentally and socially-impacting characteristics [12, 13]. The negative externalities emanating from urban sprawl have been widely documented [1417]. Other scholars have identified benefits of sprawl-style development [18, 19]. Of particular concern is the extent of land consumption and the inefficient nature of this type of growth and the increasing amount of critical land resources lost in relation to human population growth [2023]. However, from the standpoint of research and management, there is still a great need to further our understanding of spatial and temporal patterns of urban land use.
To keep up with these changes, agencies from all levels of government and the private sector devote substantial resources to obtaining spatial information systems to study the impacts of urban infrastructure on agricultural land [24]. Notwithstanding the gravity of the trends, no major research effort has aimed at documenting the incidence of agricultural land loss due to urban development in Central Mississippi through the use of GIS. The crucial question remains, what changes have taken place in the amount and distribution of agricultural land within individual counties and what factors are responsible for it? If patterns of land loss can be determined through this technique, then future urban land development and conversion could be better predicted and better judgments could be made in developing land use policies and strategies restricting land use [25].

The Purpose and Organization of the Research

This project examines farmland loss in Central Mississippi from a temporal-spatial perspective with a focus at the county level, between 1987 and 2002. Alternate strategies for farmland protection, based upon growth management, land information inventory and mapping, as well as community participation in the region, are also recommended. This paper contains five sections. Section 1 offers a description of the methodology and the study area. Section 2 presents the results and data analysis, while section 3 discusses the findings and their significance to land management. The fourth section offers recommendations for change in land-use policy. The final section summarizes the importance of the study to the future of agricultural productivity in Mississippi and elsewhere. To analyze the trend, the project adopts a time series approach, descriptive statistics, regression analysis and Geographic Information System (GIS) mapping of socioeconomic and land data from the United States Census. This paper has three objectives. The prime objective is to update the existing literature. A second objective is to provide a useful tool for decision makers within the domain of natural resources management. The third objective is to show how the latest advances in GIS can be used to enhance land management at the county level.

Background and Methods

The Study Area: The Central Mississippi Planning and Development District

The study area (Figure 1) consists of the Central Mississippi Planning and Development District (CMPD, hereinafter called “Central Mississippi”). The District contains the Jackson Metropolitan Statistical Area, which encompasses three counties (Hinds, Madison, and Rankin) and four adjoining rural counties with sizeable natural areas (Simpson, Yazoo, Warren, and Copiah). The Central Mississippi Planning and Development District is situated within two major river basins, those of the Pearl and Yazoo rivers. The population of the areas adjacent to the river basins is estimated to be over 1.5 million [26, 27]. The total size of the study area is 5,233 square miles, which encompasses a diverse landscape, a wide range of economic activities, and extensive areas of land suitable for agriculture and forestry [28, 29]. According to the 1997 Census of Agriculture, the study area contained a total of 1,120,307 acres of agricultural land [30].
Environmental features within the region include rangelands, sensitive wetlands, and streams that support an abundance of fish and other wildlife. These environmental systems drain into the major river basins. Other notable features of the study area include ground water aquifers serving the needs of the counties as well as downstream communities. Also located in study area is the Ross Barnett Reservoir, an impoundment of some 33,000 acres, located North of Jackson and stretched across a distance of 43 miles. The Jackson Metropolitan Area draws 75 million gallons of groundwater annually. Worries about the impacts of projected growth on the area’s water resources, have led to water management emerging as a high priority among local government officials in the three urban counties (Hinds, Madison and Rankin) [31, 32].
The study area has a large concentration of high-quality farmlands that are rated under the prime soil classes due to their capability for agriculture. Since the area was first settled, agriculture has played a vital role in attracting residents and investment. Today, Central Mississippi is home to a diverse range of agricultural operations. The climate supports a variety of agricultural uses, such as production of corn, cotton, soybeans, rice and crops, livestock husbandry and poultry production. Forestry is gradually emerging as a popular land use in Central Mississippi. The study area also contains extensive acreage of forested timberland. Some of the products include pine and hardwood sawlogs and hardwood-pulpwood cords. Rankin and Copiah counties rank among the most heavily forested in state, accounting for a combined total of 730,500 acres of forested land [33, 34]. However, intensive harvesting throughout the seven counties has caused some negative impacts on the forest ecosystem and biodiversity.
The well-known impacts of urbanization have been manifest in the area by a rise in population and concomitant increases in building permits issued, housing construction, and other indicators. Proliferation of pollution-intensive activities prompted in part by mining industry and the presence of 1,070 dumpsites, has raised environmental concerns due to the widespread discharge of mercury, pathogens, and PCBs into water systems. Public managers in the adjoining rural counties must also grapple with the impacts of urban sprawl and various sources of pollution. As a result, the CMPD stands as an ecosystem under stress [35, 36].
Such a diversified socioeconomic and environmental profile, built around intense land use and the extraction of natural resources, has substantial implications for the stability of area ecosystems and future use of agricultural land. It is clear that conditions in the Central Mississippi Planning and Development District deserve consideration as an ideal place to study GIS applications in land management. The presence of flourishing agricultural operations and the strength of other sectors, combined with important socio-economic indicators, have led and will continue to lead to changes in the area to both agricultural lands and ecosystems.

Methods Used

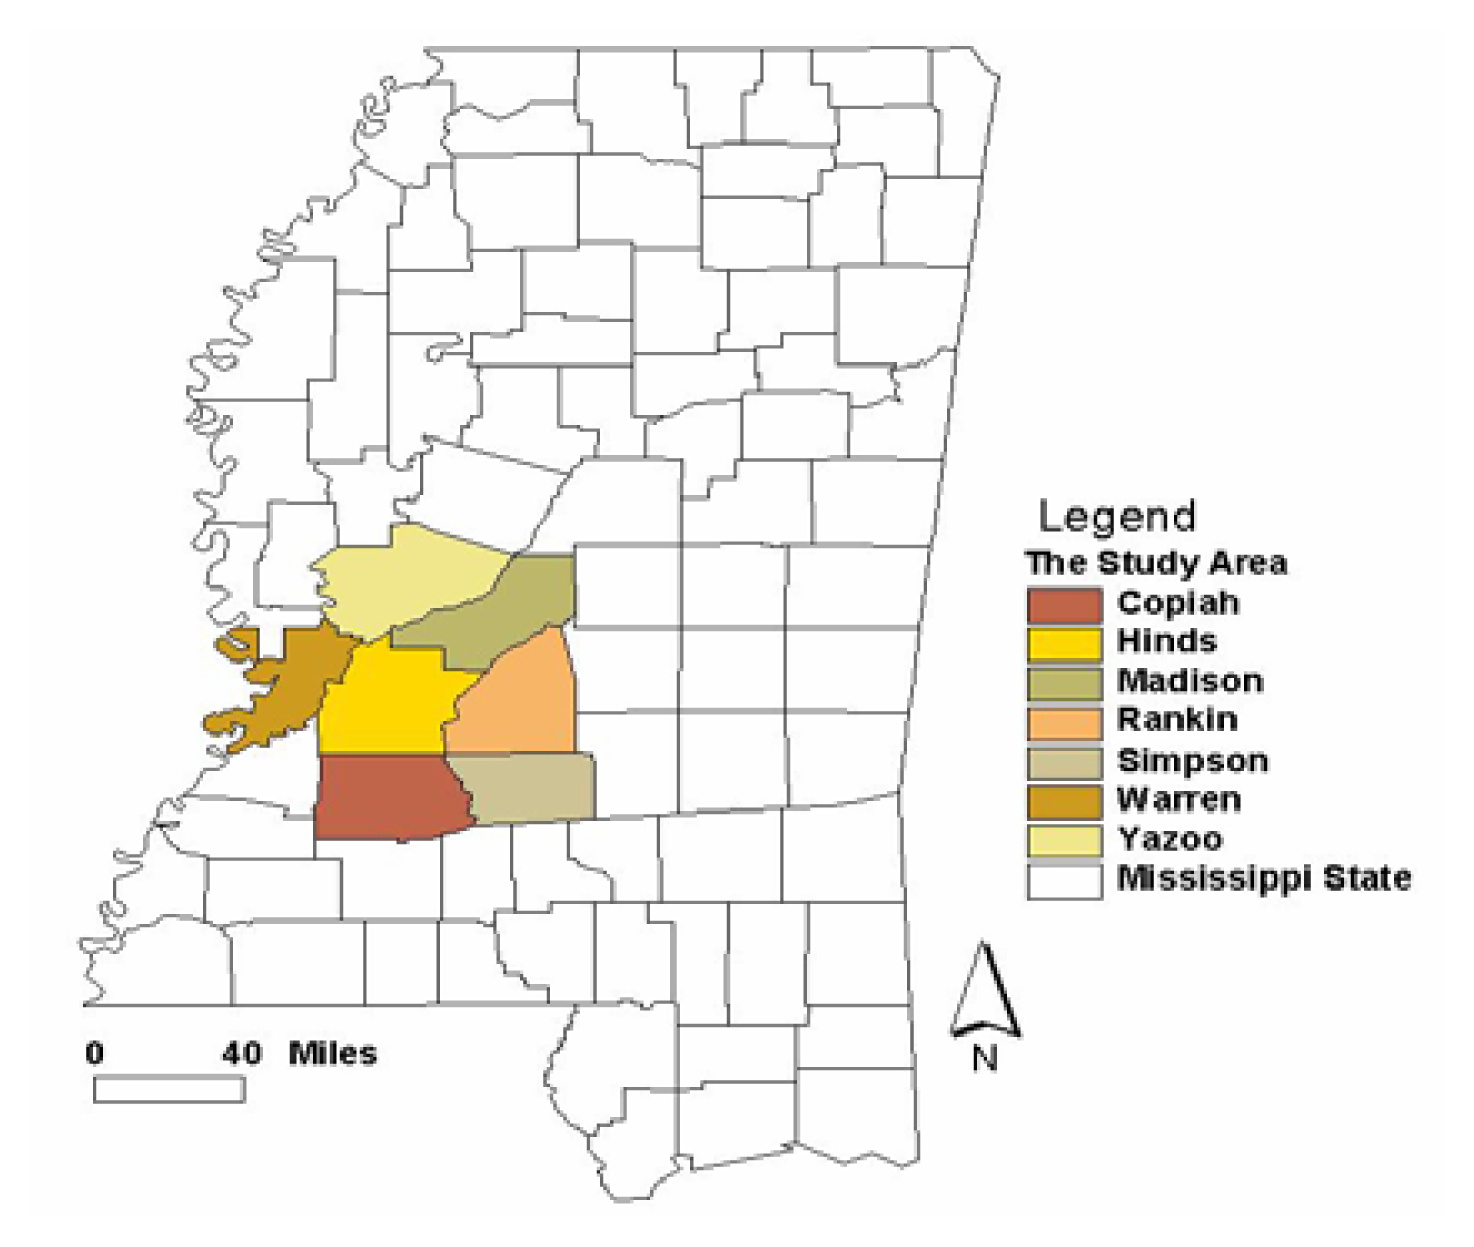
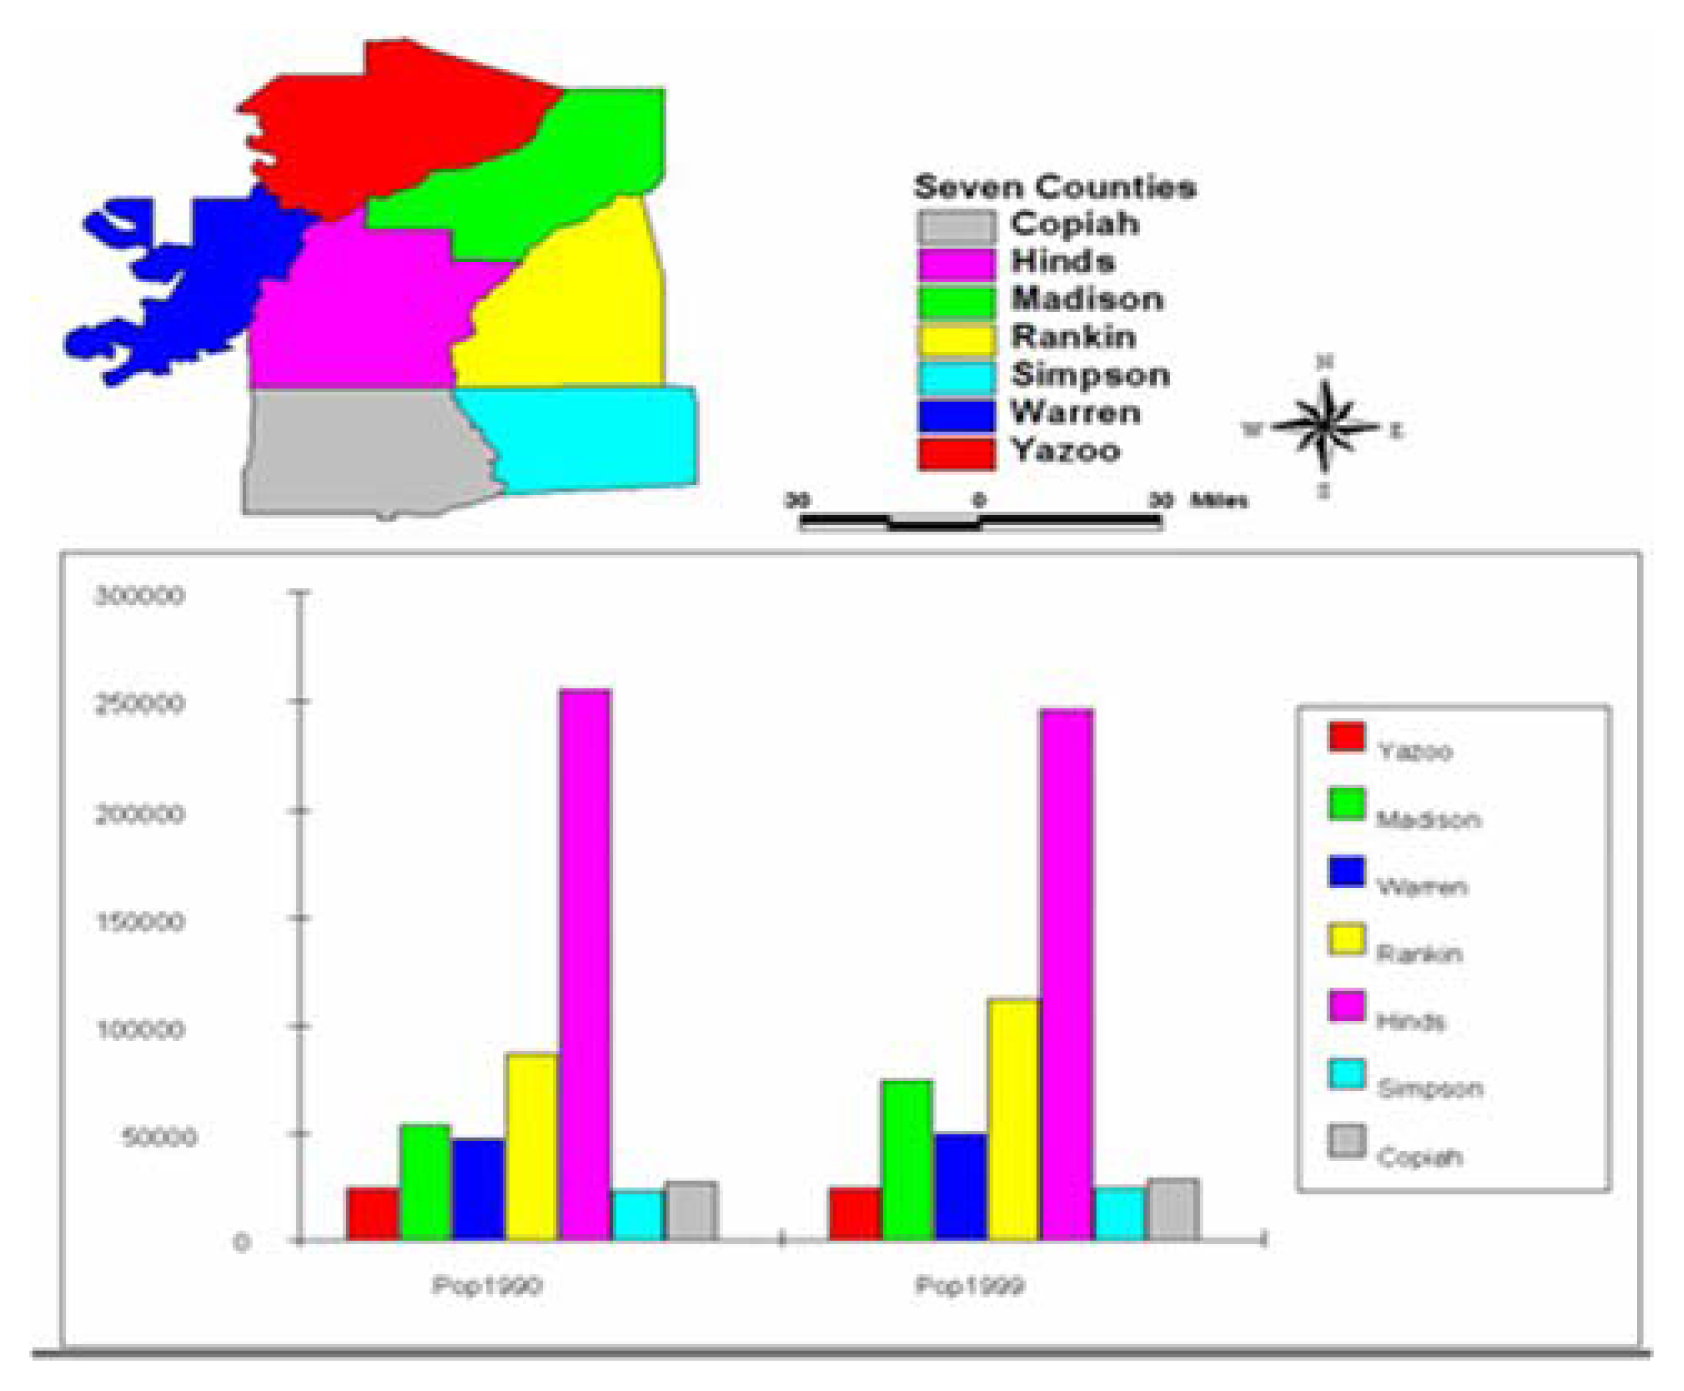
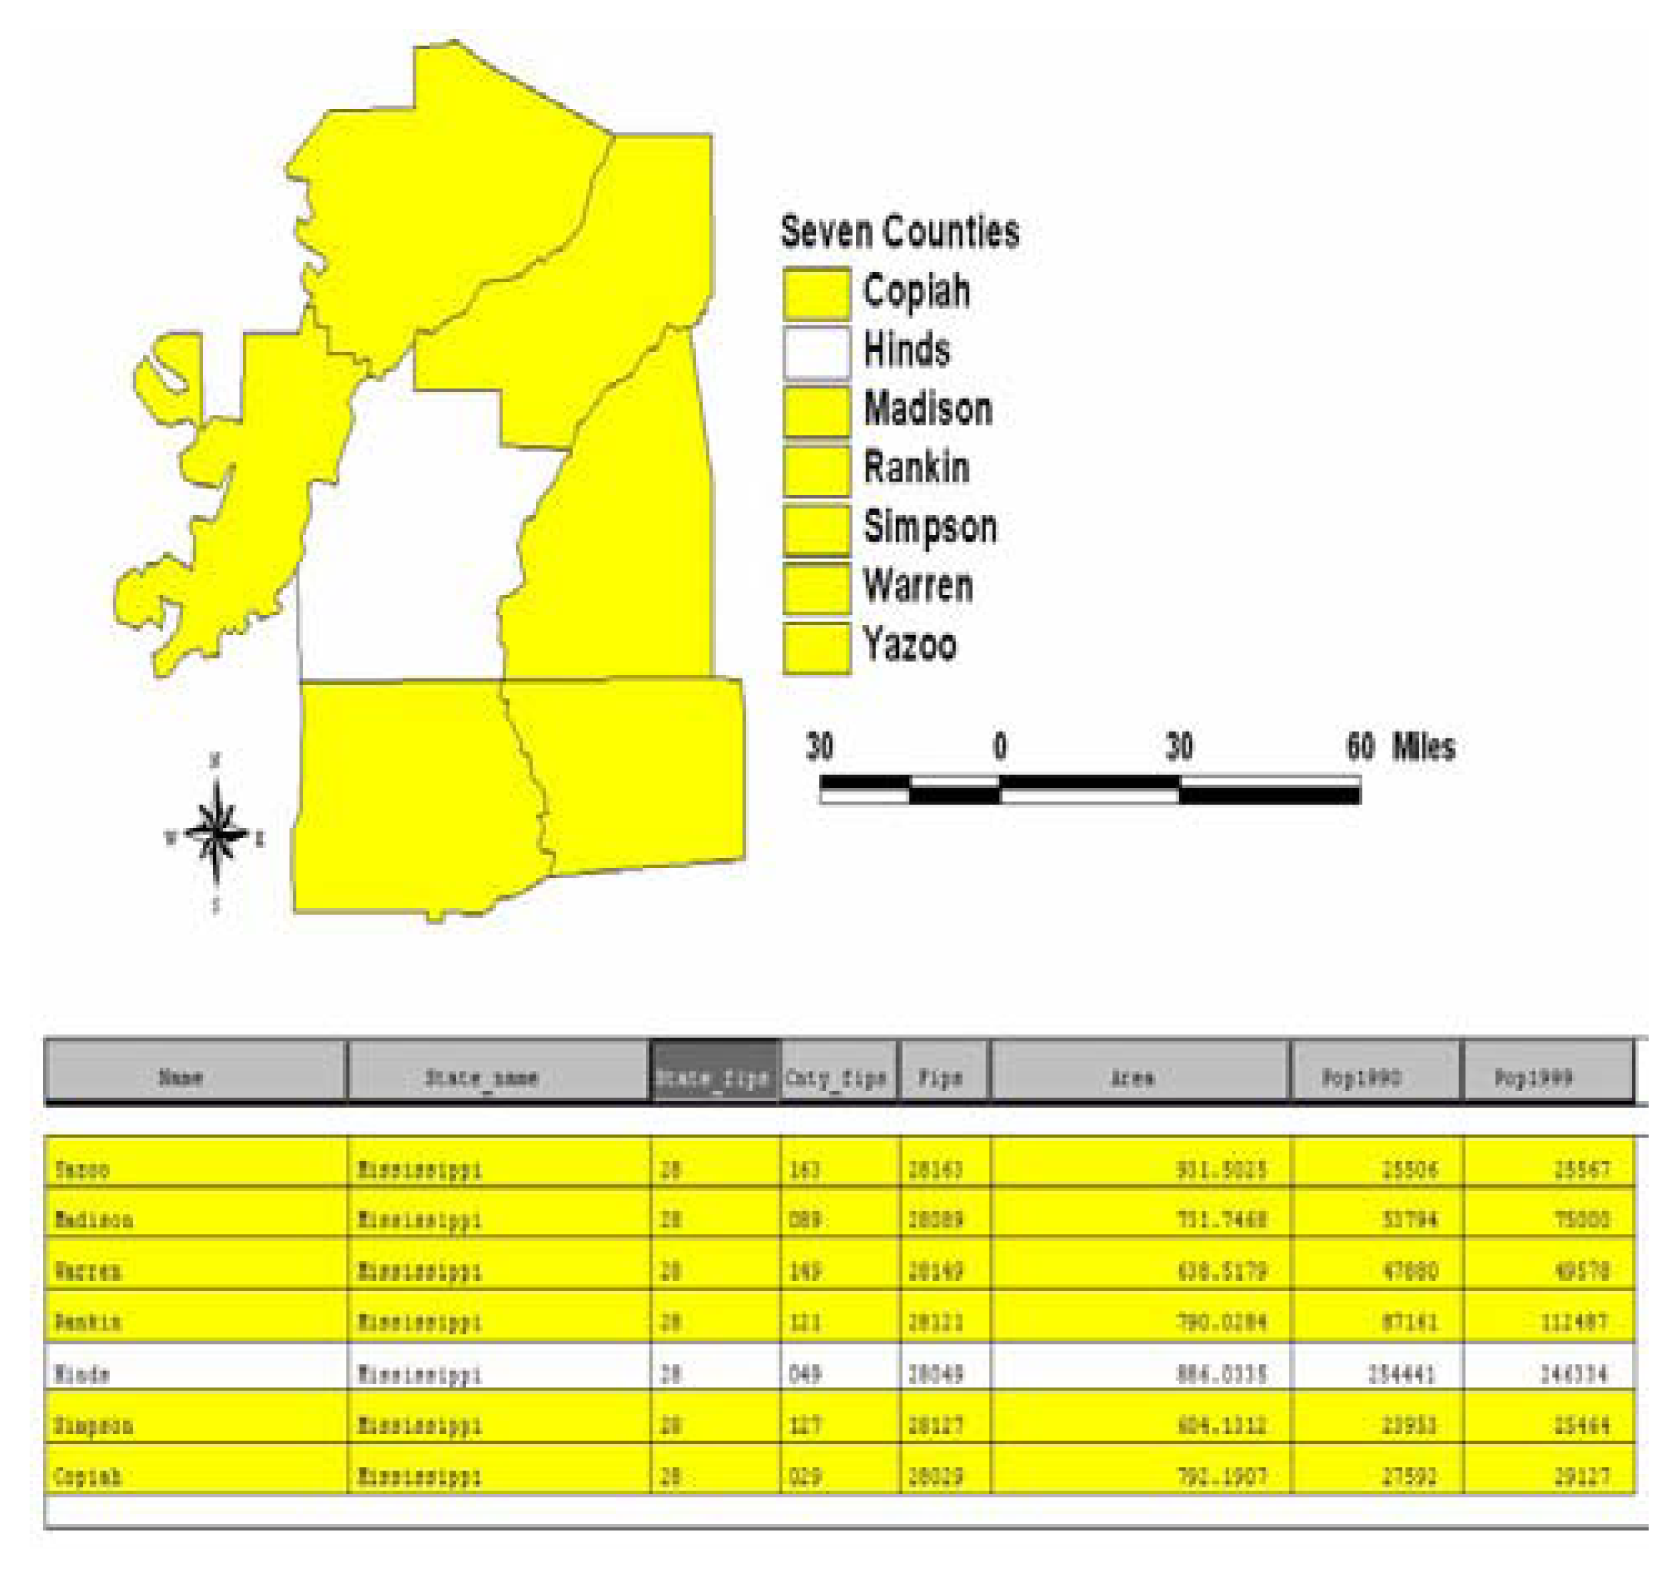
This paper uses a mixed-scale approach based on government databases. The spatial information for the research was obtained from the Mississippi Automated Resource Information System office in Jackson, Mississippi, the American Farmland Trust and United States Census of Agriculture for 1987, 1992, 1997 and 2002. Federal geographic identifier codes for the seven counties (Copiah, Hinds, Rankin, Madison Simpson, Warren, and Yazoo) were used to geo-code the information contained in the data sets. The spatial data came from land-use capability and classification maps for the study area. This information was analyzed with basic descriptive statistics, regression analysis, and GIS, with particular attention to the temporal-spatial trends at the county level. The relevant procedures consisted of two stages, as described below.

Stage 1: Identification of Variables, Data Gathering and Study Design

The initial step in this research involves the identification of the variables required to analyze changes at the county level from 1987 to 2002. The variables consist of socioeconomic and environmental information, including amount of agricultural land, average size of farms, market value of land, value of machinery, amount of cropland, number of housing permits, population and selected indicators on housing (homeownership rate, income and unit structure)(See Tables 1 through 4). Appropriate variables were derived from secondary sources such as government documents, newsletters and previous works. That process was followed by the design of data matrices for socioeconomic and land use (environmental) variables covering the census periods from 1987 to 2002. The design of spatial data for the GIS analysis required the delineation of city boundary lines within the study area as well. Given that the official boundary lines between the seven counties remained the same, a common geographic identifier code was assigned to each of the areal units to ensure analytical coherency.

Stage 2: Data Analysis

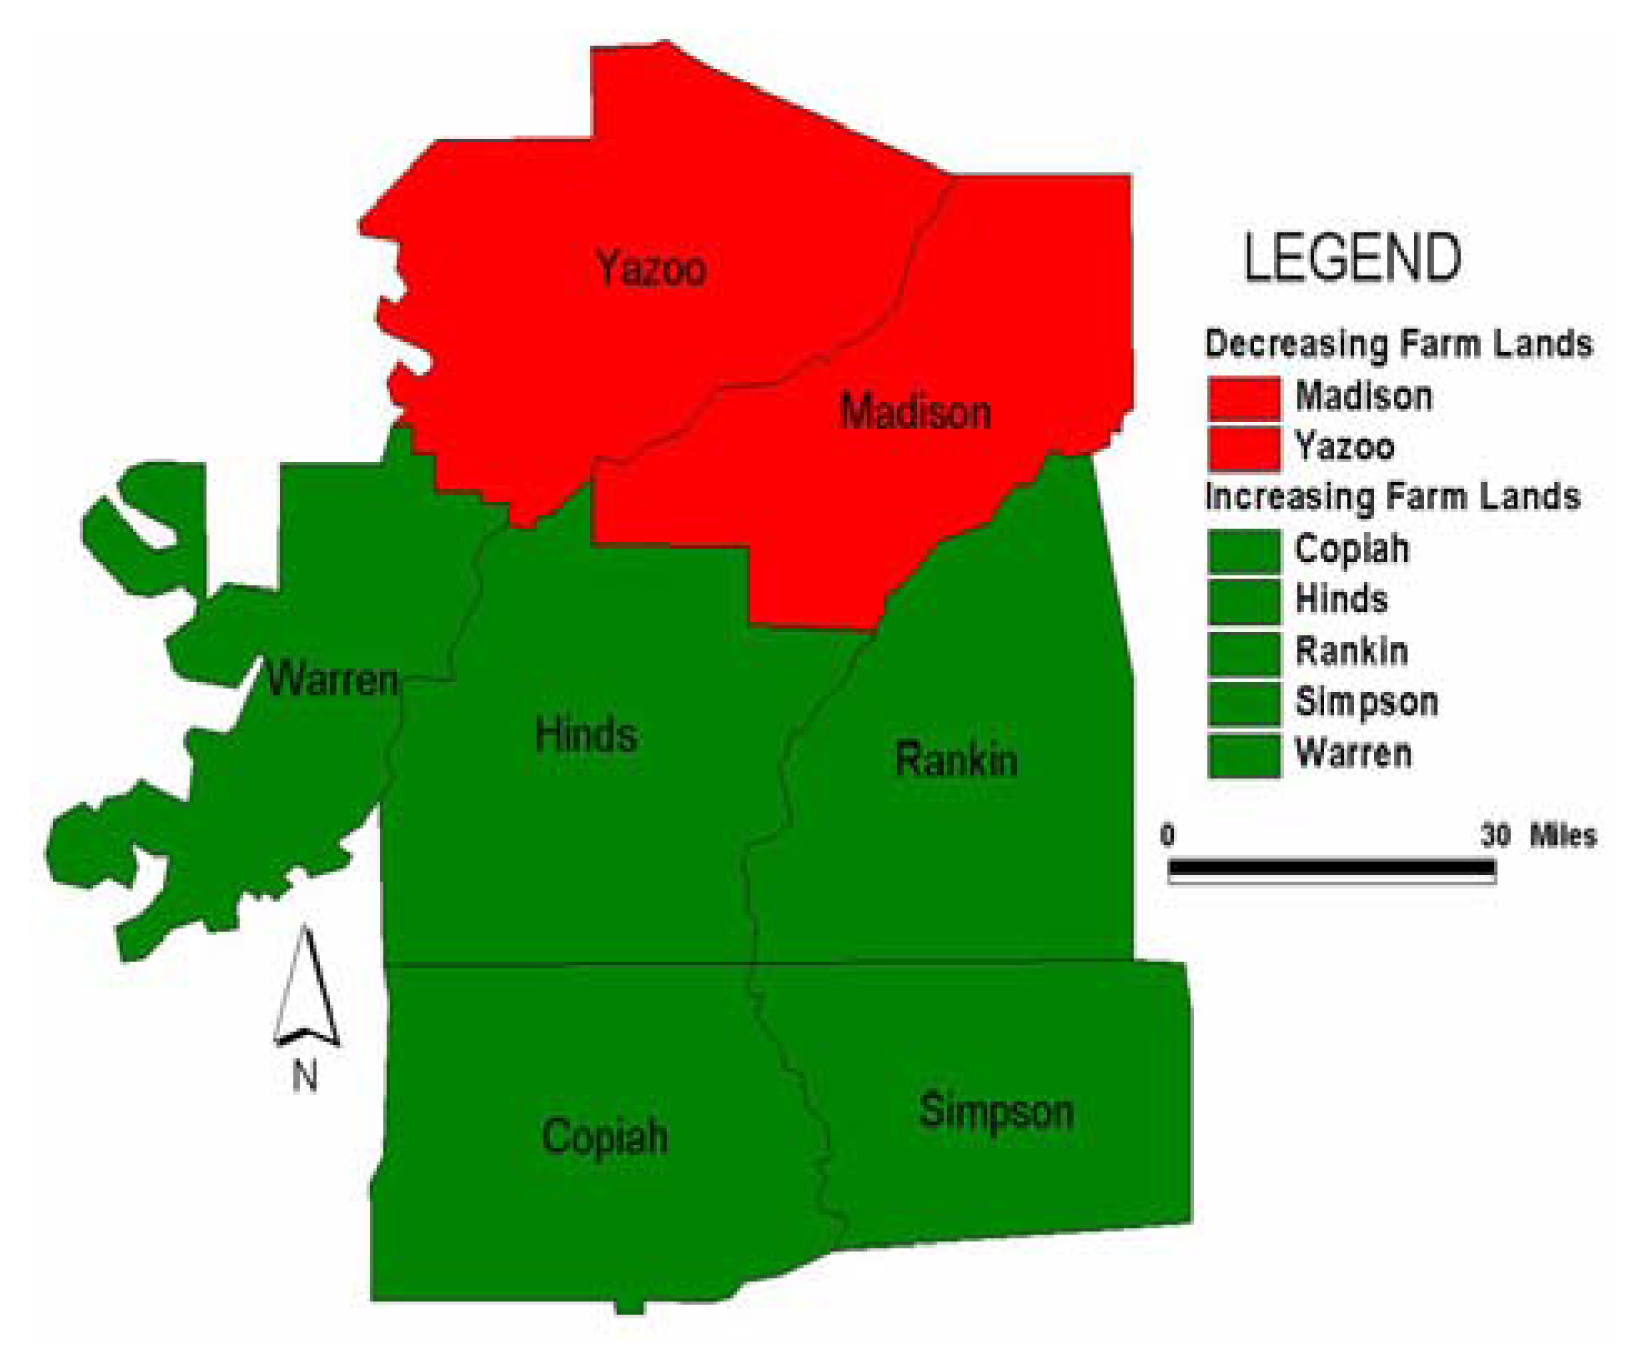
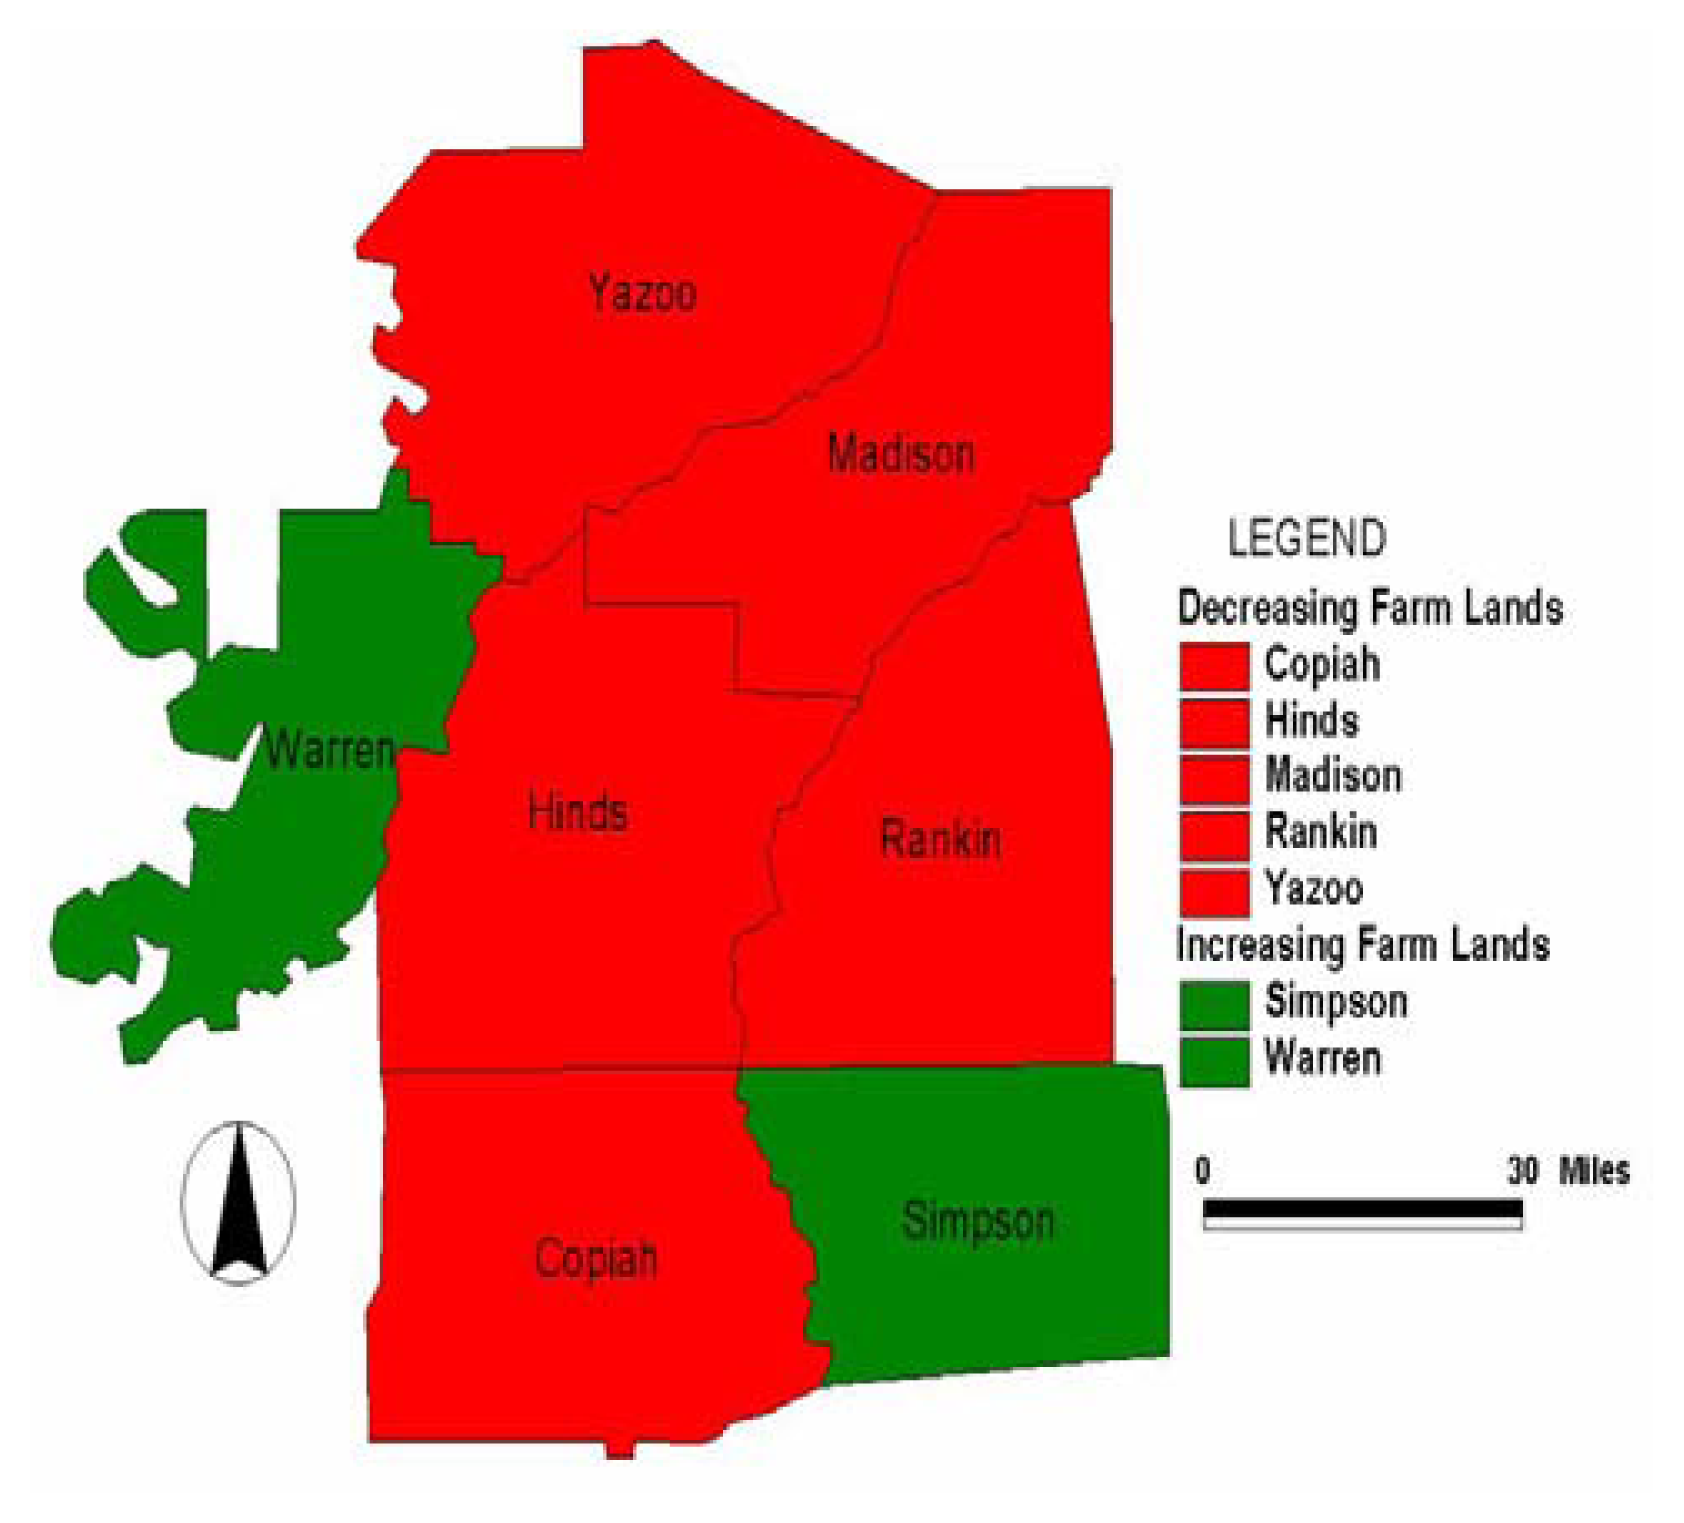
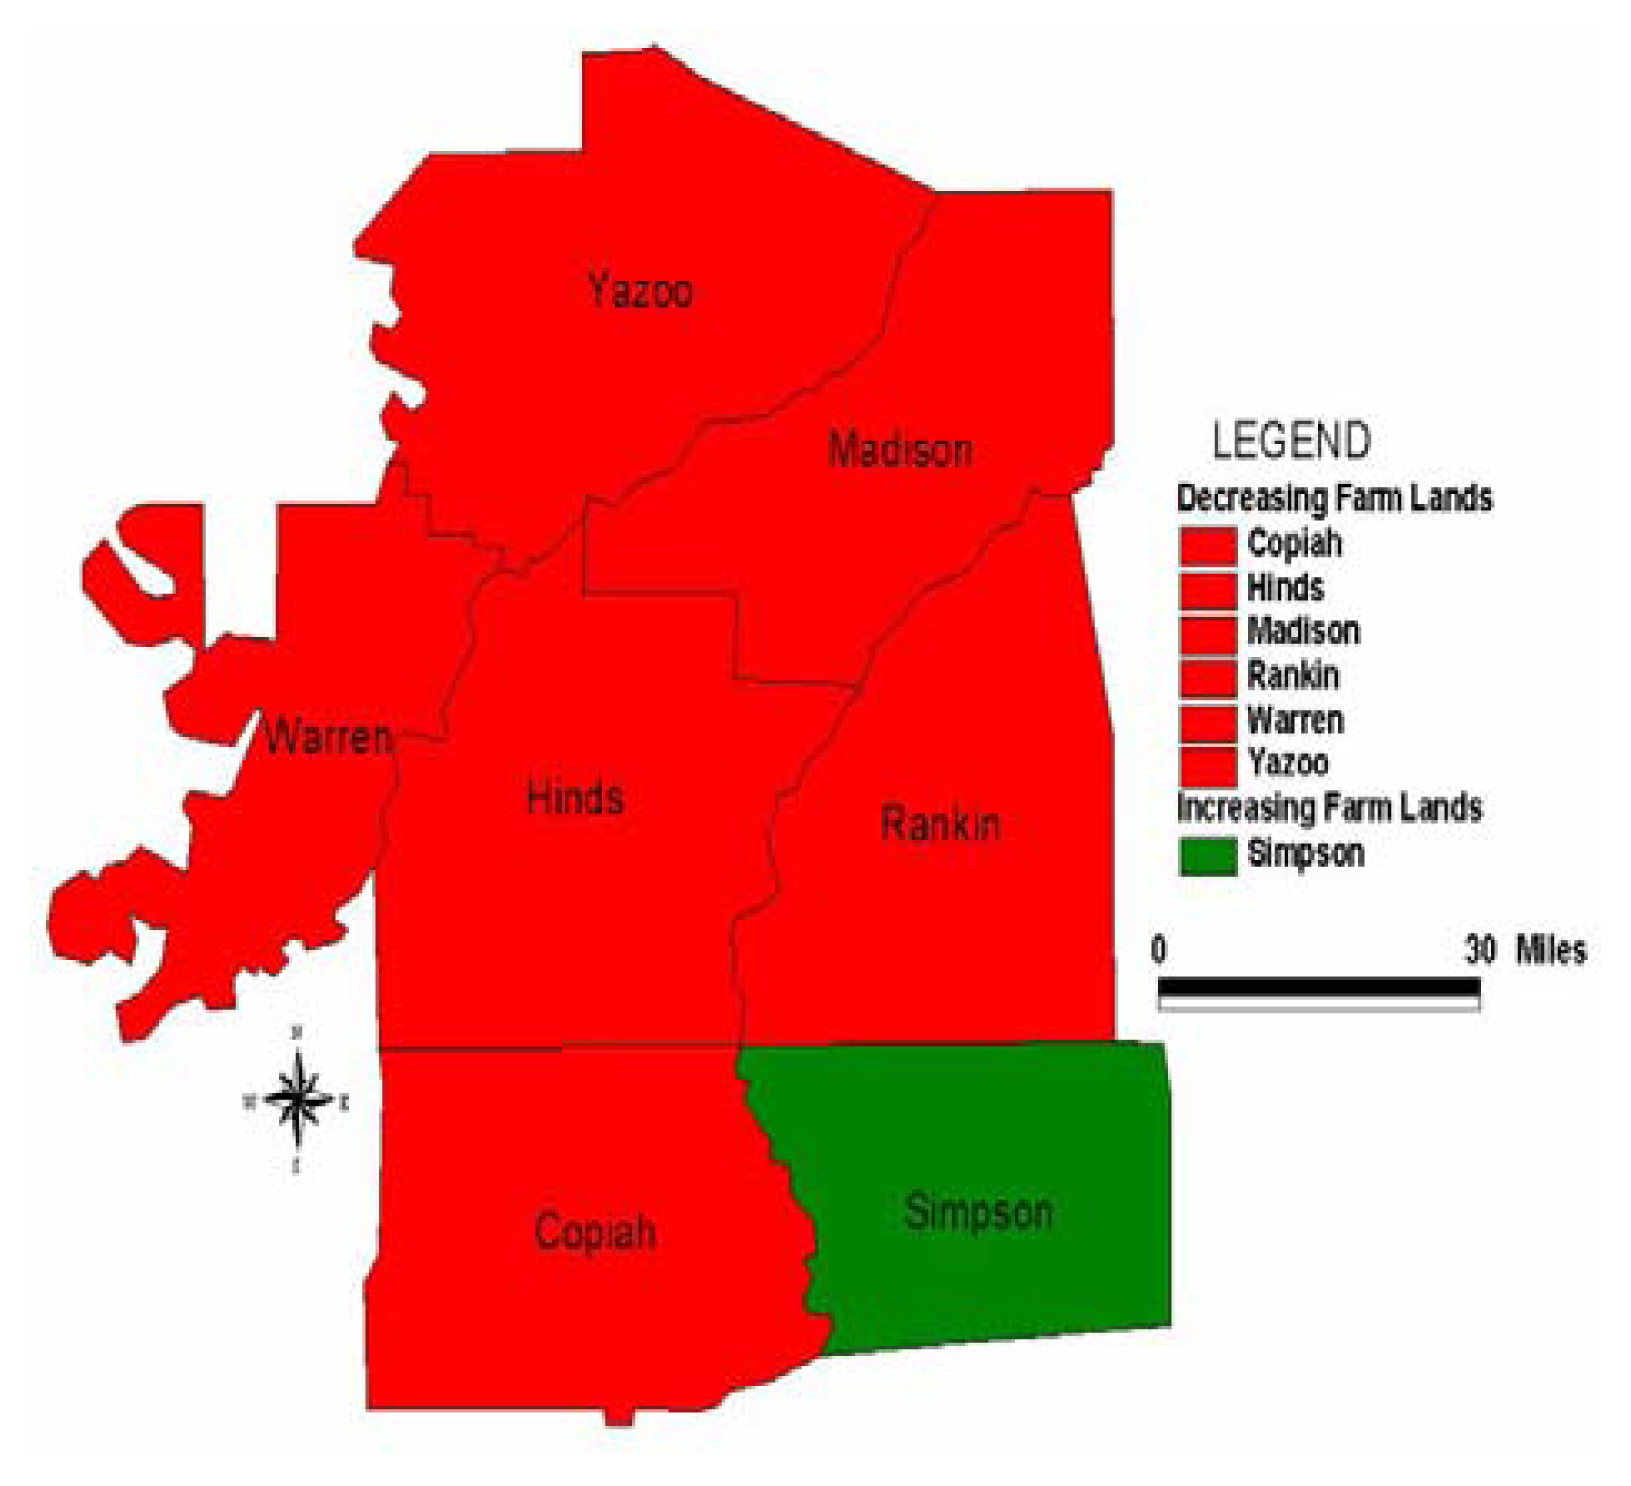
In the second stage, descriptive statistics and regression analysis were employed to transform the original socioeconomic and land-use data into relative measures (percentages, ratios and rates). This process generated the parameters for establishing, the extent of change or land loss for each of the seven counties facilitating gradual measurement and comparison of the trends in the area overtime. This approach allows detection of levels of change, while the graphics highlight the land-loss trends affecting the study area. The remaining steps involve spatial analysis and output (maps-tables-text) covering the study period, using ARCVIEW. The spatial units of analysis consisted of the seven counties (Figure 1). The study area map indicates boundary limits of the county units and their geographic identification codes. Outputs for each county were mapped and compared across time. This process helped show the spatial evolution of farmland loss, as well as changes in other variables.

Results

This section presents the results of the data analysis by first providing a brief synthesis of the descriptive statistics and a regression analysis of the trends. Later, it highlights the spatial factors associated with change in agricultural land in the study area.

Agricultural Land Loss in Central Mississippi, 1987–2002

Tables 1a1c summarize data on loss of acreages from 1987 to 2002. Between 1987 and 1992, the area of farmland in Central Mississippi declined from 1,334,664 acres to 1,247,314 acres. This number fell further between 1992 and 1997 to 1,120,307 (Table 1a). The seven counties posted a combined total loss of 87,350 acres of arable farmland between 1987 and 1992 (Table 1b). This continued with losses 214,357 acres from 1987 to 1997 and 127,007 acres between 1992 and 1997. This loss was followed with minor gain of 3,362 acres by 2002. Table 1c shows that farmland changes stayed negative most of the time. Hinds County alone suffered double-digit declines of 13.1, 26.1, and 14.9 percent during the intercensal periods 1987–1992, 1987–1997, 1992–1997 respectively. The rural counties of Copiah and Yazoo also recorded double-digit percentage losses. Land loss in Yazoo County was also steadily negative during the census periods between 1987 and 1992, 1987–1997 and 1992–1997 and 1987–2000.
The study area as a whole also posted similar levels of declines at a rate of 6.54–16.1 and 10.2 percent during the same period. The two other urban counties of Madison and Rankin recorded declining rates of less than −10 percent from 1987 to 1992. Within this period the land in farms in the two counties showed a sizable decline of 10.2 for Rankin and 16.5 for Madison. The rural counties of the study area (Warren and Simpson) recorded some slight gains. Tables 1a and b show gains of 6.69 percent (7,156 acres) for Warren County between 1987 and 1992 and 1.48 percent for Simpson. In that same period, the rural counties of Copiah lost about 5, 932 acres at a rate of 5 percent, while Simpson experienced a decline of 2,825 acres or-3 percent. Each county also witnessed some losses in the average size of farms, the number of farms and acreage of cropland between 1987 and 2002 (Tables 2a2g).
The statistical summary of the regression test is presented in Tables 2a2g. The technique serves as a predictive tool that enables a numerical description of the way one variable relates to another. The correlation between two variables reflects the degree to which the variables are related. It ranges from +1 to −1. A correlation of +1 means that there is a perfect positive linear relationship between the variables. When computed in a sample, it is designated by the letter r. Among the individual counties, simple positive correlation of great significance was shown to exist between some of the variables. The predictive component of the test shows the 2007 estimates of the counties as the only ones that are part of a trend significantly different from the mere average of the historical data having the “s” suffix. All other estimates are not significantly different from the historical average. The parameter of the regression line is determined by the formula A and B in the expression Y = A + Bx Year, where Y is the variable on which the regression is done. The estimate for the year 2007 is just A + Bx2007. In the last column to the extreme right appear the Rate figures, the annualised percentage increase or decrease in the value of each variable using the 2007 estimate to generate the slope B. The rate figures on average size, cropland acres, and land value all suggest that the counties listed above contain or are close to a sprawling urban development. In nearly all the counties, cropland is declining, land values are increasing, and farm size is declining. The decline in farm size must be explained by some counteracting causes, such as urban sprawl and the tendency for counties to expropriate land for urban development (Tables 2a2g).
The spatial pattern of the land loss identified in the statistical analysis was put into focus by mapping the trends in ARCVIEW. In Figures 2.12.3, the spatial patterns of change in agricultural land have been differentiated in red and green, where the red indicates land loss and green land gain. Figures 2.12.3 display the spatial distribution of losses and gains for 1987–2002, 1987–1992, and 1987 to 1997 respectively. During the 1987 to 2002 period, agricultural land decline was visible in just two counties in the study area. Between 1987 and 1992 five out of seven counties experienced land loss. In the other periods (1987 to 1997), six counties experiencing land loss were dispersed around part of the study area. A cluster of five counties that accounted for gains were fully concentrated in the South East and South West section of Central Mississippi during the periods of 1987–2002 than the other years. These maps reveal a gradual change in agricultural land use across time and space.

Factors Responsible for Land Loss

Mapping also shows that the area has witnessed some notable growth in population (Figures 3.1. to 3.2). Between 1990 and 2000, the overall population of the area went from 520,327 to 574,990, an increase of 10.5 percent. Of all the counties in the area, the two urban counties in the North Eastern portion of the district, Madison and Rankin, posted the largest population gains in the region. During the period 1990–2000, the population of Madison grew from 53,794 in 1990 to 74,674 or 38.8 percent [37]. In a similar vein, the population of Rankin rose from 87,161 to 115,237, or 32.3 percent. The third urban county, Hinds saw a meagre population decline (1.4 percent) over this period. Trends in the rural counties of Yazoo, Warren, Copiah and Simpson reveal substantial rises in population during the same period. This growth prompted increased housing indicators, such as number of housing units built, building permits, number of households and rate of home ownership with impacts on farmland (Figures 3.1 to 3.2; Table 3) [38].

Discussions

The results indicate that the counties under consideration have experienced considerable changes in the size of agricultural land and host of other variables associated with the use of farmland due to urbanization. The nature and extent of this change transcend all spatial units, regardless of their designation as urban or rural. Another important point to note is Hinds’ County’s status as the county that contains the Metropolitan Statistical Area’s central city of Jackson. To a great extent, the growth in urbanized land in Rankin and Madison is related to this. In spite of some minor gains attributable to best management practices, agricultural land loss has become a major land management challenge for planners in the area [3941]. The pattern of demographic change reveals that population growth and sprawl are threatening the preservation of agricultural land. Additionally, the rapid growth rates of the area coincide with a growing disturbance in the surrounding natural ecosystems. Growth pressure is also evident in the widespread request for building permits to meet domestic needs for new homes.
In light of these findings, it is evident that GIS stands as a valuable tool for decision makers and resource managers in gauging the problems posed by growth and development. Given the negligible effort to document the incidence of land loss due to linkages to urban development in Mississippi, this study not only fills that void, but also it fills an important gap in the literature. The temporal and spatial display of information pertaining to demographic and socioeconomic indicators of growth, and their potential impacts on land use, offers the decision makers the opportunity to craft response mechanisms to dealing with the problems created by urban development [42]. GIS also offers county managers an appropriate tool for tracking the status of lands with high resource values and protecting them from development. Such information is essential in shaping the contours of Smart Growth policies and enabling local governments in Central Mississippi District to prepare plans for effective land uses.

Policy Recommendations

Four recommendations for land use policy and growth management are offered below.

Adopt Effective Land Use Policy Based On Best Management Practices

Given the degree of pressure due to urban sprawl that is being placed on the state’s agricultural lands, more effective land use policies based on best management practices are needed. Local land use policies should flow from the explicit statements of objectives in which the decision makers delineate goals that can guide production of appropriate planning document and serve as guidance for farmers and developers in addition to decision makers. The existing plans should also contain a set of activities to accomplish the objectives in accordance with available resources as well suitable mechanisms for plan implementation and review. The plan, once in place, should then be followed unless circumstances justify changes. Such plans not only have the potential to improve the management practices of land users, but also to contribute to good land management and sustainable production. In addition, the state of Mississippi should designate areas facing severe farmland loss as special districts for farmland protection programs, as incentives to landowners for farmland protection [43, 44].

Encourage Community Participation

The various counties in the study area should continue to support active community involvement in land use decisions likely to impact on the future of agricultural land. Although the likelihood of disagreement is high due to differences in attitudes, land value assessment approaches and management practices, all stakeholders will benefit immensely from active involvement in the decisions made by planning agencies. Community participation should also serve as a forum for proactive dialogue on conservation among landowners, developers, and government for the purpose of fostering sustainability [45].

Promote Sustainability Principles

Both the study area and the state of Mississippi as a whole take pride in being agricultural area where farmland accounts for a sizable proportion of income in dozens of counties. Yet, in the last two decades, the major components of agricultural productivity have come under intense pressure and have suffered from degradation and conversion to urban use. These impacts have eroded the total land area available for farming. The growing incidence of agricultural land loss and the future access to farmland for residents of the state have reached critical proportion that require the incorporation of sustainability principles into the current policy framework for land management. In the absence of such principles, the current pattern of land-loss will live the agricultural sector in the foreseeable future worse off. In light of the stakes involved in ensuring future productivity, the application of sustainability in land use policies is essential [46].

Institute Growth Management Programs Supported By a Land Information Inventory and Mapping

The agricultural counties of Central Mississippi lack an integrated growth management strategy capable of providing greater predictability about where, when, and how much development will occur. Growth management should be applied to the high-growth urbanizing counties in order to protect farmland by channeling new development away from important agricultural areas. Growth management seeks to balance the benefits of development with the costs imposed on quality of life and requires up to date information on the environment. Yet little efforts have been made to collect land information or periodically map critical areas in Central Mississippi. Future growth management legislations should require local governments to identify lands with high natural resource, economic, and environmental values and protect them from development. Local governments should also be directed to make decisions in accordance with comprehensive plans that are consistent with protection of adjoining agricultural land areas. This approach would provide managers with valuable tools in addressing the challenges facing the agricultural sector. Such tools are critical to achieving the long-term economic and ecological needs of the population by helping predict the interactions between agricultural land use and development [47, 48].

Conclusions

Several conclusions can be drawn from this study. First socioeconomic factors related to urbanization and developments have significantly altered the agricultural land base of the Central Mississippi Planning District. The analysis here demonstrates that notable losses of farmland acreage have occurred in the study area. These trends have persisted over the years with a significant spread across time and space. Moreover, in spite of small gains attributed to best management practices by some operators, it is probable that the amount of farmland will continue to drop in the study area, as well as across the rest of the state.
GIS analysis has provided further insights into the spatial evolution of agricultural land use in the region. Mapping succinctly revealed the spatial patterns of declines and gains in land in farms among the seven counties. This spatial and temporal display of information pertaining to variations attributed to agricultural use and the potential impacts of socioeconomic factors on the use offer decision makers an opportunity to devise appropriate response mechanisms. It also enables them to formulate effective strategies for dealing with land loss in those locations deemed most vulnerable to growth pressures. This study demonstrates that using census data and statistical analysis coupled with GIS analysis can provide useful information for land management decision-making. It also updates the existing literature by offering badly needed empirical support for the incorporation of sustainability principles into land development policies and practices promulgated in Mississippi and it offers a viable tool for decision makers within the domain of natural resources management [49, 50].
Figure 1. The Study Area
Ijerph 02 00234f1
Figure 2.1. Counties with Increasing and Decreasing Farm Lands from 1987–2002
Ijerph 02 00234f2
Figure 2.2. Counties with Increasing and Decreasing Farm Lands from 1987–1992
Ijerph 02 00234f3
Figure 2.3. Changes in Farmland Acreage, From 1987–1997.
Ijerph 02 00234f4
Figure 3.1. Population by County 1990–2000
Ijerph 02 00234f5
Figure 3.2. Population Change by County 1990–2000
Ijerph 02 00234f6
Table 1a. Agricultural Land Acreage 1987–2002
County1987199219972002
Copiah151,921126,613120,681157,598
Hinds265,611230,838196,393278,556
Rankin130631118,651117,296130,933
Warren106927114,08397,829114,522
Madison216946198,955182,095192,466
Yazoo367496361,634312,298360,129
Simpson95,13296,54093,715103,822
Total1,334,6641,247,3141,120,3071,338,026
Table 1b. Change in Farm Acreage 1987–2000
County1987–19921987–19971992–19971987–2002
Copiah−25308−31240−59325677
Hinds−34773−69218−3444512945
Rankin−11980−13335−1355302
Warren+7156−9098−162547595
Madison−17991−34851−16860−24480
Yazoo−5862−55198−49336−7367
Simpson1408−1417−28258690
Total87,350214,357127,0073,362
Table 1c. Percentage of Change in Farm Acreage 1987 2000
County1987–19921987–19971992–19971987–2002
Copiah−16.65−20.5−4.683.73
Hinds−13.1−26.1−14.94.87
Rankin−9.17−10.2−1.140.23
Warren6.69−8.50−14.27.10
Madison−8.29−16.1−8.47−11.3
Yazoo−1.59−15.0−13.6−2.00
Simpson1.48−1.48−2.929.13
Total6.5416.110.20.25
Table 2a. Copiah County Regression Analysis
ITEMS1987199219972002rAB2007Rate
Farms (number)555490510690.62−16392+856681.3
Land in farms (acres)151921123613120681157598.08−3003500+2221419780.2
Average size (acres)274258237228.99s*+6592−3.18210−1.5
Cropland (acres)65502540364473144664.94s*+2.92e6−143634279−4.2
Land Value18295517481322202435002387−2.16e7+109683695583.0
Equipment Value19866206622875923963.65−789960+408284101.4
Table 2b. Hind County Regression Analysis
ITEMS1987199219972002rAB2007Rate
Farms (number)7997407231247.69−52056+26.5412092.2
Land in farms (acres)265611230838196393278556.02+67732+87.82439470
Average size (acres)332312272223.98s*+14924−7.34193−3.8
Cropland (acres)12663711145889203108728.64+3.14e6−152090011−1.7
Land Value260727295826334132343373.93s*−1.76e7+89654070762.2
Equipment Value26339364035108747174.89−3.04e6+1544595482.6
Table 2c. Rankin County Regression Analysis
ITEMS1987199219972002rAB2007Rate
Farms (number)551538558804.79−30461+15.588081.9
Land in farms (acres)130631118651117296130933.01+142280−8.981242660
Average size (acres)237221210163.95s*+9502−4.66150−3.1
Cropland (acres)64892589984956042395.99s*+3.12e6−153934729−4.4
Land Value175913193590297808351427.97s*−2.49e7+126154123753.1
Equipment Value27919260133159449628.84−2.79e6+1414514662.7
Table 2d. Warren County Regression Analysis
ITEMS1987199219972002rAB2007Rate
Farms (number)22219314928131−5094+2.662451.1
Land in farms (acres)10692711408397829114522.11−152180+130.61099730.1
Average size (acres)482591615408.26+8422−3.96475−0.8
Cropland (acres)60602660335119553468.69+1.50e6−724.848765−1.5
Land Value462387451281546553471906.37−4.47e7+24775139890.5
Equipment Value38431615757146773002.92s*−4.47e6+2272895202.5
Table 2e. Madison County Regression Analysis
ITEMS1987199219972002rAB2007Rate
Farms (number)502454465719.69−25872+13.247011.9
Land in farms (acres)216946198955182095192466.80+3.80e6−1806175040−1.0
Average size (acres)432438392268.88+21843−1076248−4.3
Cropland (acres)1185061170238987079845.95s*+5.81e6−286365527−4.4
Land Value374153485675512795478466.72−1.31e7+68015477871.2
Equipment Value44774469134089149322.28−258560+152.4473810.3
Table 2f. Yazoo County Regression Analysis
ITEMS1987199219972002rAB2007Rate
Farms (number)569539424566.22+5150−2.32494−0.5
Land in farms (acres)367496361634312298360129.36+3.20e6−1429332530−0.4
Average size (acres)646681737636.07−362+0.5206820.1
Cropland (acres)243770252061208619216483.77+5.23e6−2506198908−1.3
Land Value390613459849548289729113.97s*−4.35e7+220798079512.7
Equipment Value65124829018894489666.90s*−3.10e6+15931015761.7
Table 2g. Simpson County Regression Analysis
ITEMS1987199219972002rAB2007Rate
Farms (number)576587550684.63−10849+5.746710.9
Land in farms (acres)951329654093715103822.67−829940+464.91031140.5
Average size (acres)165164170152.56+1479−0.660155−0.4
Cropland (acres)42240453753899833217.83+1.37e6−668.931596−2.1
Land Value126995183459227419289082.99s*−2.09e7+106043392943.1
Equipment Value29040359013273337438.77−844830+440.5392851.1
Table 3. Selected Indicators on Housing 1999–2002
County20002002200020002002200020001999

Housing unitsHousing unitsHouseholdsHousing PermitsHousing PermitsHome ownership ratePercent of structures in multi unitMedian Household Income
Copiah11,10111,25210,14210579.9%6.9%$26,358
Hinds100,287101,95691,03087393563.9%24.1%$33,991
Madison28,78130,18127,2196061,20770.9%20.9%$46,970
Rankin45,07047,44442,0897911,25577.1%12.5%$44,946
Simpson11,30711,44710,07632381.1%6.3%$28,343
Warren20,78920,99518,756422368.2%17.9%$35,056
Yazoo10,01510,1179,1782368.8%12.7%$24,795

References

  1. Johnson, J. R.; Bloodworth, H.; Summers, D. Agricultural Land and Water Use in Mississippi, 1982–1998; Division of Agriculture, Forestry and Veterinary Medicine at Mississippi State University, 2000. [Google Scholar]
  2. Mississippi Department of Agriculture and Commerce, Agriculture at a Glance; Jackson, MS, MDAC, 2000.
  3. Mississippi Library Commission, Mississippi Seen Agriculture; MS; MLC, 2001.
  4. Ratlif, B. MSU Collection Preserves Mississippi’s Rural Past; MS; Mississippi State University, 2003. [Google Scholar]
  5. Ratlif, B. MSU Collection Preserves Mississippi’s Rural Past; MS; Mississippi State University, 2003. [Google Scholar]
  6. Schlau, J. Backyard Gardener: Mississippi Adventure; Prescott, A. Z; The University of Arizona Cooperative Extension Prescott, 2000. [Google Scholar]
  7. Johnson, J. R.; Bloodworth, H.; Summers, D. Agricultural Land and Water Use in Mississippi, 1982–1998; Division of Agriculture, Forestry and Veterinary Medicine at Mississippi State University, 2000. [Google Scholar]
  8. Reynolds, J. Urbanization and Land Use: Change in Florida and the South FL; Department of Food and Resource Economics, University of Florida, 2000. [Google Scholar]
  9. Schlau, J. Backyard Gardener: Mississippi Adventure; Prescott, A. Z; The University of Arizona Cooperative Extension Prescott, 2000. [Google Scholar]
  10. Johnson, J. R.; Bloodworth, H.; Summers, D. Agricultural Land and Water Use in Mississippi, 1982–1998; Division of Agriculture, Forestry and Veterinary Medicine at Mississippi State University, 2000. [Google Scholar]
  11. Natural Resources Conservation Service (NRCS), Summary report 1997 natural resources inventory; US Department of Agriculture, Iowa State University Statistical Laboratory, 1999.
  12. Ewing, R. Is Los Angeles-style sprawl desirable? J. of the American Planning Association 1997, 63, 1107–126. [Google Scholar]
  13. Downs, A. How America’s cities are growing: the big picture. Brookings Review 1998, 16(4), 8–12. [Google Scholar]
  14. Duncan, J. E.; et al. The search for efficient urban growth patterns; Tallahassee, FL; Florida Department of Community Affairs, 1989. [Google Scholar]
  15. Frank, J. E. The costs of alternative development patterns: a review of the literature; Urban Land Institute: Washington, DC, 1989. [Google Scholar]
  16. Kunstler, J. H. The geography of nowhere: the rise and decline of America’s man-made landscape; New York; Simon and Schuster, 1993. [Google Scholar]
  17. Freeman, L. The effects of sprawl on neighbourhood social ties. J. of the American Planning Association 2001, 67, 69–77. [Google Scholar]
  18. Carliner, M. S. Comment on Karen A. Danielsen, Robert E. Lang; William Foulton’s retracting suburbia: smart growth and the future of housing’. Housing Policy Debate 1999, 10:3, 549–553. [Google Scholar]
  19. Easterbrook, G. Comment on Karen A. Danielsen, Robert, E. Lang and William Foulton’s retracting suburbia: smart growth and the future of housing’. Housing Policy Debate 1999, 10:3, 541–547. [Google Scholar]
  20. Anonymous. Farming on the edge: a new look at the importance and vulnerability of agriculture near American cities; Washington, DC; American Farmland Trust, 1994. [Google Scholar]
  21. American Farmland Trust, Farming on the edge II; Dekalb, IL; Northern Illinois University, 1997.
  22. Natural Resources Conservation Service (NRCS), Summary report 1997 natural resources inventory; US Department of Agriculture, Iowa State University Statistical Laboratory, 1999.
  23. Sierra Club. Sprawl: the dark side of the American dream, report 98; Sierra Club: San Francisco, CA, 1999. URL: http://www.sierraclub.org/sprawl/report98/report.asp last accessed 19, May 2003.
  24. Jensen, J. R.; Cowen, D. C.. Remote sensing of urban/suburban infrastructure and socio-economic attributes. Photogram Metric Engineering and Remote Sensing 1999, 65, 611–622. [Google Scholar]
  25. Reynolds, J. Urbanization and Land Use: Change in Florida and the South; FL; Department of Food and Resource Economics, University of Florida, 2000. [Google Scholar]
  26. United States Census Bureau, State and County Quick Facts; US Census Bureau: Washington D.C, 2000a.
  27. United States Census Bureau, Population Census 1990–2000; Washington D.C; US Census Bureau, 2000b.
  28. Mississippi Department of Environmental Quality, The Pearl River Basin Status Report; Jackson, MS; MSDEQ, 2000a.
  29. Mississippi Department of Environmental Quality, The Yazoo River Basin Status Report; Jackson, MS; MSDEQ, 2000b.
  30. United States Department of Agriculture (USDA), Census of Agriculture County Profile Mississippi. In Agricultural Statistics; National Agricultural Statistics Services; Washington D.C; USDA, 1997.
  31. Mississippi Department of Environmental Quality, The Pearl River Basin Status Report; Jackson, MS; MSDEQ, 2000a.
  32. Mississippi Department of Environmental Quality, The Yazoo River Basin Status Report; Jackson, MS; MSDEQ, 2000b.
  33. Mississippi State University, Harvested Timber Volumes by County and Product; Mississippi Agricultural and Forestry Experiment Station: MS, 2000.
  34. United States Department of Agriculture (USDA), Census of Agriculture County Profile Mississippi. In Agricultural Statistics; National Agricultural Statistics Services; Washington, D.C; USDA, 1997.
  35. Mississippi Department of Environmental Quality, The Pearl River Basin Status Report; Jackson, MS; MSDEQ, 2000a.
  36. Mississippi Department of Environmental Quality, The Yazoo River Basin Status Report; Jackson, MS; MSDEQ, 2000b.
  37. United States Census Bureau, County and City Data Book; Washington D.C; US Census Bureau, 2000c.
  38. United States Census Bureau, County and City Data Book; US Census Bureau: Washington DC, 2000c.
  39. American Farmland Trust, Saving American Farmland: What Works; American Farmland Trust: Washington, DC, 1997.
  40. Furuseth, O. J.; Lapping, M. B. Contested; Countryside: The Rural Urban Fringe in North America Brookfield, V. T; Ashgate Publishing Company, 1999. [Google Scholar]
  41. Newman, P.; Kenworthy, J. Sustainability and Cities; Island Press: Washington, D.C, 1999. [Google Scholar]
  42. Daniels, T. GIS and Farmland Protection: The Case of Lancaster County, Pennsylvania. Proceedings, San Diego PA; 1997. [Google Scholar]
  43. Newman, P.; Kenworthy, J. Sustainability and Cities; Island Press: Washington, DC, 1999. [Google Scholar]
  44. Furuseth, O. J.; Lapping, M. B. Contested Countryside: The Rural Urban Fringe in North America; Brookfield, V. T; Ashgate Publishing Company, 1999. [Google Scholar]
  45. Davis, M. The Coalition to Restore Coastal Louisiana; Baton Rouge, LA; Community Sustainability Resource Institute, 1997. [Google Scholar]
  46. Yeh, A.; Xia, L. Sustainable land development model for rapid growth areas using GIS. International Geographical Information Science 1998, 12:2, 169–189. [Google Scholar]
  47. Masser, I. Managing our urban future: the role of remote sensing and geographic information systems. Habitat International 2001, 25, 503–512. [Google Scholar]
  48. Hamin, E. Legislating growth management. Journal of American Planning Association 2003, 69:4, 368–380. [Google Scholar]
  49. Jensen, J. R.; Cowen, D. C. Remote sensing of urban/suburban infrastructure and socio-economic attributes. Photogrammetric Engineering and Remote Sensing 1999, 65, 611–622. [Google Scholar]
  50. Jing, B. Integration of space syntax into GIS: new perspectives for urban morphology. Transactions In GIS 2002, 6(3), 295. [Google Scholar]

