Introduction
Arsenic is a semi-metallic poison known since ancient times. Geber, an Arab alchemist of eighth century produced arsenious oxide, from realgar which is a naturally occurring ore found in lead and iron mining, and thus one of the most cruel, deadly and widely administered poisons during the medieval history was made available to the humanity. In the modern times, the nature of arsenic threat has changed. Instead of an acute poison used as insecticide, rodenticide or homicidal/suicidal purpose, it has become a chronic poison mobilized by natural or anthropogenic reasons.
Symptoms of chronic arsenicosis are primarily manifested in the forms of different types of skin disorder such as skin lesions, hyperkeratosis and melanosis.[
1] Arsenic is classified as a Group A and Category 1 human carcinogen by the US EPA [
2] and the International Association for Research on Cancer [
3] respectively. Pandey et al. [
4] first reported the arsenic contamination and human suffering at a single village named Kourikasa in erstwhile Madhya Pradesh state. Another paper by Pandey et al. [
5] established the regional nature of the contamination and the contamination of surface water due to the probable mobilization of contaminated groundwater. The sediments of the area have also been reported to be contaminated in the affected locations of central-east India. [
6].
The presented work provides the results of detailed biochemical and other medical investigations carried out on the members of a family clinically most affected by arsenic poisoning. This study assumes importance because of the genetic peculiarities of the studied location as the area is mostly inhabited by the scheduled tribes (aboriginals) and the high arsenic levels in the drinking water. The paper also reports the various attitudinal, scientific and administrative issues which are exerting their profound impact on the management of the problem.
Materials and Methods
Samples Preparation and Initial Experiments
To quantitative assessment of arsenic exposure was done with the help of some human biomarkers. The major biomarkers studied in this work were the arsenic levels in urine, hairs and nails. The sample of urine and hairs were collected by organizing voluntary medical check-up camps in the village Kourikasa and by random collection in other affected locations. Clinical symptoms of the arsenicosis were the major criteria for the selection of subjects. The urine samples were collected in pre-cleaned bottles and were kept in icebox immediately after collection. These samples were analyzed within one day after collection.
All major bio-chemical and medical examinations were carried out on a group of patients comprising all members of a worst affected family. These patients were persuaded to undergo the medical examination and were brought and put-up in Bhilai for about six days. The age of the head of family was 59 years, wife was 50 years and the three daughters were aged 23, 22, 21 respectively and the son was 24 years. These patients were brought and put-up in Bhilai for about six days under informed consent. The samples of body fluids viz. blood and urine were drawn and analyzed in Pt. J. L. N. Hospital and Research Center, Bhilai. The tests which were carried out are Hemoglobin (gm%), TLC /mm, Polymorphs (%), Lymphocytes (%), Monocytes (%), Eosinophiles (%), Urine albumin, Sugar (%), Microscopic examination, S. Creatinine (mg%), SGPT (u/l), ECG, and the Q.T. intervals (sec.). The standard medical procedures, practices and instruments were employed for the analysis.
Analytical Methods
Analysis of the arsenic levels in the biological fluids, hairs and nails was carried out in our laboratory following the standard methods of digestion and analysis. The hydride generating atomic absorption spectrophotometry (HGAAS), which is the most common analytical procedure for measuring arsenic in biological materials, was employed. Samples were prepared by the nitric/sulphuric acid digestion procedure. Next, the arsenic in the digestate was reduced to the trivalent form with tin chloride or KI. The trivalent arsenic was then converted to a volatile hydride using hydrogen produced by sodium borohydride. The volatile hydride was swept into an oxy-acetylene flame located in the optical path of an atomic absorption spectrophotometer. The resulting absorption of the lamp radiation was proportional to the arsenic concentration. The typical detection limit for this method was 0.002 mg/L. The salient details of the methods adopted for the presented work are given (
Table 1).
Systematic Clinical Examination
Systematic clinical examination, headed by Dr. P. Binayake, Sr. Medical Officer, was carried out in assistance with qualified medical officers of Pt. Jawahar Lal Nehru (J. L. N.) Hospital and Research Centre, Bhilai. It was. Detailed survey questionnaire was also prepared and were filled-in by our team thorough interview of the people in the affected area. Medical check-up camps were organised with the help of Government officials where the systemic examination was carried out.
Bio-chemical/Medical Examinations
The sample of urine and hairs were collected by organizing medical check-up camps in the village Kourikasa and by random collection in other affected locations. Clinical symptoms of the arsenicosis were the major criteria for the selection of subjects. Blood samples were collected from taking all aseptic precautions. The instruments and glassware used to store and process the blood was soaked overnight in 10% concentrated nitric acid then washed properly with detergent and rinsed in double distilled water. Urine samples were collected for the estimation of arsenic in acid washed sterilized bottles after discarding the first stream of urine and the samples were immediately put in the ice-box. Heparinised blood was collected in sterilized vials. Blood and urine samples were digested immediately after collection by adding concentrated Nitric acid and 30% Hydrogen peroxide. Digestion was carried out in Teflon-bomb at 100°C for 6-hrs in hot air oven. Dilution to appropriate volume was finally made with triple distilled water. The digested samples were finally stored at −20°C till analysis.
The samples of body fluids were drawn and analysed in Pt. J. L. N. Hospital and Research Centre following the standard medical practices. In brief, for the analysis of ALT, 0.1 ml of serum sample was made to react with 5 ml of the substrate solution (L-alanine) and incubated for 30 minutes at 37°C. This was followed by addition of 0.5 ml of dintrophenolhydrazine (DNPH) and then by 0.4 N NaOH. The absorbance was measured at 510 nm. The enzyme activity was determined from the standard curve drawn using sodium pyruvate as standard solution. For AST 0.1 ml of sample was made to react with 0.5 ml of the substrate solution L-asparate and was incubated for 60 minutes at 37°C. The absorbance was measured at 510 nm. Haemoglobin was analysed by spectrophotometeric cyanmethemoglobin method. The TEC was measured by Haemocytometer using Grower’s solution as diluting fluid and DLC was determined by Leishman’s – Giemsa stain method.
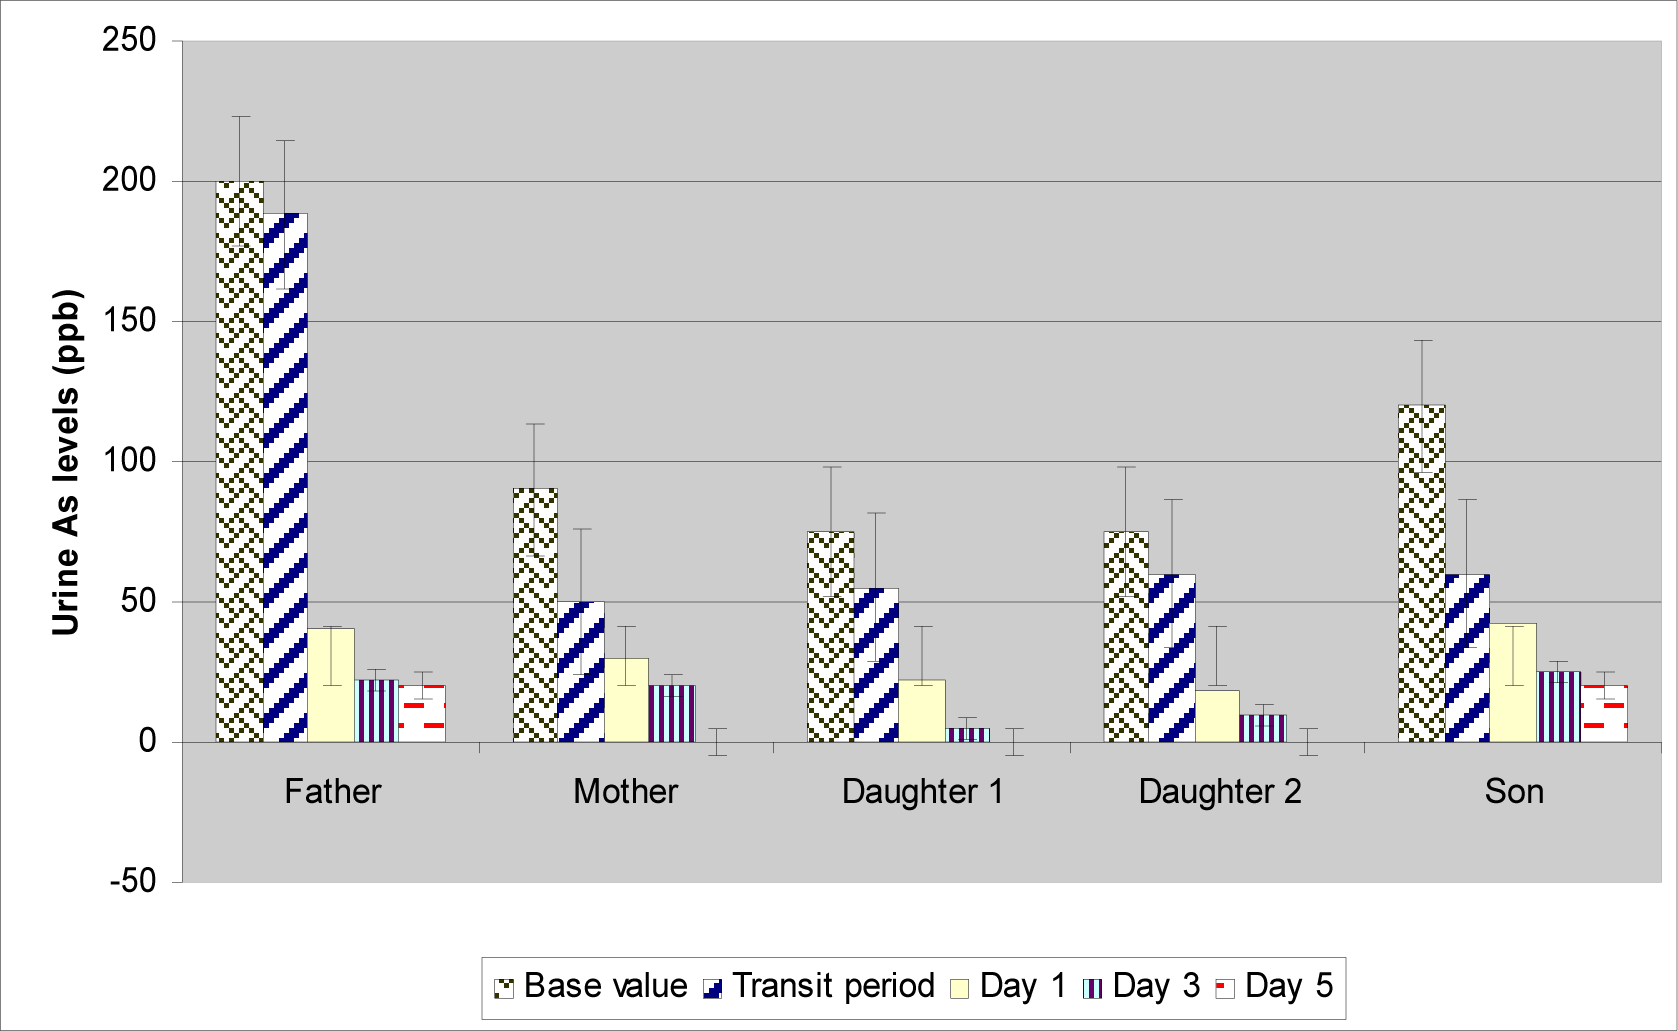
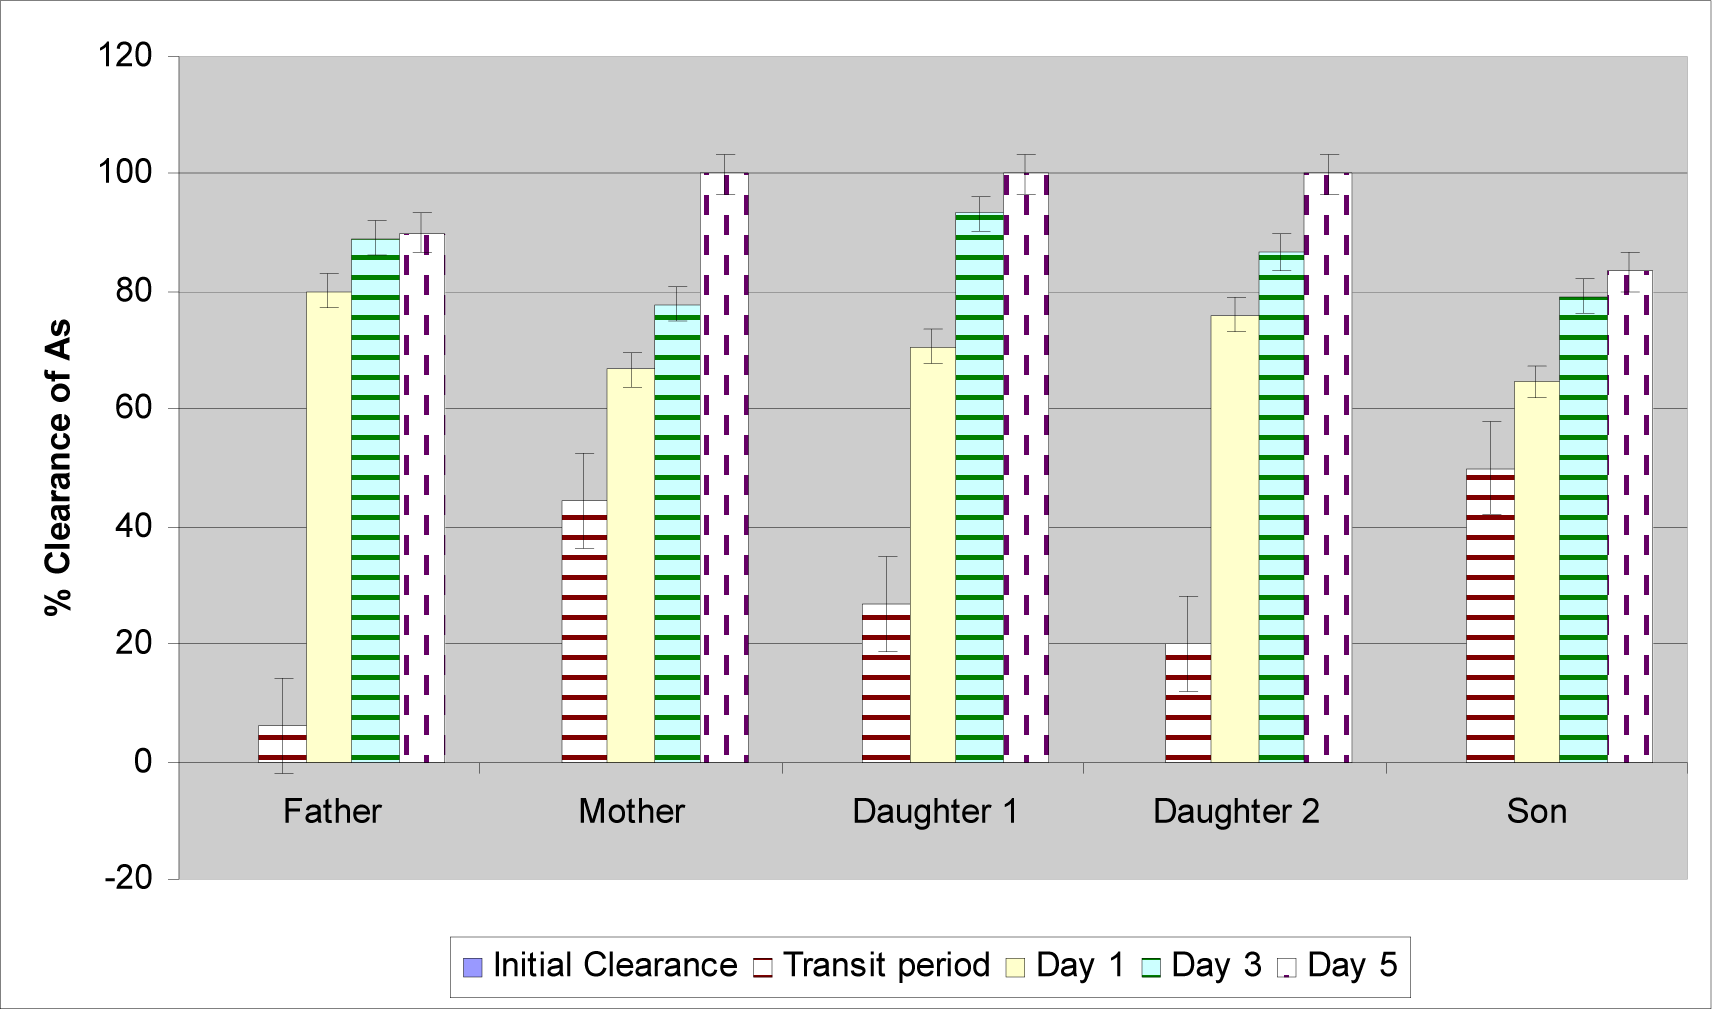
This study has also made an effort to find out the half-life of the arsenic in four subjects having different levels of clinical manifestations of arsenicosis (i. e. the different body burden of arsenic). For the purpose of study, the subjects the arsenic levels were measured in the urine sample collected in village Kourikasa. Then the patients were brought to Bhilai city and kept on a diet free from arsenic. Urine samples were collected for the six consecutive days. The transit value means the arsenic in urine samples collected while the subjects were traveling to Bhilai and were having no ingestion of arsenic. The electrocardiography test was carried out on about 10 patients of the area following the standard medical/instrumental procedure.
Hair samples were collected from the scalp region of the subjects with the help of a stainless steel scissor and were kept individually in polythene packets at room temperature to determine arsenic level in hair. Samples were washed with absolute alcohol and then with soap and water followed by rinsing with double distilled water. Acid digestion with wet ashing with nitric/sulfuric acids and hydrogen peroxide was the method of digestion for hair samples.
Results and Discussion
Clinical Study of Arsenic Patients and Correlation with Drinking Water Contamination
The extensive clinical analyses on the affected people of Kourikasa and other affected locations showed that the arsenicosis symptoms are manifest even at an age of 2 years and there is a continuous increase in the number of patients up to the age twenty years where maximum numbers of patients are noted (35%). This roughly corresponds to the time when the people switched over to using hand pump as depicted in
Table 2. The family under consideration of this study was consuming the water of hand pump no. 5 (HP 5), which was dug-up in the year 1988. Hence, till the year 1999 they had been exposed to the arsenic for about a decade if it is assumed that the water of the hand pump was contaminated since beginning.
Total Arsenical Body Burden
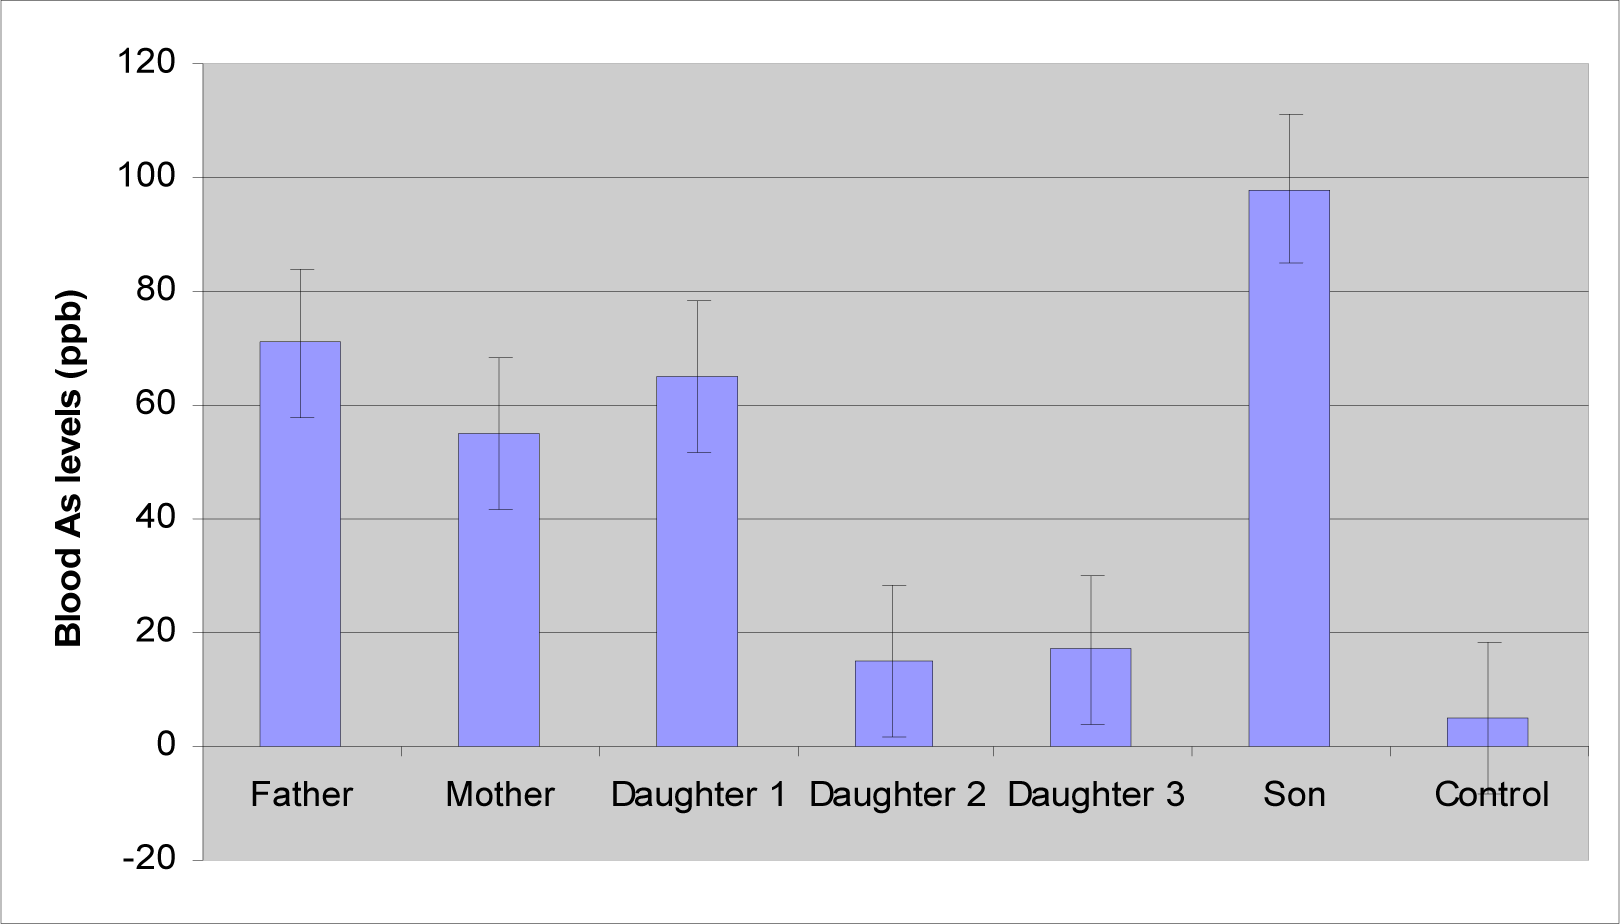
Figure 4 presents a composite picture of body burden of arsenic as observed in the family. This confirms pronounced chronic exposure of the arsenic to these people. It may be further noted that the substitution of the arsenic free regime may be expected to improve the situation. Yet, the effects are likely to continue for the foreseeable future.
Combined statistical analysis has shown mean arsenic levels of 49.6 μg/L in the blood, 57.7 μg/L in the urine, 1114 μg/kg As in hairs and 1137.2 μg/kg in the nails. These values are consistent with the normal dose-repose conditions prevailing in the study area (
Table 5).
Correlation Study on the Arsenic Levels in the Body and Age
A combined correlation study on the arsenic levels measured in whole blood, urine, hair, nails and age presents a remarkable outcome. The results show (
Table 6) that the arsenic levels in blood is negatively correlated with the urine arsenic levels. This means that an inadequacy of renal system in cleaning the blood arsenic will result in higher blood arsenic levels and vice-versa. On the other hand the urine arsenic levels have shown a significant, negative correlation with the age which testifies to the decrease in the functionality of the urinary system with the increase in age and the longer arsenical exposure. Similarly, the hair and nails have shown a high positive correlation amongst them and age, which, proves, continued accumulation of arsenic because of prolonged exposure of arsenic in the subjects.
Haematological Effects of Arsenic on Humans in Studied Locations
Acute and subacute poisoning is known to result in anaemia, leucopoenia, and thrombocytopoenia. Arsenic is known to cause haemolysis and/or bone marrow suppression, which generally results in normocytic and megaloblastic anaemia [
9–
10]. These changes have also been reported to be reversible by Rezuke et al. [
11]
However, no associations between the arsenic ingestion and haematological abnormality have been reported on exposure to low doses of arsenic [
12–
15]. The arsenic in drinking water in above studies was ranged from 0.001–2.45 mg/L. Opposed to that, in this study, most of the patients who have exposed to arsenic were found to be suffering from mild to severe anaemia. The prevalence percent was more than 70% in arsenicosis patients, and only 20% prevalence in control population. The other symptoms observed on haematological analysis are Eosinophilia, Microscopic heamaturia, leucocytosis and microcytic hypochromic RBC. Other measurements within the complete blood count were also correlated with mean drinking water arsenic concentration.
Table 7 present results of complete blood and urine analysis in the members of single family. Based on above tests and clinical examinations the established positive findings are hepatic enlargement, anemia, pronounced urinary tract infection dibetes mellitus, leucocytosis, eosinophilia, microscopic heamaturia, moderate yoikiotocytosis, microcytic hypochromic and the presence of target and fragmented cells.
There had been many nagging questions regarding arsenic viz. are blood arsenic levels a good indicator of chronic exposure, after external exposure to arsenic is discontinued, how long does it take for the body to purge bound and circulating accumulated arsenic, which may constitute a continuing internal exposure. Based on this work it is clear that the blood arsenic level is a good indicator of recent arsenic exposure. Further, the accumulated arsenic may take a very long time for purging if the exposed person is kept in the same surrounding where he was exposed to the high arsenic levels in water.
Effect of Substitution of Contaminated Water with Low Contamination Water on Arsenicosis Patients
Subsequent to the first publication of our reports of arsenic contamination of the groundwater sources and its confirmation by other agencies, the majority of the contaminated sources were sealed and a community source of water was identified in the year 2000. This source was a deep tube well the water of which was certified free from arsenic by National Environmental Engineering Research Institute, NEERI (personal communication). Hence, the effect of substitution of contaminated water with low contamination water on arsenicosis patients was also studied.
Arsenicosis studies from Taiwan [
16–
20] reported mild improvement in the skin and neurological manifestations on stoppage of arsenic contaminated water but increased incidence of neurological, cardio-vascular, cerebro-vascular and metabolic disease in the formerly arsenic exposed population. Our study supports the observation to the extent that the switchover to less contaminated water has not reversed the arsenicosis progression in the already affected persons even after six years (
Fig. 5). The skin and neurological symptoms viz. tingling, and numbness have decreased up to some extent but the haematological and cardio-vascular problems are increasing. The repeat medical examination of some patients (n = 28) shows the continued or increased presence of mild to severe anaemia, eosinophilia, microscopic heamaturia, and diabetes mellitus. Further new cases of arsenicosis in the region are being registered who have been exposed to lower arsenic levels. In such circumstances, setting a dose-response relationship appears difficult. Rather, there is a need to find out the dose-time-response paradigm as the lower arsenic levels take a longer time to display the similar clinical manifestations as could be seen at higher doses in shorter time period.
The urinary arsenic levels do reflect the lower levels of arsenic as evident by three separate samplings carried out in the year 2000 and 2001 and 2006. Yet, the increasing number of cases of diabetes mellitus could be an indication of the probable endocrine disruption in the exposed persons. The real picture regarding the endocrine effects could be available only by an exhaustive study involving large number of people. Hence, this work suggests it as a future area of multidisciplinary research.
Response of the Regulatory Agencies in Developing World to the Arsenic Problem
From our experience in the central Indian locations, we have observed that the response from the government agencies could follow either one or all of the following: there is no problem of the arsenic contamination; the reported results by any agency (other than them!) are flawed, the levels of arsenic are well below the safe level, we have taken the adequate precaution and new drinking water sources have been provided, the problem is a limited one and now stands solved.
This attitude of putting the things under wrap is the real impediment in solving the problem of arsenic contamination in developing countries like India and Bangladesh. The lack of awareness and ignorance to the fundamental right of the safe drinking water in the affected population further compounds the problem. In the affected location, we have noted that people resign to their fate considering it as a curse of the God. Hence, in spite of our growing scientific knowledge the ground realities are grim and call for unrelenting efforts encompassing scientific and social measures.
Conclusion
This study has successfully monitored three biomarkers i.e. total arsenic in hair and nails, total arsenic in blood, and total arsenic in urine to identify or quantify arsenic exposure. A clear correlation between the clinically observable symptoms, the blood and urine arsenic level, and the arsenic intake through drinking water has been established. The intensive study on the urinary arsenic levels and the urine sufficiency confirms pronounced chronic exposure of the arsenic to these people. The combined correlation study on the arsenic levels measured in whole blood, urine, hair, nails and age present a remarkable outcome i.e. the arsenic levels in blood are negatively correlated with the urine arsenic levels, which indicate either the inadequacy of the renal system in cleaning the blood arsenic or a continuous re-circulation of the accumulated arsenic. The patients having highest body burden of arsenic (as correlated with the clinical symptoms) were having longer half-life of arsenic and vice-versa. Also there was a sharp decrease in the urine arsenic levels when the subjects were kept on arsenic free regime.
This work also makes it clear that the blood arsenic level is a good indicator of recent arsenic exposure. In the affected area the substitution of the contaminated source with less contaminated sources reflect the lower levels of urinary arsenic. Yet the effects of arsenicosis are far from over. The response of the regulatory agencies in the area to the arsenic problem is not supportive scientifically or socially.


