Assessment of Water Quality in Asa River (Nigeria) and Its Indigenous Clarias gariepinus Fish


Abstract
:1. Introduction
2. Materials and Methods
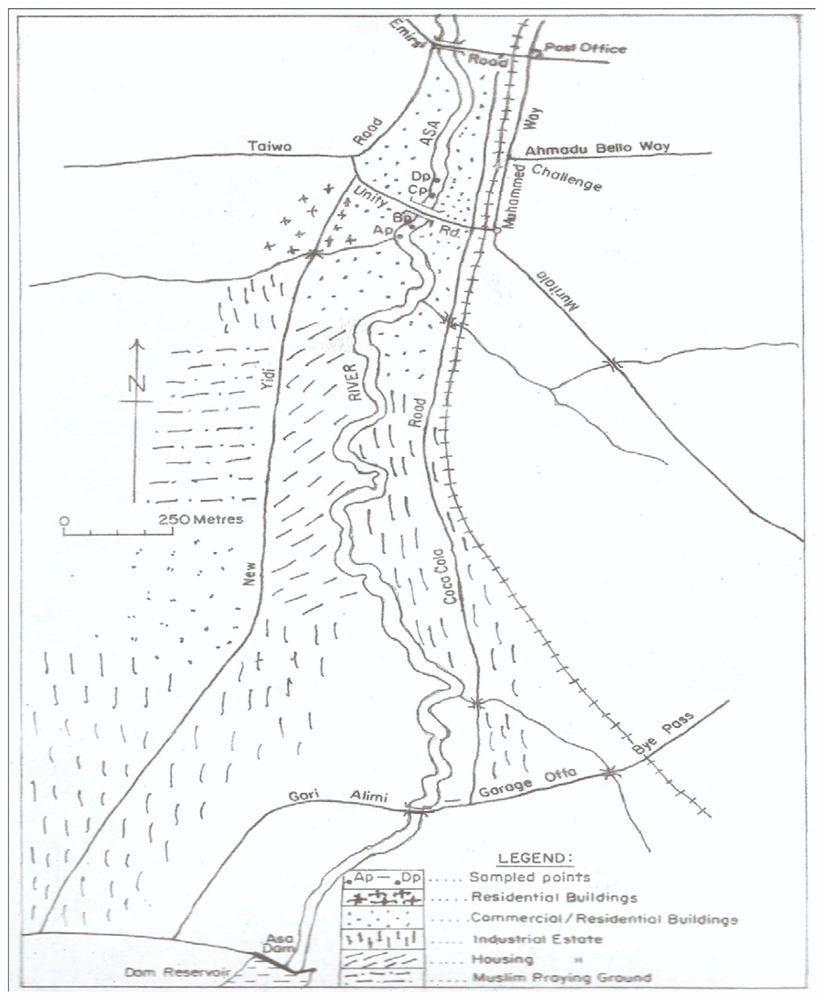
2.1. Study Area
2.2. Water Sampling
2.3. Fish Sampling and Tissue Preparation
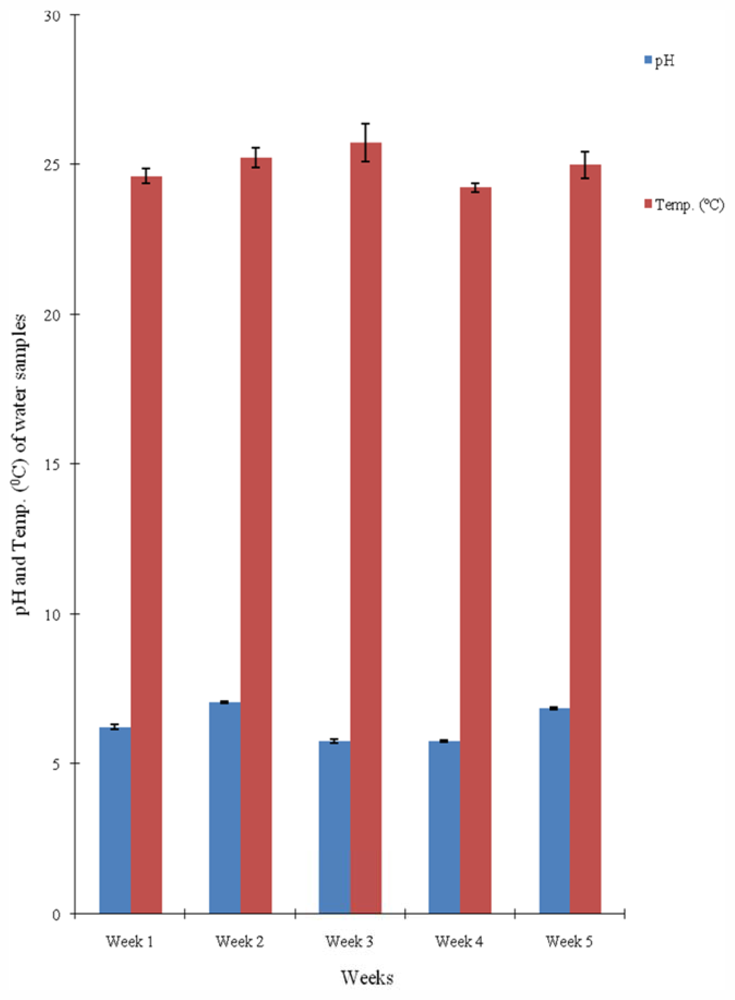
2.4. Physico-Chemical Analysis
2.5. Bacteriological Analysis
2.6. Histological Investigations
2.6.1. Examination for Alteration in General Tissue Structure
2.6.2. Sectioning
2.6.3. Haematoxylin and Eosin (H and E) Staining for General Tissue Structure
2.6.4. Examination of Bacterial Density in Tissues
2.7. Statistical Analysis
3. Results
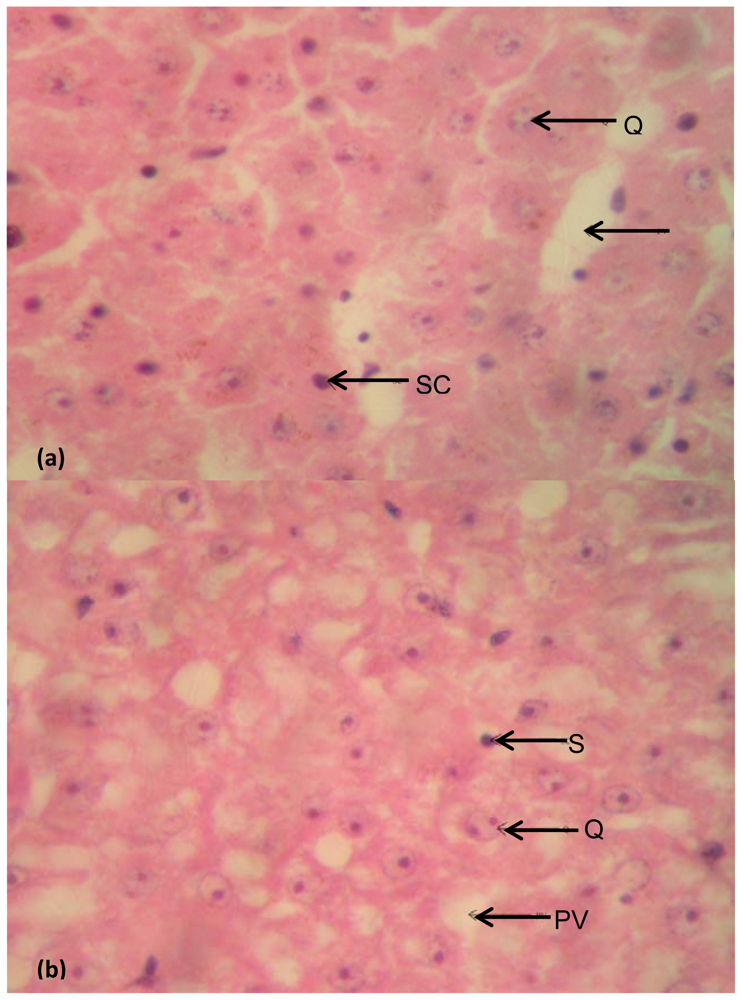
Liver
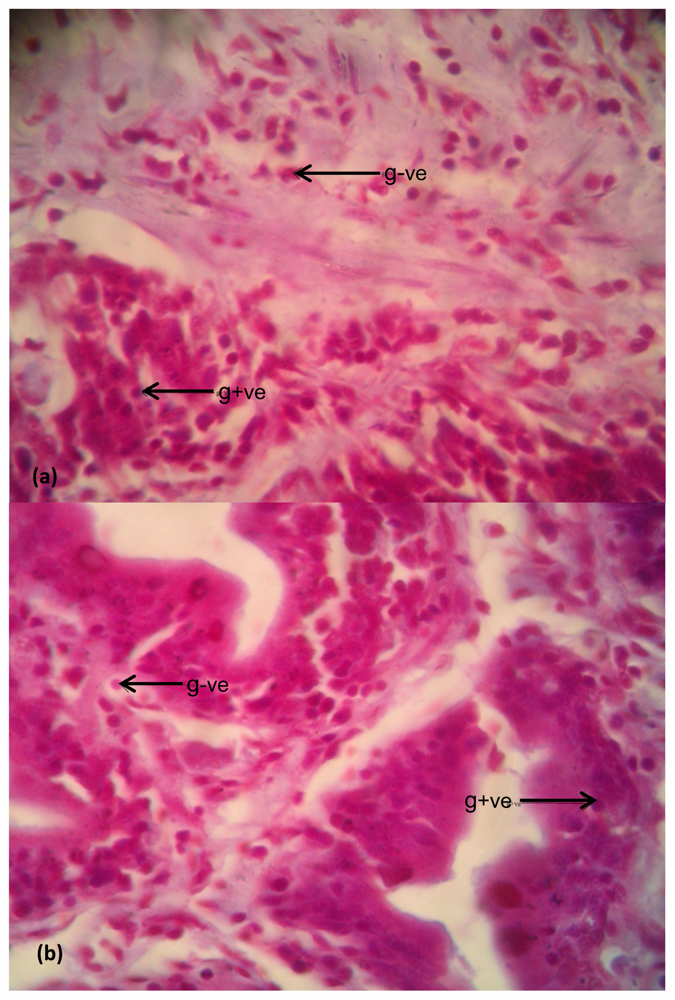
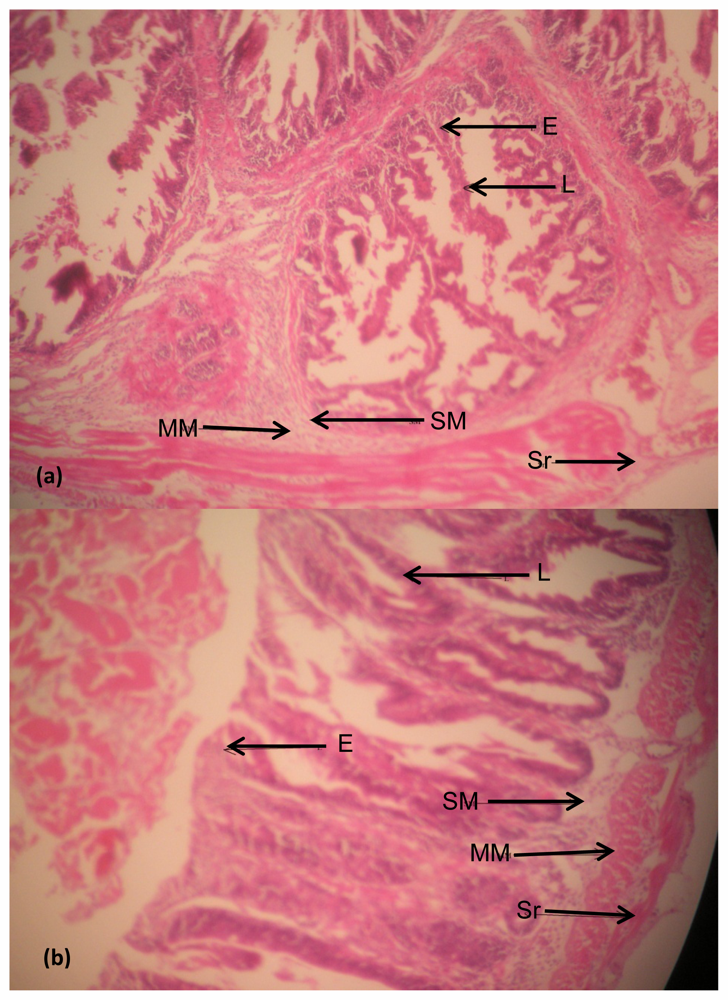
Intestine
Bacteria in Liver
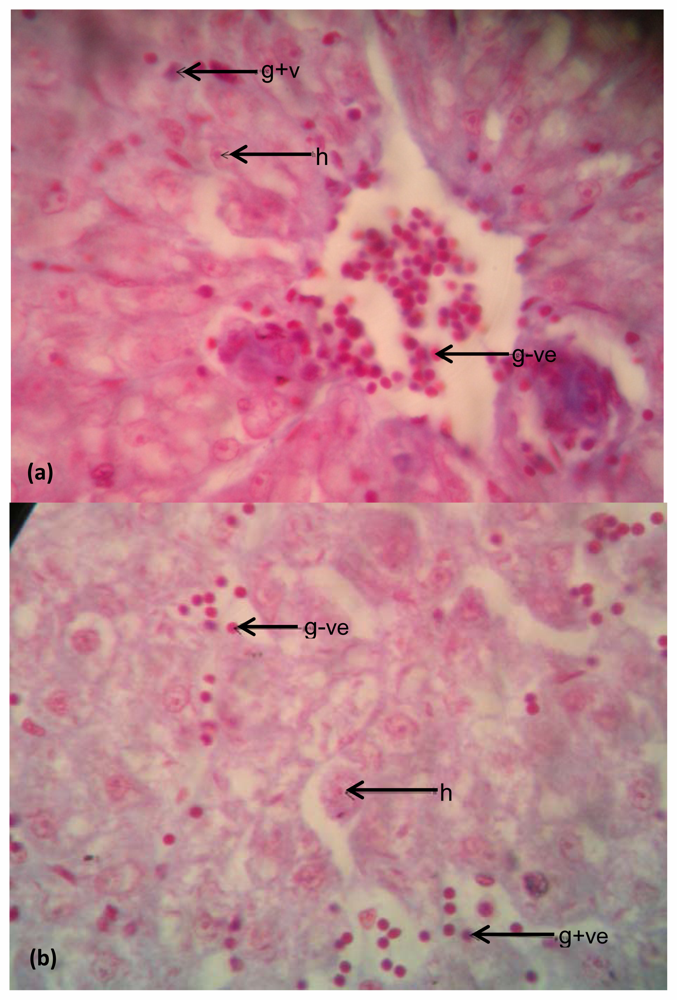
Bacteria in Intestine
4. Discussion
5. Conclusions
Acknowledgements
- Conflict of Interest StatementsThe authors declare no conflict of interest.
References
- United Nations Environment Programme Global Environment Monitoring System/Water Programme, Water Quality for Ecosystem and Human Health; National Water Research Institute: Burlington, ON, Canada, 2000.
- Stark, J.R.; Hanson, P.E.; Goldstein, R.M.; Fallon, J.D.; Fong, A.L.; Lee, K.E.; Kroening, S.E.; Andrews, W.J. Water Quality in the Upper Mississippi River Basin, Minnesota, Wisconsin, South Dakota, Iowa, and North Dakota, 1995–98; United States Geological Survey: Reston, VA, USA, 2001. [Google Scholar]
- Kolawole, O.M.; Ajibola, T.B.; Osuolale, O.O. Bacteriological Investigation of a wastewater discharge run-off stream in Ilorin, Nigeria. J. Appl. Environ. Sci. 2008, 4, 33–37. [Google Scholar]
- Koshy, M.; Nayar, T.V. Water quality aspects of River Pamba. Pollut. Res. 1999, 18, 501–510. [Google Scholar]
- Hammer, M.J. Water and Wastewater Technology, 5th ed; Practice-Hall Inc.: Upper Saddle River, NJ, USA, 2004; pp. 139–141. [Google Scholar]
- Mohammed, F.A.S. Histopathological studies on Tilapia zilli and Solea vulgaris from lake Quran, Egypt. World J. Fish Mar. Sci. 2009, 1, 29–39. [Google Scholar]
- Gerardi, M.H.; Zimmerman, M.C. Wastewater Pathogens; John Wiley & Sons, Inc.: Hoboken, NJ, USA, 2005; pp. 3–4. [Google Scholar]
- Adekunle, A.S.; Eniola, I.T.K. Industrial effluents on quality of segment of Asa River within an industrial estate in Ilorin, Nigeria. New York Sci. J. 2008, 1, 17–21. [Google Scholar]
- Maduka, H.C.C. Water Pollution and Man’s Health in Environmental Degradation, Reclamation, Conservation and Pollution Control for the Rural Women and the Youths; Green Line Publishers: Ado Ekiti, Nigeria, 2004; pp. 198–203. [Google Scholar]
- Chandra, R.; Singh, S.; Raj, A. Seasonal bacteriological analysis of Gola River water contaminated with pulp paper mill waste in Uttaranchal, India. Environ. Monit. Assess. 2006, 118, 393–406. [Google Scholar]
- World Health Organization (WHO), Guidelines for Drinking Water Quality: Surveillance and Control of Communities Supplies, 2nd ed; WHO: Geneva, Switzerland, 1997; Volume 3.
- American Public Health Association (APHA), Standard Methods for the Examination of Water and Wastewater, 15th ed; APHA: Washington, DC, USA, 1981.
- Brenner, K.P.; Rankin, C.C.; Roybal, Y.R., Jr; Stelma, G.N.; Scarpino, P.V.; Dufour, A.P. New medium for the simultaneous detection of total coliforms and Escherichia coli in water. Appl. Environ. Microbiol. 1993, 59, 3534–3544. [Google Scholar]
- Grant, M.A. A new membrane filtration medium for simultaneous detection and enumeration of Escherichia coli and total coliform. Appl. Environ. Microbiol. 1997, 63, 3526–3530. [Google Scholar]
- Wester, P.W.; Canton, J.H. The usefulness of histopathology in aquatic toxicity studies. Comp. Biochem. Physiol. C 1991, 100, 115–117. [Google Scholar]
- Thophon, S.; Kruatrachue, M.; Upathan, E.S.; Pokethitiyook, P.; Sahaphong, S.; Jarikhuan, S. Histopathological alterations of white seabass, Lates calcarifer in acute and subchronic cadmium exposure. Environ. Pollut. 2003, 121, 307–320. [Google Scholar]
- Camargo, M.M.P.; Martinez, C.B.R. Histopathology of gills, kidney and liver of a neotropical fish caged in an urban stream. Neotrop. Ichthyol. 2007, 5, 327–336. [Google Scholar]
- Hinton, D.E.; Baumann, P.C.; Gardner, G.R.; Hawkins, W.E.; Hendricks, J.D.; Murchelano, R.A.; Okihiro, M.S. Histopathologic Biomarkers. In Biomarkers—Biochemical, Physiological and Histological Markers of Anthropogenic Stress; Hugget, R., Kimerle, R., Mehrle, P., Bergman, H., Eds.; Lewis Publishers: Boca Raton, FL, USA, 1992; pp. 155–195. [Google Scholar]
- Schwaiger, J.; Wanke, R.; Adam, S.; Pawert, M.; Honnen, W.; Triebskorn, R. The use of histopatological indicators to evaluate contaminant-related stress in fish. J. Aquat. Ecosyst. Stress Recov. 1997, 6, 75–86. [Google Scholar]
- Teh, S.J.; Adams, S.M.; Hinton, D.E. Histopathological biomarkers in feral freshwater fish populations exposed to different types of contaminant stress. Aquat. Toxicol. 1997, 37, 51–70. [Google Scholar]
- Eletta, O.A.; Adekola, F.A.; Aderanti, M.A. Assessment of Asa River: Impact of waste discharge from soft drink plant into Asa River, Ilorin. Nigerian J. Appl. Sci. Environ. Mgt. 2005, 9, 187–190. [Google Scholar]
- Ademoroti, C.M.A. Standard Methods for Water and Effluents Analysis; Foludex Press Ltd.: Ibadan, Nigeria, 1996; pp. 1–49. [Google Scholar]
- Ochei, J.O.; Kolhatkar, A.A. Medical Laboratory Science: Theory and Practice; Tata McGraw-Hill Publishing Company Ltd.: New Delhi, India, 2004; pp. 530–831. [Google Scholar]
- Tang, Y.; Strattom, C.W. Advanced Techniques in Diagnostic Microbiology; Springer Science/Business Media: New York, NY, USA, 2006; pp. 84–116. [Google Scholar]
- Avwioro, O.G. Histochemistry and Tissue Pathology—Principles and Techniques, 1st ed; Claverianum Centre: Ibadan, Nigeria, 2002. [Google Scholar]
- United States Environmental Protection Agency (US EPA), Bacteriological Ambient Water Quality Criteria for Marine and Fresh Recreational Waters; Office of Water Regulations and Standards Division: Washington, DC, USA, 1986; pp. 1–60.
- WHO, Drinking Water Guidelines: Bacteriological Parameters; WHO: Geneva, Switzerland, 2002; Volume 13.
- Water Quality Assessments: A Guide to the Use of Biota, Sediments and Water in Environmental Monitoring, 2nd ed; Chapman, D. (Ed.) Chapman and Hall: London, UK, 1996.
- Fransolet, G.; Villers, G.; Masschein, W.J. Influence of temperature on bacterial development in waters. Ozone Sci. 1985, 7, 205–227. [Google Scholar]
- Oladiji, A.T.; Adeyemi, O.; Abiola, O.O. Toxicological evaluation of the surface water of Amilegbe River using rats. Niger. Soc. Exper. Biol. Biochem. 2004, 16, 94–101. [Google Scholar]
- United States Environmental Protection Agency (US EPA). Volunteer Stream Monitoring: A Methods Manual; EPA 841-B-97-003. US EPA: Washington, DC, USA, 1997. Available online: http://www.epa.gov/owow/monitoring/volunteer/stream/ accessed on 4 July 2006.
- Lee, G.F.; Jones-Lee, A. Landfills and Groundwater Pollution Issue Dry Tomb vs. F/L Wet Cell. Proceedings of Sardinia 93: Fourth International Landfill Symposium, Cagliari, Italy, 11–15 October 1993; pp. 1–10.
- Droppo, I.G.; Ongley, E.D. Flocculation of suspended sediment in rivers of Southeastern, Canada. Water Res. 1994, 28, 1799–1809. [Google Scholar]
- Hoch, B.; Berger, B.; Kavka, G.; Herndl, G.J. Remineralization of organic matter and degradation of the organic fraction of suspended solids in the River Danube. Aquatic Microb. Ecol. 1995, 9, 279–288. [Google Scholar]
- Niemi, J.S.; Heitto, L.; Niemi, R.M.; Anttilahuhtinen, M.; Malin, V. Bacteriological purification of the Finninh River Kymi. Environ. Monit. Assess. 1997, 46, 241–253. [Google Scholar]
- Water Quality Monitoring: A Practical Guide to the Design and Implementation of Freshwater Quality Studies and Monitoring Programmes; Bartram, J.; Ballance, R. (Eds.) Chapman and Hall: London, UK, 1996.
- Donderski, W.; Wilk, W. Bacteriological studies of water and bottom sediments of the Vistula River between Wyszogrod and Torun. Pol. J. Environ. Stud. 2001, 11, 33–40. [Google Scholar]
- Ramanibai, R. Seasonal and spatial abundance of pollution indicator bacteria in Buckingham canal madras. Indian J. Environ. Prot. 1996, 17, 110–114. [Google Scholar]
- World Health Organization, Guidelines for Drinking Water Quality: Incorporating First Addendum, 3rd ed.; WHO: Geneva, Switzerland, 2006; Volume 1.
- Mansour, S.A.; Sidky, M.M. Ecotoxicological studies: The first comparative study between Lake Garun and Wadi El-Rayan (Egypt), with respect to contamination of their major components. Food Chem. 2003, 82, 181–189. [Google Scholar]
- Mohammed, F.A.; Gag, N.S. Environmental pollution-induced biochemical changes in tissues of Tilapia zillii, Solea vulgaris and Mugil capito from Lake Qarun, Egypt. Global Vet. 2008, 2, 327–336. [Google Scholar]
- Secombes, C.J.; Fletcher, T.C.; White, A.; Costello, M.; Stagg, R.; Houlihan, D. Effects of sewage sludge on immune responses in the dab. Limanda mimanda. Aquat. Toxicol. 1992, 23, 217–220. [Google Scholar]
- Saxena, M.P.; Saxena, H. Histopathological changes in lymphoid organs of fish after exposure to water polluted with heavy metals. Int. J. Vet. Med. 2008, 5, 1–3. [Google Scholar]
- Ayandiran, T.A.; Fawole, O.O.; Adewoye, S.O.; Ogundiran, M.A. Bioconcentration of metals in the body muscle and gut of Clarias gariepinus exposed to sublethal concentrations of soap and detergent effluent. J. Cell Animal Biol. 2009, 3, 113–118. [Google Scholar]
- Gabriel, U.U.; Mark, P.; Orlu, E.E. Toxicity and behavioural changes in Heterobranchus bidorsalis fingerlings treated with a micronutrient. Fertilizer, agrolyser. Res. J. Environ. Earth Sci. 2009, 1, 34–38. [Google Scholar]
- Ololade, I.A.; Oginni, O. Toxic stress and haematological effects of nickel on African catfish, Clarias Gariepinus, fingerlings. J. Environ. Chem. Ecotoxicol. 2010, 2, 14–19. [Google Scholar]
- Strauss, M. Survival of excreted pathogens in excreta and faecal sludges. IRCWD News 1985, 23, 4–9. [Google Scholar]


| Parameter measured | Sampling Points | |||
|---|---|---|---|---|
| Ap (point 1) | Bp (point 2) | Cp (point 3) | Dp (point 4) | |
| pH | 6.43 ± 0.25 a | 6.32 ± 0.28a | 6.33 ± 0.30 a | 6.32 ± 0.26 a |
| Temp. (°C) | 25.20 ± 0.56 a | 24.50 ± 0.22 a | 24.90 ± 0.46 a | 25.30 ± 0.25 a |
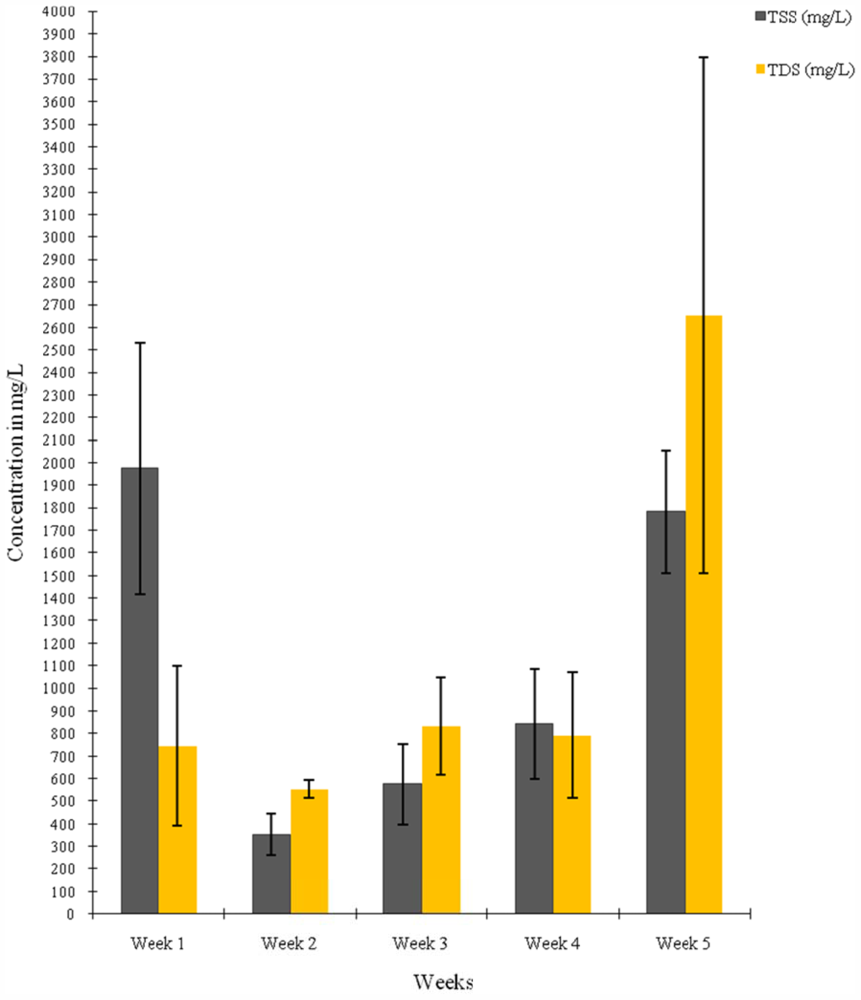
| TSS (mg/L) | 1,163.40 ± 242.23 b | 993.40 ± 267.81 b | 766.60 ± 347.47 b | 1,498.60 ± 627.78 b |
| TDS (mg/L) | 1,201.40 ± 308.14 b | 1,799.80 ± 1072.71 b | 704.60 ± 231.53 b | 754.60 ± 198.71a |
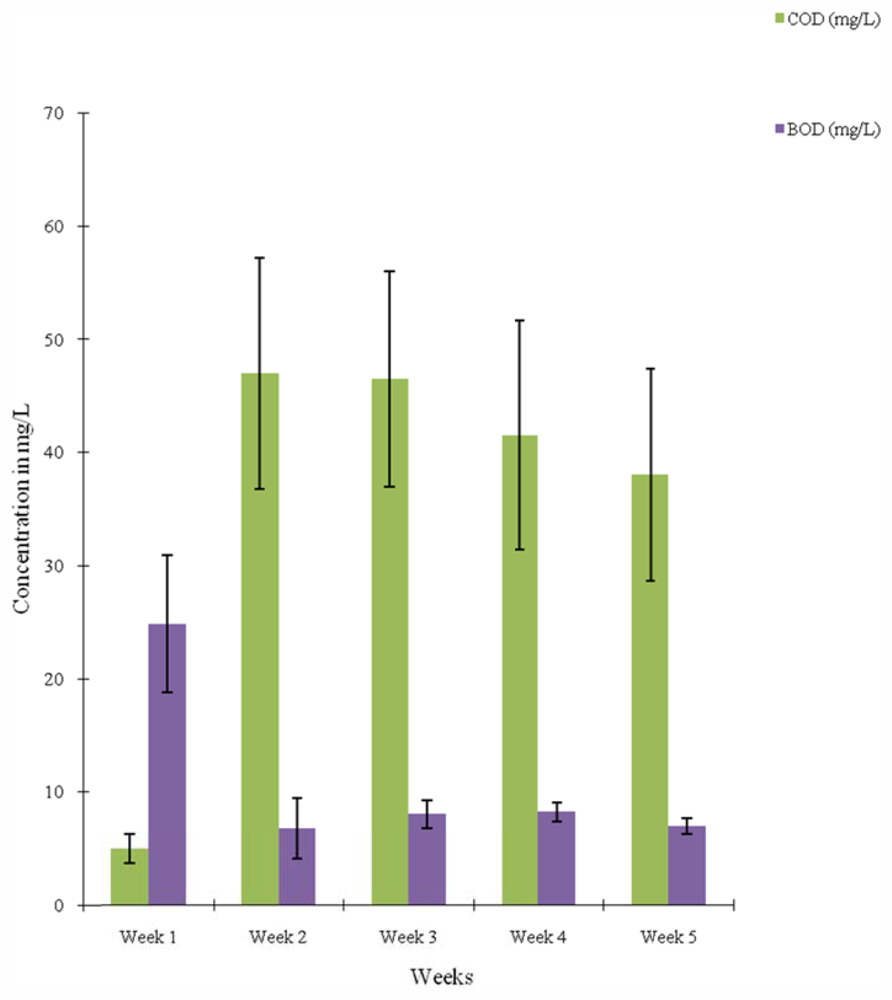
| COD (mg/L) | 33.60 ± 7.78 a | 58.40 ± 13.21a | 27.20 ± 5.12 a | 23.20 ± 5.43a |
| BOD (mg/L) | 14.00 ± 7.15 a | 12.12 ± 2.68a | 11.28 ± 2.38 a | 6.48 ± 2.10 a |
| Sampling Points | Total Heterotrophic count (TH) (cfu/mL) | Total Coliform count (TC) (cfu/100mL) | Total Thermotolerant Coliform count (TTC) (cfu/100mL) | Freshwater Quality Standard Limit (Faecal coliforms per 100 mL) * |
|---|---|---|---|---|
| Ap (point 1) | 1.24 × 10⁴ ± 2,891.27 a | 3.56 × 10³ ± 844.16 a | 2.99 × 10³ ± 767.03 a | 200 |
| Bp (point 2) | 1.24 × 10⁴ ± 3,414.67 a | 4.50 × 10³ ± 804.36 a | 2.49 × 10³ ± 641.57 a | 200 |
| Cp (point 3) | 1.79 × 10⁴ ± 6,615.26 a | 5.24 × 10³ ± 1,088.39 a | 3.22 × 10³ ± 701.00 a | 200 |
| Dp (point 4) | 1.09 × 10⁴ ± 2,309.46 a | 3.84 × 10³ ± 946.89 a | 2.88 × 10³ ± 876.58 a | 200 |
| Sampling Period | Total Heterotrophic count (TH) (cfu/mL) | Total Coliform count (TC) (cfu/100mL) | Total Thermotolerant Coliform count (TTC) (cfu/100mL) | Freshwater Quality Standard Limit (Faecal coliforms per 100 mL) * |
|---|---|---|---|---|
| Week 1 | 1.12 × 10⁴ ± 2,015.564 ab | 3.77 × 10³ ± 311.92 a | 2.67 × 10³ ± 661.28 ab | 200 |
| Week 2 | 1.84 × 10⁴ ± 3084.47 b | 6.07 × 10³ ± 878.80 b | 3.80 × 10³ ± 435.89 bc | 200 |
| Week 3 | 1.50 × 10⁴ ± 408.25 ab | 6.20 × 10³ ± 906.46 b | 4.80 × 10³ ± 624.50 c | 200 |
| Week 4 | 1.77 × 10⁴ ± 8,410.06 ab | 3.05 × 10³ ± 723.99 a | 1.96 × 10³ ± 366.59 a | 200 |
| Week 5 | 4.70 × 10³ ± 624.50 a | 2.32 × 10³ ± 232.29 a | 1.24 × 10³ ± 189.80 a | 200 |
| Sampling Period | Mean total coliform counts (TC) (cfu/100mL) | Mean total thermotolerant coliform counts (TTC) (cfu/100mL) | Percentage TTC in TC (%) | Faecal Coliform Index (TTC: TC Ratio) |
|---|---|---|---|---|
| Week 1 | 3.77 × 10³ | 2.67 × 10³ | 70.86 | 0.71 |
| Week 2 | 6.07 × 10³ | 3.80 × 10³ | 62.55 | 0.63 |
| Week 3 | 6.20 × 10³ | 4.80 × 10³ | 77.42 | 0.77 |
| Week 4 | 3.05 × 10³ | 1.96 × 10³ | 64.51 | 0.65 |
| Week 5 | 2.32 × 10³ | 1.24 × 10³ | 53.55 | 0.54 |
© 2011 by the authors; licensee MDPI, Basel, Switzerland This article is an open-access article distributed under the terms and conditions of the Creative Commons Attribution license (http://creativecommons.org/licenses/by/3.0/).
Share and Cite
Kolawole, O.M.; Ajayi, K.T.; Olayemi, A.B.; Okoh, A.I. Assessment of Water Quality in Asa River (Nigeria) and Its Indigenous Clarias gariepinus Fish. Int. J. Environ. Res. Public Health 2011, 8, 4332-4352. https://0-doi-org.brum.beds.ac.uk/10.3390/ijerph8114332
Kolawole OM, Ajayi KT, Olayemi AB, Okoh AI. Assessment of Water Quality in Asa River (Nigeria) and Its Indigenous Clarias gariepinus Fish. International Journal of Environmental Research and Public Health. 2011; 8(11):4332-4352. https://0-doi-org.brum.beds.ac.uk/10.3390/ijerph8114332
Chicago/Turabian StyleKolawole, Olatunji M., Kolawole T. Ajayi, Albert B. Olayemi, and Anthony I. Okoh. 2011. "Assessment of Water Quality in Asa River (Nigeria) and Its Indigenous Clarias gariepinus Fish" International Journal of Environmental Research and Public Health 8, no. 11: 4332-4352. https://0-doi-org.brum.beds.ac.uk/10.3390/ijerph8114332