Long Term Variations of the Atmospheric Air Pollutants in Istanbul City

Abstract
:1. Introduction
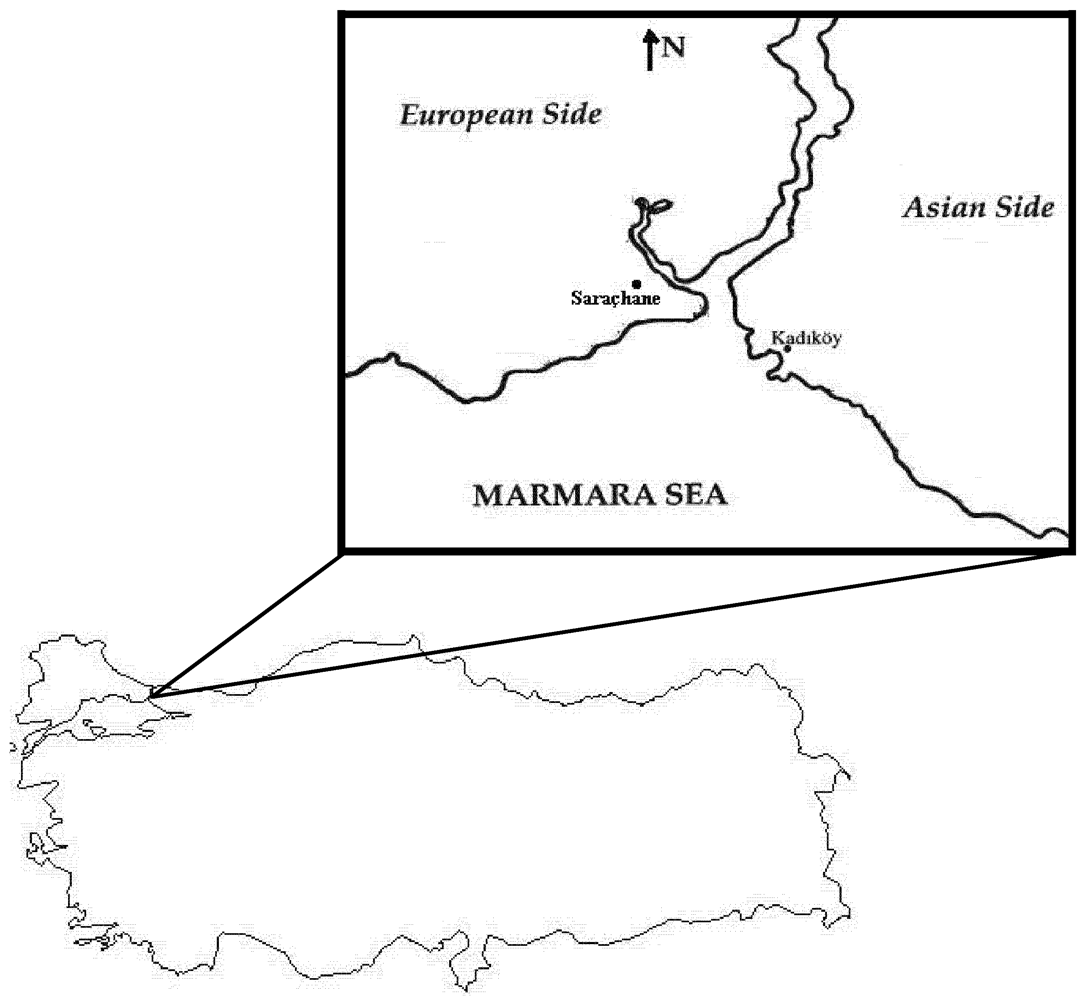
2. Methodology

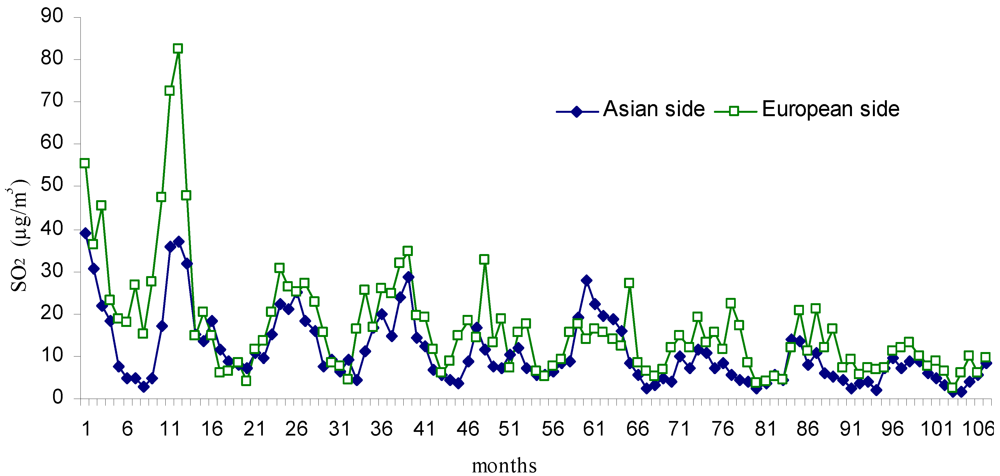
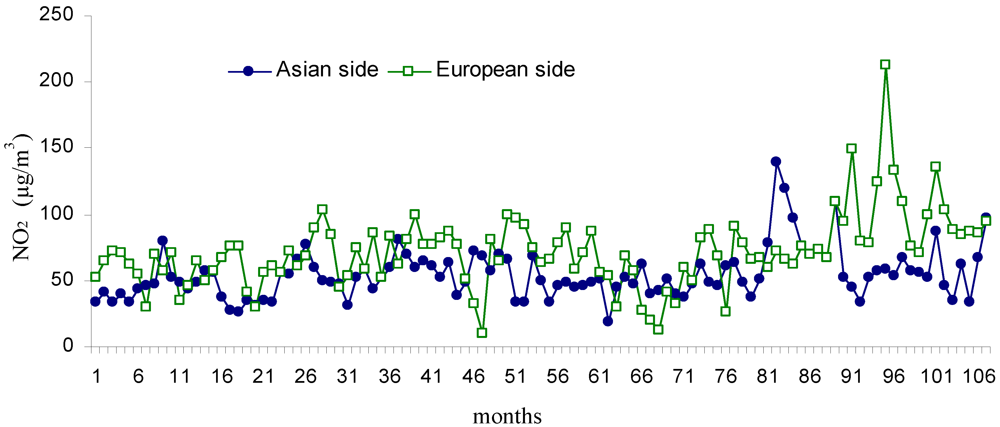
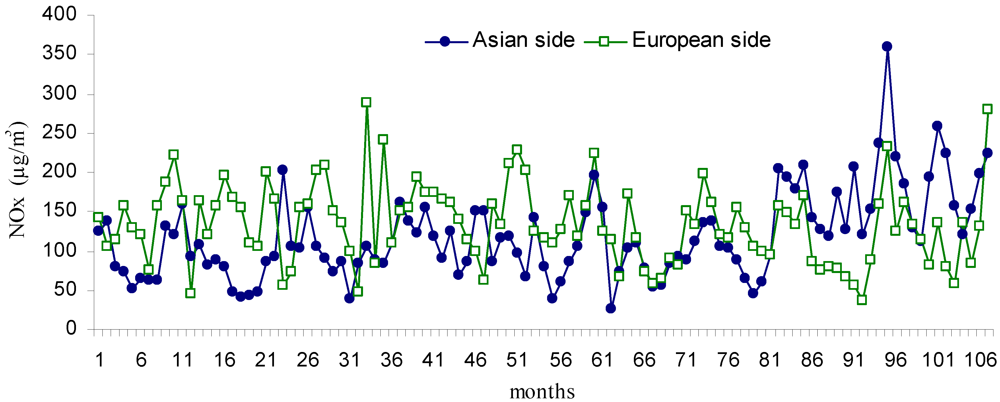
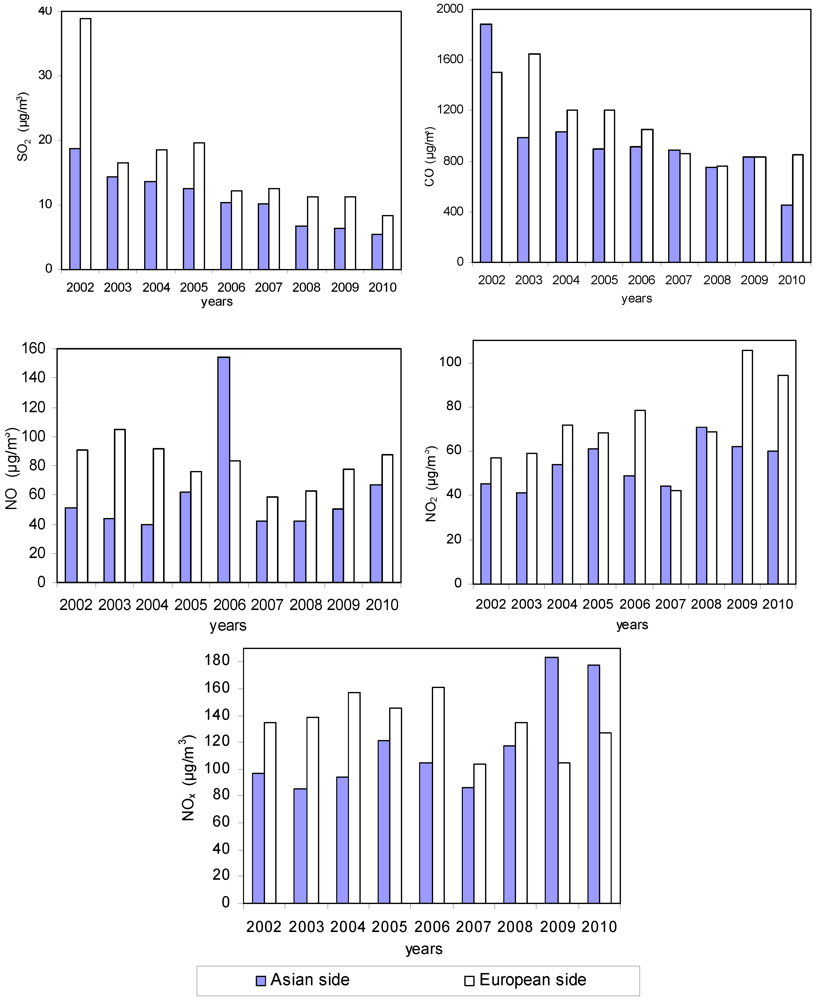
3. Results and Discussion


| Pollutant | National (Turkish) Standards [26] | EPA Standards [27] |
|---|---|---|
| Sulphurdioxide (SO2) | 150 µg/m3 (LBV) a | 80 µg/m3 (annual arithmetic mean) |
| 400 µg/m3 (SBV) b | 365 µg/m3 (24 h average) | |
| Carbonmonoxide (CO) | 10 mg/m3 (LBV) | 10 mg/m3 (8 h average) |
| 30 mg/m3 (SBV) | 40 mg/m3 (1 h average) | |
| Nitrogendioxide (NO2) | 100 µg/m3 (LBV) | 100 µg/m3 (annual arithmetic mean) |
| 300 µg/m3 (SBV) |
4. Conclusions
Acknowledgments
Conflict of Interest
References
- Wang, J.; Da, L.; Song, K.; Li, B.L. Temporal variations of surface water quality in urban, suburban and rural areas during rapid urbanization in Shanghai, China. Environ. Pollut. 2008, 152, 387–393. [Google Scholar] [CrossRef]
- Atash, F. The deterioration of urban environments in developing countries: Mitigating the air pollution crisis in Tehran, Iran. Cities 2007, 24, 399–409. [Google Scholar]
- Reddy, M.S.; Venkataraman, C. Inventory of aerosol and sulphur dioxide emissions from India: I-Fossil fuel combustion. Atmos. Environ. 2002, 36, 677–697. [Google Scholar]
- Soleimani, M.; Bassi, A.; Margaritis, A. Biodesulfurization of refractory organic sulfur compounds in fossil fuels. Biotechnol. Adv. 2007, 25, 570–596. [Google Scholar]
- Bhanarkar, A.D.; Rao, P.S.; Gajghate, D.G.; Nema, P. Inventory of SO2, PM and toxic metals emissions from industrial sources in Greater Mumbai, India. Atmos. Environ. 2005, 39, 3851–3864. [Google Scholar]
- Bignal, K.L.; Ashmore, M.R.; Headley, A.D. Effects of air pollution from road transport on growth and physiology of six transplanted bryophyte species. Environ. Pollut. 2008, 156, 332–340. [Google Scholar]
- Atımtay, A.T. Investigation of air quality in closed parking garages in Ankara. In Proceedings of the 2nd International Symposium on Air Quality Management at Urban Regional and Global Scales, Istanbul, Turkey, 25–28 September 2001; pp. 220–227.
- Bueno-Lopez, A.; Garcia-Garcia, A. Combined SO2 and NOx removal at moderate temperature by a dual bed of potassium-containing coal-pellets and calcium-containing pellets. Fuel Process. Technol. 2005, 86, 1745–1759. [Google Scholar]
- Hordijk, L.; Kroeze, C. Integrated assessment models for acid rain. Eur. J. Oper. Res. 1997, 102, 405–417. [Google Scholar]
- Menz, F.C.; Seip, H.M. Acid rain in Europe and the United States: An update. Environ. Sci. Policy 2007, 7, 253–265. [Google Scholar]
- Kraft, M.; Eikmann, T.; Kappos, A.; Kunzli, N.; Rapp, R.; Schneider, K.; Seitz, H.; Voss, J.U.; Wichmann, H.E. The German view: Effects of nitrogen dioxide on human health derivation of healthrelated short-term and long-term values. Int. J. Hyg. Environ. Health 2005, 208, 305–318. [Google Scholar]
- Curtis, L.; Rea, W.; Smith-Willis, P.; Fenyves, E.; Pan, Y. Adverse health effects of outdoor air pollutants. Environ. Int. 2002, 32, 815–830. [Google Scholar]
- Mavroidis, I.; Chaloulakou, A. Long-term trends of primary and secondary NO2 production in the Athens, variation of the NO2/NOx ratio. Atmos. Environ. 2011, 45, 6872–6879. [Google Scholar]
- Lewne, M.; Cyrys, J.; Meliefste, K.; Hoek, G.; Brauer, M.; Fischer, P.; Gehring, U.; Heinrich, J.; Brunekreef, B.; Bellander, T. Spatial variation in nitrogen dioxide in three European areas. Sci. Total Environ. 2004, 332, 217–230. [Google Scholar]
- Sun, Y.; Wang, L.; Wang, Y.; Quan, L.; Zirui, L. In situ measurements of SO2, NOx, NOy, and O3 in Beijing, China during August 2008. Sci. Total Environ. 2011, 409, 933–940. [Google Scholar]
- Yang, S.; Yuesi, W.; Changchun, Z. Measurement of the vertical profile of atmospheric SO2 during the heating period in Beijing on days of high air pollution. Atmos. Environ. 2009, 43, 468–472. [Google Scholar]
- Aldrin, M.; Haff, I.F. Generalised additive modelling of air pollution, traffic volume and meteorology. Atmos. Environ. 2005, 39, 2145–2155. [Google Scholar]
- Finkelstein, M.M.; Jerrett, M.; Sears, M.R. Traffic air pollution and mortality rate advancement periods. Am. J. Epidemiol. 2004, 160, 173–177. [Google Scholar]
- Allen, R.W.; Davies, H.; Cohen, M.A.; Mallach, G.; Kaufman, J.D.; Adar, S.D. The spatial relationship between traffic-generated air pollution and noise in 2 U.S. cities. Environ. Res. 2009, 109, 334–342. [Google Scholar] [CrossRef]
- Tonne, C.; Melly, S.; Mittleman, M.; Coull, B.; Goldberg, R.; Schwartz, J. A case-control analysis of exposure to traffic and acute myocardial infarction. Environ. Health Perspect. 2007, 115, 53–57. [Google Scholar]
- Tayanc, M. An assessment of spatial and temporal variation of sulfur dioxide levels over Istanbul, Turkey. Environ. Pollut. 2000, 107, 61–69. [Google Scholar]
- Akkoyunlu, A. Erturk Evaluation of air pollution trends in İstanbul. Int. J. Environ. Pollut. 2002, 18, 388–398. [Google Scholar] [CrossRef]
- Onkal-Engin, G.; Demir, İ.; Hiz, H. Assessment of urban air quality in Istanbul using fuzzy synthetic evaluation. Atmos. Environ. 2004, 38, 3809–3815. [Google Scholar] [CrossRef]
- Kurt, A.; Gulbagci, F.; Karaca, F.; Alagha, O. An online air pollution forecasting system using neural Networks. Environ. Int. 2008, 34, 592–598. [Google Scholar]
- TUIK. Turkish Statistical Institute. Available online: http://www.turkstat.gov.tr (accessed on 16 February 2012).
- Industrial based air pollution control regulation. In Turkish Official Gazette; Turkey, 2009; No. 27277.
- EPA-U.S. Environmental Protection Agency, A Guide to Air Quality and Your Health, Air Quality Index; EPA-454/ R-00-005; EPA: Washington, DC, USA, 2000.
© 2012 by the authors; licensee MDPI, Basel, Switzerland. This article is an open-access article distributed under the terms and conditions of the Creative Commons Attribution license (http://creativecommons.org/licenses/by/3.0/).
Share and Cite
Ozcan, H.K. Long Term Variations of the Atmospheric Air Pollutants in Istanbul City. Int. J. Environ. Res. Public Health 2012, 9, 781-790. https://0-doi-org.brum.beds.ac.uk/10.3390/ijerph9030781
Ozcan HK. Long Term Variations of the Atmospheric Air Pollutants in Istanbul City. International Journal of Environmental Research and Public Health. 2012; 9(3):781-790. https://0-doi-org.brum.beds.ac.uk/10.3390/ijerph9030781
Chicago/Turabian StyleOzcan, H. Kurtulus. 2012. "Long Term Variations of the Atmospheric Air Pollutants in Istanbul City" International Journal of Environmental Research and Public Health 9, no. 3: 781-790. https://0-doi-org.brum.beds.ac.uk/10.3390/ijerph9030781